
Abstract
This study developed aluminum (Al) nanocomposites using binary reinforcements as CNTs and titanium nitride (TiN) nanoparticles. On the development of the nanocomposites, the nanoparticles and Al powder were first mixed using a tubular mixer, then compacted, melted in a crucible furnace, and cast. The Al nanocomposites showed optimal reductions in corrosion rate of about 47% in acid and 55% in salt compared to that of the pure Al. While the wear rate decreased from 4.54 × 10⁻⁴ mm³/Nm and 1.12 × 10⁻³ mm³/Nm for the pure Al to 1.8 × 10⁻⁷ mm³/Nm and 3.47 × 10⁻⁶ mm³/Nm for the Al nanocomposite at applied loads of 10 N and 20 N, respectively. The enhanced characteristics of the developed Al nanocomposites were ascribed to the CNTs and TiN, which acted as good self-lubricants and hardening phases for minimizing frictional wear, while they also acted as good anti-corrosion for improving the electrochemical properties.
Introduction
Metal matrix composites (MMCs) are extensively used in transportation, aerospace, and various industries due to their unique combination of physical and mechanical properties, which places importance on the development of composite materials with enhanced corrosion resistance. 1 Aluminum (Al) and its composites are among the most widely used MMCs in the aerospace, construction, and automobile industries due to their electrical and thermal conductivity, electrochemical response, good formability, and lightweight. 2 However, they are significantly limited in components requiring materials with high specific strength, stiffness, and wear resistance. To address the limitations while maintaining the desirable properties of aluminum, its matrices are reinforced with other materials, such as ceramics and carbon-based substances. For instance, ceramic reinforcing particles such as SiC, Al2O3, and ZrSiO4 have been used to improve the properties of Al composites 3 Also, graphene nanosheets 4 and carbon nanotubes (CNTs) 5 have been extensively used in various forms or types to reinforce the Al matrix. These reinforcements, in their binary or ternary compositions, can enhance the mechanical, corrosion resistance, and wear resistance properties of pure Al.
Among the reinforcement particles, CNTs are notable for their high surface area and aspect ratio, which contribute to their exceptional mechanical properties, including stiffness, hardness, and elastic modulus. Researchers have utilized CNTs to reinforce the Al matrix, aiming for uniform dispersion of CNTs, and achieved improved properties.6–8 CNTs, which are among the major allotropes of carbon, are made up of 2D sheets wrapped into spheres called buckyballs and rolled to form cylindrical shapes.9,10 Studies have shown that CNTs possess remarkable properties such as high tensile strength (100 MPa), stiffness (100 GPa), and an elastic modulus of 1 TPa.11,12 Even at elevated temperatures approaching 3000°C, CNTs maintain relatively good thermal stability. 13 Due to these desired properties, CNTs have been extensively used as reinforcements in polymer, ceramic, and metal matrices. Specifically, CNTs have been employed to modify the aluminum matrix by various researchers.14–16
A major limitation of CNTs as a reinforcement material results from the Van der Waals force of attraction, which limits their dispersion and/or bonding in various matrices, resulting in particles’ aggregation. 17 Recent studies have focused on achieving good dispersion and interfacial bonding of CNTs reinforcement with various matrices. It is important to consider the chemistry, atomic arrangement, and interfacial bonding as these are major contributors to the enhanced mechanical properties of composites, facilitating good load transfer tendency between the matrix and the reinforcement(s). 18 During fabrication, it is crucial to avoid the formation of aluminum carbide, which serves as a major inhibitor of load transfer by forming a brittle phase. 19 Jargalsaikhan et al. 20 compared the properties of milled Al-CNTs with those of un-milled Al and un-milled Al-CNT, noting an improvement in the Vickers hardness of the milled Al-CNTs compared to the others. Akbarpour 21 demonstrated that the flaked powder metallurgy method is more effective in dispersing CNTs on the surface of Al particles than the conventional sintering process.
On the other hand, ceramic materials such as titanium carbide 22 and boron carbide 23 have been used as reinforcement phases to improve tribological properties of metallic materials. TiN is another important ceramic-based reinforcement material employed in metal matrix composite development. It is characterized by its high hardness and good electrochemical resistance. The good hardness of the TiN has a significant impact on the hardness of the Al matrix in the development of composites, in turn improving their wear resistance. For instance, Hashemi, Hussain 24 demonstrated an improvement in the wear resistance and a reduction in the coefficient of friction by 45% of the Al/TiN composite when compared to pure Al metal. Although CNTs can also enhance various properties of the Al matrix, poor dispersion of CNTs in the matrix poses challenges to such composites due to stress concentrations and high corrosion attacks around the agglomerates, leading to premature microcracks/propagation when load is applied and an electrochemical test is performed. Therefore, this study developed Al nanocomposites reinforced with hybrid CNTs and TiN nanoparticles with simultaneous enhancements in electrochemical and tribological properties. The objective of the study is to strengthen the Al matrix for high friction/wear resistance, and incorporate more resistance to electrochemical attack on the Al matrix through TiN-assisting the CNTs’ dispersion in the Al matrix by minimizing their walls-to-wall interactions.
Materials and methods
Materials
A 99.9% pure aluminum (Al) powder, measuring 45 µm in particle size and 2.7 gcm3 in density, multiple-walled carbon nanotubes (CNTs) with a purity of over 98% and a diameter ranging from 10 to 30 nm, together with a length of 5 to 20 μm, as well as titanium nitride (TiN) with an assay purity of over 98% and a particle size averaging 100 nm were obtained from Hongwu International Group in China. All the materials were processed as supplied without any additional alterations.
Method
The Al nanocomposites fabrication typically involved weighing the desired powder mass of the Al, CNTs, and TiN to measure out each of the compositions. This was followed by the introduction of the measured proportions of powders into a plastic container. Stainless steel balls were added to the container at a powder-to-ball ratio of 5:1 to facilitate the homogeneous mixture of the powders. The plastic container was sealed and placed on a tubular mixer for 8 h at a speed of 100 rpm. The mixed powders were compacted using a hydraulic press (Powerfist 200C). The compacted samples were melted in a crucible furnace at a temperature set at 700 °C. The molten Al nanocomposites were cast in an already prepared mould and were removed when they cooled to room temperature. In the preparation of the mould used for casting, galvanized pipe was used as a pattern to avoid contamination with sand, as shown in Figure 1. The galvanized pipe was cut and split into halves, which were tied together with binding wire and inserted into the mould box. The bottom and top of the cast Al nanocomposites were cut off and discarded, which might have been contaminated with the sand and atmosphere, respectively. The Al nanocomposites were then cut into different sizes and prepared for various analyses.
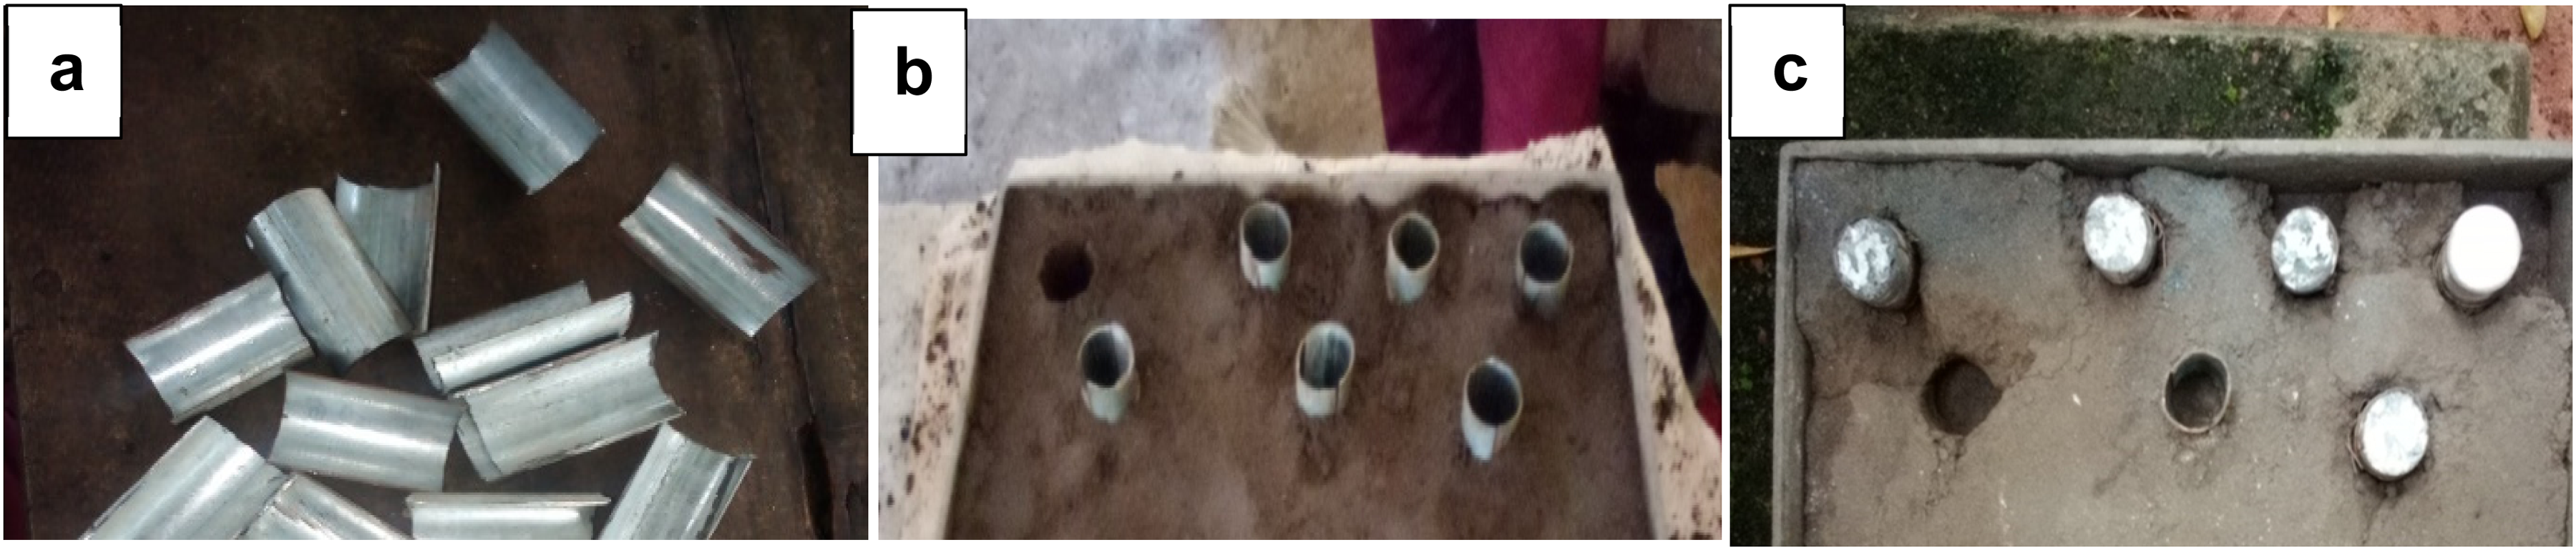
(a) Split galvanized pipe, (b) Prepared mould with the galvanized pipe, and (c) Cast Al nanocomposites.
Characterization and measurement
The crystal structure and microstructure of the materials were analyzed using an X-ray Diffractometer (XRD—Bruker D8, Madison, WI, USA) and a Scanning Electron Microscope (SEM, TESCAN), respectively. Polarization experiments were performed using NOVA software in combination with an Autolab Potentiostat (PGSTAT302N). With a precise scan rate of 0.01 V/s, the potentiodynamic polarization experiment utilized start and stop potentials of −2.0 V and +2.0 V, respectively. The configuration involved the utilization of the test sample as the working electrode, platinum as the counter electrode, and an Ag/AgCl electrode submerged in a KCl solution as the reference electrode. Polarization studies were conducted using two different electrolytes: a 3.5% NaCl solution and a 0.1 M H2SO4 solution. In this study, the Tafel extrapolation method was used to examine the corrosion profile, enabling the determination of important data, including polarization resistance and corrosion rate. In addition, the samples underwent tribological testing using a Tribometer (Anton Paar), with loadings of 10 N and 20 N applied. The counterface used was a stainless steel ball of about 6 mm in diameter. The tribological test ran for 900 s at a speed of 250 rpm. The wear rate was quantified using a profilometer (Surtronic S128) that is linked to the tribometer through the measurement of the profiles of the wear tracks generated by plastic deformation. The wear scars on the samples were observed and recorded using an optical microscope.
Results and discussion
Microstructural investigation
Figure 2 displays the SEM micrographs of the pure Al and Al-CNT-TiN nanocomposites. The SEM image of the pure Al with primarily Al phase showed a relatively uniform microstructure with a dominantly gray phase when compared to the nanocomposite samples. For Al-0.5CNTs-10TiN, the microstructure revealed the presence of CNTs-TiN on the entire SEM image. The Al nanocomposite showed limited clustering of the nanoparticles, suggesting a reasonable dispersion of the reinforcing phases in the Al matrix. The black phase on the micrograph is due to the presence of the CNTs, which are mixed with TiN. The obtained dispersion of the hybrid CNTs-TiN can be credited to the use of a tubular mixer with some stainless steel balls during the mixing of the powders, which ensured appreciable distribution of the reinforcement phases. In addition, the hybrid of carbon and ceramic-based materials contributed to the dispersion as TiN could minimize tube-to-tube interactions of the CNTs, while the CNTs could minimize the stacking of the TiN in the Al matrix. This suggests that the dispersion of carbon-based materials in their host matrix can be improved by incorporating ceramic-based materials. Also, as the concentration of CNTs increased to 1wt% in Al-1CNTs-5TiN, the black phase increased in the morphology of the nanocomposite. However, the black phase was found to be distributed in the entire morphology of the nanocomposite with the presence of the TiN phase, indicating an appreciable distribution of the reinforcement phases in the matrix. This could have facilitated load transmission from the matrix to the reinforcements with improved tribological and electrochemical resistance. However, for Al-1CNTs-10TiN nanocomposite, the microstructure revealed a larger segregation of the hybrid CNTs-TiN in the matrix. This can be attributed to the increase in the total concentration of the CNTs-TiN reinforcement, which results in an inadequate alignment of the reinforcing CNTs within the matrix during the fabrication process.
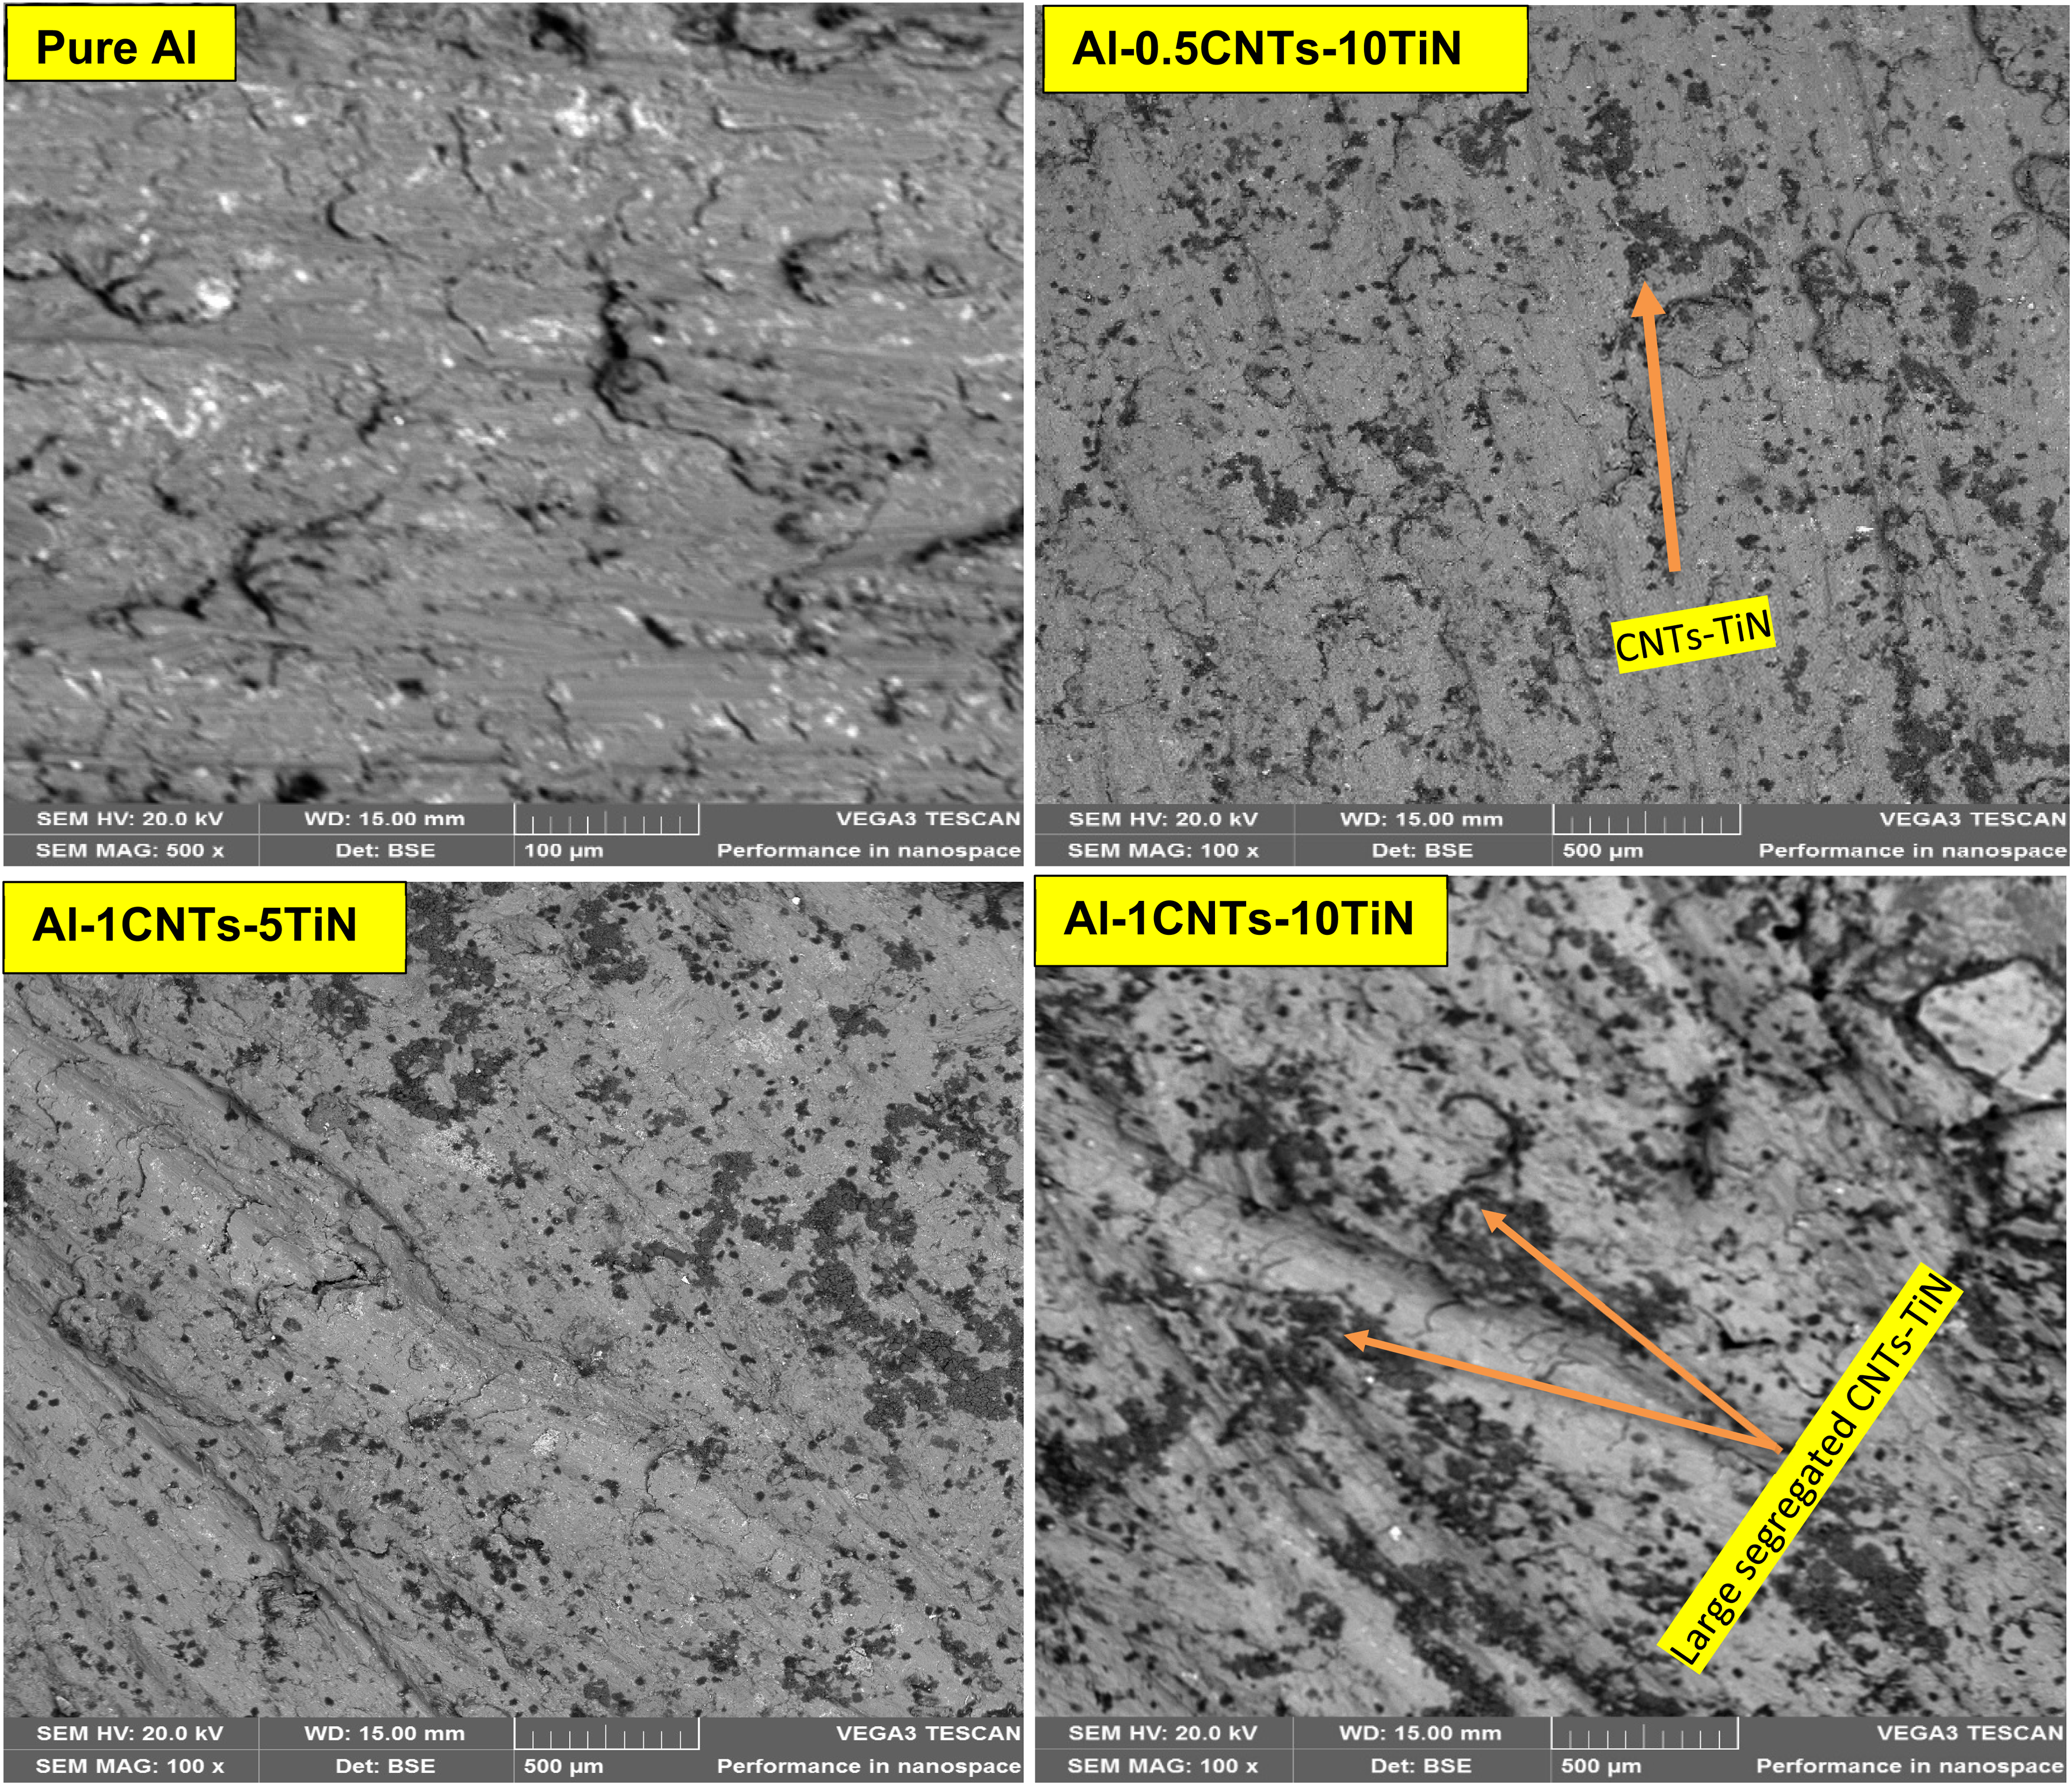
SEM micrographs of the Al nanocomposites.
X-ray diffraction
Figure 3 displays the XRD patterns of the CNTs and TiN nano-reinforcements. The diffraction peaks for the TiN displayed in Figure 3(a) has primary diffraction peaks correspond to crystal planes (111), (200), (220), (311), and (222) at around 2θ = 37°, 43°, 62°, 74°, and 78°, respectively as previously noted by other study conforming to PDF#38-1420. 25 On the other hand, CNTs revealed a major diffraction peak at around 2θ = 26.4°, which corresponds to a crystal plane of (002), and minor diffraction peaks at around 42.5° and 54° with crystal planes of (100) and (004), respectively. 26 These diffraction peaks represent the hexagonal graphitic peaks of the CNTs. The diffraction patterns of the pure Al and Al nanocomposites are shown in Figure 4. The pure Al showed various diffraction peaks (and crystal planes) at around 2θ = 38.7° (111), 44.9° (200), 65.0° (220), 78.2° (311), and 82.5° (222) in line with a previous study by Aliyu et al., 27 which conform to cubic aluminum structure with ICSD card #65-2869. 5 With the introduction of the reinforcing phases, the nanocomposites showed mainly the diffraction peaks of a cubic aluminum phase, since it is the predominant material in the Al-CNTs-TiN nanocomposite formation. However, there are minor diffraction peaks resulting from the inclusion of the reinforcing phases, which occurred at around 2θ = 28.9°, 47.8°, 56.1°, corresponding to the crystal planes of (002), (200), and (220), respectively. The XRD analysis showed that no intermediate compound, such as Al4C3 was formed, which can be attributed to the use of a low content of CNTs that could have resulted in the absence or minimal Al4C3 formation, with the XRD analysis unable to detect it. 4 Hence, there is no potential formation of brittle phase within the aluminum nanocomposites, thereby maintaining the ductility of the matrix. Therefore, the strengthening mechanism of the nanocomposites against wear is mainly due to strengthening mechanisms such as dislocation, grain refinement, 28 mechanical locking of the matrix, and minimal detachment of materials caused by the hybrid CNTs and TiN. The enhanced electrochemical resistance can be found in the area of individual good resistance to chemical attack of the nanocomposite's constituents.
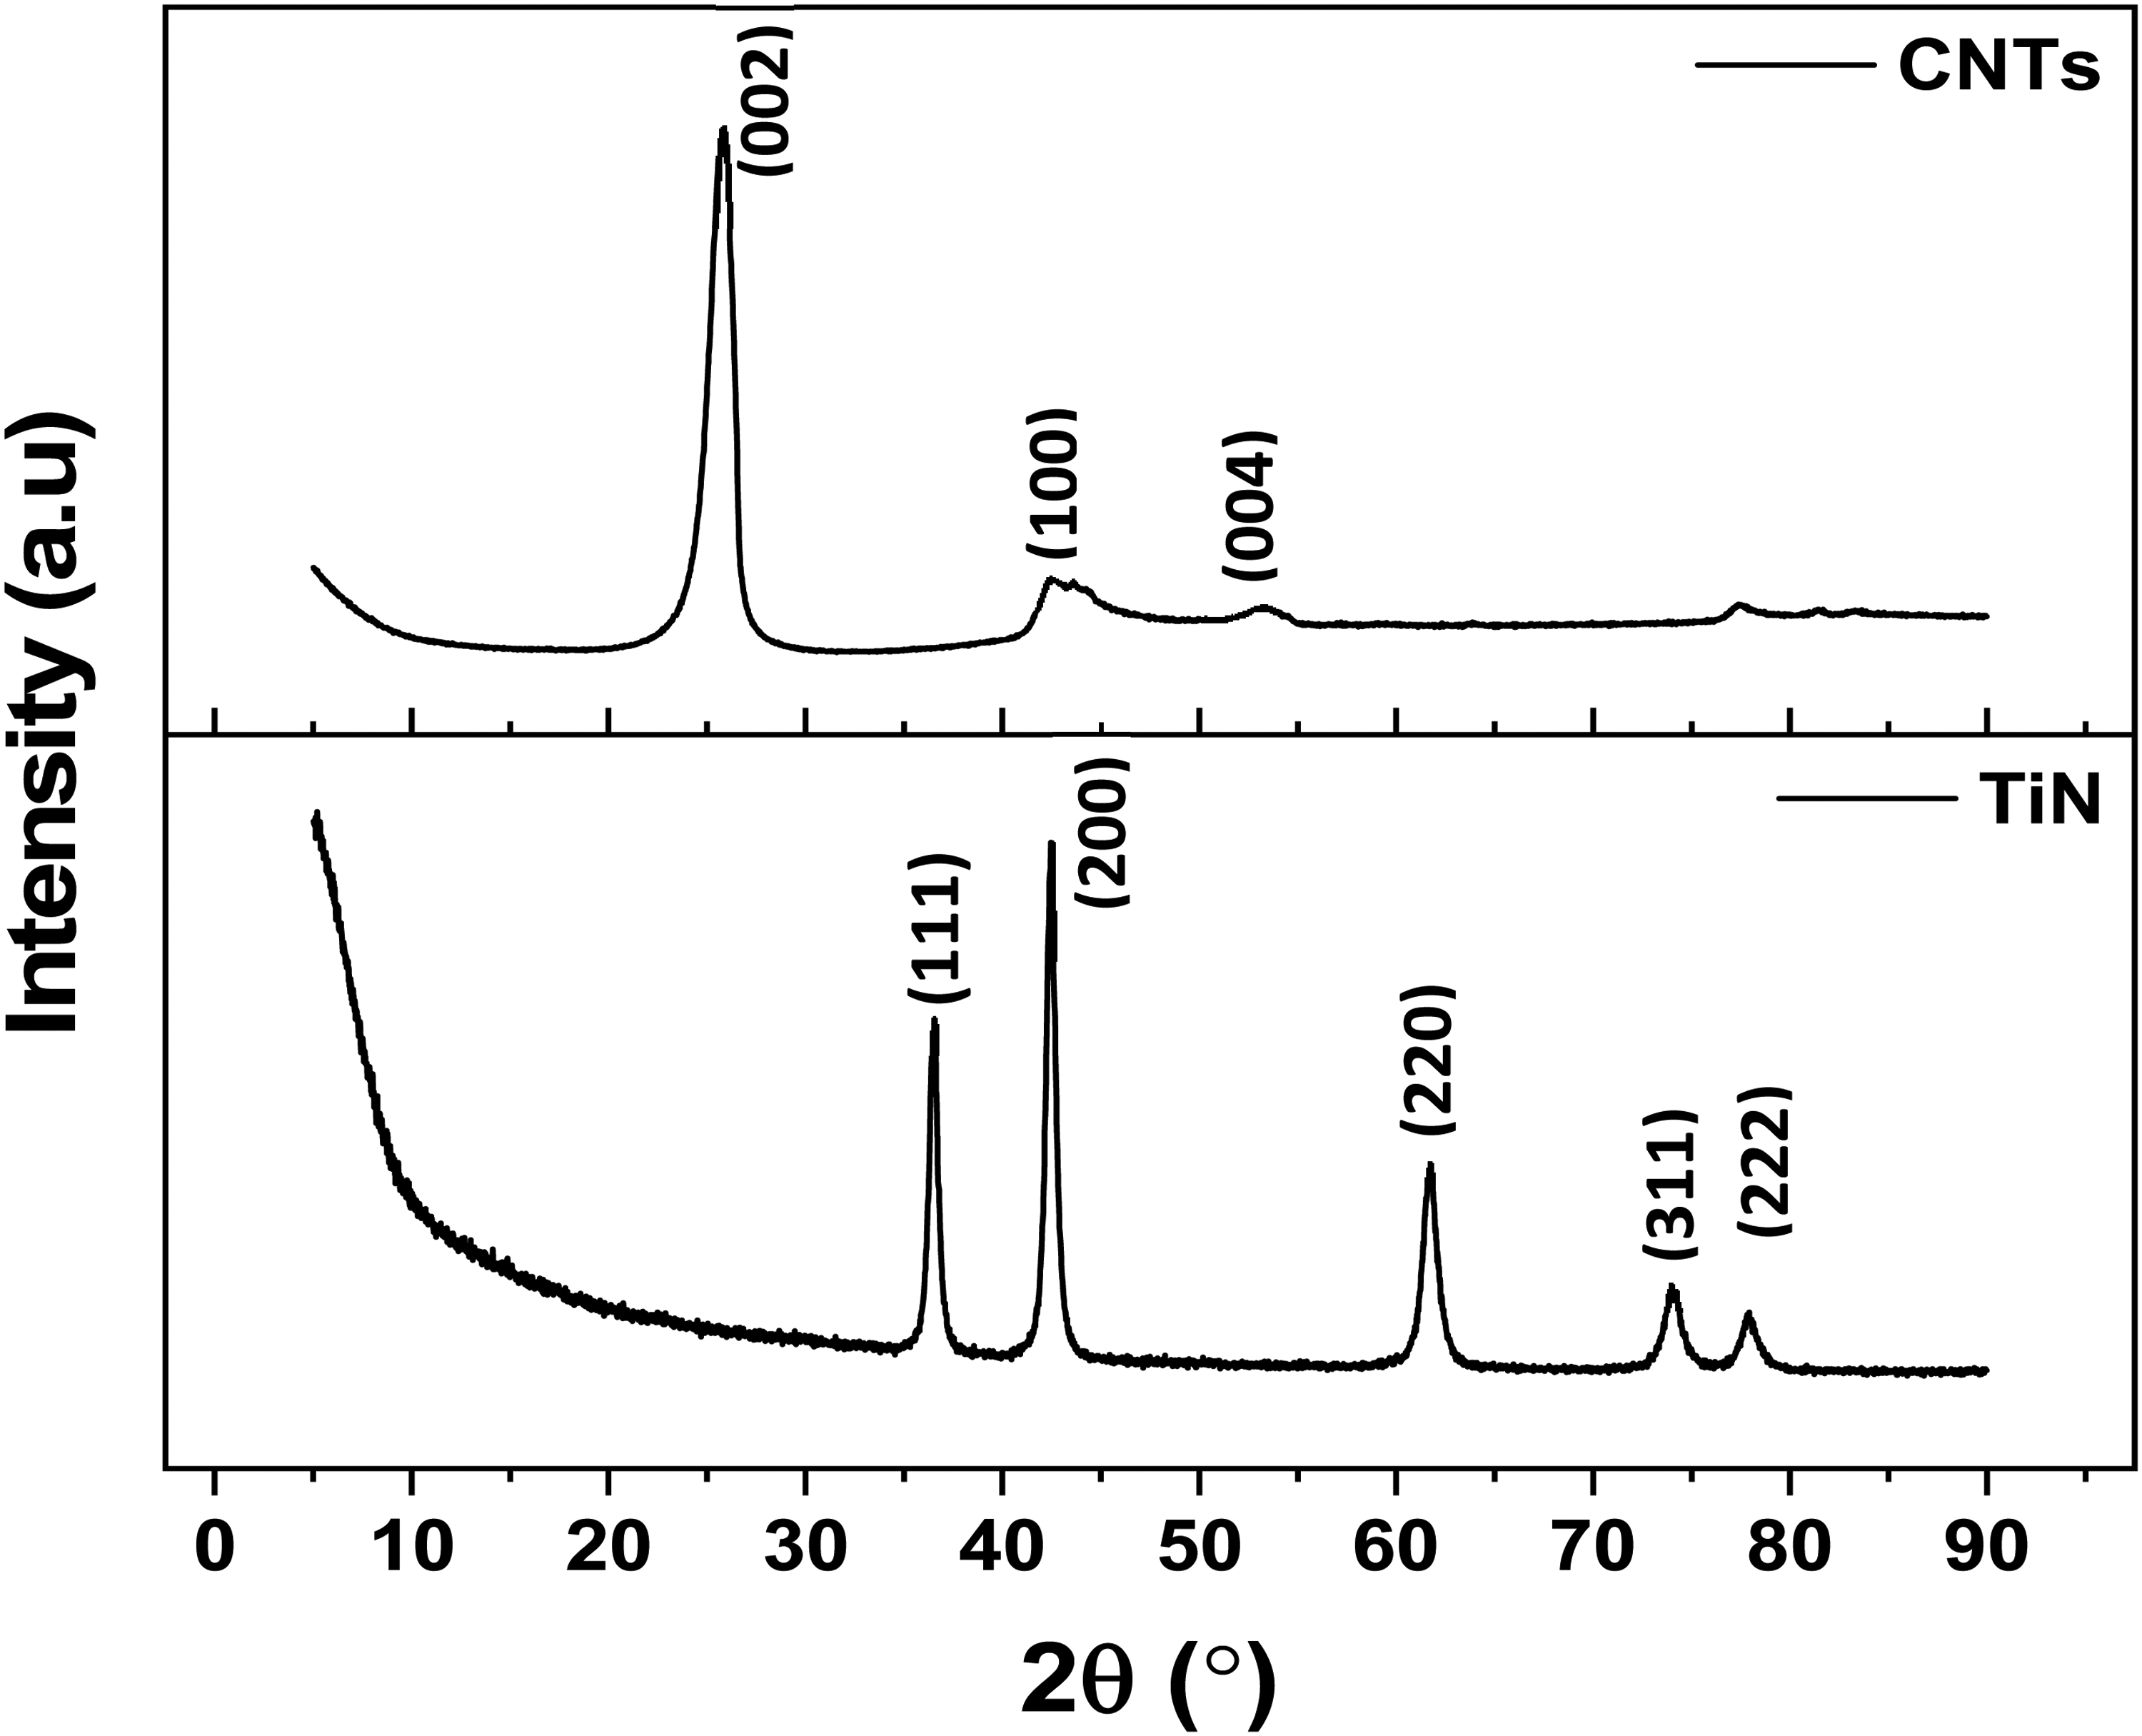
XRD plots CNTs and TiN nanoparticles.
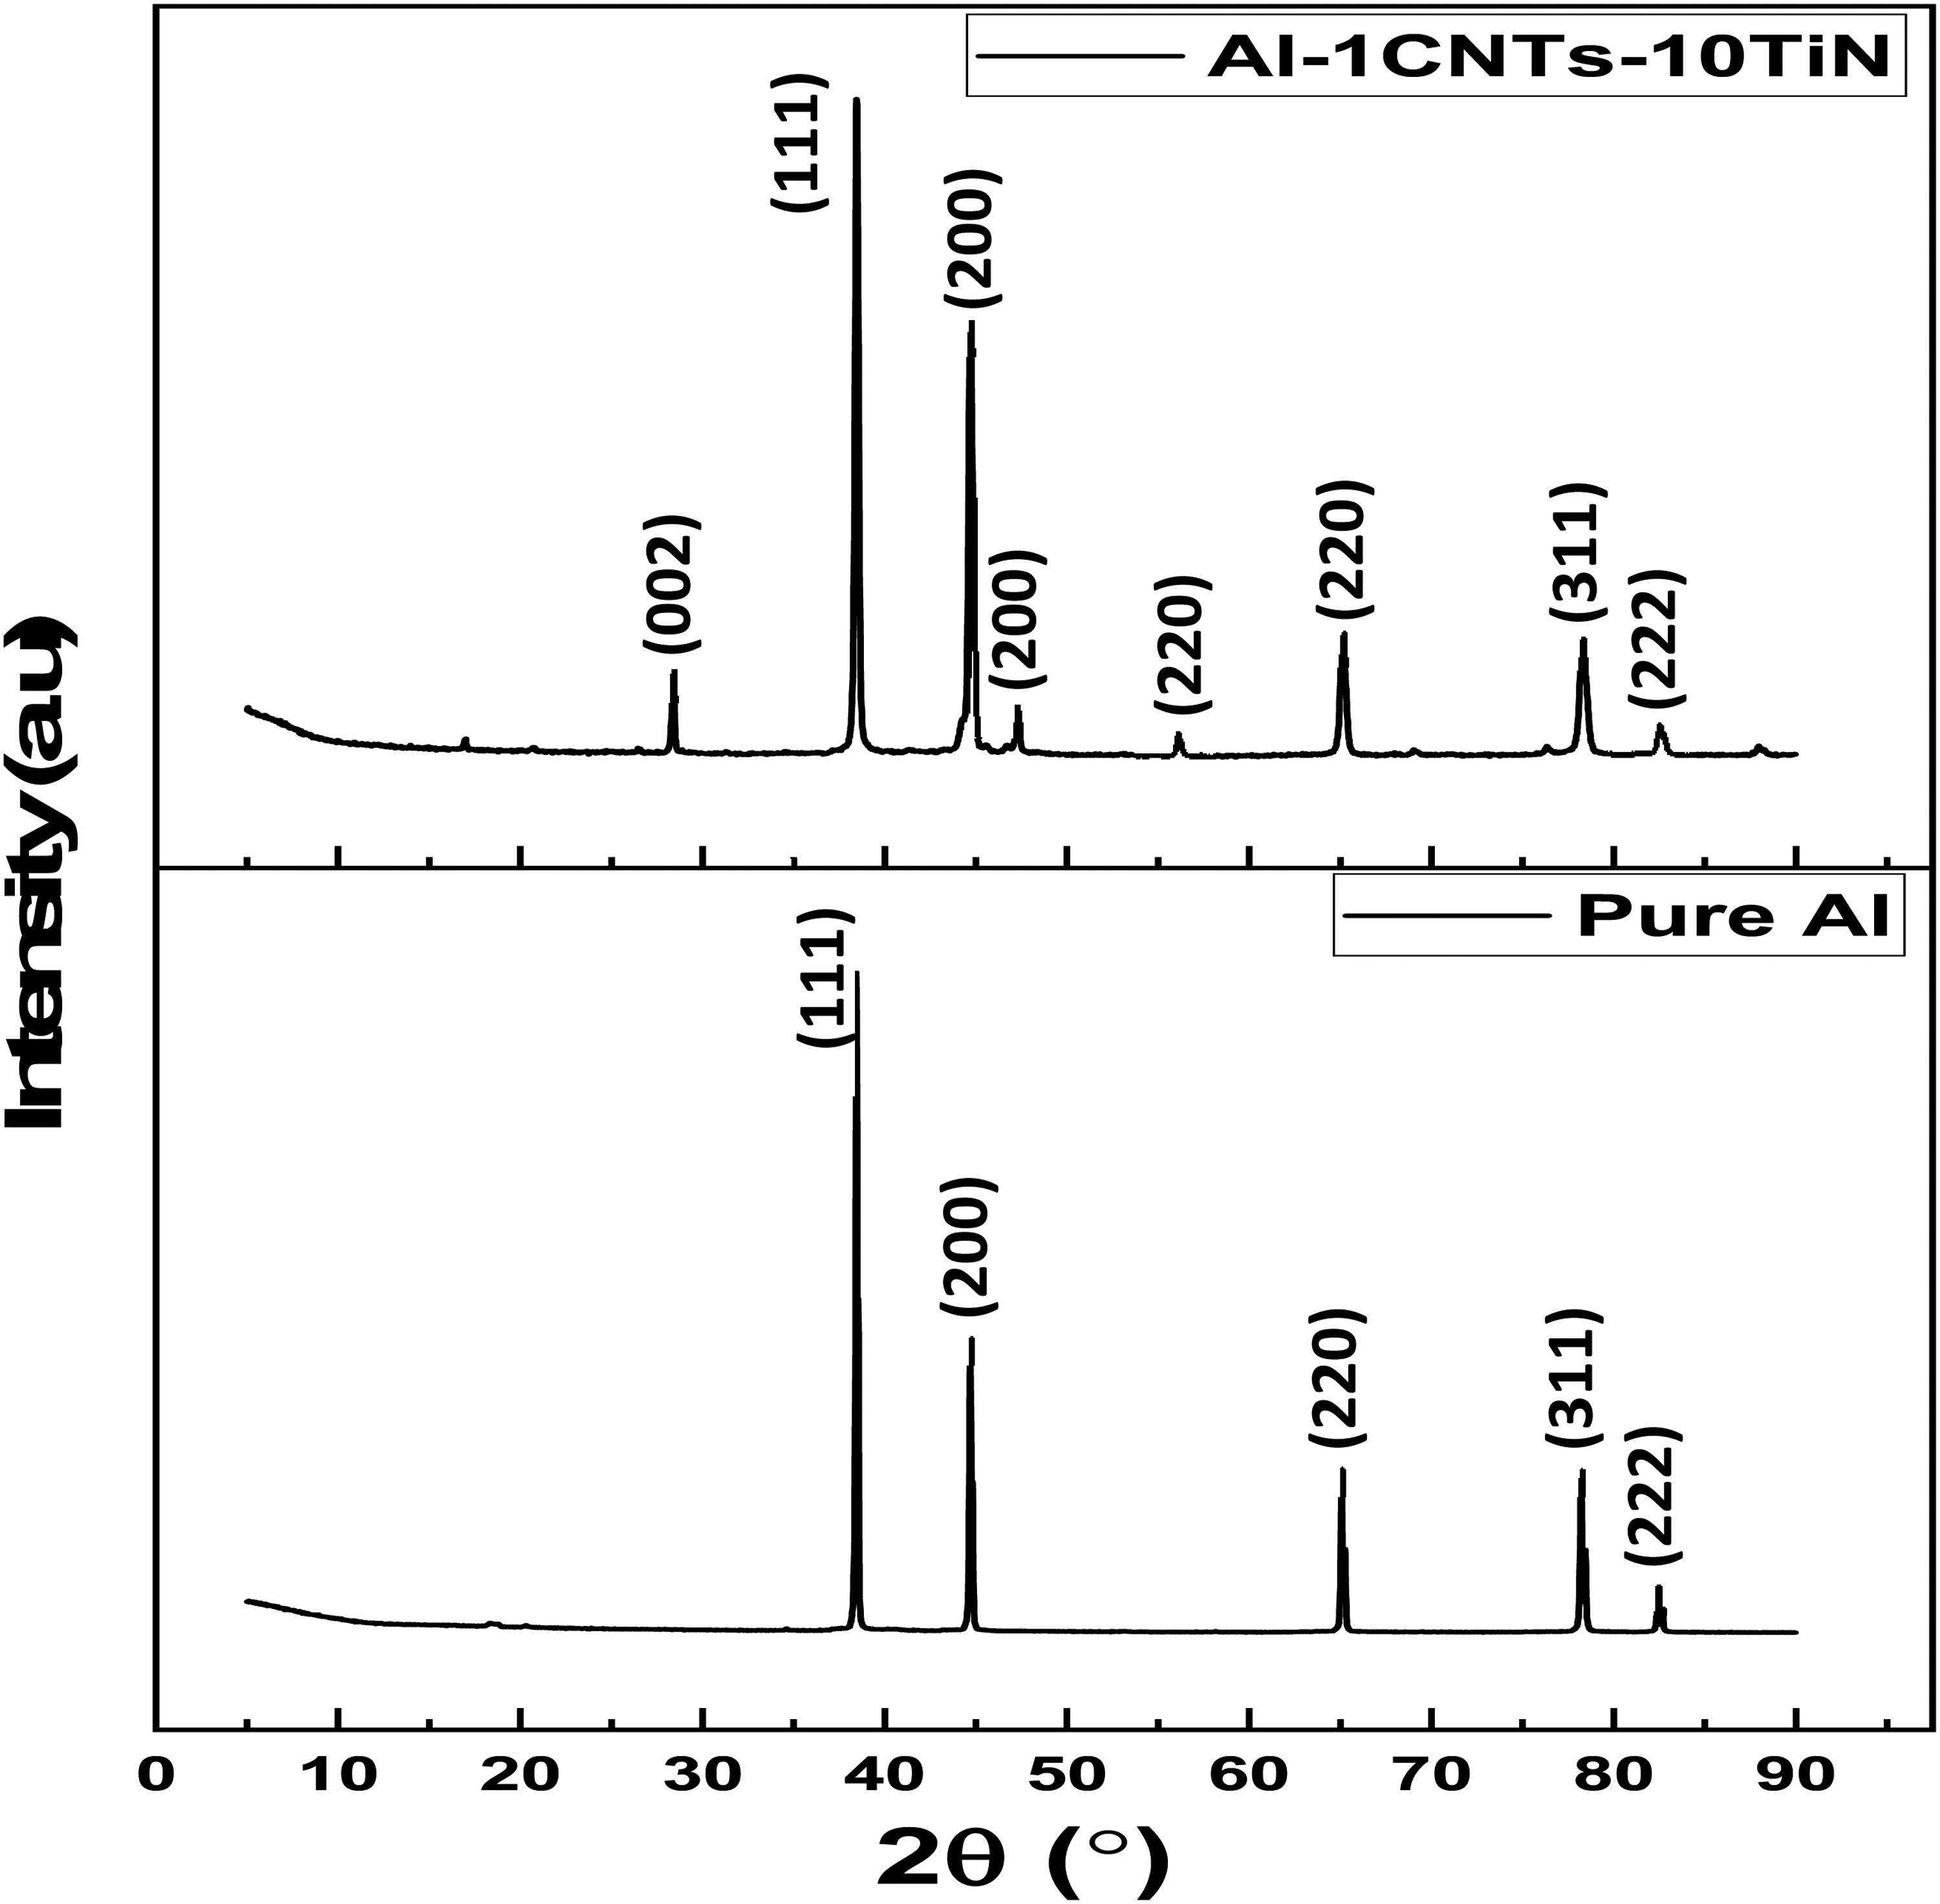
XRD plots of the pure Al and Al nanocomposite.
Electrochemical properties
Open circuit potential
The plots of open circuit potential (OCP) against exposition time for the fabricated pure Al and Al nanocomposites in acidic and salt medium are shown in Figure 5. The OCP demonstrates the initial instability of the samples and increasing corrosion susceptibility with a longer exposition time. As time progresses, the potentials stabilize, likely due to the formation of protective layers on the surfaces of the samples, which limit further deterioration. Figure 5 reveals that samples containing CNT-TiN reinforcements exhibit the best stability with higher potentials in both media. Since corrosion resistance is partly dependent on the potential, which improves as the potential increases, it implies that Al nanocomposites have the best corrosion resistance compared to pure Al, with Al-0.5CNTs-10TiN showing the optimal resistance to corrosion.
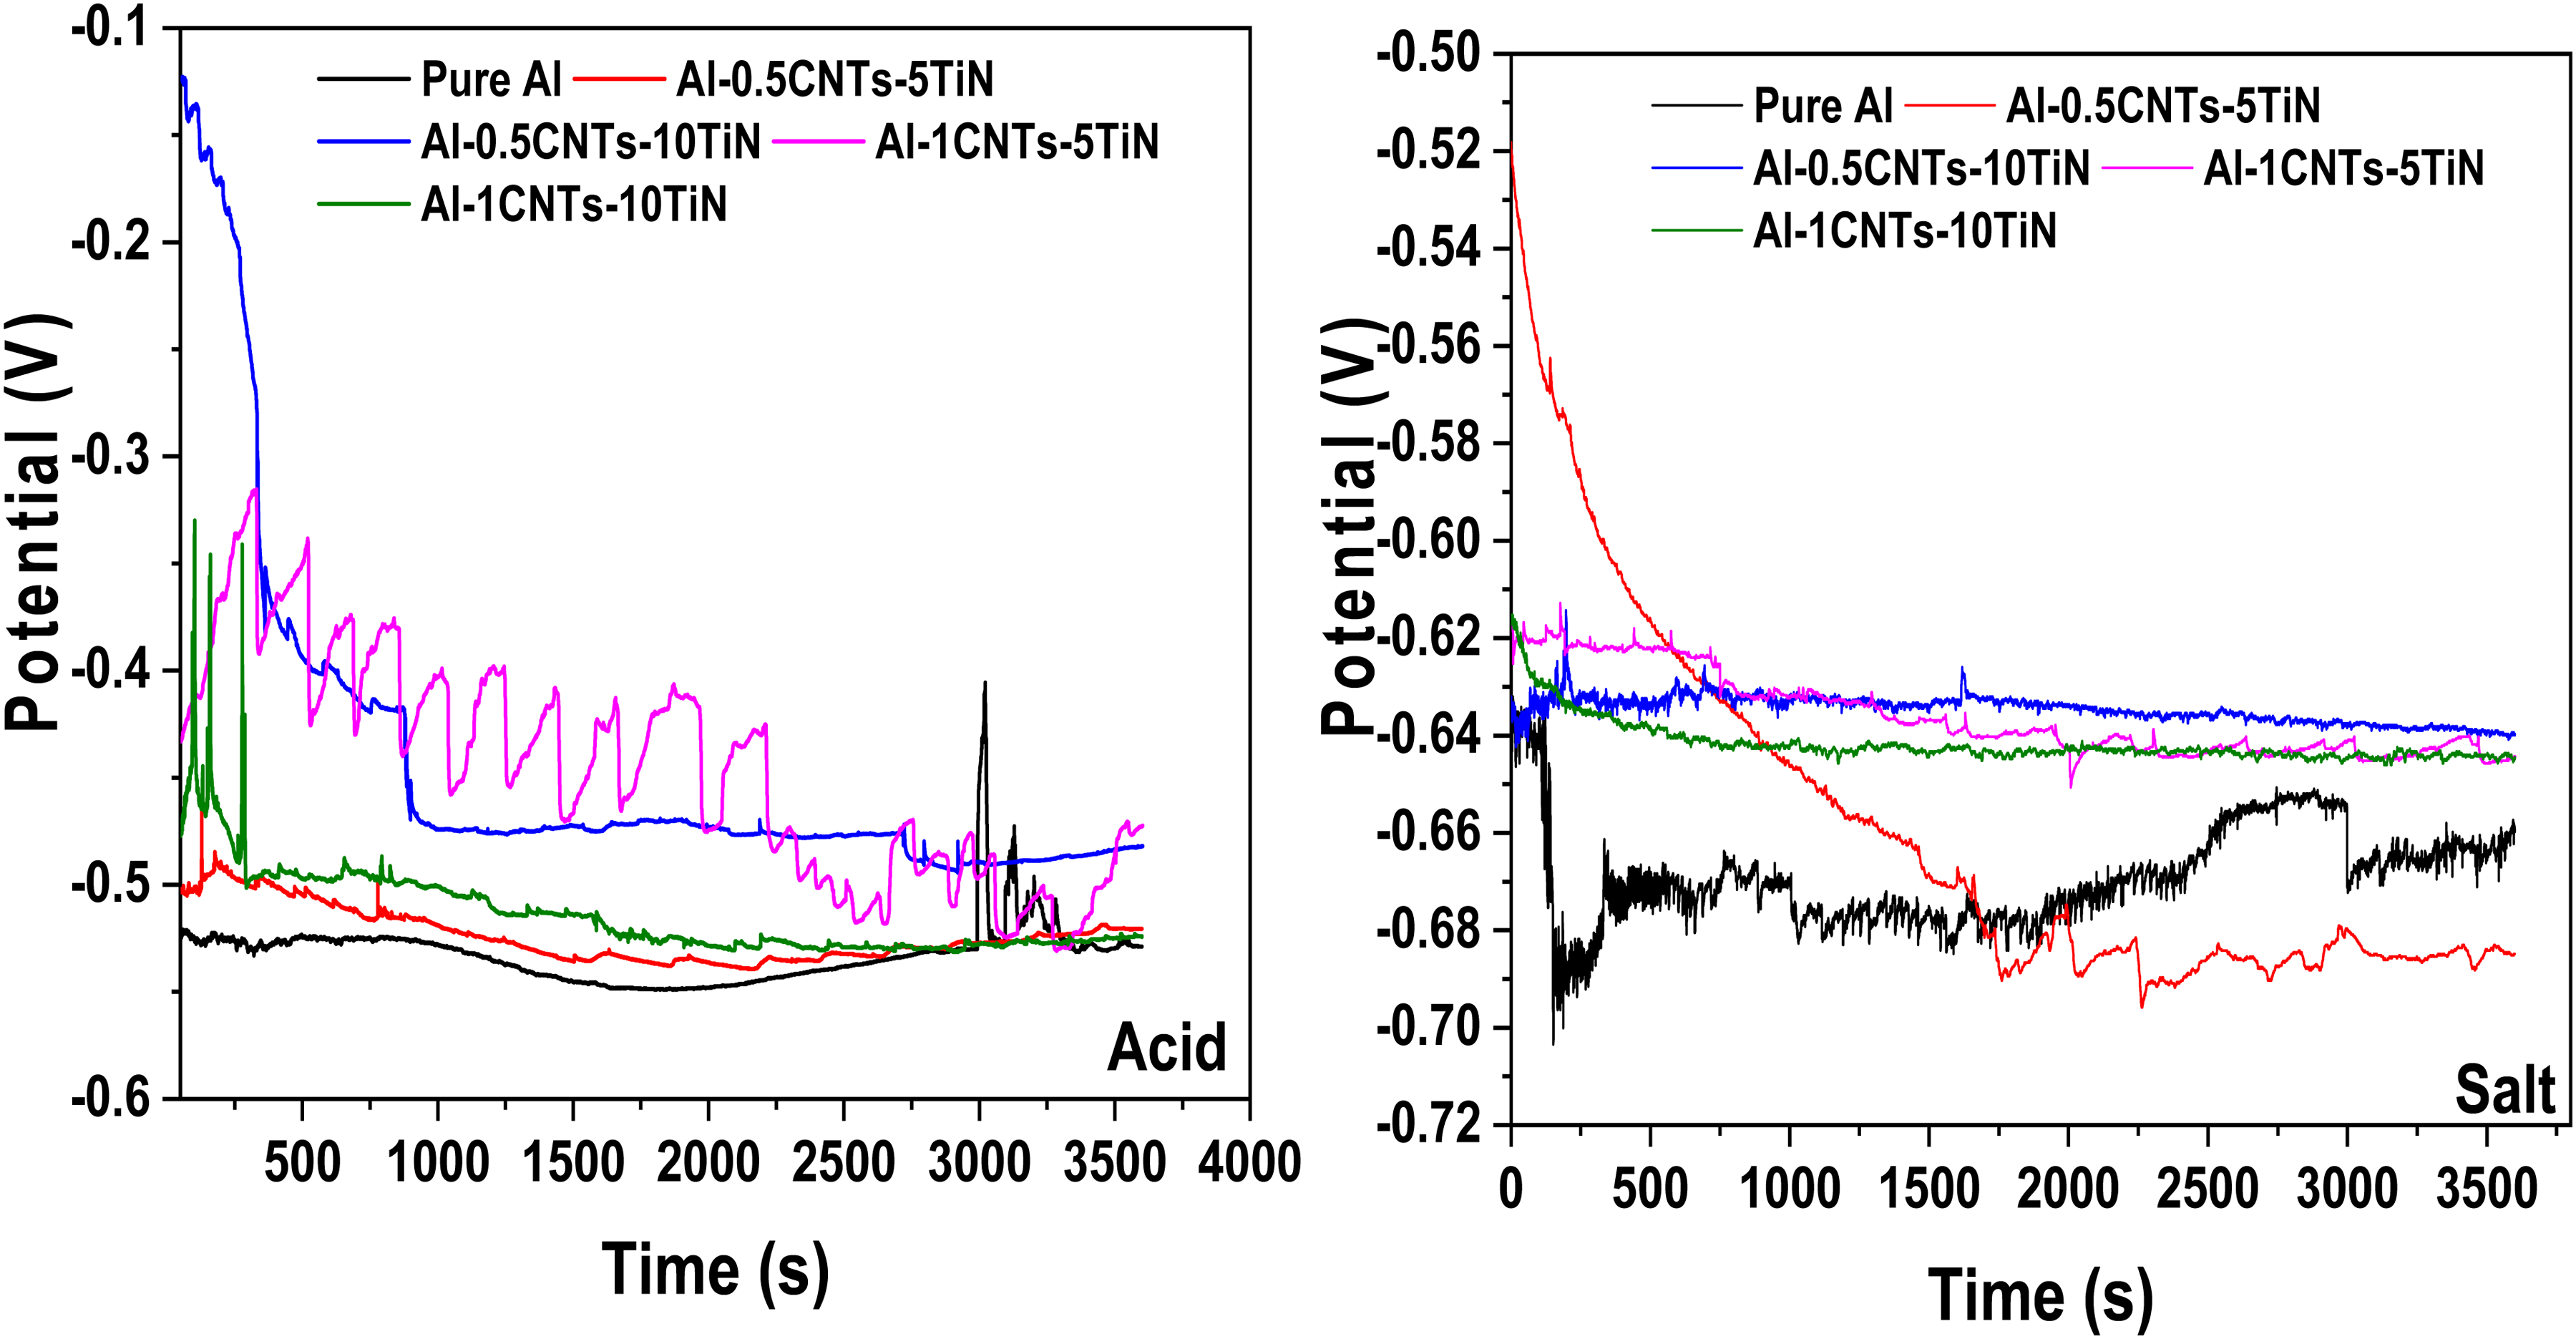
Open circuit potential of the Al nanocomposites in acid and salt medium.
Potentiodynamic polarization (PDP)
Figure 6 displays the potentiodynamic polarization (PDP) curves of pure Al and Al-CNT-TiN nanocomposites in acidic and salt environments. The polarization resistance and corrosion rate (Figure 7) were evaluated using potentiodynamic polarization from TAFEL parameters. It is known that low corrosion current and high corrosion potential of a material suggest more corrosion resistance, 29 which the developed nanocomposites exhibited. The PDP curves in the acidic environment were similar, illustrating that these samples exhibit comparable electrochemical behaviors. Al-based materials have the potential for passive corrosion, where such materials produce protective layers during corrosion, which minimize further corrosion of the materials. Therefore, the pure Al and its nanocomposites developed showed minimal corrosion rate as presented in Figure 7. For instance, optimal reduction in corrosion rate was obtained as 2.7841 mm/yr and 2.9042 mm/yr in acid medium for Al-0.5CNTs-10TiN and Al-1CNTs-5TiN nanocomposites, respectively. Also, the corrosion rate is 0.3992 mm/yr and 0.4785 mm/yr in salt medium for Al-1CNTs-5TiN and Al-0.5CNTs-10TiN nanocomposites, respectively. In contrast, higher corrosion rates of about 5.2478 mm/yr and 0.8865 mm/yr were recorded for the pure Al in acid and salt media. This shows that the nanocomposites have optimal reductions in corrosion rate of about 47% and 55% for Al-0.5CNTs-10TiN and Al-1CNTs-5TiN compared to that of the pure Al in acid and salt media, respectively. The optimal reduction in corrosion rate of the Al-0.5CNTs-10TiN nanocomposite can be related to its microstructure as depicted in Figure 2, where the nanocomposite showed more uniform morphology and dispersion of the reinforcement particles compared to other Al nanocomposite samples. On the other hand, as the total concentration of CNTs-TiN increased in Al-1CNTs-10TiN, possible segregation of the particles started in the Al matrix as revealed by the SEM micrograph in Figure 2, hence resulting in the observed higher corrosion rate of the nanocomposite compared to other developed Al nanocomposites in this study. This could be due to possible high corrosion attack at the segregated particles regions in the Al matrix due to localized chemical attack, which demonstrates the essential contribution of the uniform reinforcement distribution in promoting corrosion resistance. In general, the enhanced corrosion resistance of Al-CNTs-TiN nanocomposites is attributed to the presence of CNTs and TiN, which are known for their good electrochemical resistance properties. However, TiN has a more positive impact on the corrosion resistance of composites as previously reported. 30 It can also be observed that nanocomposite samples in acidic medium (Figure 6) showed relatively higher potential, which demonstrates lower corrosion susceptibility in an acidic environment. However, their corrosion rate is higher compared to that of the salt medium, indicating a high loss rate of the nanocomposite material in acidic medium. While the lower potential of the Al nanocomposites in the salt medium may be due to aggressive attacks by chloride ions, which deplete the protective oxides of Al. 30
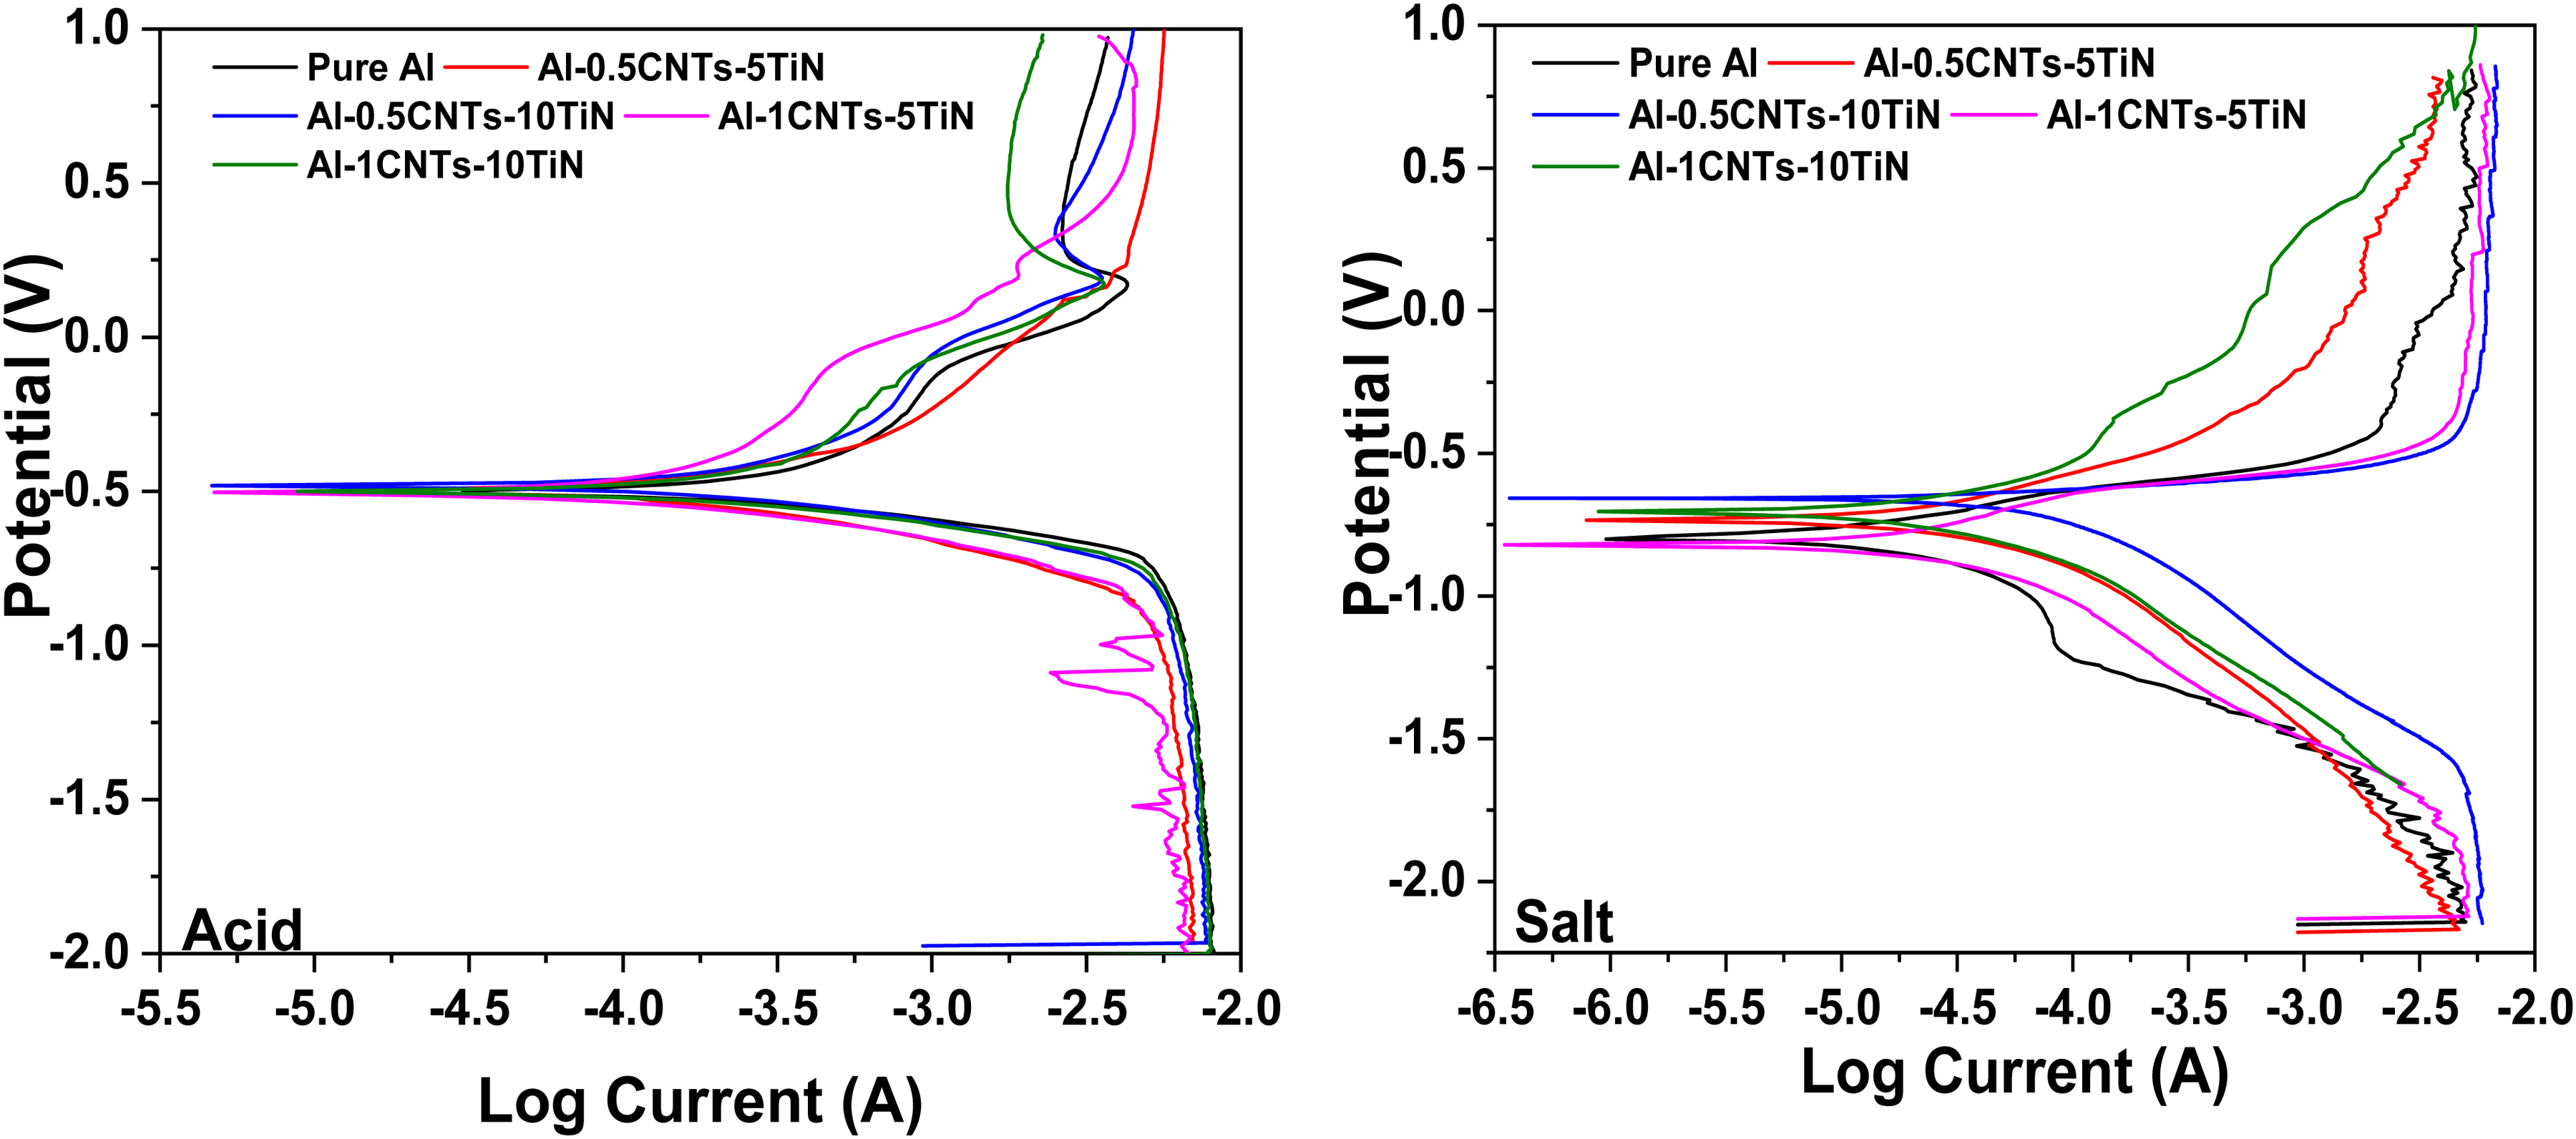
Potentiodynamic polarization of the Al nanocomposites in acid and salt medium.
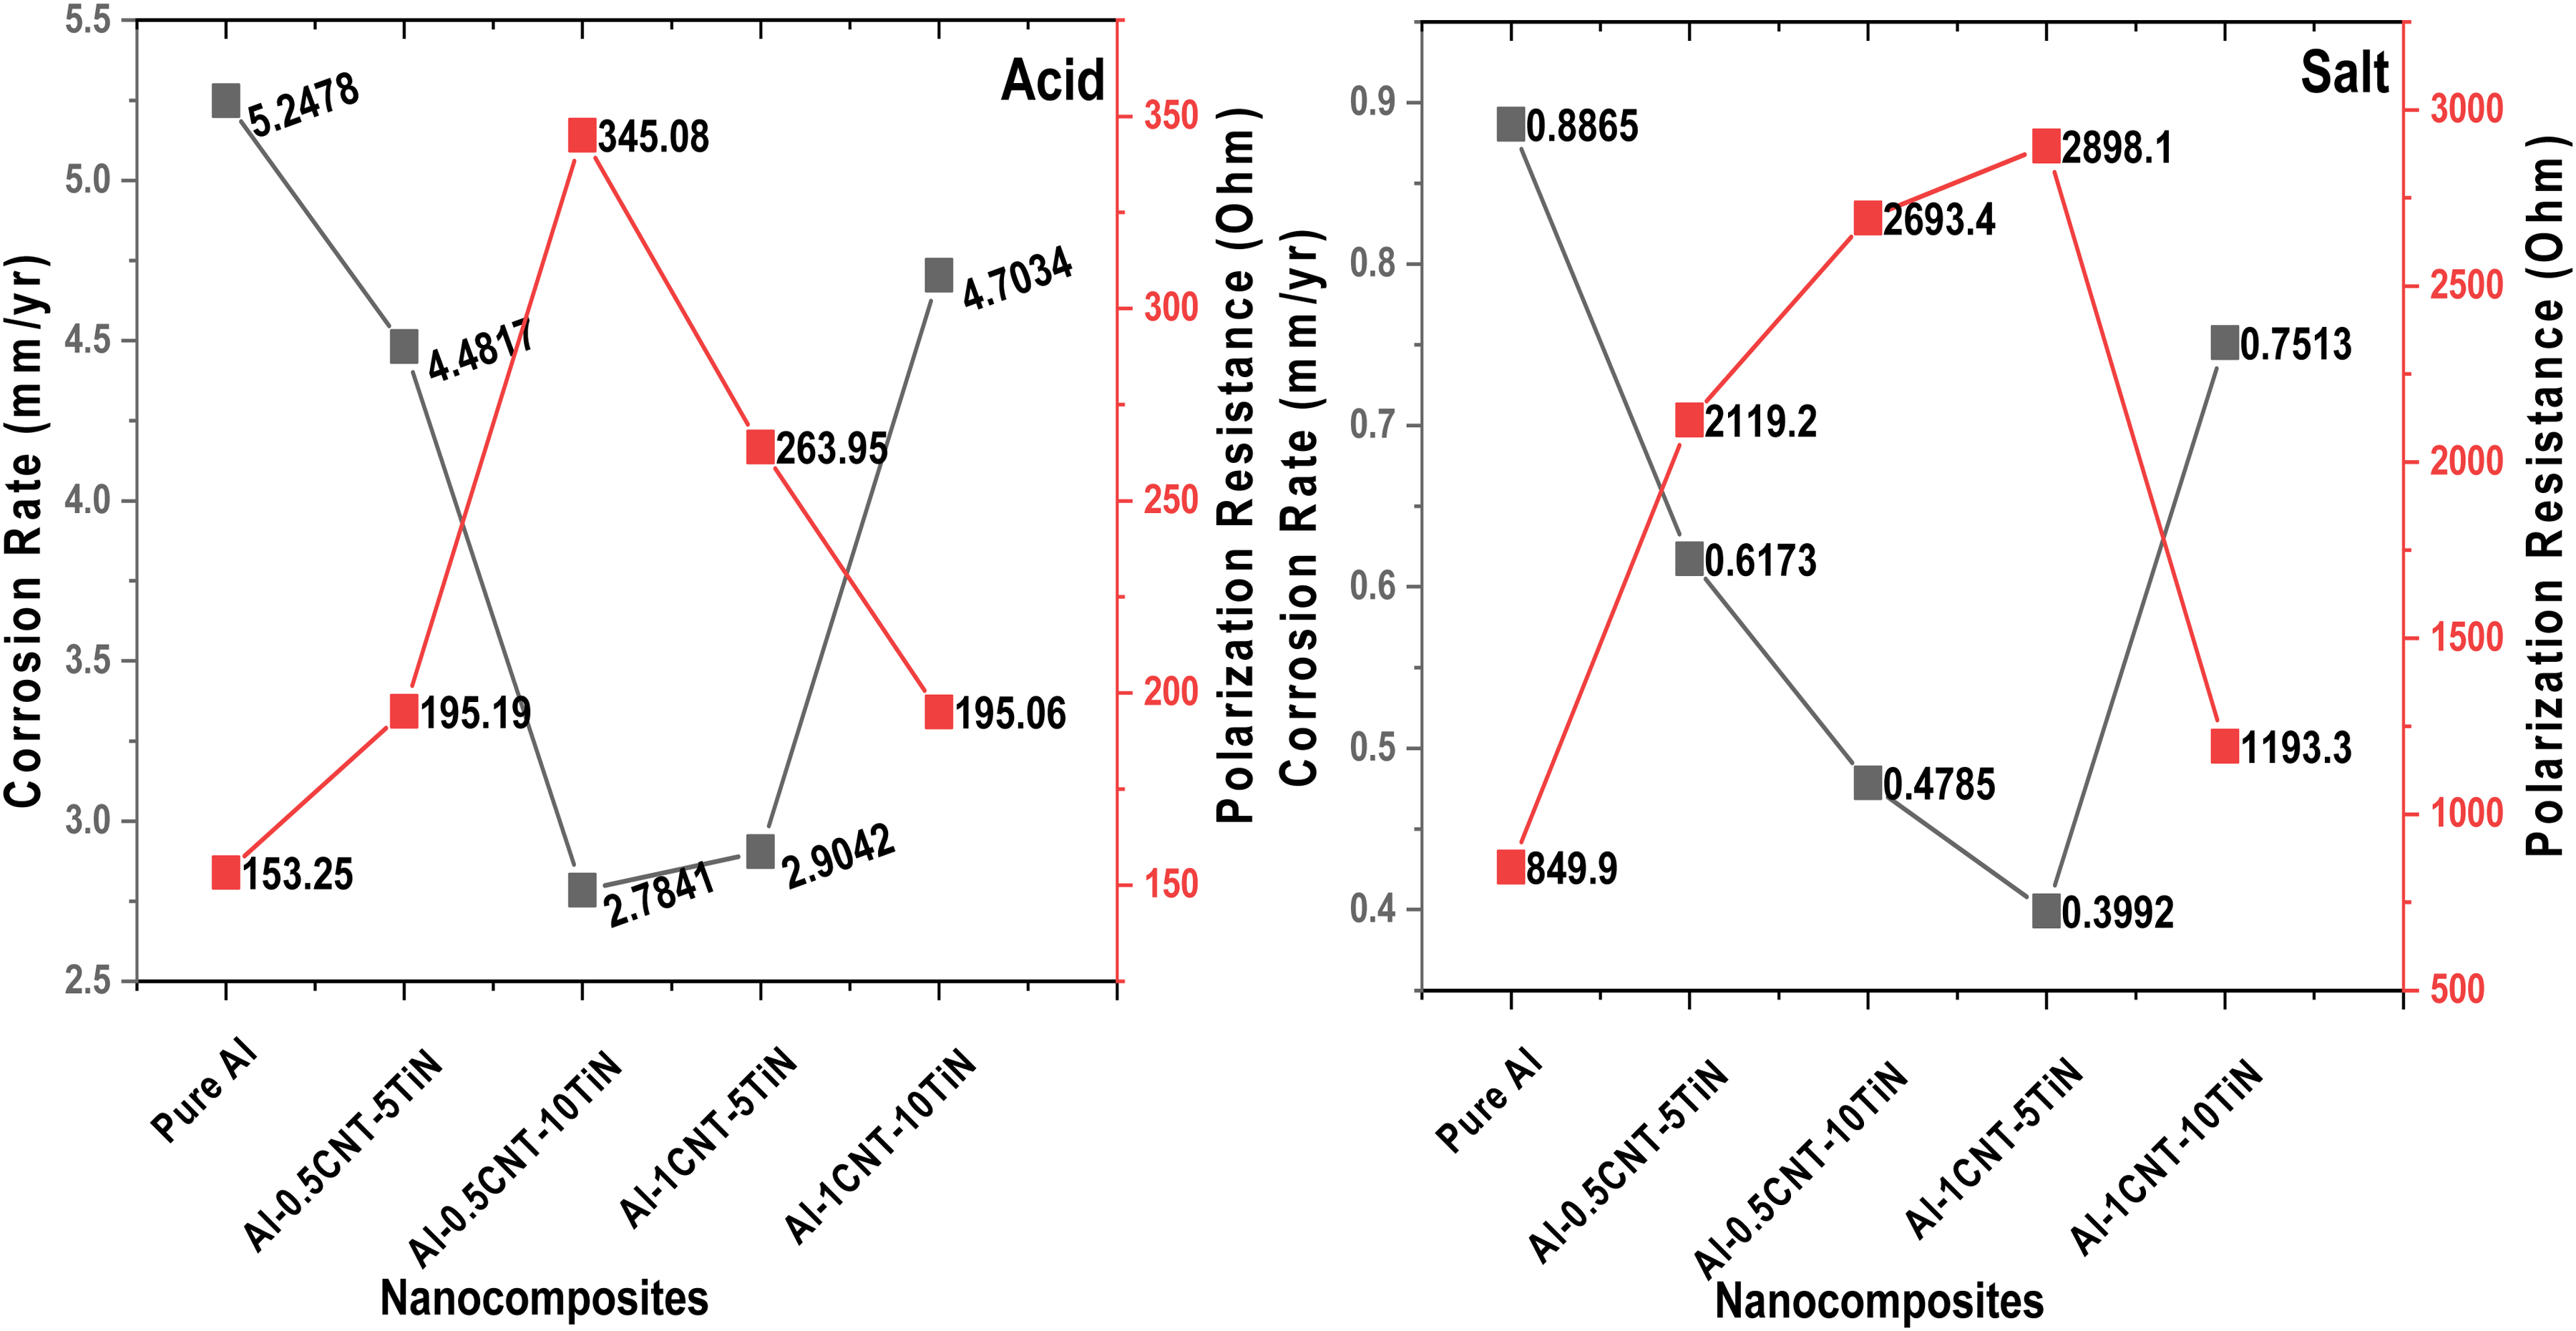
Corrosion rate and polarization resistance of the Al nanocomposites.
Tribological properties
Coefficient of friction
Figure 8 shows the coefficient of friction (CoF) and worn-off surfaces of the fabricated Al nanocomposites at a 10N applied load. Addition of CNTs-TiN to the Al matrix reduced the CoF relative to the pure Al, suggesting that the reinforcing phases act as self-lubricating agents, thereby reducing resistance to frictional forces. CNTs are known for their good self-lubricating properties due to their large aspect ratios,31,32 while TiN has a high hardness and strongly resists wearing forces. 33 To ensure optimal resistance to wear, it is crucial to achieve good dispersion of CNTs and TiN particles in the Al matrix. This dispersion accounts for the differences in CoF among the developed Al nanocomposites. The plot of CoF against time shows that the nanocomposite samples composed of Al-0.5CNTs-10TiN and Al-1CNTs-5TiN yield the lowest CoF as exposure time increases, which can be credited to their appreciable uniform microstructure as revealed by the SEM micrographs in Figure 2. In general, all the nanocomposites showed low CoF compared to the pure Al, confirming improvement in the wear properties of the developed Al nanocomposites. The wear tracks of the samples in Figure 8 reveal that the materials loss from the surfaces of the Al nanocomposites is less pronounced, with the samples containing Al-0.5CNTs-10TiN and Al-1CNTs-5TiN showing the minimum formation of grooves. Also, Figure 9 shows the CoF and the corresponding wear tracks of the nanocomposite samples at a 20N applied load. The CoF behavior of the samples are similar to that observed for a 10 N applied load in Figure 8. However, worn scars on the nanocomposite samples at 20 N are larger compared to those at 10 N applied load, which can be attributed to the increment in the load since this can result to increase in the resistance of the ball to sliding with an increase in the worn-off surface.
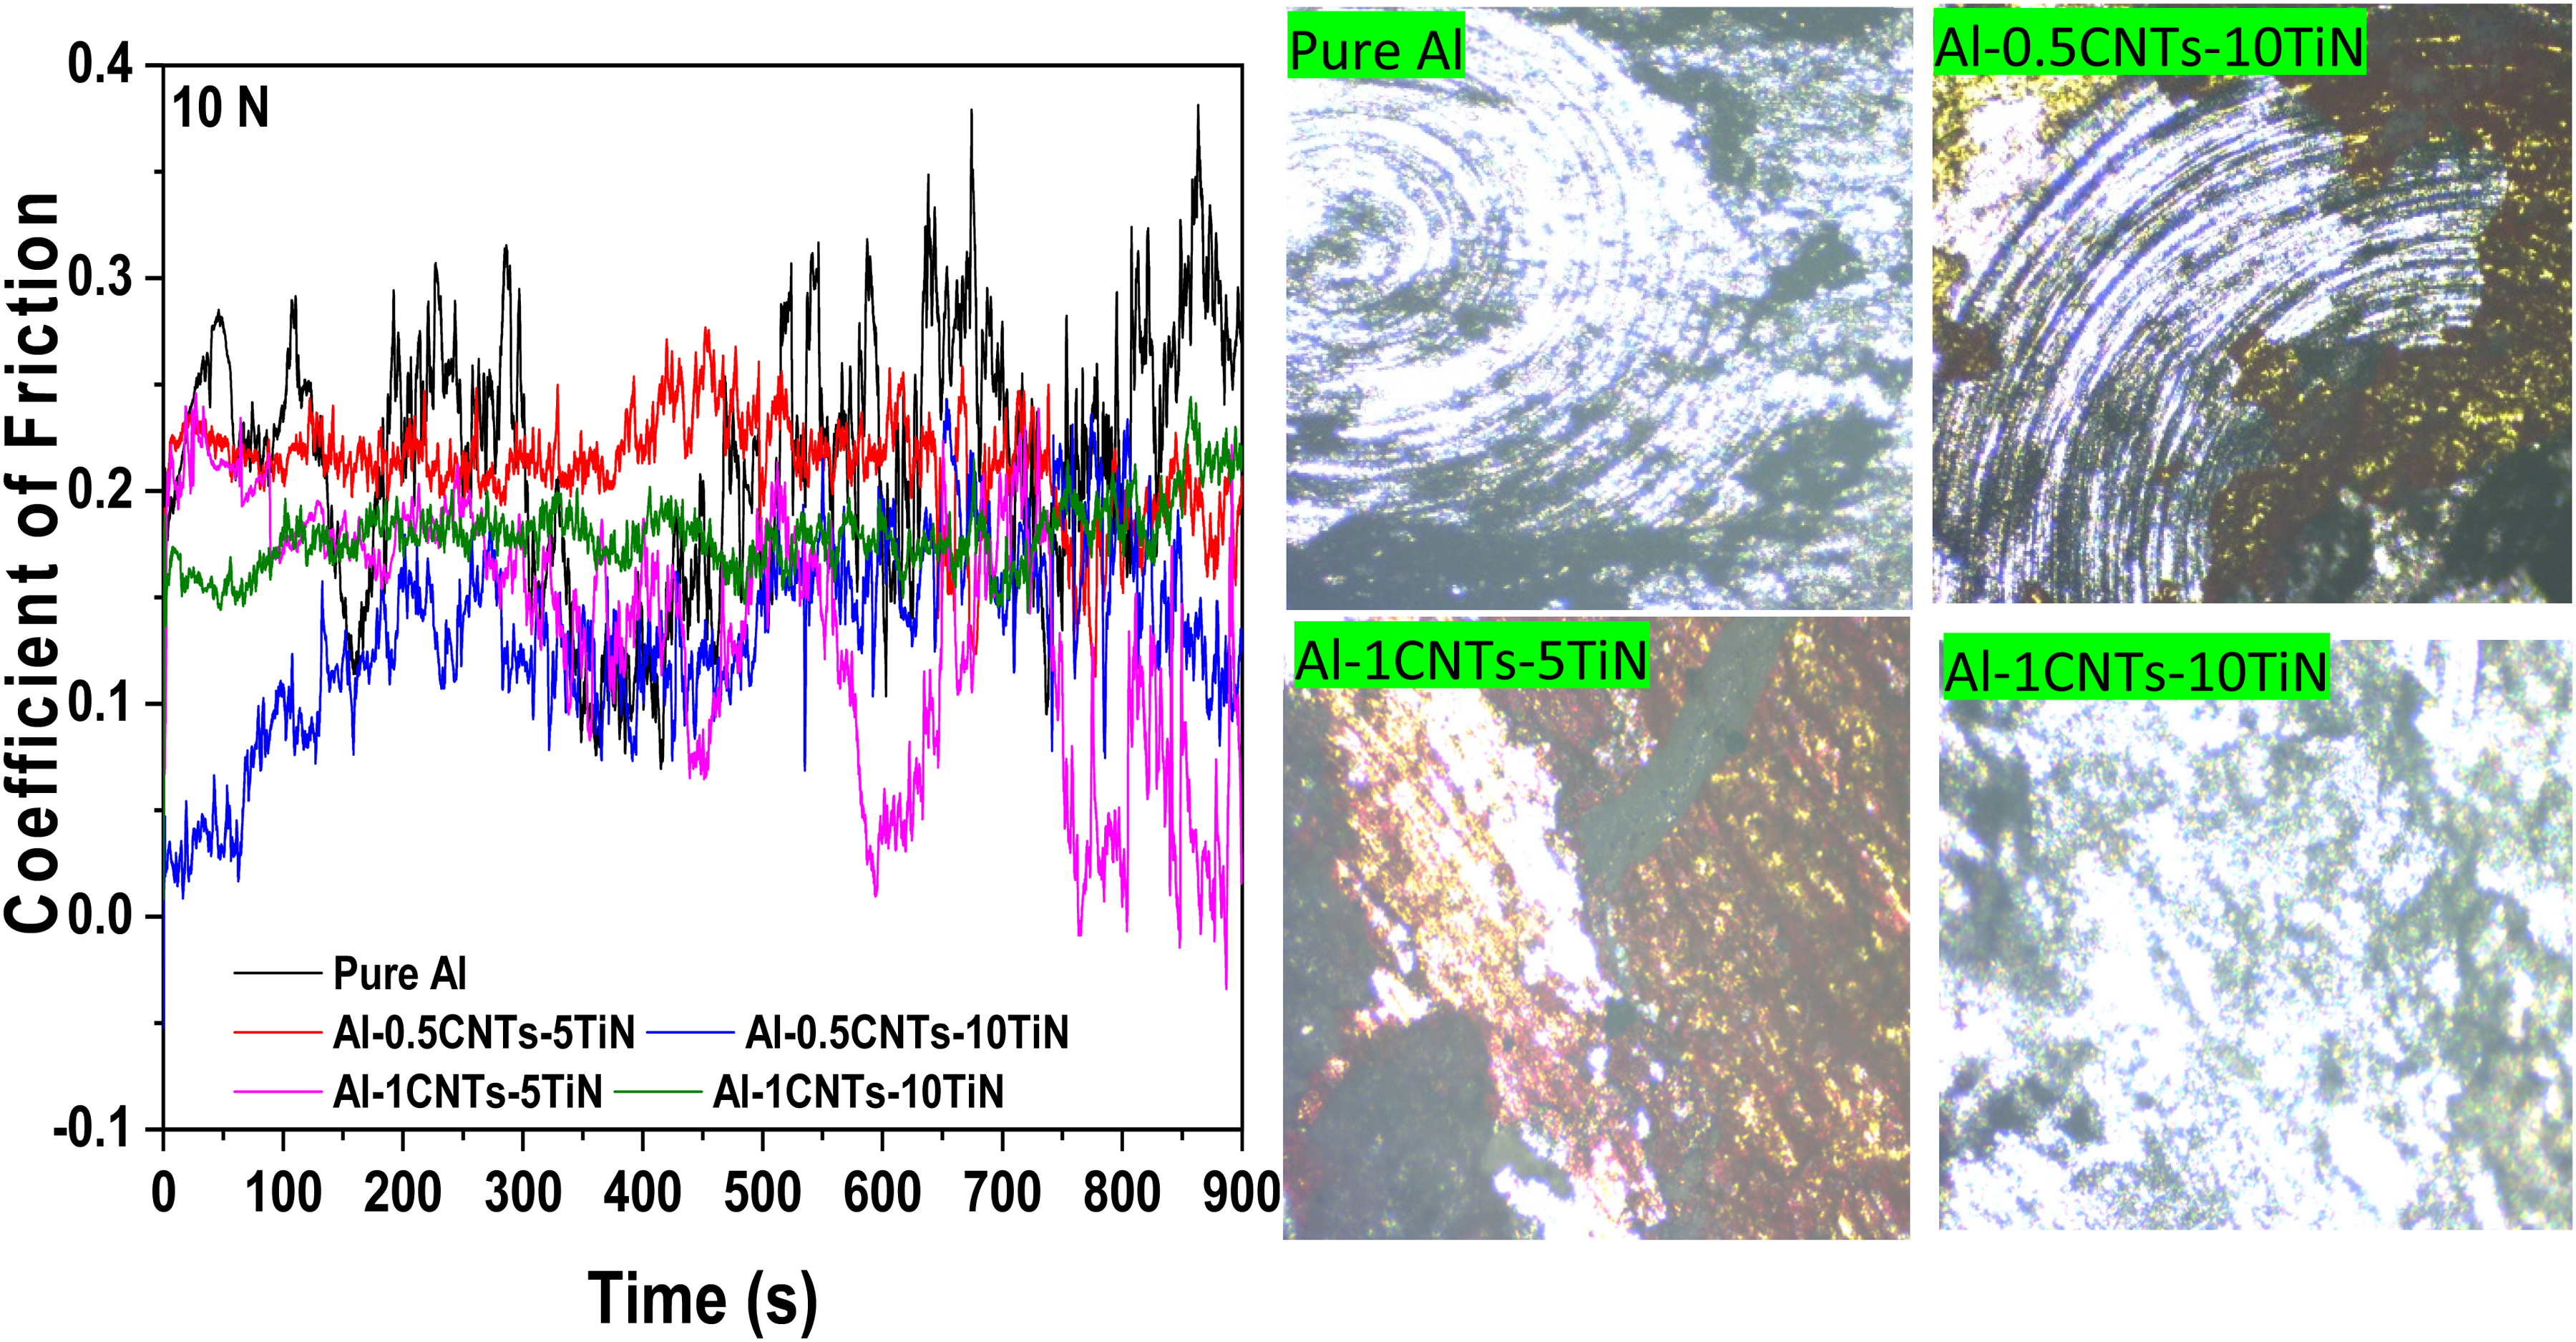
Coefficient of friction and the respective wear tracks at 10N for the pure Al and Al-MMCs.
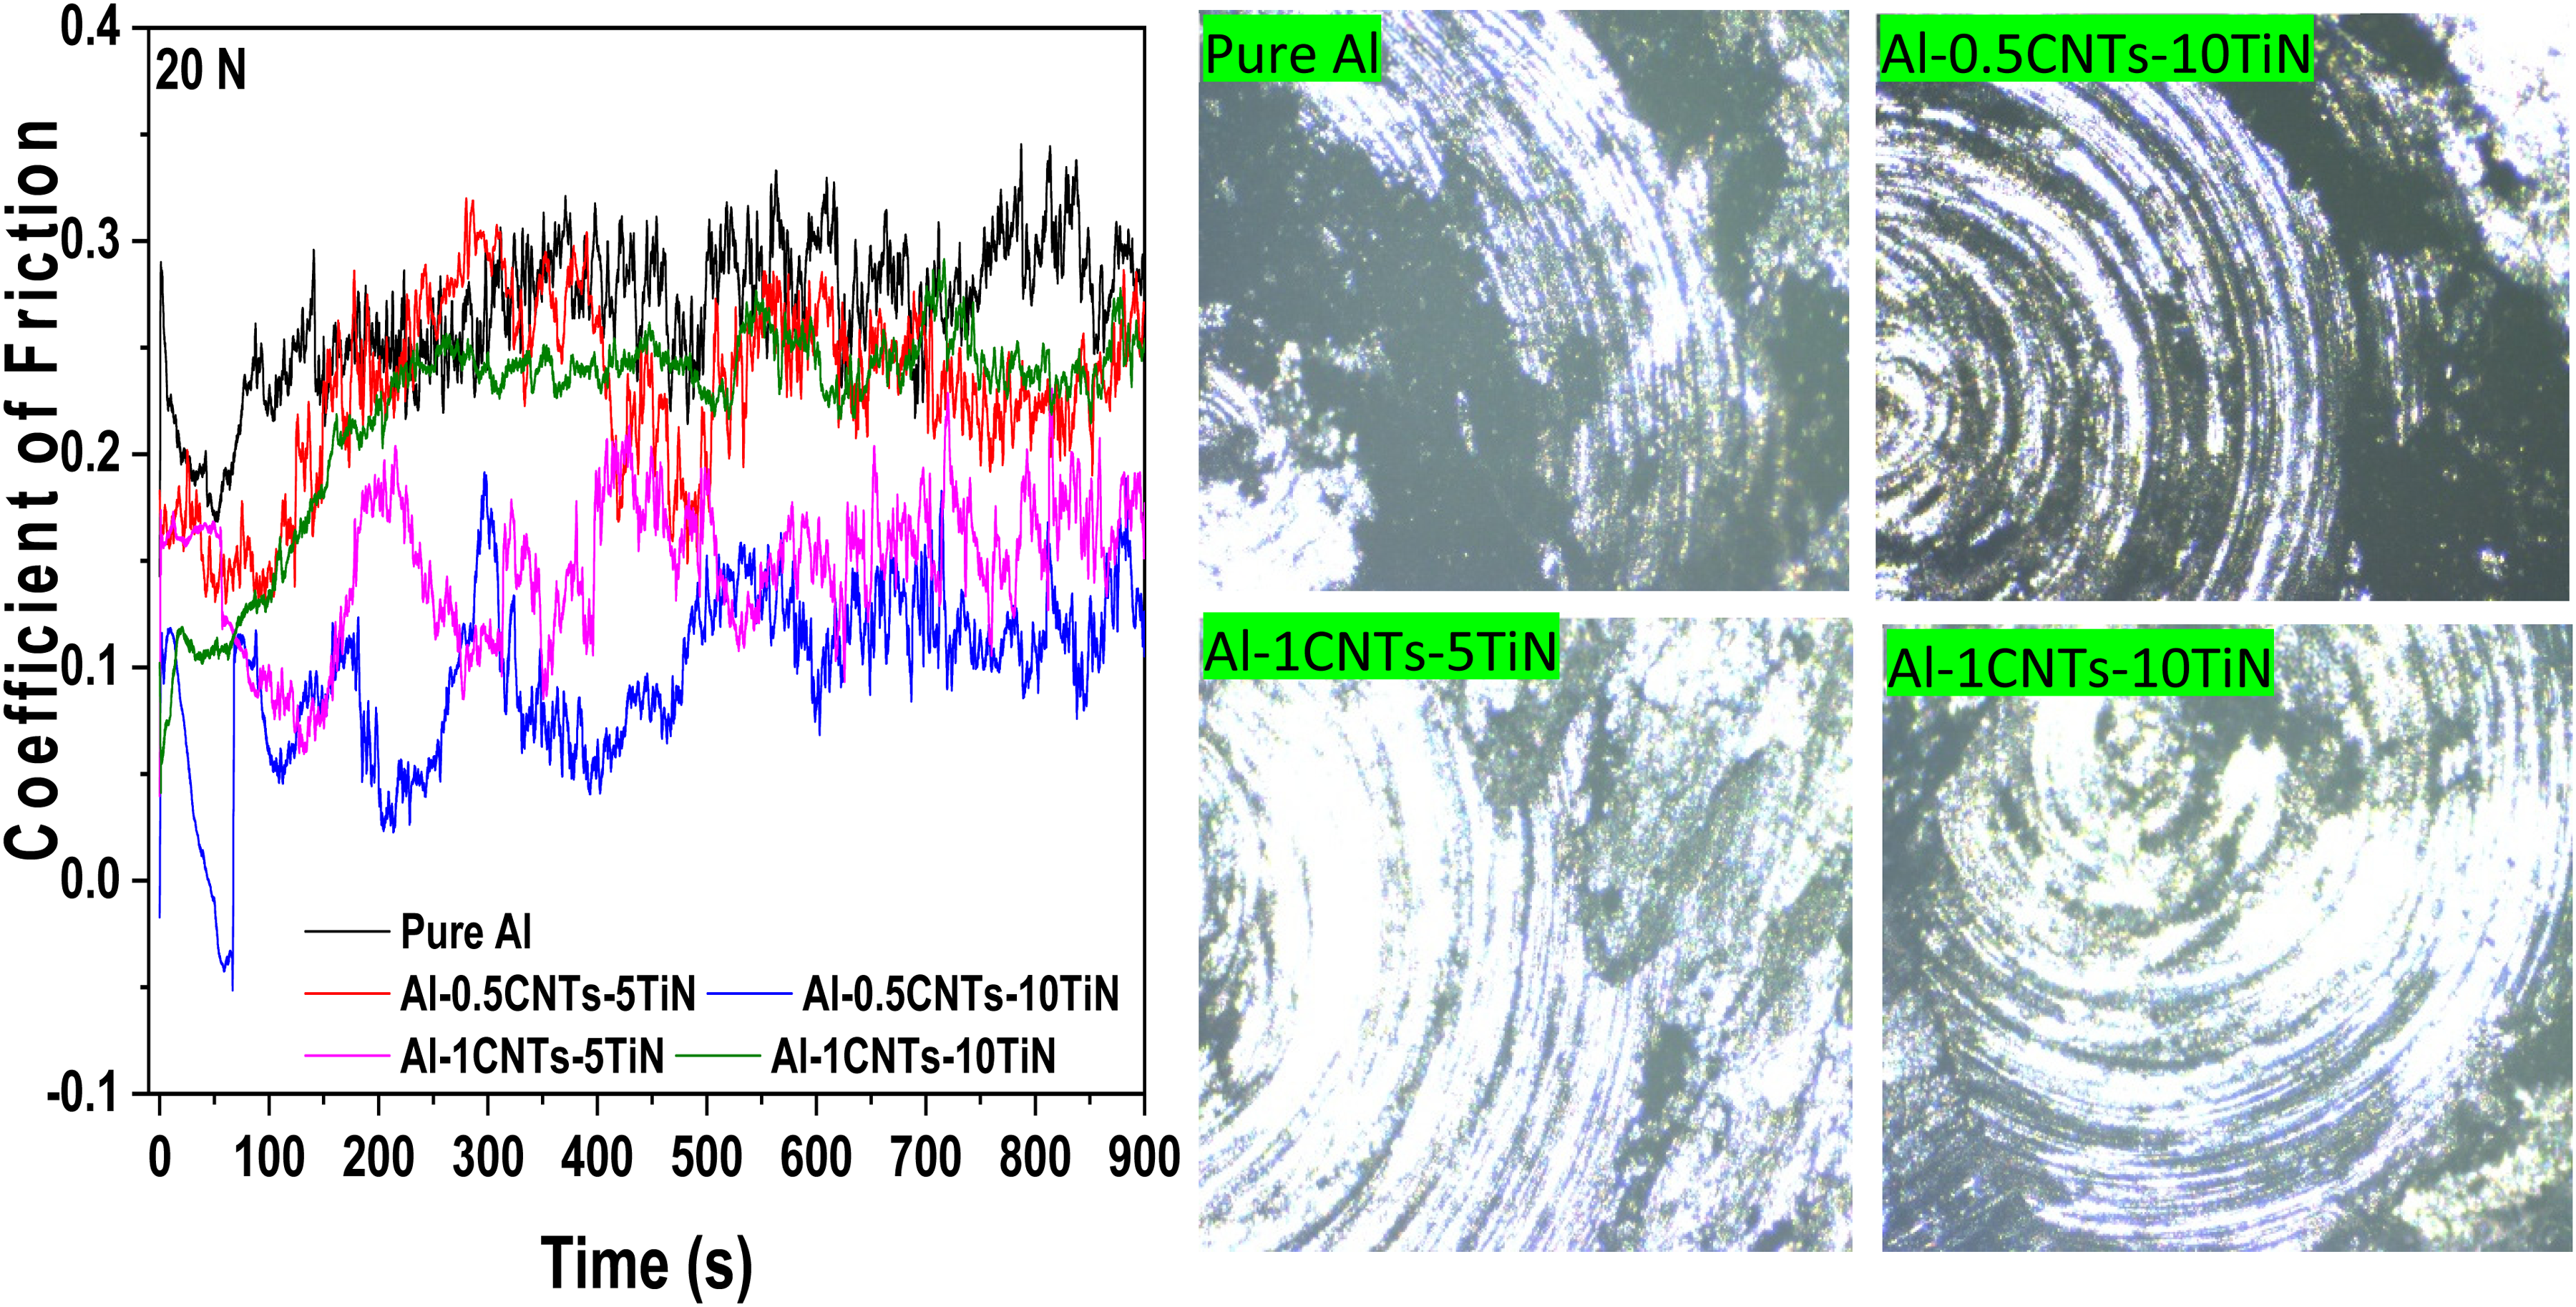
Coefficient of friction and the respective wear tracks at 20N for the pure Al and Al-MMCs.
Wear rate
The wear rates of the prepared Al nanocomposite samples under applied loads of 10N and 20N are presented in Figure 10. This illustrates the rate at which material is lost when subjected to continuous sliding with other bodies. The higher applied load resulted in larger material detachment (loss) from the bulk material. 34 As shown in Figure 10, pure Al exhibited the highest wear rates at both applied loads, which can be attributed to the softness or low hardness of the Al matrix. However, the addition of CNTs-TiN significantly reduced the wear rate of the Al nanocomposites, though the extent of this reduction varied among the nanocomposite samples. These disparities are attributed to the different levels of synergy between the CNTs and TiN at different concentrations and the compatibility of the reinforcing materials within the Al matrix. First. It is worth noting that the formation of small bundles of reinforcement phase in a matrix through agglomeration limits enhancement in mechanical and tribological properties due to large load concentration around the agglomerate, leading to early crack formation, propagation, and failure when a load is applied.31,35 This could be the reason why the wear rate of Al-1CNTs-10TiN nanocomposite is higher than that of Al-0.5CNTs-10TiN and Al-1CNTs-10TiN. Since these nanocomposite samples showed appreciable dispersion of the reinforcements, they showed a good reduction in wear rate. The enhanced wear properties of the nanocomposite samples could also be attributed to the appreciable interaction between TiN and CNTs, where these materials complement each other in load bearing and mechanical locking of the Al matrix with larger resistance to material detachment during the frictional test. In addition, during the frictional test, the fracture of the CNT tubes could have served as rollers between the bulk Al nanocomposites and the counter surface, thereby minimizing further material removal and serving as a self-lubricant with good load transmission from the matrix to the reinforcements. However, the Al-0.5CNTs-5TiN nanocomposite showed a higher wear rate among all the developed nanocomposites, which could be attributed to the low concentration of the total reinforcements. In general, all the developed Al nanocomposites showed improved wear resistance compared to pure Al. For instance, Al-0.5CNTs-10TiN and Al-1CNTs-5TiN nanocomposites have a lower wear rate of about 1.8 × 10⁻⁷ mm³/Nm and 6.96 × 10⁻⁷ mm³/Nm compared to the pure Al with 4.54 × 10⁻⁴ mm³/Nm at 10 N, respectively.
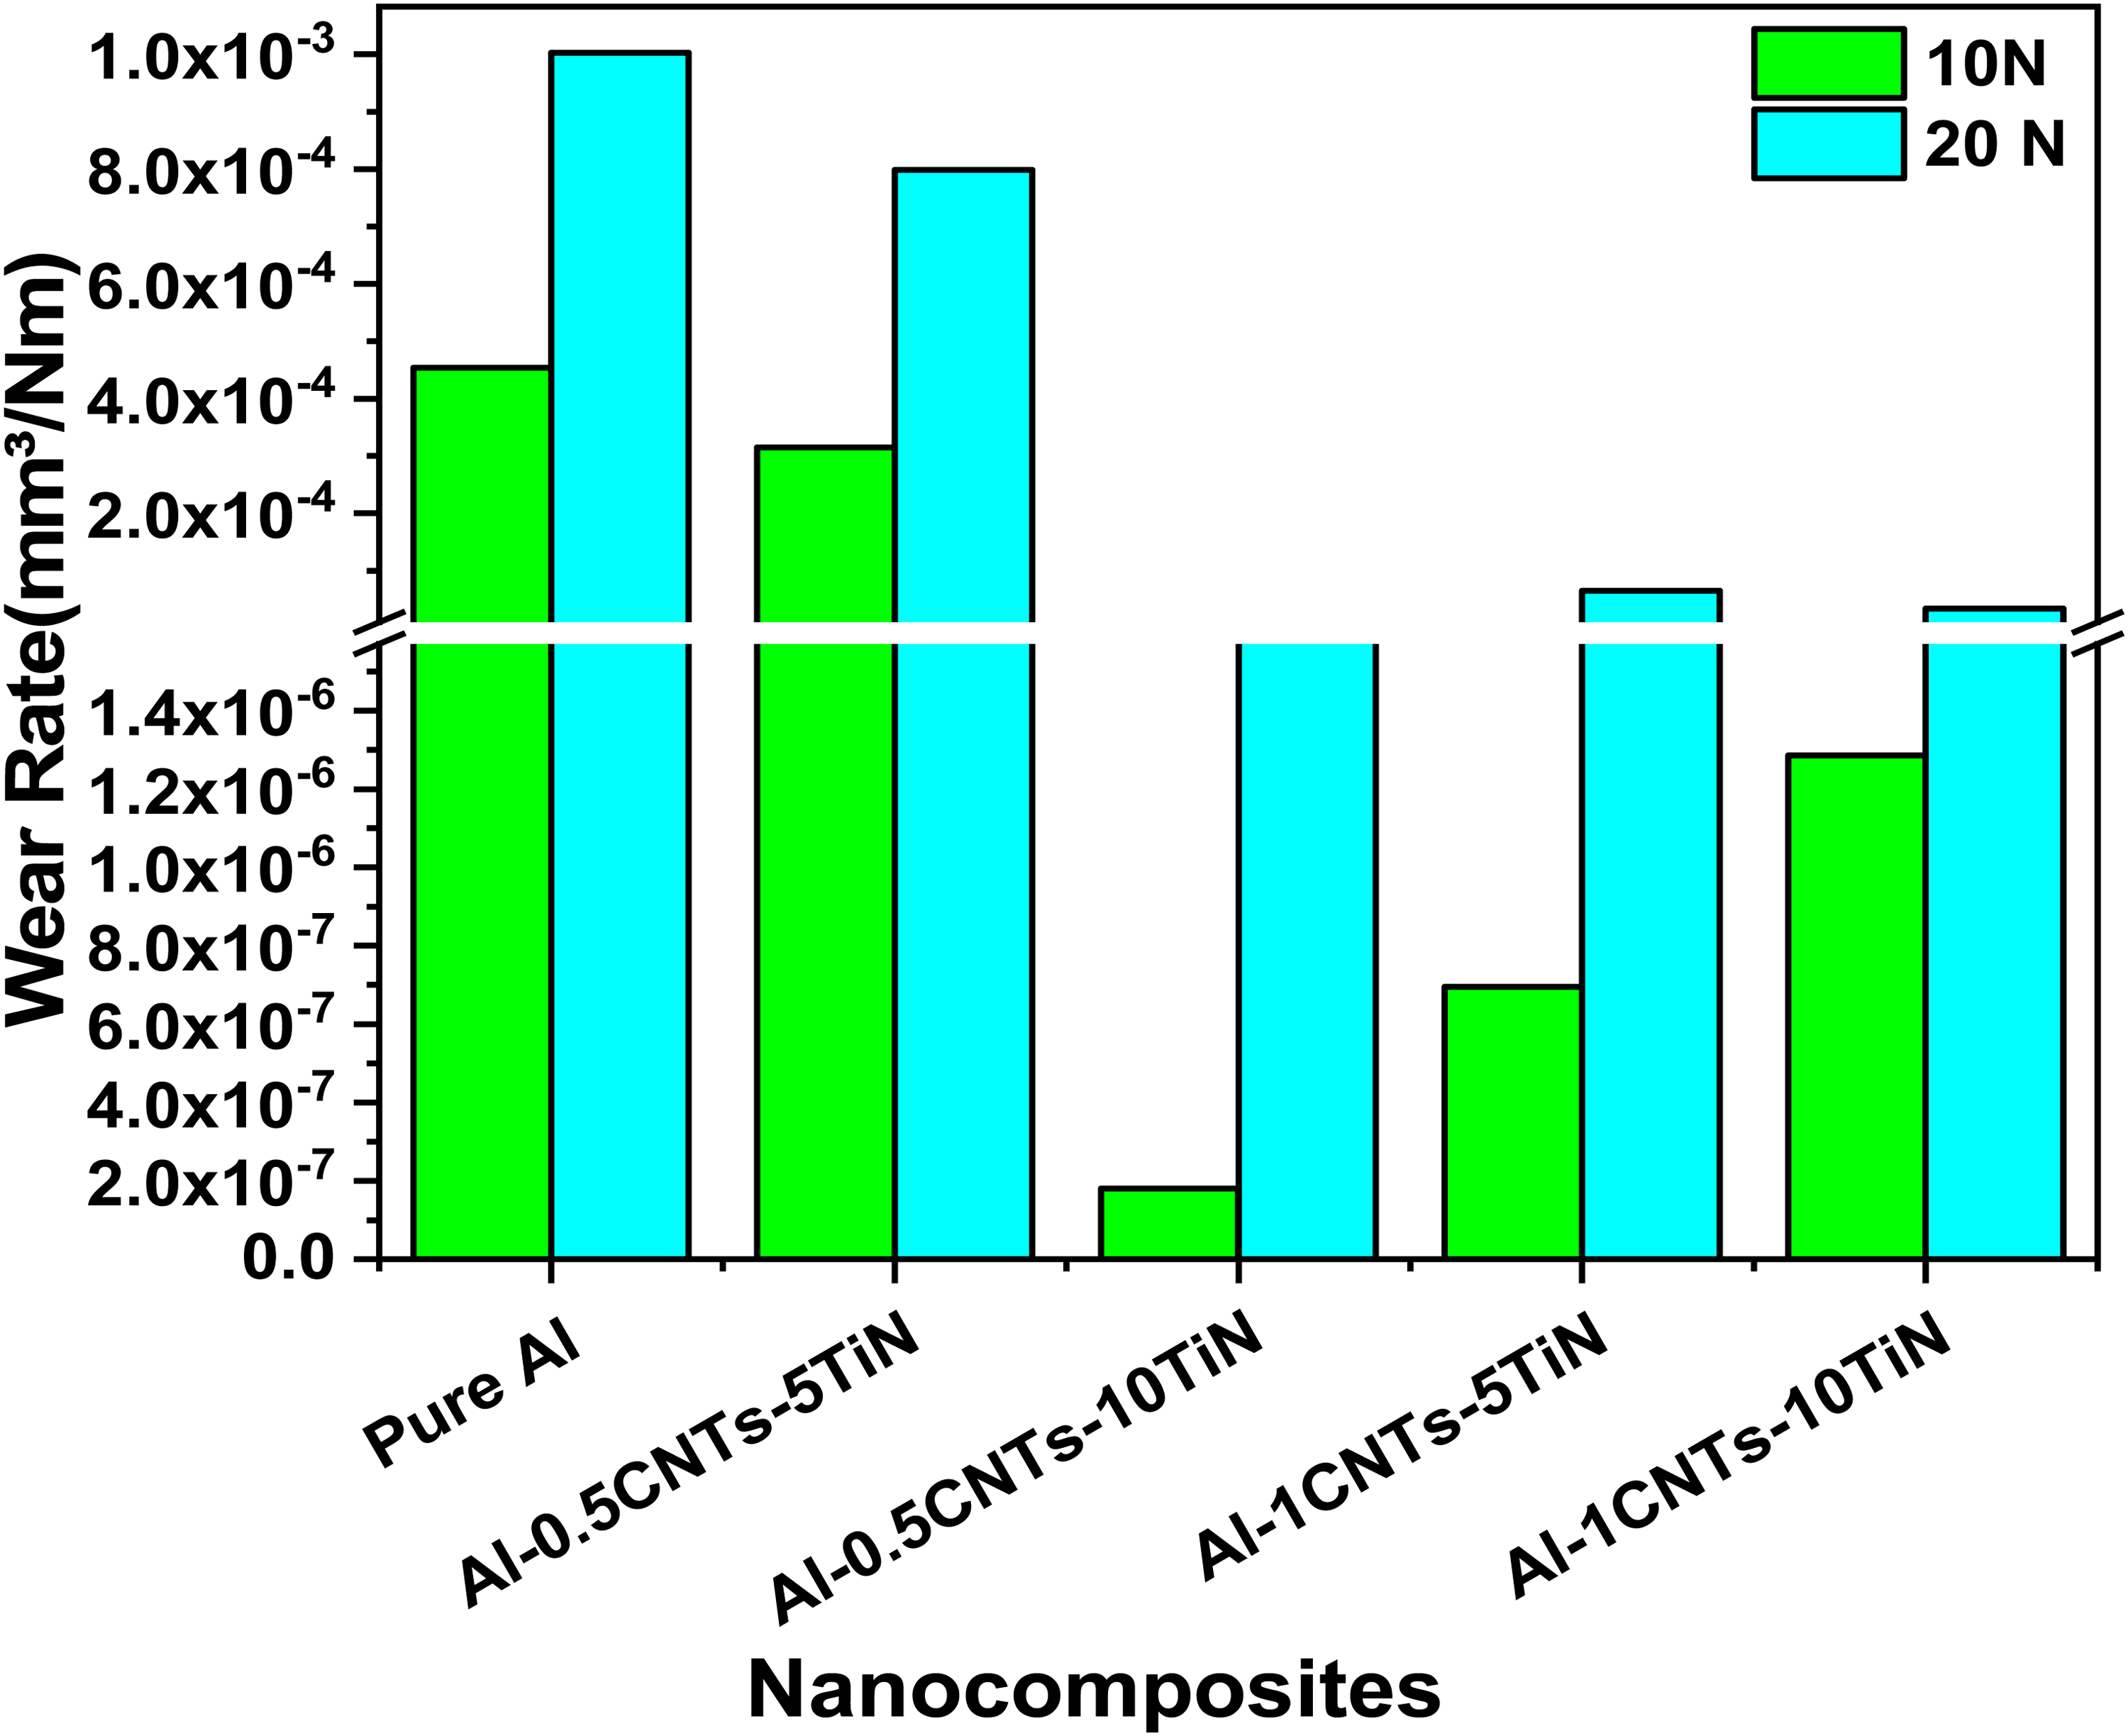
Wear rate of the Al nanocomposites at applied loads of 10N and 20N.
Conclusion
Al matrix was reinforced with CNTs-TiN through a tubular mixing, followed by compacting, melting, and casting. SEM analysis revealed appreciable uniform morphology of the Al-CNTs-TiN nanocomposites. While XRD analysis showed a dominant cubic structure of the Al matrix with diffraction peaks of CNTs and TiN. In general, there was no detectable formation of aluminum carbide in the Al nanocomposite.
The electrochemical performance in acid and salt media was assessed using open circuit potential and potentiodynamic polarization, which indicate improved resistance to corrosion of Al with the addition of hybrid reinforcement phases. For instance, the Al nanocomposite showed optimal electrochemical resistance of about 47% and 55% increments in acid and salt medium compared to that of the pure Al.
Also, the tribological analysis demonstrated reduced wear rate and CoF with the addition of hybrid CNT-TiN reinforcing phases in the Al matrix. The wear rate decreased from 4.54 × 10⁻⁴ mm³/Nm for the pure Al to 1.8 × 10⁻⁷ mm³/Nm for the Al nanocomposite at an applied load of 10 N. It was also noted that with an increase in the total concentration of the CNTs-TiN in the Al matrix, the electrochemical and tribological properties start depreciating relative to other nanocomposite samples.
The observed improved features of the fabricated Al nanocomposites were attributed to the presence of CNTs and TiN, which are known for their good self-lubrication and hardness for tribological properties and chemical resistance for electrochemical properties.
Footnotes
Acknowledgment
The authors would like to appreciate Tshwane University of Technology for their support towards this study.
Authors’ contribution statements
Data availability statement
All data sets associated with this study are presented in this article.
Declaration of conflicting interests
The authors declared no potential conflicts of interest with respect to the research, authorship, and/or publication of this article.
Funding
The authors received no financial support for the research, authorship, and/or publication of this article.