
Abstract
Background:
Artificial intelligence (AI) prediction models can accurately identify high-risk populations by integrating multi-dimensional clinical data, providing decision support for doctors in formulating individualized discharge plans and optimizing follow-up intervention strategies, thereby reducing the risk of readmission from the source. Currently, the number of AI prediction models for readmission of critically ill patients is increasing, but the quality and applicability of these models in clinical practice and future research remain uncertain.
Objective:
To systematically evaluate published studies on AI prediction models for critically ill patients.
Methods:
This study conducted a computerized search of the CNKI, Wanfang Data, VIP, SinoMed, PubMed, Web of Science, Cochrane, and Embase databases, with the time range from 2020 to June 25, 2025. Information such as study design, data sources, outcome definitions, sample size, predictors, model development, and performance was extracted from the selected studies. The Prediction Model Risk of Bias Assessment Tool (PROBAST) checklist was used to evaluate the risk of bias and applicability.
Results:
A total of 387 studies were retrieved, and after screening, 31 studies with their 31 prediction models were included in this review. All studies developed risk prediction models for readmission of critically ill patients using artificial intelligence algorithms. The readmission risk of critically ill patients ranged from 1.3% to 13.7%. The most commonly used predictors were structured data. The reported area under the curve (AUC) ranged from 0.66 to 0.98. All studies had a high risk of bias, mainly due to poor reporting quality in the analysis domain and insufficient applicability. The pooled AUC of the 24 validation models was 0.82, with a 95% confidence interval of 0.77–0.87.
Conclusion:
These study results constitute a comprehensive set of high-quality evidence, demonstrating that AI prediction models exhibit moderate-to-high predictive performance and that their predictive performance is significantly higher than that of traditional prediction models.
Patient or public contribution
No Patient or Public Contribution. This Meta-analysis is based on the systematic review and statistical combination of the published clinical research data. The processes of research design, data extraction, and result interpretation did not involve the participation of patients or the public.
Registration:
The protocol for this study has been registered in PROSPERO (registration number: CRD42025637829).
Background
Critically ill patients are those with the most severe conditions and highest medical needs. Intensive Care Unit(ICU)readmission refers to the patient’s unplanned return to the ICU within 48 h, 7 days, or 30 days after their initial discharge. The rate of early and unplanned ICU readmissions ranges from 1.3% to 13.7%. 1 ICU readmissions not only pose risks to patient health, increasing mortality and complications, but also place a financial burden on healthcare institutions. 2 According to Krumholz et al.’s 3 research, the mortality rate for readmitted patients is 24.56%, compared to only 11.17% for non-readmitted patients. ICU readmissions also impose a financial burden on the healthcare system. 2 ICU bed resources are highly limited compared to general wards. 4 According to the Agency for Healthcare Research and Quality (AHRQ), 5 the average cost of readmitted patients in the United States in 2018 was approximately $15,000.
Studies have shown that 13% of unplanned readmissions are preventable. 6 For patients at high risk of readmission, discharge can be appropriately delayed to ensure adequate preparation. Readmission prediction models are effective screening tools for assessing patient readmission risk, helping healthcare providers identify high-risk patients and reduce readmission rates. 7
Currently, research on readmission prediction models has attracted widespread attention. Ruppert et al. conducted a systematic review of 33 models, with the search period spanning from 2010 to 2021. 8 Markazi-Moghaddam et al. performed a systematic evaluation on the methodology and applicability of 13 ICU readmission risk prediction models, with the search period up to January 2017, and a total of five articles were included, among which only one was a machine learning model. 1 Since 2020, four studies9–12 have started to adopt methods such as machine learning. In recent years, machine learning and deep learning have been widely applied in healthcare; however, no systematic review focusing on machine learning and deep learning has been conducted yet.
With the advancement of artificial intelligence(AI), the technology is driving progress in healthcare and improving clinical experience. 13 Currently, AI is developing rapidly across multiple clinical fields, including radiology, ophthalmology, and pathology—with applications ranging from image diagnosis to disease risk assessment. AI is a broad field of computer science focused on enabling systems to perform tasks that typically require human intelligence (e.g. pattern recognition and clinical decision-making). In studies on ICU readmission prediction, the commonly used technology types at present are mainly divided into three categories, namely traditional machine learning (ML), deep learning (DL), and hybrid models combining the two. Machine learning (ML) is a core subset of AI; unlike traditional rule-based models, it uses algorithms to automatically learn patterns from data (e.g. patient vital signs and laboratory test results) and generate predictions without explicit programming. Deep learning (DL) is an advanced branch of ML that leverages multi-layer neural networks to extract complex, high-dimensional features from large datasets—including unstructured data such as clinical notes or imaging reports, which are difficult for traditional ML methods to process.
Traditional prediction models primarily include predictors such as vital signs, with AUC values ranging from 0.66 to 0.81, 1 demonstrating good overall predictive performance. Studies have shown that machine learning prediction models outperform traditional models.14–17 Despite the continuous advancement of machine learning and deep learning prediction models, systematic evaluations of their quality and applicability have not yet been conducted. This study aims to screen and assess AI-based readmission prediction models for critically ill patients, thereby providing valuable references for clinical practice and future research.
Methods
This study has been registered in PROSPERO (registration number: CRD42025637829).
Search strategy
This study conducted an extensive literature search to identify relevant articles. This study searched CNKI, Wanfang Data, VIP, SinoMed, PubMed, Embase, the Cochrane Library, and Web of Science databases for articles published up to June 25, 2025. We used a combination of keywords, including Medical Subject Headings (MeSH)/Emtree terms and free-text words, to search titles and abstracts. The keywords used were: “Patient readmission,” “readmission,” “unplanned readmission,” “severe disease,” “ICU,” “critical illness,” “artificial intelligence,” “deep learning,” “machine learning,” “prediction model,” “model,” “risk prediction,” “risk assessment,” “risk screening,” “risk factors.” The search was limited to English-language articles published between 2020 and June 25, 2025, with no restrictions on participant age or region. Additionally, this study manually searched the reference lists of relevant studies and meta-analyses to ensure all potentially relevant articles were identified.
Two researchers independently screened studies based on predefined inclusion and exclusion criteria and managed the literature using EndNote X9.3.1 (Clarivate Analytics, USA). Duplicate articles or studies that did not meet the criteria were excluded. This study screened the titles, abstracts, and full texts of all articles to identify studies that met the inclusion criteria.
Inclusion and exclusion criteria
After removing duplicates, the remaining articles were reviewed to identify studies that met the following criteria:
The inclusion criteria for studies were: (1) Population: The study population consisted of ICU patients. (2) Intervention: The study attempted to use AI algorithms to develop prediction models for readmission in ICU patients. (3) Outcome: The study used AUC as the primary outcome measure, along with sensitivity and specificity. (4) Study Design: The study was an observational study (retrospective or prospective), randomized or non-randomized controlled trial.
The exclusion criteria were: (1) Studies using similar data for repeated research. (2) Studies related to animal research, case reports, literature reviews, or conference abstracts.
This study excluded conference papers and gray literature to enhance the scientific rigor of the research. Two authors independently reviewed the titles and abstracts of identified publications to determine their relevance. Two authors screened the full texts of potentially relevant articles. Disagreements were resolved through discussion.
Data extraction
The following data were extracted from each included study: (I) First author; (II) Year of publication; (III) Study location; (IV) Study type; (V) Patient age and type of critical illness; (VI) Number of predictors and main predictors; (VII) Model characteristics; (VIII) Primary outcome measures; (IX) AUC and other parameters. If a study included more than two models for the same group of patients, the model with the higher AUC value was included in meta-analysis.
Quality assessment
Currently, there is no specific tool for evaluating machine learning-based prediction models. This study used the PROBAST tool to assess the risk of bias and applicability of AI prediction models. 18 The PROBAST tool divides potential biases in prediction model studies into four domains: participants, predictors, outcomes, and analysis. Each domain contains four aspects: information to support judgment, 2–9 signaling questions (20 in total), judgment of bias risk, and rationale for judgment (Table 1). Reviewers judged each signaling question based on the literature, with possible answers being “yes,” “probably yes,” “probably no,” “no,” or “no information.” “Yes” indicates low risk of bias, while “no” indicates high risk of bias. If the original study did not provide information on a signaling question, it was judged as “no information.” If the information provided in the original study was insufficient to make a definitive judgment, it was categorized as “probably yes” or “probably no.” The applicability assessment of prediction models includes the first three domains, with a similar judgment process to bias risk but without signaling questions.
Characteristics of included studies.
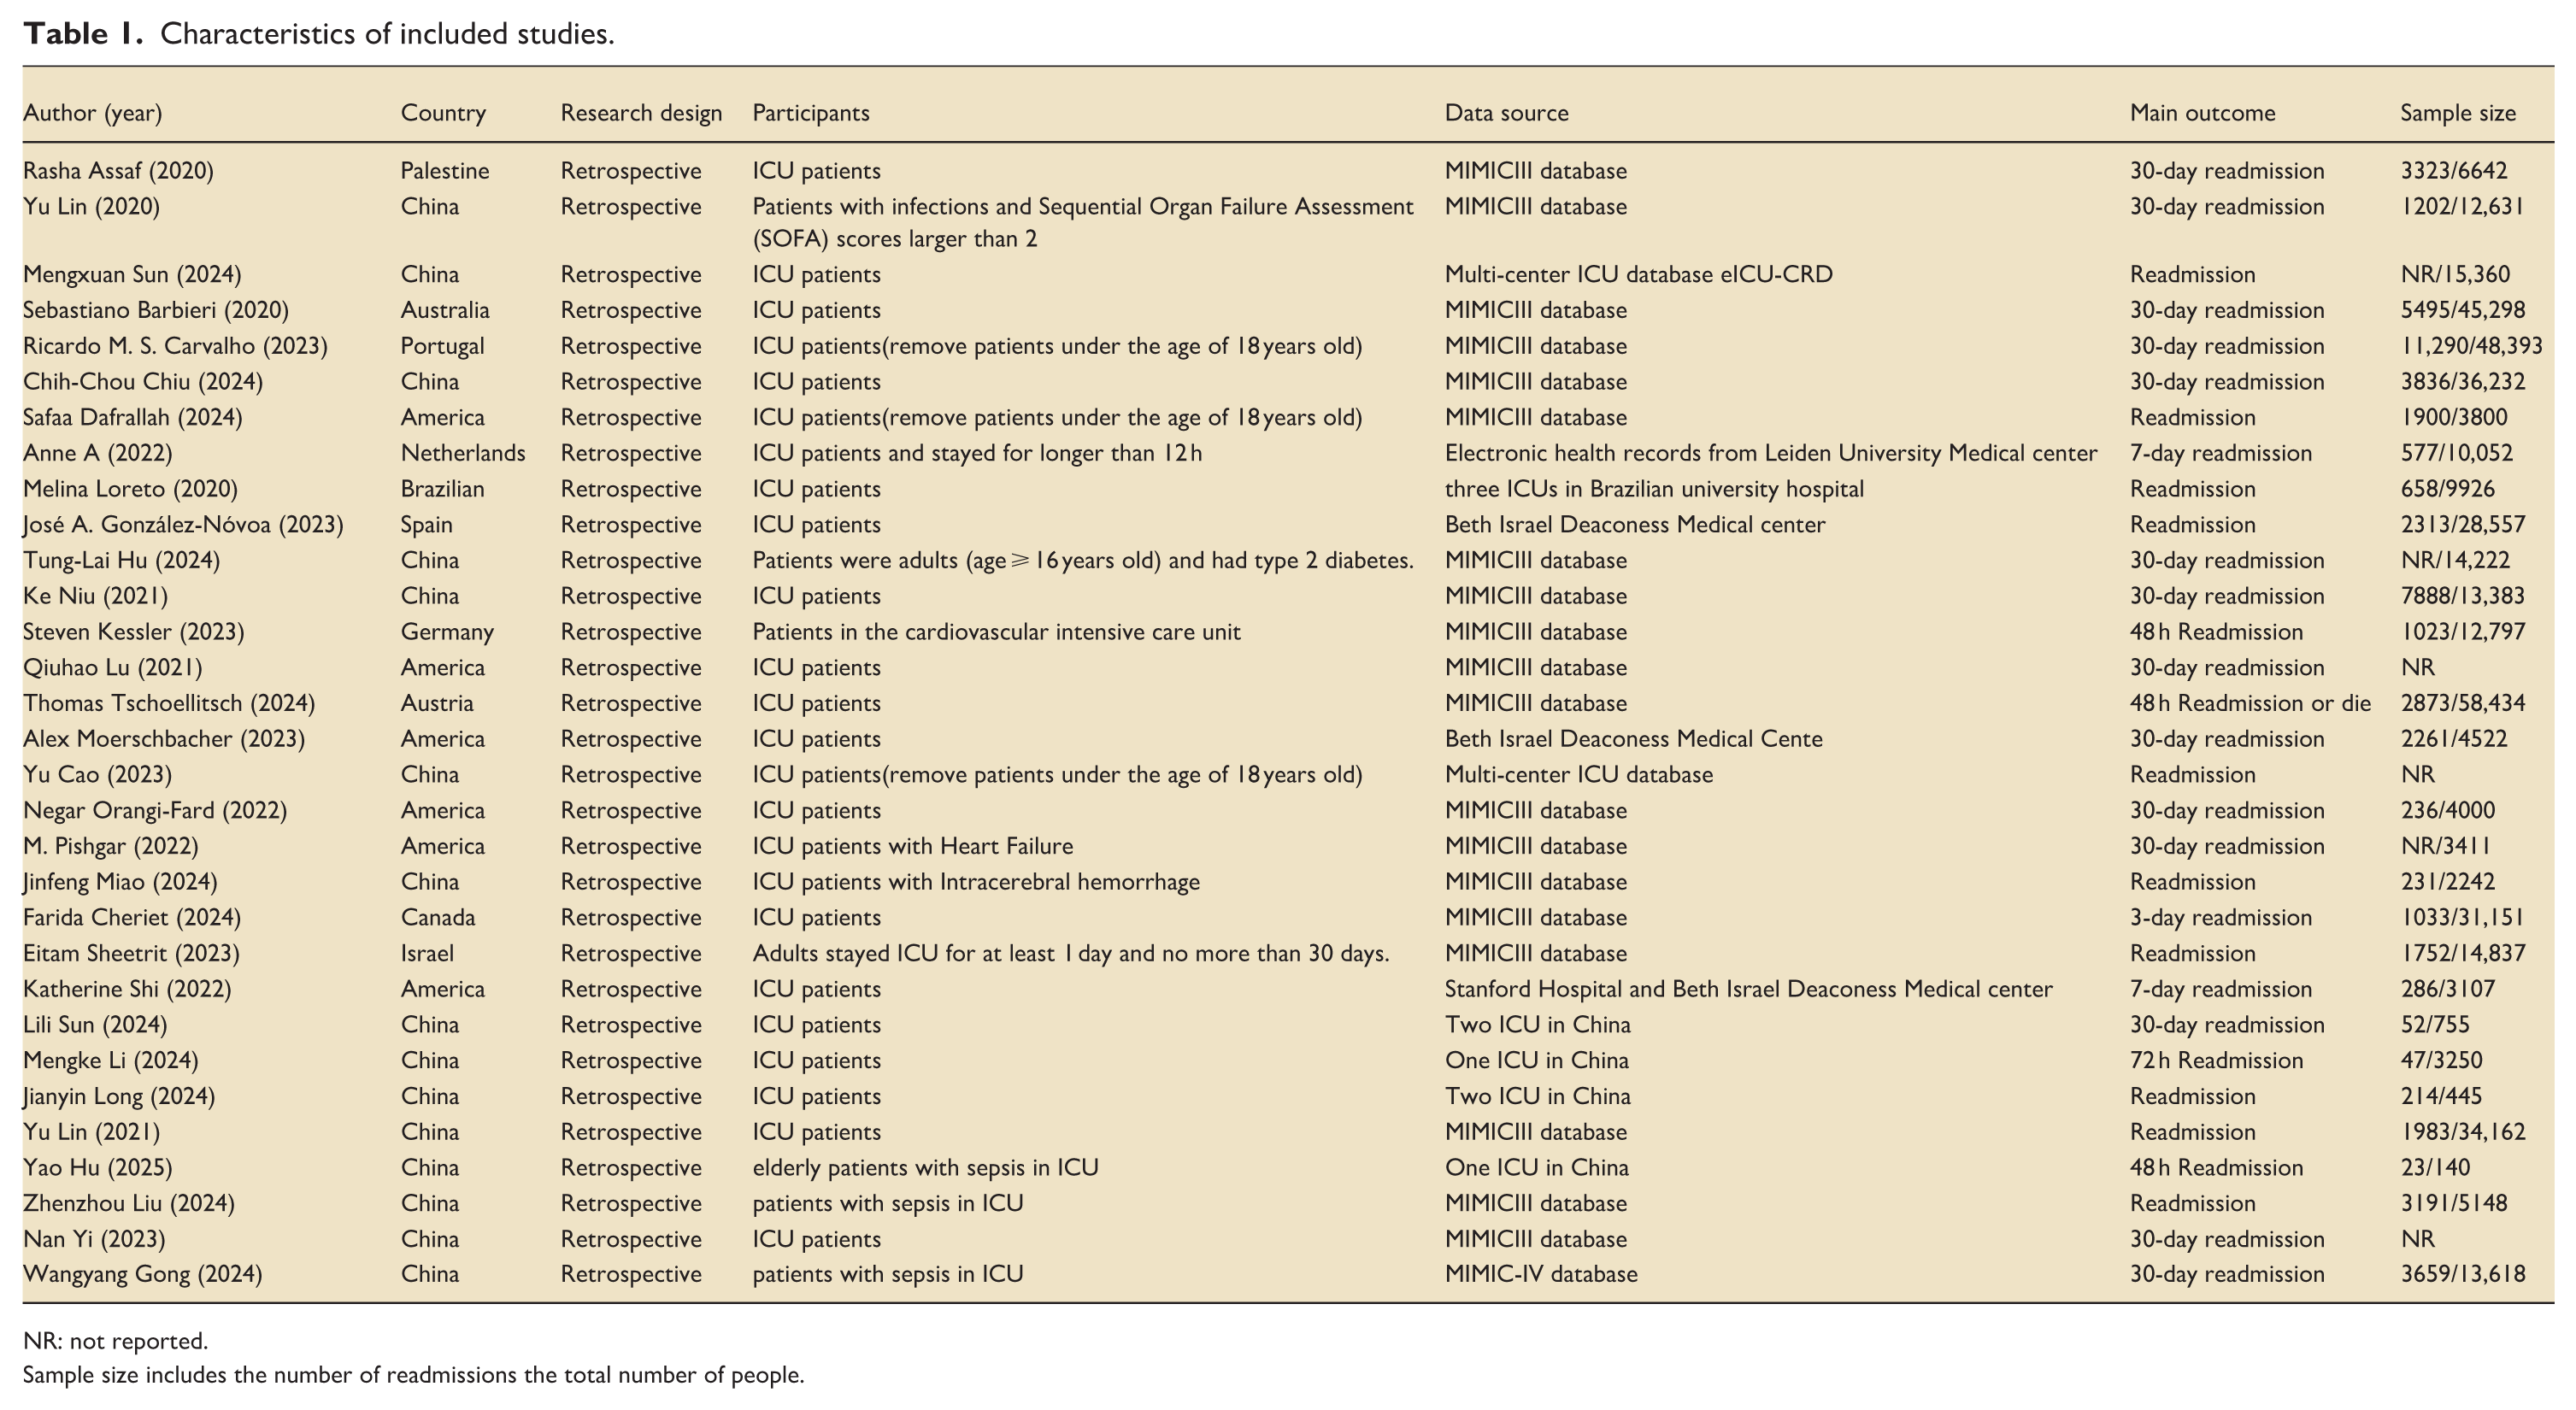
NR: not reported.
Sample size includes the number of readmissions the total number of people.
Statistical methods
Data analysis was performed using Stata software. The effect size was defined as the AUC and 95% confidence interval (CI). Heterogeneity was assessed using the I2 test. If no significant heterogeneity was detected (I2 < 50%), a fixed-effects model was used for analysis; otherwise, a random-effects model was employed when heterogeneity was present (I2 ⩾ 50%). Subgroup analyses were conducted to identify potential sources of heterogeneity. Sensitivity analyses were performed to evaluate the robustness of the results and explore heterogeneity by observing significant changes in the magnitude and direction of the pooled effect size. Funnel plots and Egger’s test were used to assess publication bias, with the trim-and-fill method applied to adjust for potential bias. Statistical significance was set at p < 0.05.
Results
Study identification
A total of 387 articles were identified using the search strategy. Of these, 148 were duplicates. The remaining 239 articles were evaluated based on their titles and abstracts. Seventy-five articles were selected for full-text screening, and 31 were included in the study (Figure 1).
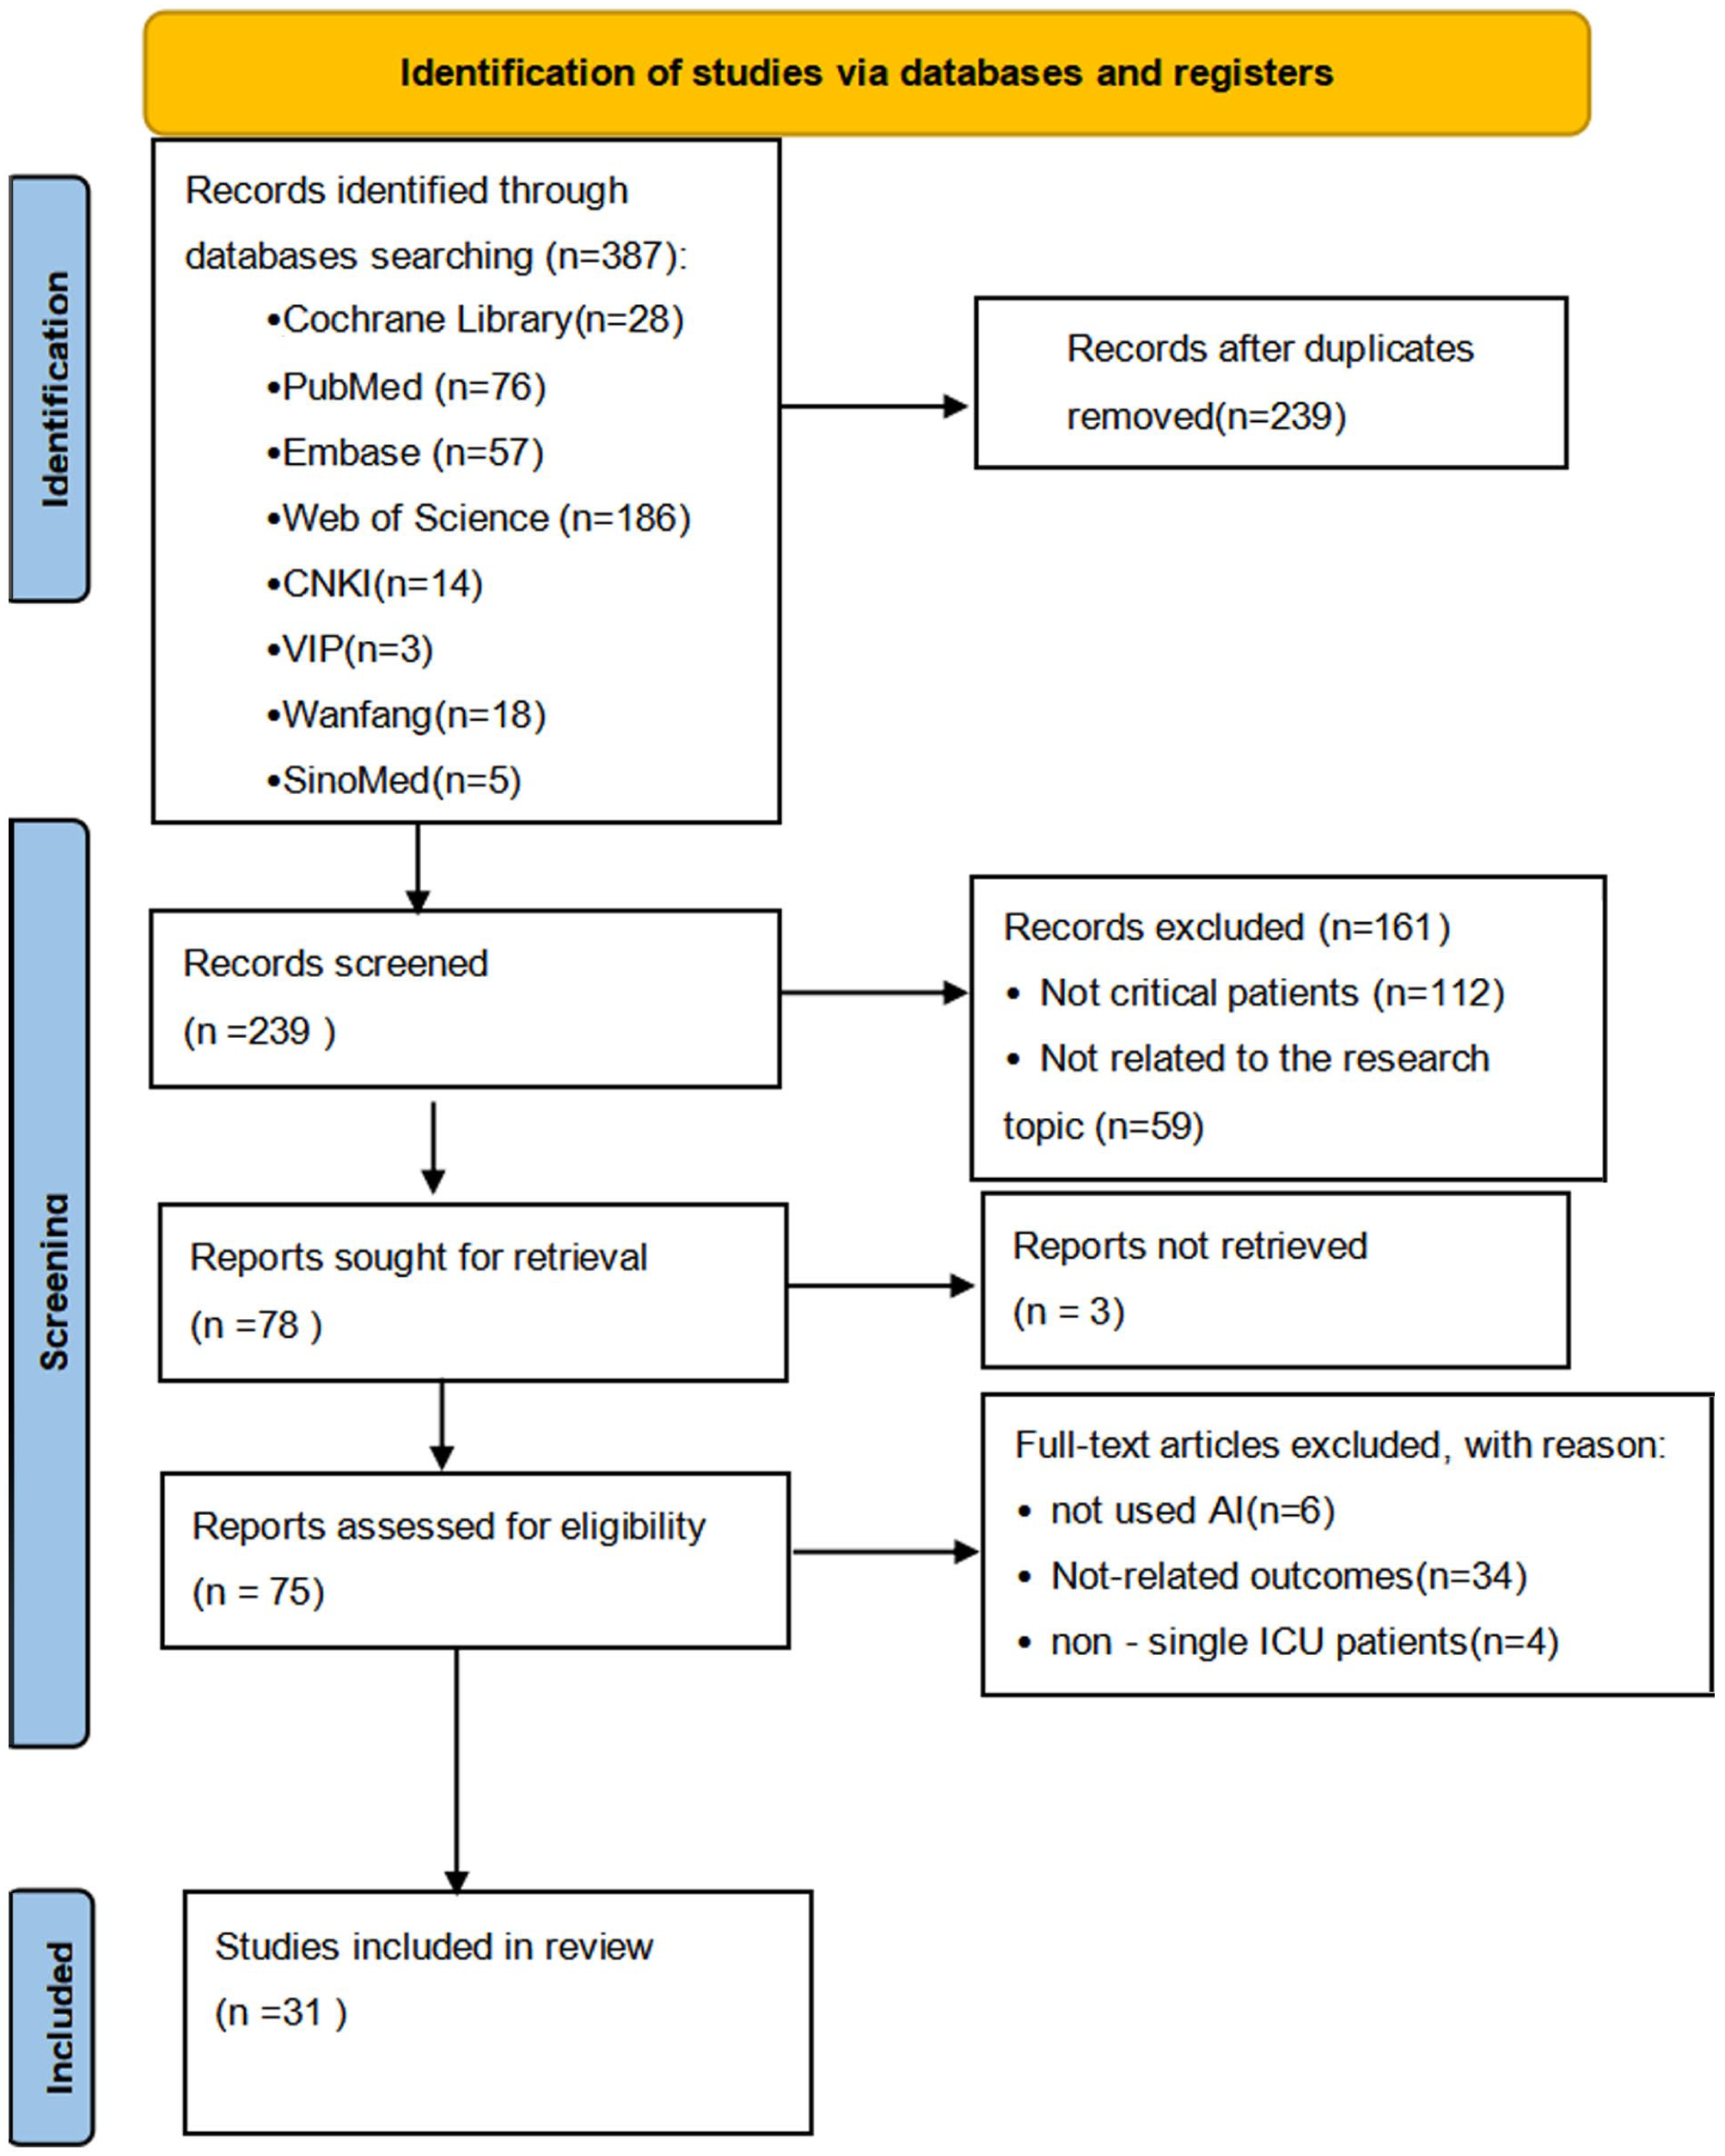
The flowchart of study identification and selection.
Study characteristics
Table 1 presents the characteristics of the eligible studies. All studies were published after 2020. Fifteen eligible studies10,19–32were conducted in China, five in the United States,33–37 and the rest in Australia, 11 Spain, 38 and other countries.37,39 Thirty-one studies were retrospective. Nineteen studies9–11,20–22,24–26,31,35,36,39–44 used the MIMIC-III database. Three studies19,23used the multi-center ICU database eICU-CRD. Two studies34,38used data from Beth Israel Deaconess Medical center. Six studies27–29,32,34,37 used data from medical centers, three12,28,29of which used multi-center data. Twenty-one studies9,11,12,19,20,22,23,25–29,33–35,37,38,40,41,44,45 focused on ICU patients, while the remaining 721,24,30–32,36,42 included ICU patients with sepsis, heart failure, cardiovascular disease, and intracerebral hemorrhage. Most studies analyzed patient age, with the average age ranging from 62.2 to 69.9 years. Eighteen studies9–11,20–22,25–28,30–36,39 explicitly used 30-day readmission as the primary outcome measure, while 12 studies12,19,23,24,37,38,40–45 did not specify or used 48-h/7-day readmission as the outcome measure. All studies had large sample sizes.
Predictors
AI prediction models can be divided into structured and unstructured data based on predictors. Table 2 summarizes the predictors used in the models. 24 studies used structured data, extracting clinical features related to ICU readmission from electronic health records (EHR), such as patient age, gender, diagnosis, laboratory results, and vital signs. Yi, 26 Lu et al., 33 and Orangi-Fard et al. 35 used only unstructured data, utilizing discharge summaries for prediction. Four studies19,20,34,43 combined structured and unstructured data for prediction. Chiu et al. 20 used BERTopic combined with long short-term memory (LSTM) networks to extract and preprocess text information from discharge summaries. Carvalho et al. 39 constructed a knowledge graph to extract medical concepts from text and build multi-view graphs to better capture information.
Summary of model performance.
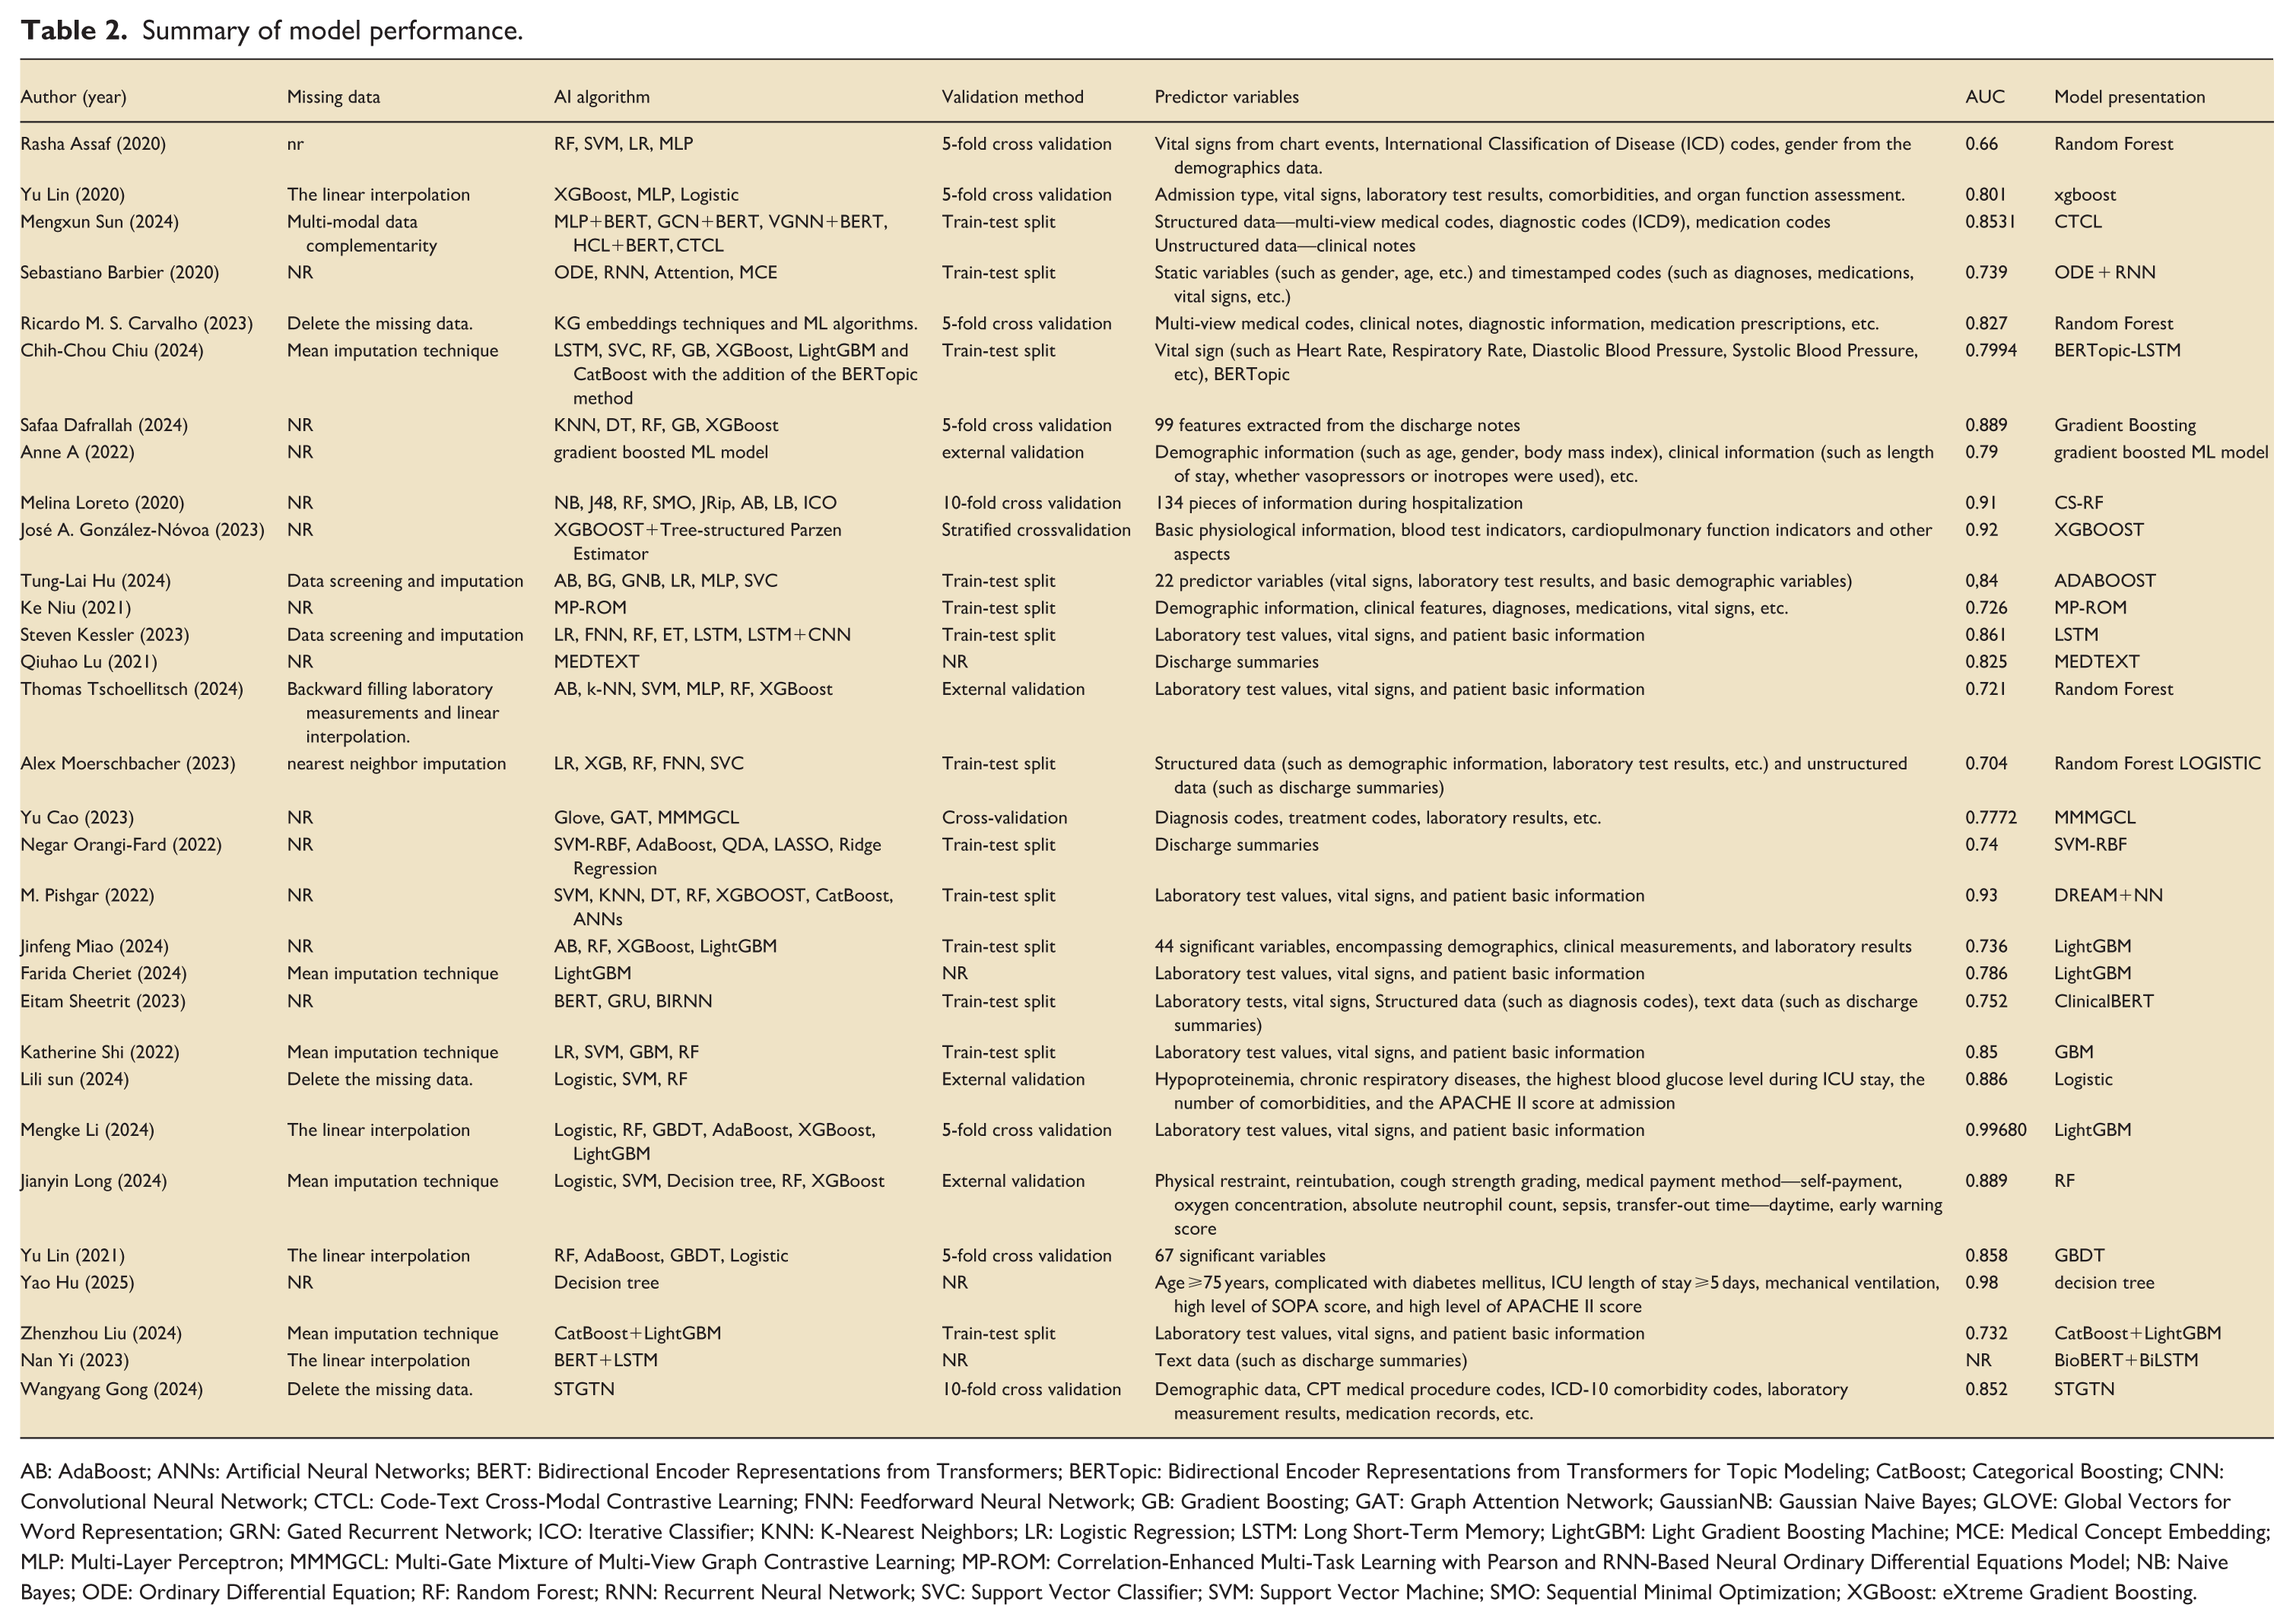
AB: AdaBoost; ANNs: Artificial Neural Networks; BERT: Bidirectional Encoder Representations from Transformers; BERTopic: Bidirectional Encoder Representations from Transformers for Topic Modeling; CatBoost; Categorical Boosting; CNN: Convolutional Neural Network; CTCL: Code-Text Cross-Modal Contrastive Learning; FNN: Feedforward Neural Network; GB: Gradient Boosting; GAT: Graph Attention Network; GaussianNB: Gaussian Naive Bayes; GLOVE: Global Vectors for Word Representation; GRN: Gated Recurrent Network; ICO: Iterative Classifier; KNN: K-Nearest Neighbors; LR: Logistic Regression; LSTM: Long Short-Term Memory; LightGBM: Light Gradient Boosting Machine; MCE: Medical Concept Embedding; MLP: Multi-Layer Perceptron; MMMGCL: Multi-Gate Mixture of Multi-View Graph Contrastive Learning; MP-ROM: Correlation-Enhanced Multi-Task Learning with Pearson and RNN-Based Neural Ordinary Differential Equations Model; NB: Naive Bayes; ODE: Ordinary Differential Equation; RF: Random Forest; RNN: Recurrent Neural Network; SVC: Support Vector Classifier; SVM: Support Vector Machine; SMO: Sequential Minimal Optimization; XGBoost: eXtreme Gradient Boosting.
Model performance
Table 2 summarizes the AI algorithms, validation methods, and performance metrics of the models. Five studies11,19,22,36,43used different deep learning networks to develop models, while the remaining studies used various machine learning algorithms for prediction. All models underwent internal validation, with only Sun, 28 Long, 29 Tschoellitsch et al., 41 and de Hond et al. 45 conducting external validation. The AUC values of the prediction models ranged from 0.66 to 0.98. Eighteen studies10,12,19–21,25,27–30,32,33,36–40,42 reported AUC values greater than 0.8, indicating good discriminative ability. Eleven studies11,22–24,31,34,35,41,43–45 reported AUC values between 0.7 and 0.8. Only one study 9 reported an AUC of 0.66. Models with good discriminative ability far outnumbered those in another review.
Quality assessment
Table 3 summarizes the risk of bias and applicability assessments of the included studies. 28 studies were assessed as having a high risk of bias, while three studies9,11,39 were assessed as unclear. In the domains of participants, predictors, and outcomes, all studies were retrospective and used pre-collected data, so there was no risk of bias. In the analysis domain, 28 studies were identified as having a high risk of bias, while three studies9,11,39 had unclear bias risk.
Risk of bias and applicability assessment.
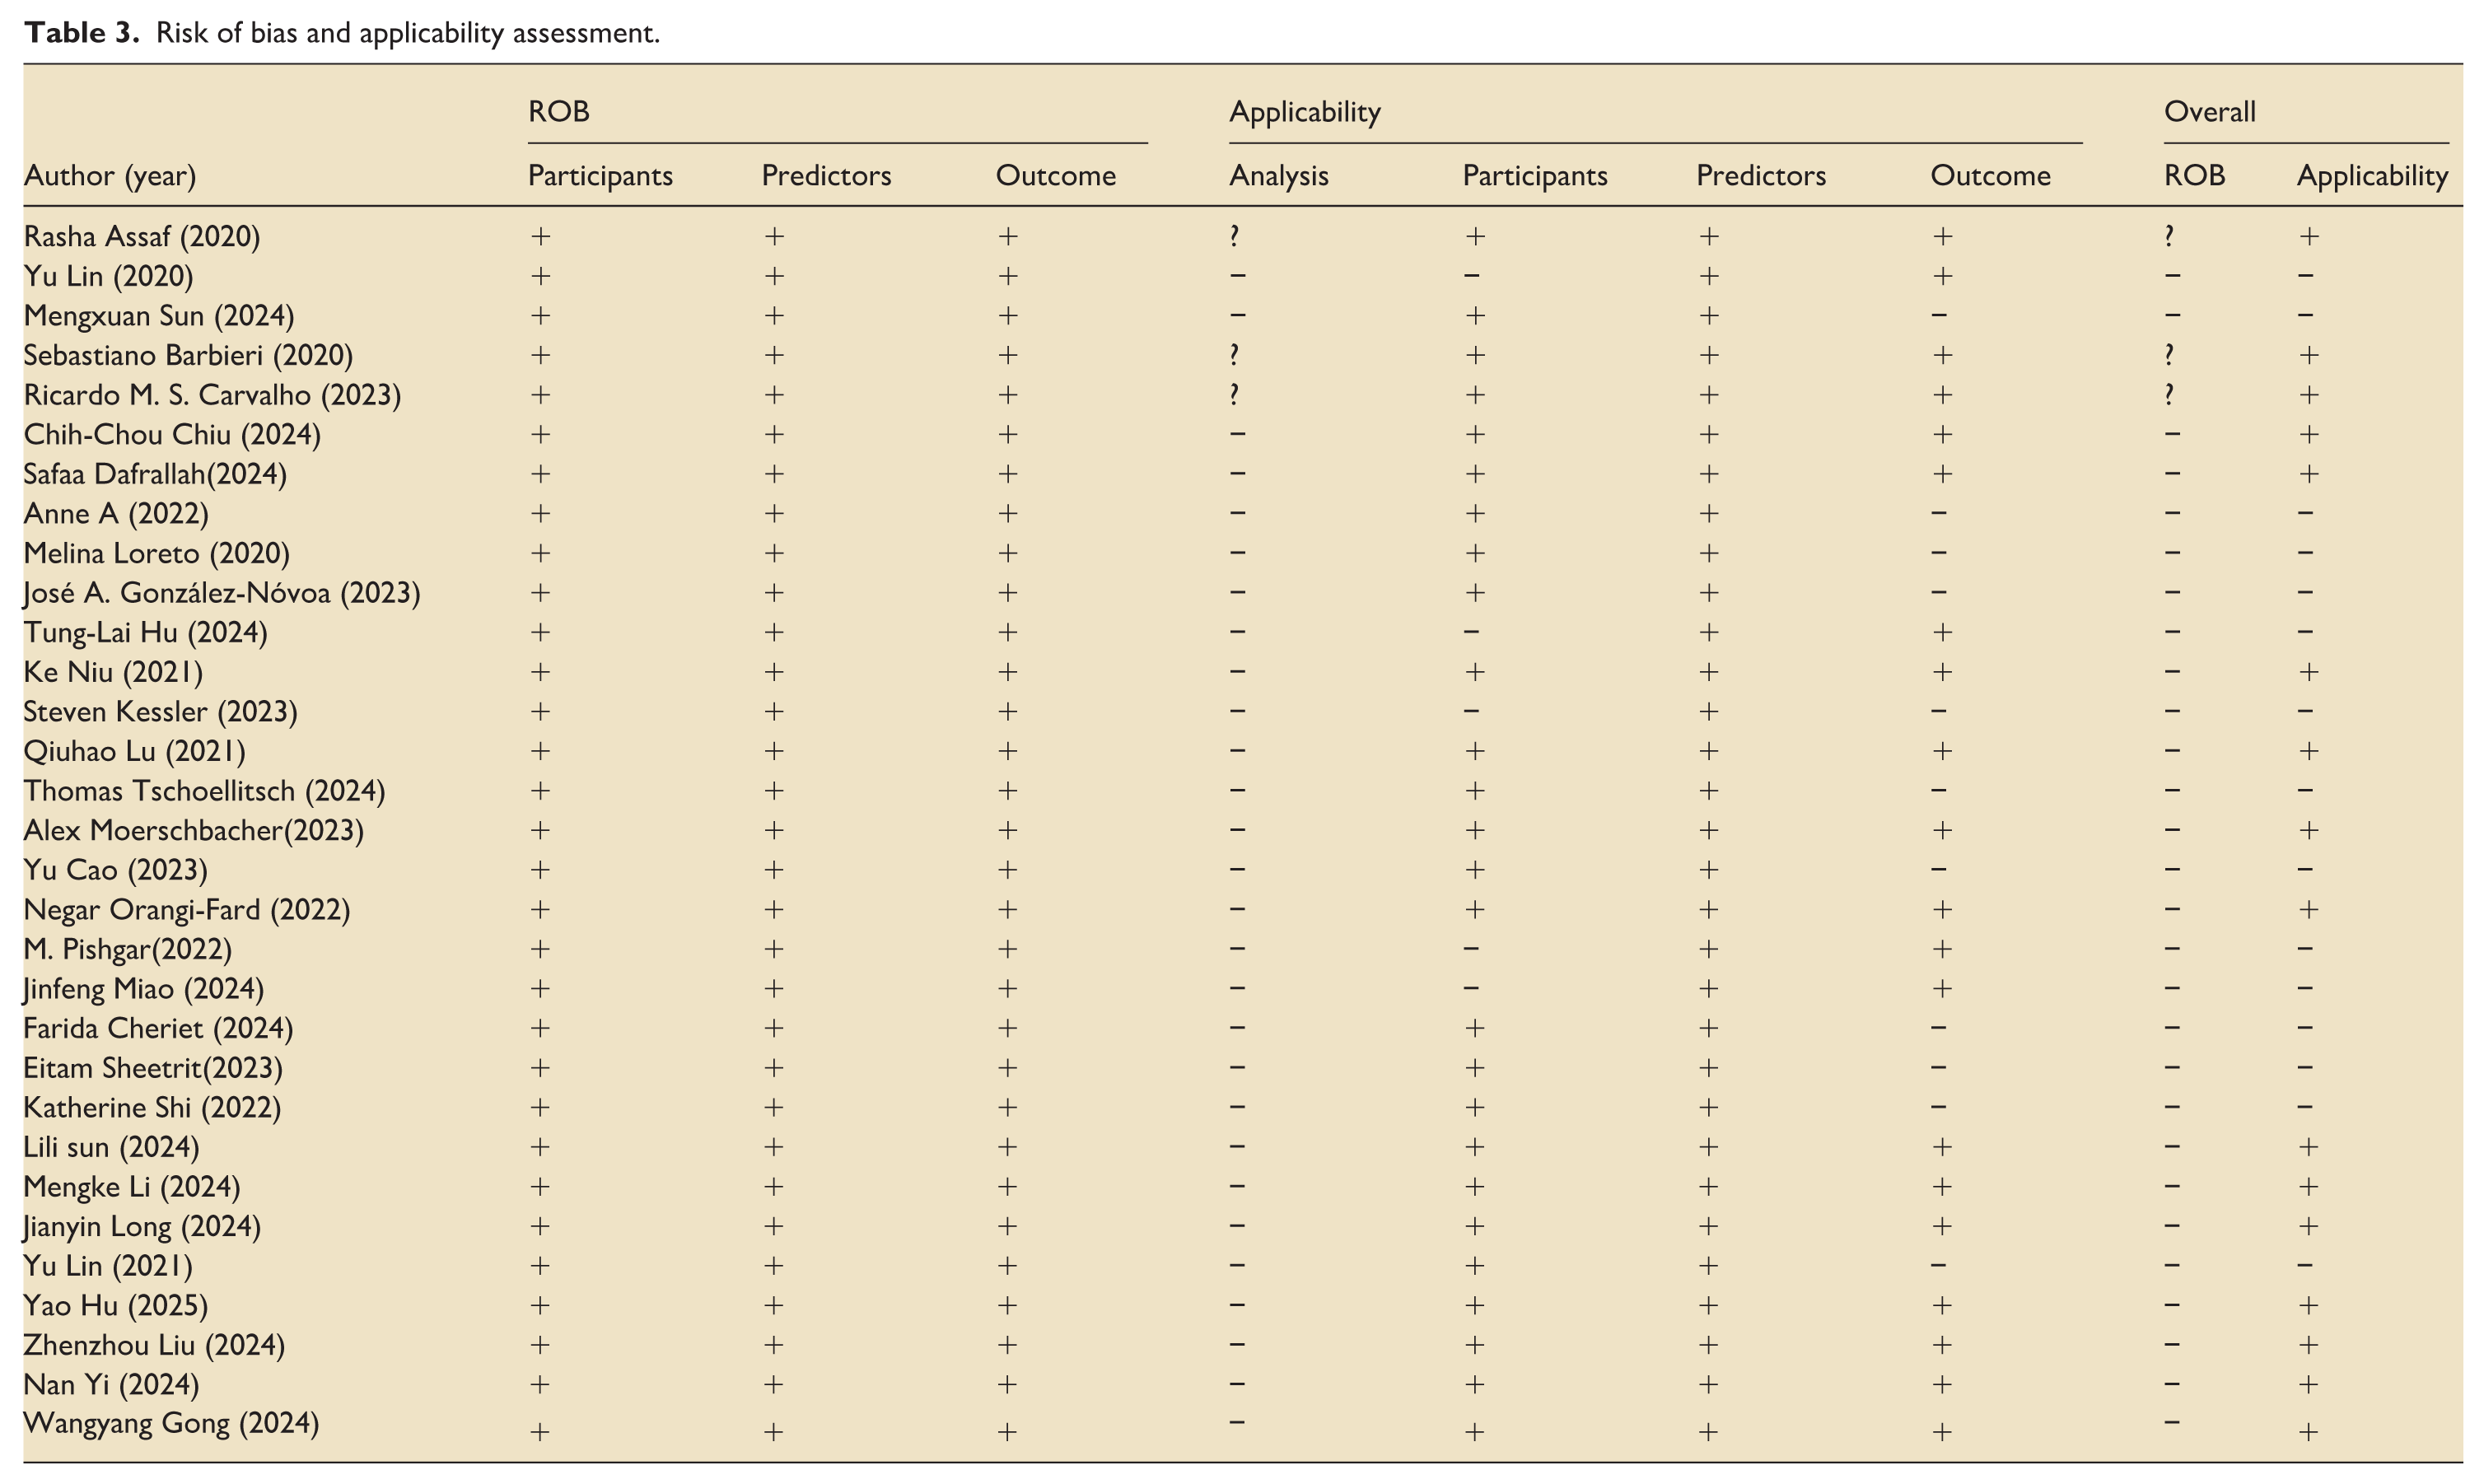
In terms of applicability, 15 studies10,12,19,21,23–25,36–38,41–45 were classified as high risk, while 169,11,20,22,26–35,39,40 were classified as low risk. Five studies10,21,24,36,42 involved ICU patients with other diseases, so they were classified as high risk.
Meta-analysis of included studies
Two article was excluded due to incomplete reporting of positive sample information, and 5 articles were excluded as they involved other diseases. Finally, 24 studies met the criteria for analysis. Using a random-effects model, the pooled AUC was calculated as 0.818, with a 95% confidence interval of 0.77–0.87. Cochran’s Q value was 21,068.89 (p < 0.001), indicating significant heterogeneity among the studies. The H value was 30.266, with a 95% confidence interval of (11.366–49.569). The H value was much greater than 1, and the confidence interval did not include 1, further confirming significant heterogeneity between studies. The I2 value was 99.9%, with a 95% confidence interval of (99.2%, 100%). This means that approximately 99.9% of the total variation was caused by heterogeneity between studies, and only 0.1% was due to sampling error. Generally, an I2 value ⩾ 50% indicates high heterogeneity, and the analysis results here show that there is very strong heterogeneity among the studies. Egger’s test indicated that there was a significant small-study effect in the overall data (intercept = −28.58, 95% CI: −40.74 to −16.42, t = −4.87, p = 0.000), suggesting the presence of publication bias. After excluding one study, 27 Egger’s test showed that the small-study effect was no longer significant (intercept = −3.15, 95% CI: −14.54 to 8.25, t = −0.57, p = 0.572), indicating that publication bias has been effectively controlled. This suggests that the publication bias in the original data was mainly driven by this outlier; after its removal, the distribution of effect sizes between small-sample and large-sample studies became more symmetric. Combined with the stability of the pooled effect size (AUC slightly adjusted from 0.818 to 0.810), the robustness of the core conclusion is enhanced. Given that the change in pooled AUC was insignificant before and after excluding this study, it suggests that its impact on the overall effect size was limited. To maintain data integrity and analytical consistency, this study was not excluded in subsequent subgroup analyses, aiming to more comprehensively reflect the true effect distribution across different subgroups (Figure 2).
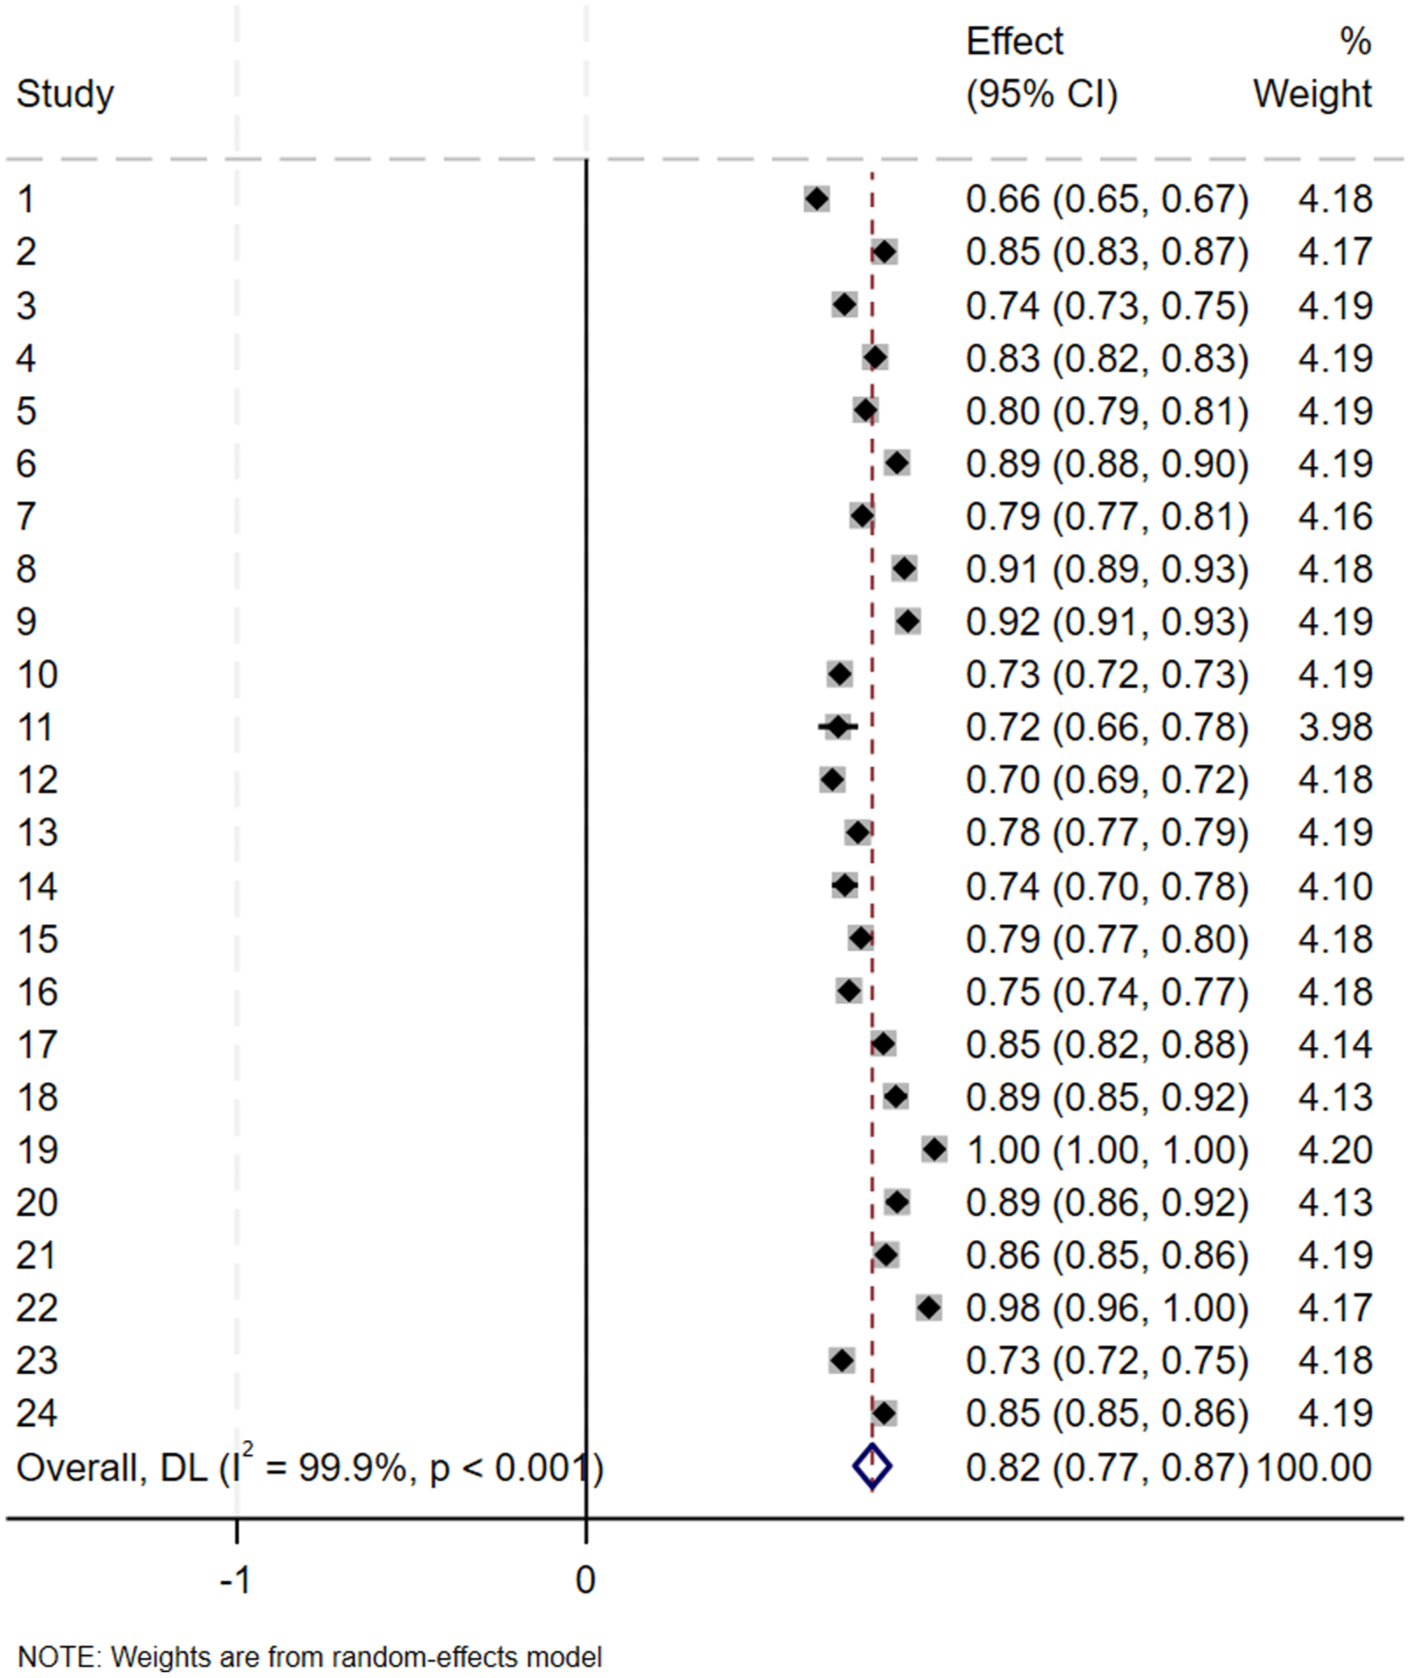
Forest plot of the random effects meta-analysis of pooled AUC estimates for 24 validation models.
Subgroup analyses
Subgroup analysis by outcome indicator
Among the included studies, 9 used 30-day readmission as the outcome indicator, 2 used 7-day readmission, and the remaining studies either did not specify the time frame or used 48-h readmission. Therefore, subgroup analysis was performed based on the duration of readmission. For 30-day readmission, the pooled AUC was 0.77(95% CI: 0.73–0.81). For 7-day readmission, the pooled AUC was 0.82 (95% CI: 0.76–0.88). For other time frames, the pooled AUC was 0.85 (95% CI: 0.79–0.91). The heterogeneity test between subgroups showed a certain difference (p = 0.071), indicating that classification by readmission time could explain the heterogeneity to some extent. However, within the 30-day and 7-day subgroups, I2 > 50%, suggesting that other uncontrolled factors may still exist among studies within these subgroups (Figure 3).
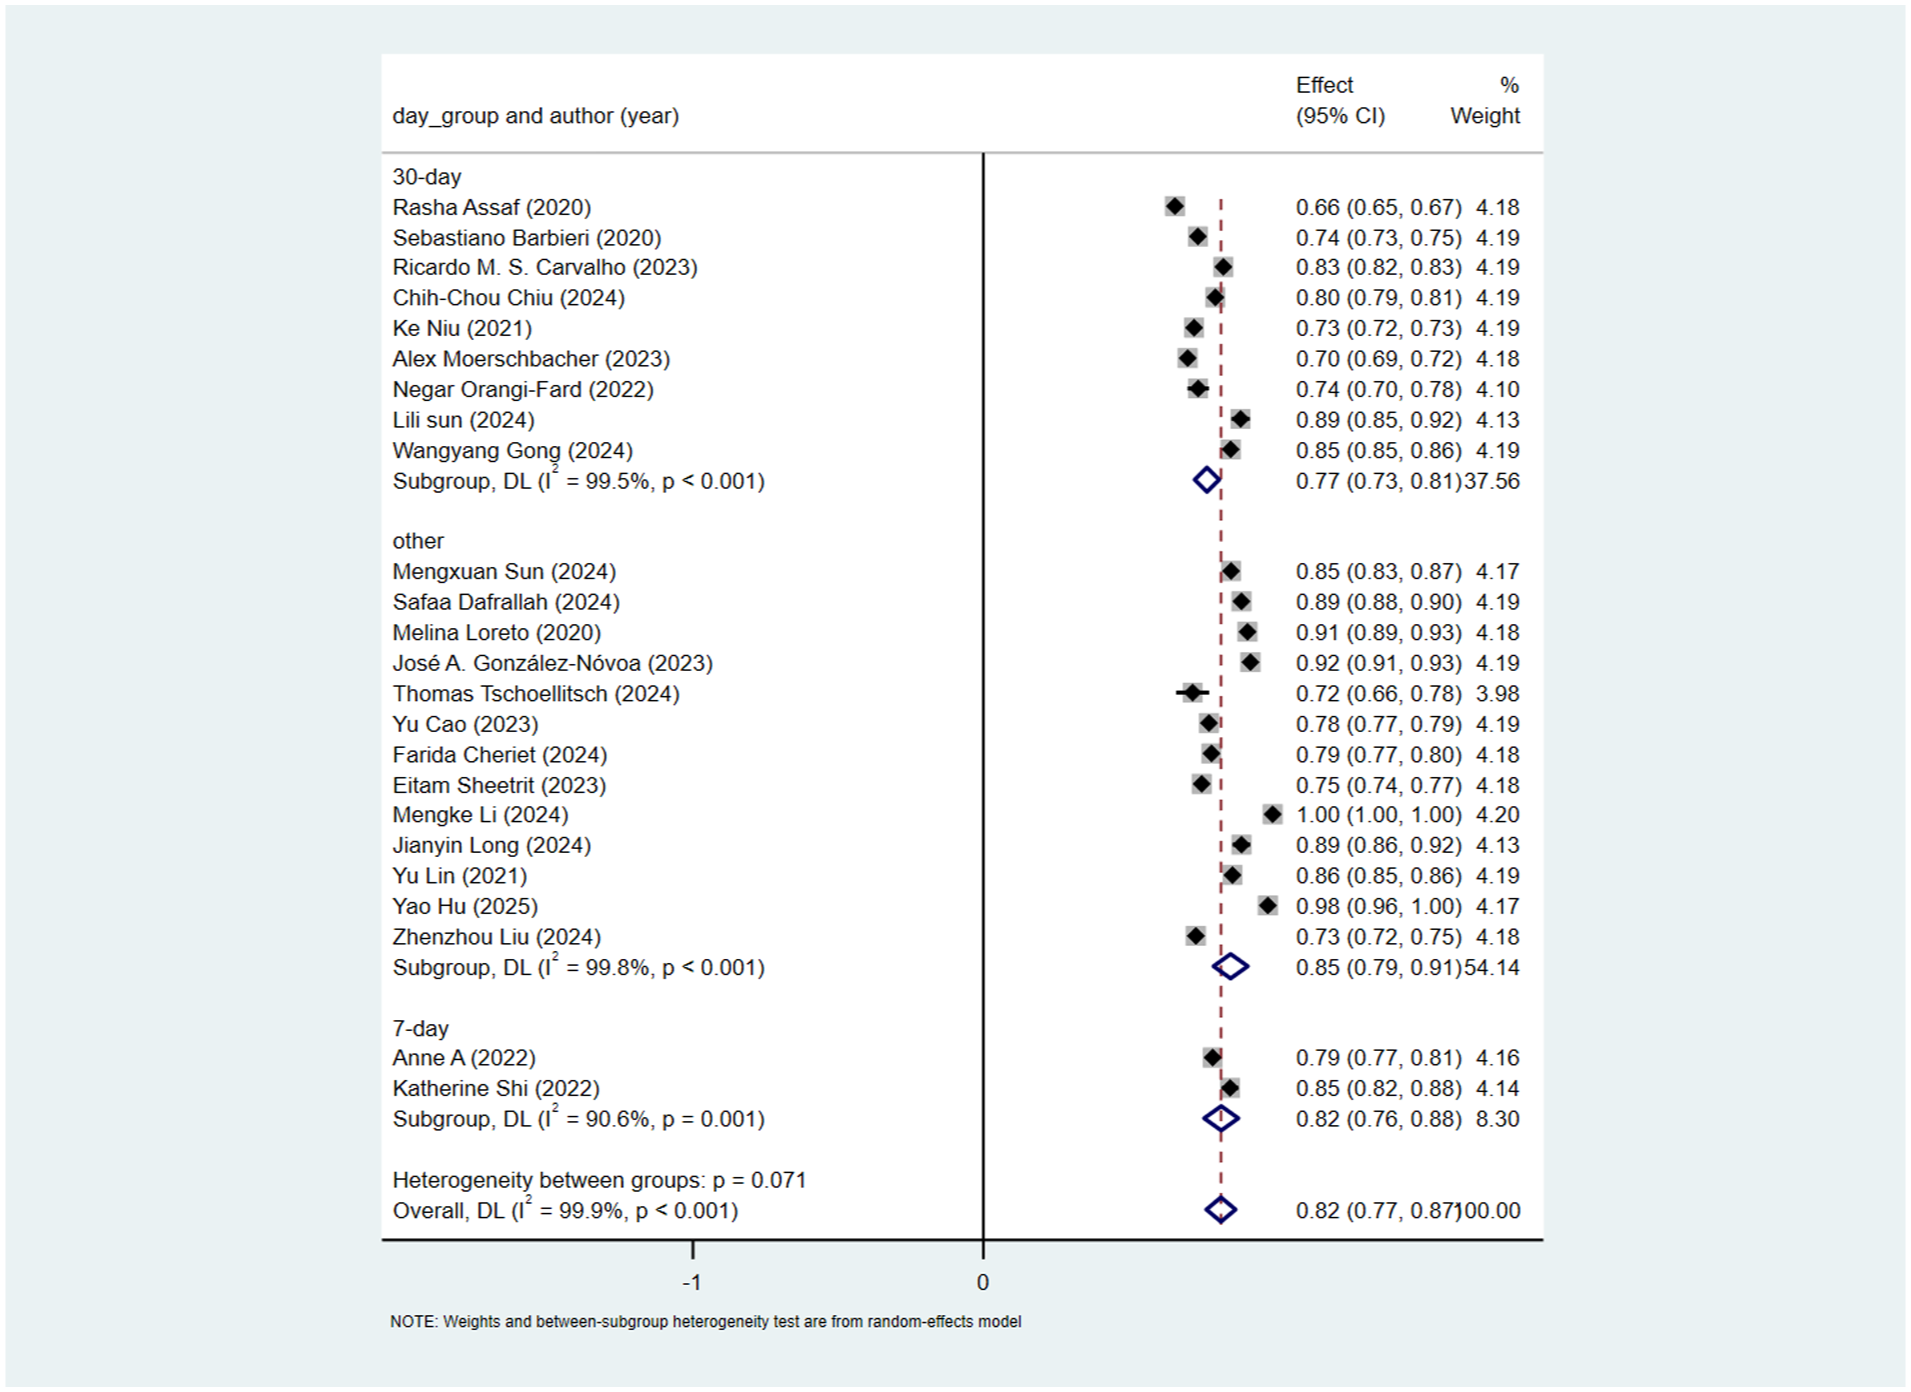
Subgroup analysis by outcome indicator.
Subgroup analysis by database source
13 studies used the MIMICIII database, and 6 used multicenter data. Subgroup analysis was thus conducted for these two sources. For studies using the MIMICIII database, the pooled AUC calculated by the random-effects model was 0.78 (95% CI: 0.74–0.81). For studies using multicenter data, the pooled AUC calculated by the random-effects model was 0.86 (95% CI: 0.81–0.91). The heterogeneity test between subgroups showed a significant difference (p = 0.01), indicating that database source could significantly explain the heterogeneity. However, high heterogeneity remained within each subgroup (I2 = 99.4% for MIMICIII and 98.0% for multicenter data), suggesting other uncontrolled factors among studies within these subgroups (Figure 4).
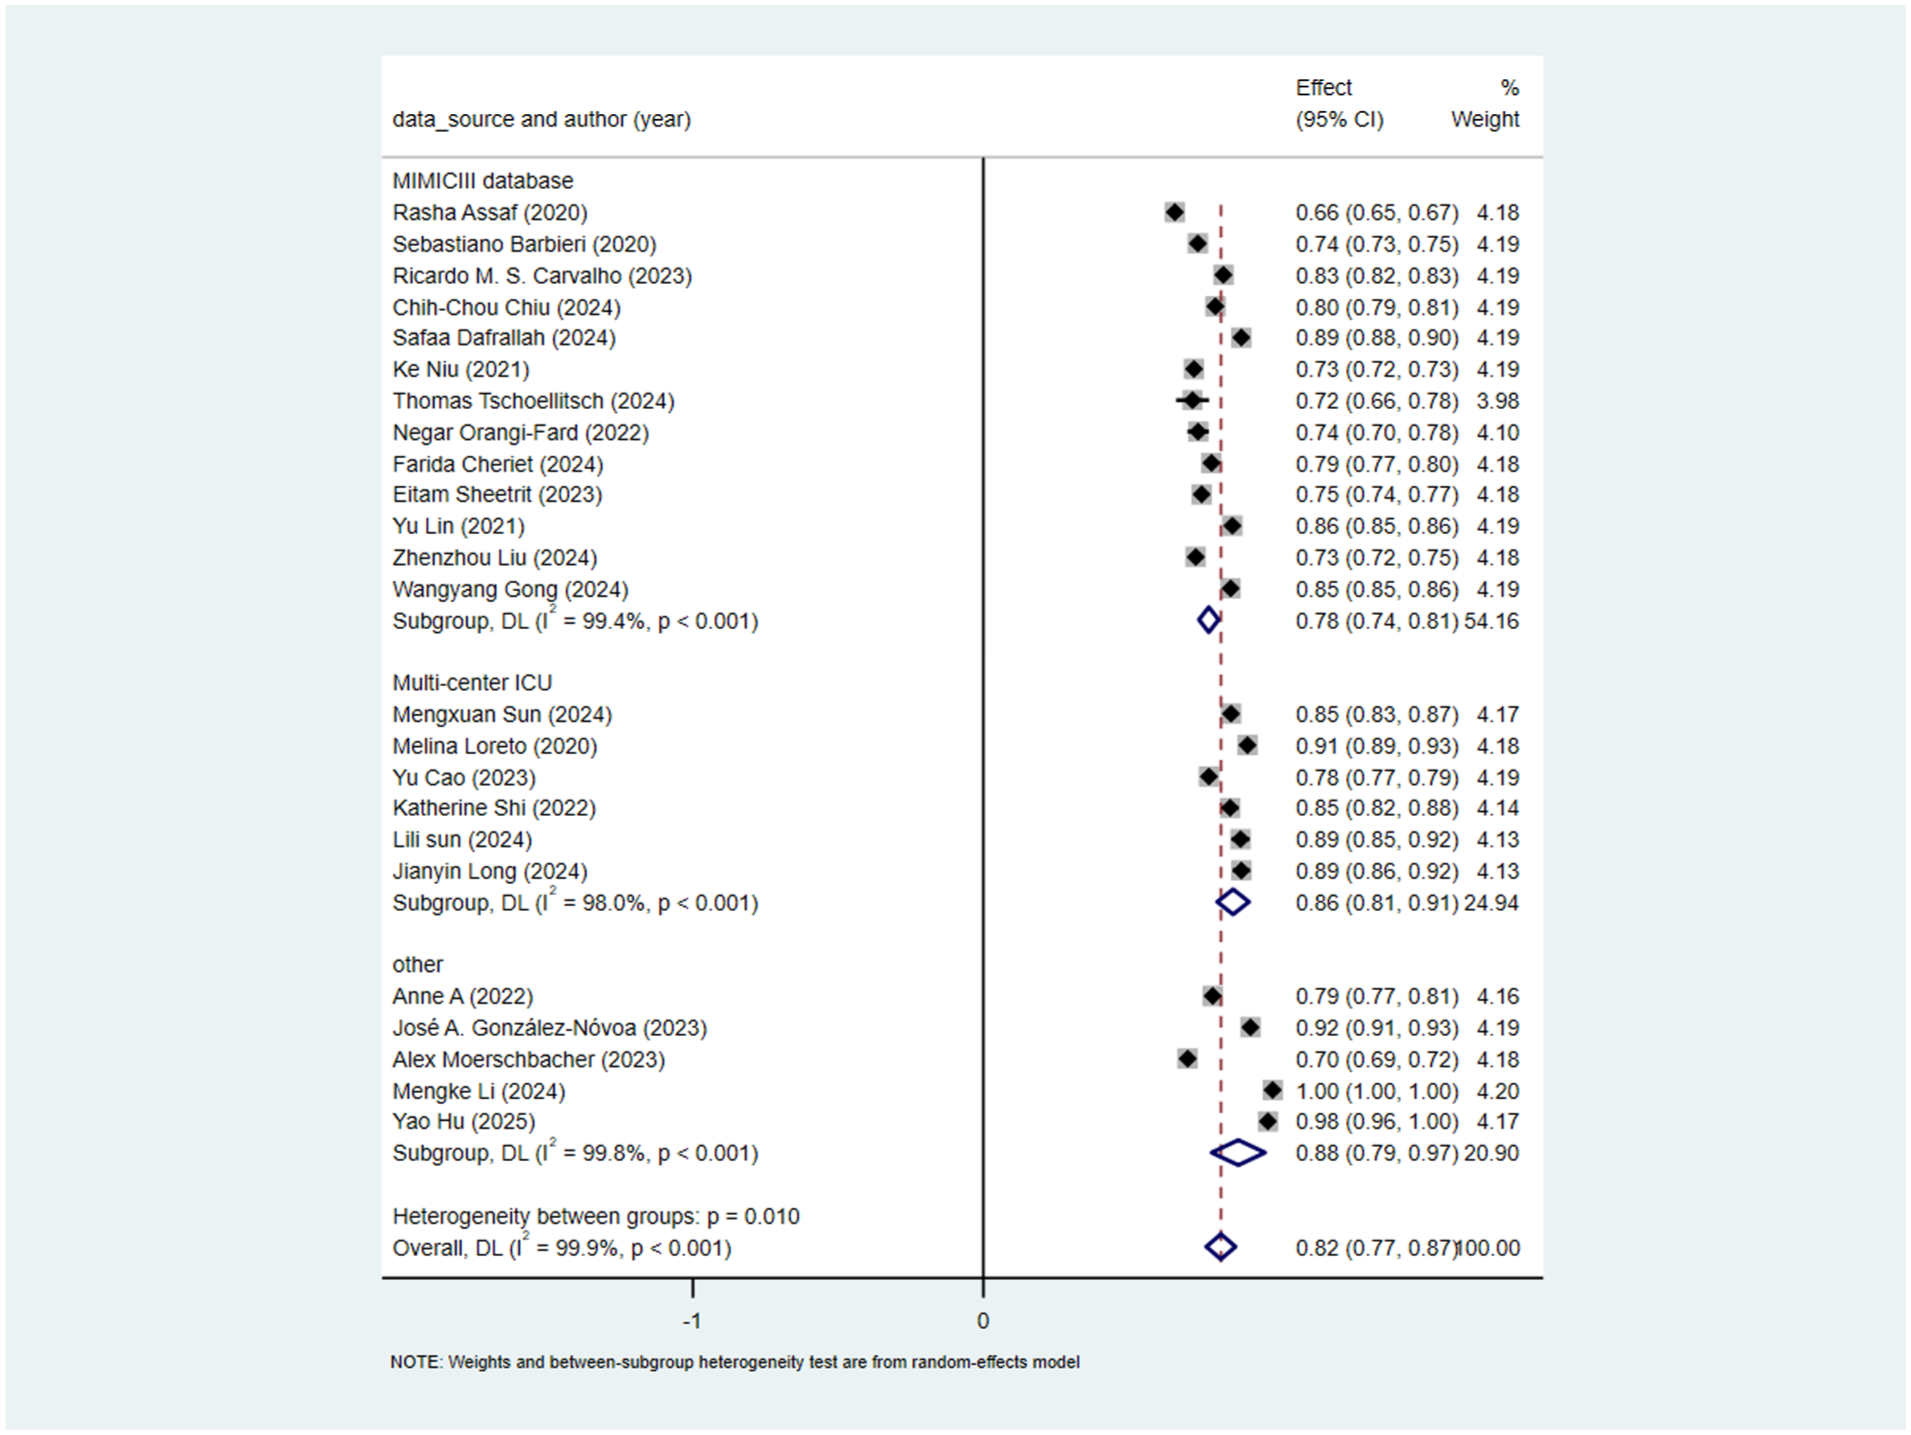
Subgroup analysis by database source.
Subgroup analysis by model type
17 studies used machine learning, 5 used deep learning, and only 2 used a hybrid model. Subgroup analysis by model type showed. For machine learning studies, the pooled AUC was 0.83(95% CI: 0.78–0.89). For deep learning studies, the pooled AUC calculated by the random-effects model was 0.78 (95% CI: 0.75–0.82). The heterogeneity test between subgroups was non-significant (p = 0.335), indicating that model type could not explain the observed heterogeneity (Figure 5).
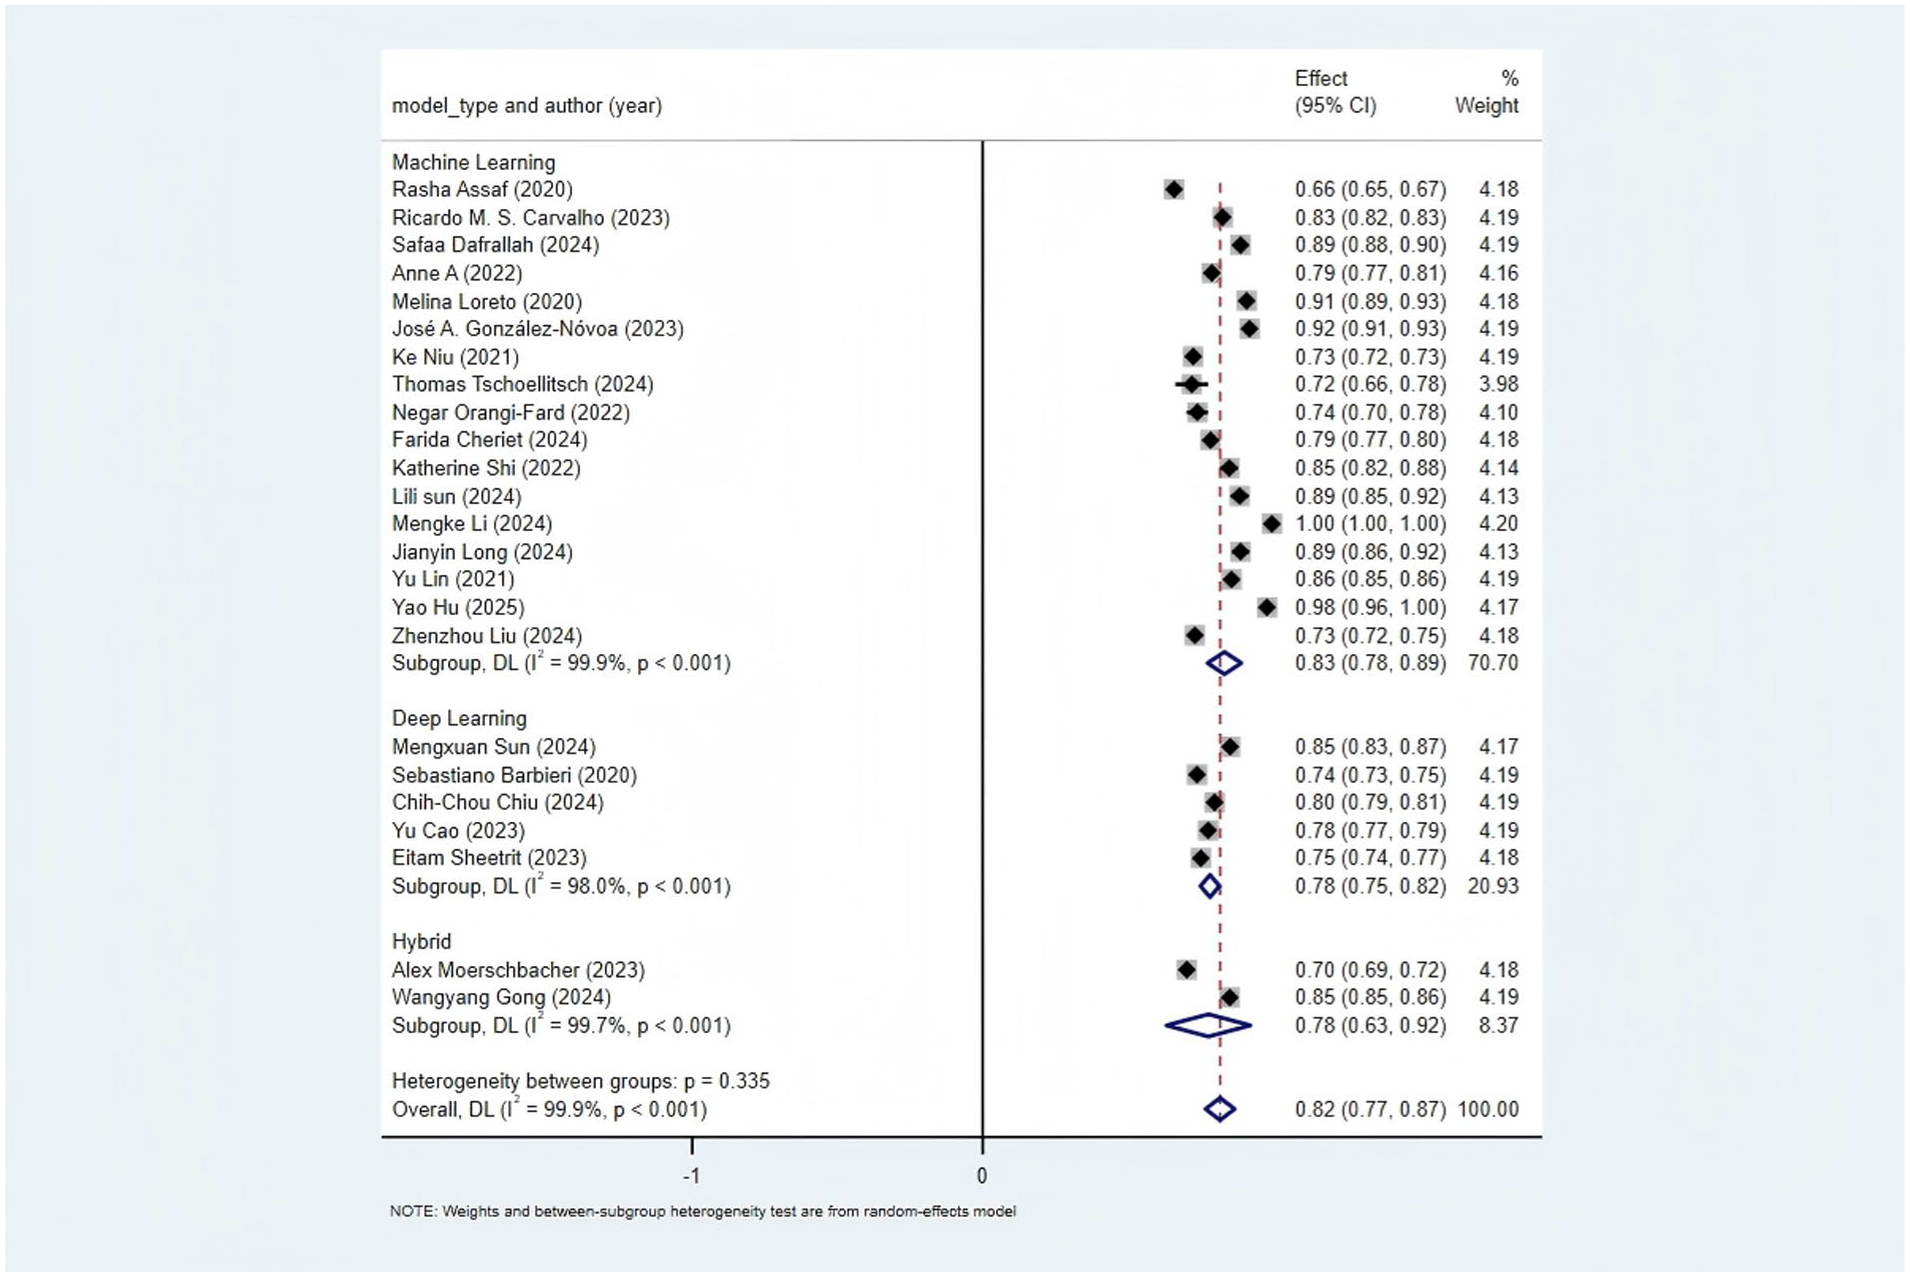
Subgroup analysis by model type.
Subgroup analysis by predictor type
Seventeen studies used structured data, five used mixed data, and two used unstructured data. Subgroup analysis by predictor type showed. For studies using structured data, the pooled AUC was 0.83 (95% CI: 0.77–0.89). For studies using mixed data, the pooled AUC calculated by the random-effects model was 0.79 (95% CI: 0.75–0.83). For studies using unstructured data, the pooled AUC calculated by the random-effects model was 0.82 (95% CI: 0.67–0.96). The heterogeneity test between subgroups was non-significant (p = 0.556), indicating that predictor type could not explain the observed heterogeneity (Figure 6).
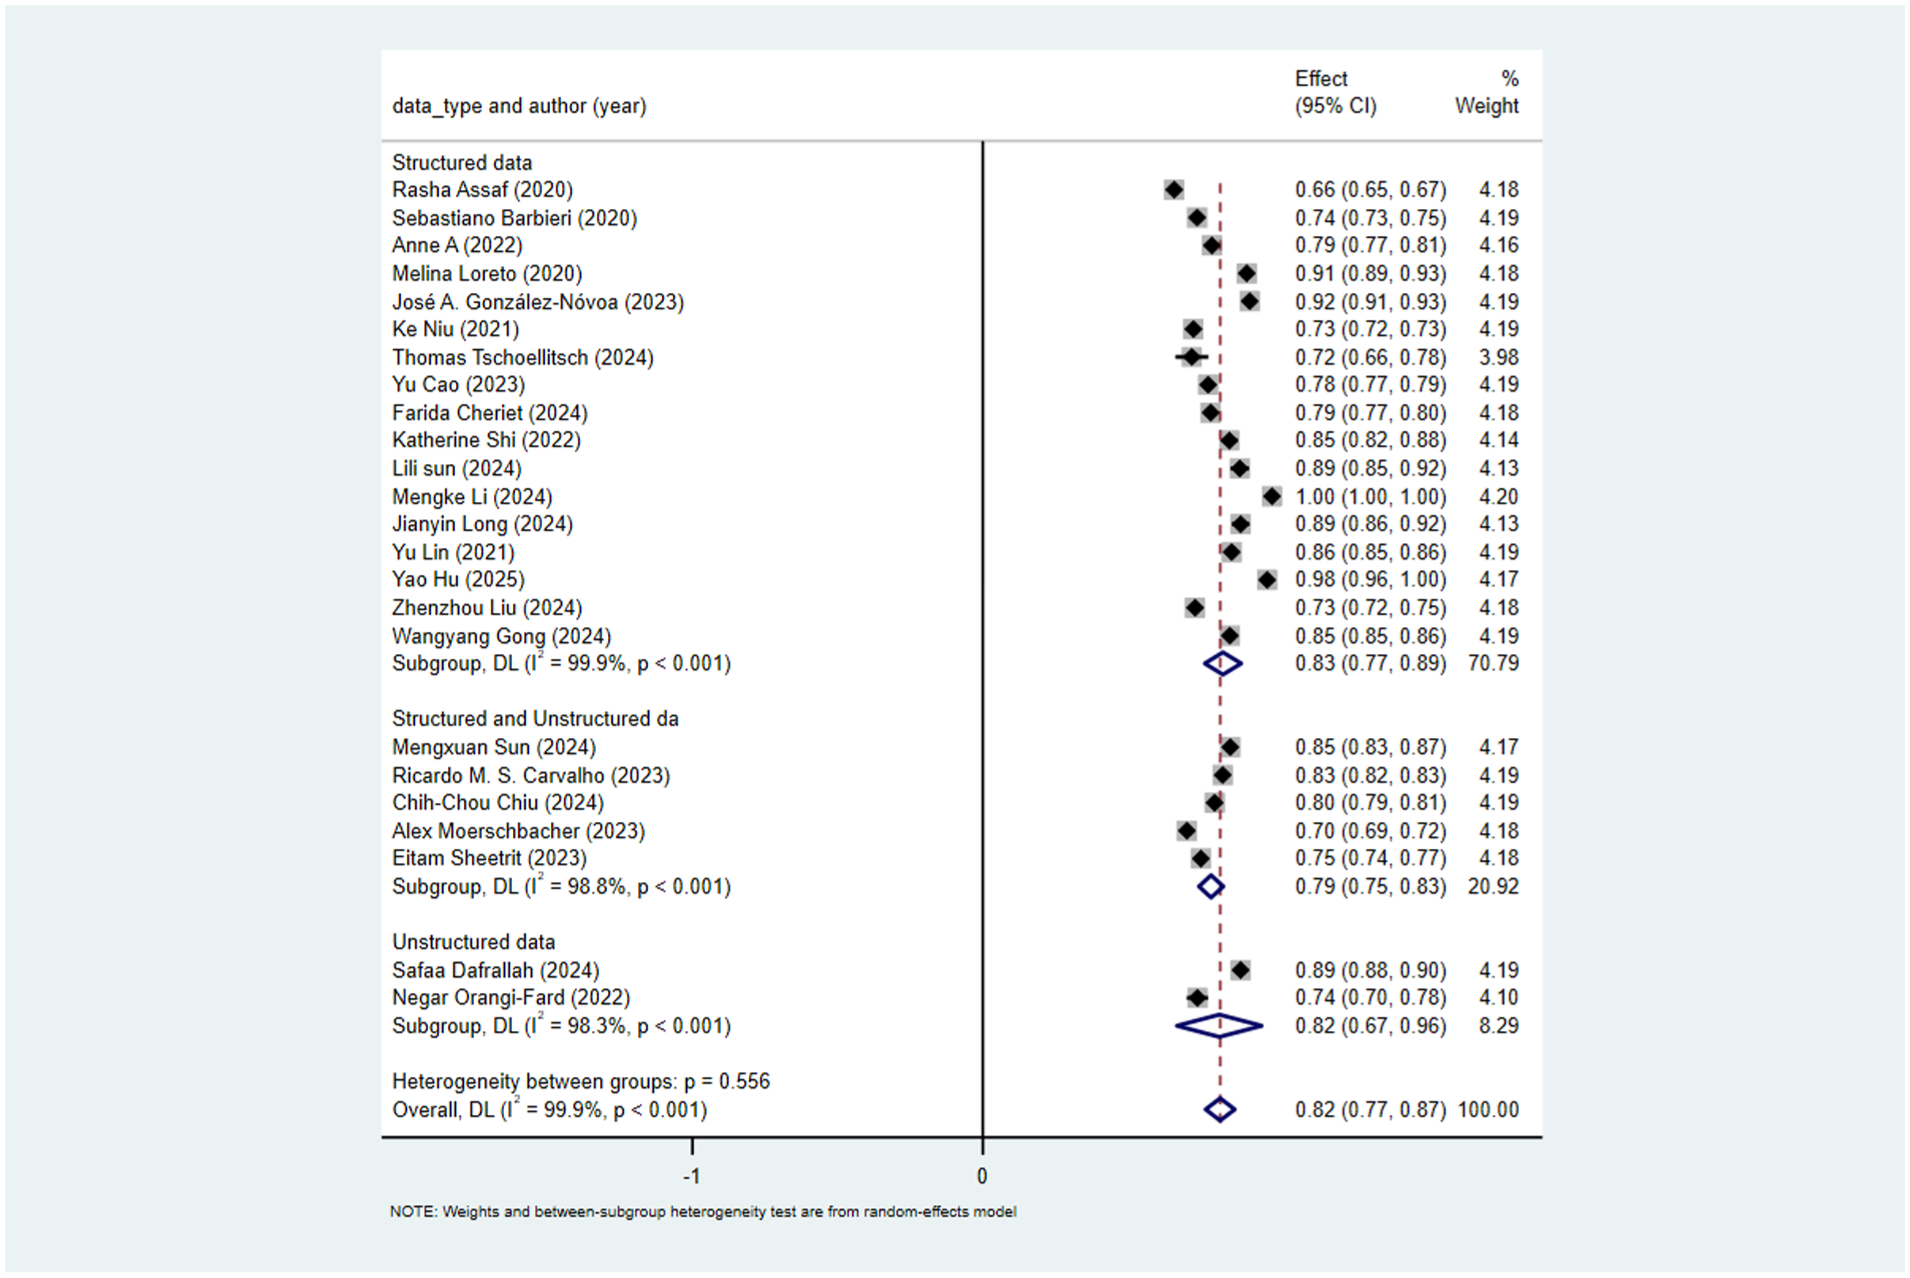
Subgroup analysis by predictor type.
Discussion
Overall performance advantages of AI-based readmission prediction models
After conducting a systematic review and meta-analysis of readmission prediction models, this study found that machine learning and deep learning algorithms demonstrated significantly higher predictive performance than existing traditional models. This finding is consistent with the results of previous similar meta-analyses, suggesting the potential application value of intelligent algorithms in readmission risk assessment. In terms of specific performance data, all but one of the models included in this study showed moderate to high predictive performance.
Further analysis revealed that in the scenario of short-term readmission prediction (48 h/7 days), AI models exhibited more stable performance and significantly stronger correlations with pre-discharge acute indicators (e.g. heart rate, inflammatory factors), thus possessing clear clinical application value. However, in 30-day readmission prediction, due to significant inter-study heterogeneity and mixed etiologies of readmission (e.g. poor management of chronic diseases, new-onset conditions, etc.), the correlation between the models and pre-discharge readiness indicators was weak, resulting in limited clinical predictive value.
Meanwhile, this study also observed that most of the included studies currently relied on single or a small number of database datasets, and model validation was mostly limited to internal cross-validation, with a general lack of independent external validation, which cast doubts on the models’ generalization ability. Based on this, future studies should, on the one hand, focus on further exploring short-term readmission prediction models to better meet clinical practical needs; on the other hand, prioritize validating newly developed models through independent external datasets to improve the reliability of results, and further concentrate on the algorithm optimization of short-term models and their application validation in real-world settings.
Heterogeneity analysis of predictors and suggestions for future optimization
There are significant differences in the predictors used across different studies. For instance, in terms of quantity, the number of predictors varies greatly between studies. Hu et al. 21 used 22 predictive variables, while Loreto et al. 12 utilized 134 pieces of in-hospital information, and some studies did not clearly specify the exact number. In terms of extraction methods, there are also substantial differences. Lin et al. 10 used admission type, vital signs, and laboratory results. Sun et al. 19 combined ICD9 diagnosis codes and drug codes. Dafrallah and Akhloufi 40 extracted 99 features from discharge summaries. Moerschbacher and He 34 integrated laboratory results and discharge summaries. These significant differences in the quantity and extraction methods of predictors may be one of the causes of heterogeneity. Currently, cutting-edge research tends to combine structured data with unstructured data to improve prediction performance. Future studies may further explore the deep integration of multimodal data and interpretable feature extraction.
Subgroup analysis of readmission time windows and heterogeneity-driven factors
In the subgroup analysis, the predictive performance for 7-day readmission and readmission within other short-time windows was significantly higher than that for 30-day readmission. However, it should be noted that the 7-day subgroup included only two studies, which may overestimate the stability of the area under the receiver operating characteristic curve (AUC). Meanwhile, studies with other time windows did not clearly define the readmission outcome, further increasing the complexity of interpreting the results. Of greater note, the definition of readmission across the included studies spanned a substantial range (from 48 h to 30 days). This variation is the core source of heterogeneity leading to divergent predictive performance among subgroups with different time windows, primarily driven by two key factors:
First, the timeliness of predictors directly determines their predictive value over time. For 48-h readmission prediction, vital signs serve as core predictors, with heart rate being particularly critical. Within 48 h after discharge, patients’ heart rate remains relatively stable and closely reflects residual acute conditions (e.g. uncontrolled infection or hemodynamic instability), making it a reliable signal for models to capture. Even when extended to 7 days, some short-term indicators can still maintain a certain level of predictive efficacy. However, when the time window is further expanded to 30 days, patients’ heart rate gradually returns to baseline or fluctuates due to post-discharge care adjustments. This significantly weakens its correlation with readmission risk and consequently reduces its predictive utility. Additionally, other short-term predictors also exhibit a trend of decreasing predictive power over time.
Second, there are fundamental differences in the etiology of readmission across different time windows. Short-term readmissions (48 h, 7 days) are mostly triggered by acute, unresolved clinical issues—such as post-discharge recurrence of infection, inadequate control of acute symptoms, or recent treatment-related complications (e.g. surgical site bleeding). These etiologies have clear associations with pre-discharge clinical indicators. In contrast, 30-day readmissions are more likely linked to long-term factors or external confounding factors, including poor management of chronic comorbidities (e.g. uncontrolled hypertension), poor post-discharge medication adherence, or new-onset health problems unrelated to the initial admission diagnosis. These complex, mixed etiologies introduce significant data noise, diluting the strength of the association between pre-discharge predictors and readmission outcomes. Ultimately, this results in a significantly lower AUC for 30-day readmission prediction models compared to short-term models.
Therefore, the readmission time window is a key variable affecting the performance of prediction models, and results must be interpreted in conjunction with clinical needs and data quality. The excellent performance of short-term models stems not only from clearer predictive signals but may also reflect higher clinical utility (e.g. supporting short-term post-discharge risk monitoring). Future studies should prioritize exploring short-term readmissions (e.g. 48 h, 7 days) and unify and clarify the definition of readmission to reduce the impact of heterogeneity on the reliability of results.
Subgroup analysis of database sources and directions for data quality improvement
In the subgroup analysis, the prediction performance of multicenter databases was higher than that of the single MIMIC-III database. The inter-group heterogeneity p = 0.01 indicates that the grouping by database source can significantly explain the heterogeneity. MIMIC-III is a single-center dataset, which may lack population diversity and have geographical, ethnic, and temporal biases. MIMIC-III data were collected from 2001 to 2012 in the United States, which may not reflect the impact of current diagnosis and treatment technologies. Additionally, MIMIC-III has a large number of missing values. However, some studies did not mention their handling methods or directly deleted missing values. For example, Orangi-Fard et al. 35 had a sample size of only 236 cases and did not report their handling methods; if the missing rate is high, the reliability of the results is questionable. Sun et al. 19 clearly used “multimodal data complementation” to handle missing values. It is recommended that future studies clearly report the proportion of missing values and their handling methods, use the latest MIMIC-IV database, and combine it with multicenter databases.
Application status and clinical value of model interpretability
Shapley Additive Explanations (SHAP) were used to interpret the models’ predictions. SHAP techniques explain the internal workings of models, including feature importance ranking and threshold identification. Only two studies38,40 used SHAP. Through SHAP analysis, certain features that significantly influenced the models’ decision-making processes were identified, such as “Chest Pain” and “Infarct.” This approach helps clinicians understand how models make predictions and which features are most influential, providing valuable insights for clinical practice and future research.
Causes of bias
One of the main drivers behind the significant bias risk in models arises from the information asymmetry present in how results are disseminated by model development and promotion teams. These teams typically obscure algorithmic logic and training data features, hindering clinicians from performing targeted validation and directly causing adaptability bias in models; they selectively highlight optimal performance metrics from internal validation or specific advantageous subgroups while ignoring crucial limitations like markedly reduced outcomes in external validation, misjudgment rates in high-risk groups, and unclear definitions of readmission timeframes, thus creating performance evaluation bias; they portray models crafted for specific populations as “universally applicable,” intentionally sidestepping issues of inadequate adaptability in vulnerable groups, intensifying fairness bias; they focus solely on statistical performance without providing relevant evidence of the actual effectiveness of models in guiding clinical decisions, resulting in a gap between “predictive performance” and “clinical practice,” forming decision application bias. Fundamentally, these actions mask the genuine limitations of models by establishing information barriers, ultimately increasing the overall bias risk in research.
Elucidating these bias sources can offer clinicians critical insights for rigorously assessing relevant model results and minimizing decision-making deviations in practical applications, further boosting the clinical reference value and universality of the manuscript.
Clinical application of models
Readmission prediction models have been progressively utilized to adjust patient transfer processes, enhancing clinical practice via risk stratification, tailored interventions, and clinical decision support. For instance, a commercial AI model within an enterprise healthcare system in a major metropolitan area decreased the 30-day readmission rate of Medicare patients from 15.7% to 13%. 46 In studies concerning chronic heart failure patients, models integrated with the IKAP theory in personalized nursing procedures markedly cut down unplanned readmission rates and bettered various patient indicators. 47 The NYUTron model reached a prediction accuracy of 80% and has been employed for over 50,000 patients, detecting about 15% of previously neglected high-risk patients. 48 The PHarmacie-R application boosted the efficiency of identifying high-risk patients by 30% and gave priority to post-discharge medication assessments, confirming the feasibility of model-assisted processes. 49 Most applications have yielded remarkable outcomes, with a 2%–7% decline in readmission and emergency visit rates, as well as optimized distribution of medical resources.
Although the extensive clinical use of models is still restricted, current readmission prediction models have the potential to balance “admission demand” and “transfer risk,” mainly depending on accurate risk stratification. By quantifying patients’ readmission risk (low, medium, high), models can be directly connected to clinical decisions: low-risk patients, with a slim chance of readmission after discharge, can be transferred as scheduled or even slightly ahead of time to meet the hospital’s “admission demand” without considerably increasing patient safety risks; medium-risk patients can get strengthened nursing interventions after being transferred from the ICU, ensuring patient safety while preventing excessive ICU bed occupation; high-risk patients, for whom direct discharge would greatly raise readmission rates and mortality, need proper delayed transfer to finish discharge preparation. Although beds are not instantly vacated in this situation, models can accurately recognize high-risk groups, preventing resource waste caused by “indiscriminate delayed transfer” and indirectly improving bed turnover efficiency. The effectiveness of balancing both relies on model accuracy.
To realize the integration of model accuracy, practicality, and fairness, standardized model testing (including internal bootstrap sampling, multicenter external validation, real-world scenario testing, etc.) must balance reliability and clinical adaptability; model construction should emphasize core clinical indicators and basic demographic data, with auxiliary data added as needed; and protecting vulnerable groups from marginalization requires efforts in three aspects: data representativeness, algorithmic fairness, and personalized application, with the involvement of vulnerable group representatives in model optimization.
At present, readmission models for diseases like cerebral infarction and chronic obstructive pulmonary disease are still in the construction and validation phase, and the application of models for “transfer to other departments/rehabilitation institutions” has not been tackled, which is a crucial direction for future research.
Strengths and limitations
This study is the first systematic review on the application of AI-based prediction models (including machine learning and deep learning prediction models) in ICU readmission. The main strengths of this study include conducting comprehensive literature searches across multiple databases in adherence to the PRISMA (Preferred Reporting Items for Systematic Reviews and Meta-Analyses) guidelines, having literature screening and data extraction independently carried out by researchers, and conducting detailed quality assessments and risk-of-bias assessments based on the PROBAST checklist.
The main limitation of this review is the inclusion of studies from different types of ICUs, which hinders comparability. Moreover, most of the models’ data came from the MIMIC-III database and lacked external validation, meaning these models would need adjustment for use in different regions. However, results from the PROBAST checklist indicated that all except two studies carried a high risk of bias—a limitation that may restrict the clinical translation and practical application of these models. Additionally, it should be noted that there was significant heterogeneity among the included studies, which to some extent undermined the reliability of the pooled AUC results. Based on analytical inference, this heterogeneity may be associated with various factors, such as the definition of outcome indicators, the selection of predictors, and the source of databases.
Therefore, future research should prioritize developing readmission prediction models for diverse populations. Additionally, despite multiple subgroup analyses, we were unable to identify the source of heterogeneity, limiting the applicability of our findings. Future studies should clearly report the data extraction process and missing value handling. Priority should be given to developing new models with diverse populations, rigorous study designs, and multicenter external validation. Finally, the model results should be visually interpreted.
Conclusion
This study found that in ICU readmission prediction models, AI models (including machine learning and deep learning algorithms) exhibited moderate-to-high predictive performance, and their predictive performance was significantly higher than that of traditional prediction models. Among these models, the clinical value of short-term readmission prediction models was significantly higher than that of long-term readmission prediction models. However, all current AI prediction models have a high risk of bias and generally lack external validation. Therefore, when conducting research on ICU readmission prediction models in the future, it is necessary to prioritize supplementing external validation for the models, simultaneously advance real-world application studies, and conduct interpretability analysis on the models.
Footnotes
Ethical considerations
Ethical approval were unnecessary, as the data used in this study came from already published studies.
Informed consent
Informed consent were unnecessary, as the data used in this study came from already published studies.
Author contributions
Data summary, paper writing: ZXZ and WJY. Data collation: WJY and ZXZ. Statistical analysis: WJZ, ZXZ and KC. Research guidance and revision: ZZ.
Funding
The authors received no financial support for the research, authorship, and/or publication of this article.
Declaration of conflicting interests
The authors declared no potential conflicts of interest with respect to the research, authorship, and/or publication of this article.
Data availability statement
Data sharing is not applicable to this article because no new data were created in this study.