
Abstract
Background:
The lighting environment in intensive care units (ICUs) is markedly different from natural light, potentially disrupting patients’ circadian rhythms and impacting staff wellbeing. New lighting technologies may mitigate these effects.
Methods:
A mixed methods service evaluation was conducted in a London ICU using Dyson Lightcycle™ luminaires (DLs) to evaluate staff wellbeing. Wellbeing assessments and user perceptions of the built environment were conducted using validated questionnaires before, during, and after DL deployment. Existing ambient light usage was measured using HOBO devices installed on the ceiling. Additionally, data on DL usage (including spectral data) were collected continuously using Raspberry Pi™ sensors.
Results:
DL usage was high (>70% per 24 h), primarily as supplementary lighting. Users found DLs easy to control and beneficial for clinical and administrative tasks. Participants assigned a 12.5% higher satisfaction score rated from 0 to 8 of lighting overall during deployment compared to pre-deployment (6.06 ± 0.29 and 5.06 ± 0.60, respectively; p = 0.20). Control variables for the built environment (noise, temperature and air quality) remained unchanged. Staff reported improvements in mood (38%, p < 0.001), fatigue (17.7%, p < 0.001), and sleep quality (21.2%, p = 0.01) during DL use.
Discussion:
In the first pilot feasibility service evaluation of its kind, the relationship between ICU lighting quality and staff wellbeing was investigated using DLs. We show that it is feasible to equip an ICU with a novel mode of lighting to evaluate both illuminance and user-centred outcomes. The study suggests a positive association between DL use and staff wellbeing, with notable improvements in mood, fatigue and sleep quality. The nature of the emitted light may enhance the space rather than simply illuminate, thus further adding to a feeling of wellbeing. These findings support data from studies which report effects of light brightness and colour on mood. Additionally, there appears to be a signal towards benefit to the user when additional lighting is provided, compared to the current overhead fluorescent luminaires prevalent in most ICUs. In this service evaluation these benefits were demonstrated in ICU staff operating the device. However, it is conceivable that effects such as improved mood and reduced sleep disturbance may have patient benefits too.
Conclusion:
Local lighting systems like DLs show promise in enhancing ICU staff wellbeing. Their impact on patient outcomes and the potential for broader implementation deserve further investigation in appropriately designed and powered larger-scale trials.
Background
The spectral composition, intensity, angle and temporal pattern of natural light (NL) exposure differ with season, geographical location and time of day, with intensity being greater in the summer and the middle of the day. 1
Light exposure patterns on the intensive care unit (ICU) are not natural. Electric lighting often flickers (even if this is only subconsciously detected), and the colour, tone and intensity of artificial lights are generally fixed and binary (on/off). During daytime hours, light intensity on ICUs can be 10–1000 times lower than natural daylight 2 and, especially in windowless bed spaces, changes less gradually (more abruptly) with time, and is higher by night (when it exhibits frequent peaks (up to 1000 lux) associated with patient assessment and intervention).2,3 The ICU of the Whittington Hospital (North London, UK) is, in this regard, not unrepresentative, with the usual array of bedside monitors, and limited natural light being supplemented by artificial lighting. Recessed ceiling fluorescent halogen lamps are laid out in a 600 mm × 600 mm grid for the main floor space (MFS) with additional fluorescent overhead lighting (BOL) at each bedspace. Bedside lamps (BSL) are also provided. The MFS, BSL and BOL units are either ‘on or off’, whilst the BSL and BOL can be manually dimmed. In general, MFS lights are off at night, with BOL off or on depending on bed occupation, and BSL is on or dimmed according to specific task lighting requirements. An additional small, focussed light is often used to illuminate the observation chart at each bedside or to augment illumination when a procedure or examination is required. Evidently, all lights may be selectively switched on in the event of an emergency.
Such unnatural light exposure may contribute to the disruption in biological circadian rhythms seen in patients. 4 Shorter wavelength (blue) light from monitors is more akin to that seen at midday than dawn or dusk (above), 5 suppressing central melatonin release, increasing arousal and disturbing sleep. 6 Even low levels of nocturnal light (5 lux) disrupt melatonin secretion and circadian rhythms.6,7 The resultant impacts may be far from benign: interrupted sleep can impair immune and respiratory muscle function, as well as neuroendocrine and metabolic control. 8 Neurocognitive function is also adversely impacted, sleep deprivation being a risk factor for delirium,9,10 itself associated with increased ICU morbidity and mortality.11,12 Staff may also be adversely affected by exposure to such unnatural temporal patterns, colour, tone and intensity of light: psychomotor responses may be impaired if light intensity is inappropriately low, 13 for instance, whilst (like patients) they are exposed (day and night) to blue light from monitors.
Exposure to natural light colours and diurnal cycles may improve the mental wellbeing of both staff and patients, and may enhance patient circadian (and sleep) patterns. 14 For these reasons UK ICU guidelines advise that every bedspace should have access to natural light, 15 although this is very rarely the case.
New lighting technologies exist which may help overcome these issues, as they attempt to simulate aspects of the variability of natural light by, for example, allowing its spectral composition, intensity and incident angle to be varied. We thus performed an observational pilot service evaluation of the impacts of one such technology (Dyson Lightcycle™ luminaires (DL)) on measures of ICU staff wellbeing. Data accrued will inform the design and powering of future definitive studies.
Methods
This was a mixed methods service evaluation (SE) of lighting in the ICU registered with the Whittington Hospital NHS Trust Clinical Governance Office Audit Department. Direct patient data were not collected. All users provided verbal consent prior to completing questionnaires.
Location
The SE was conducted on the mixed general ICU of the Whittington Hospital, London. The ICU has 15 beds, of which 11 in the central bay are allocated numbers 1–11 and four individual (side) rooms denoted SR 1–4. There is a staff room, used for rest during the day and sleep at night, a central nursing station in the middle of the main floor area, and a separate doctors office (Figure 1).
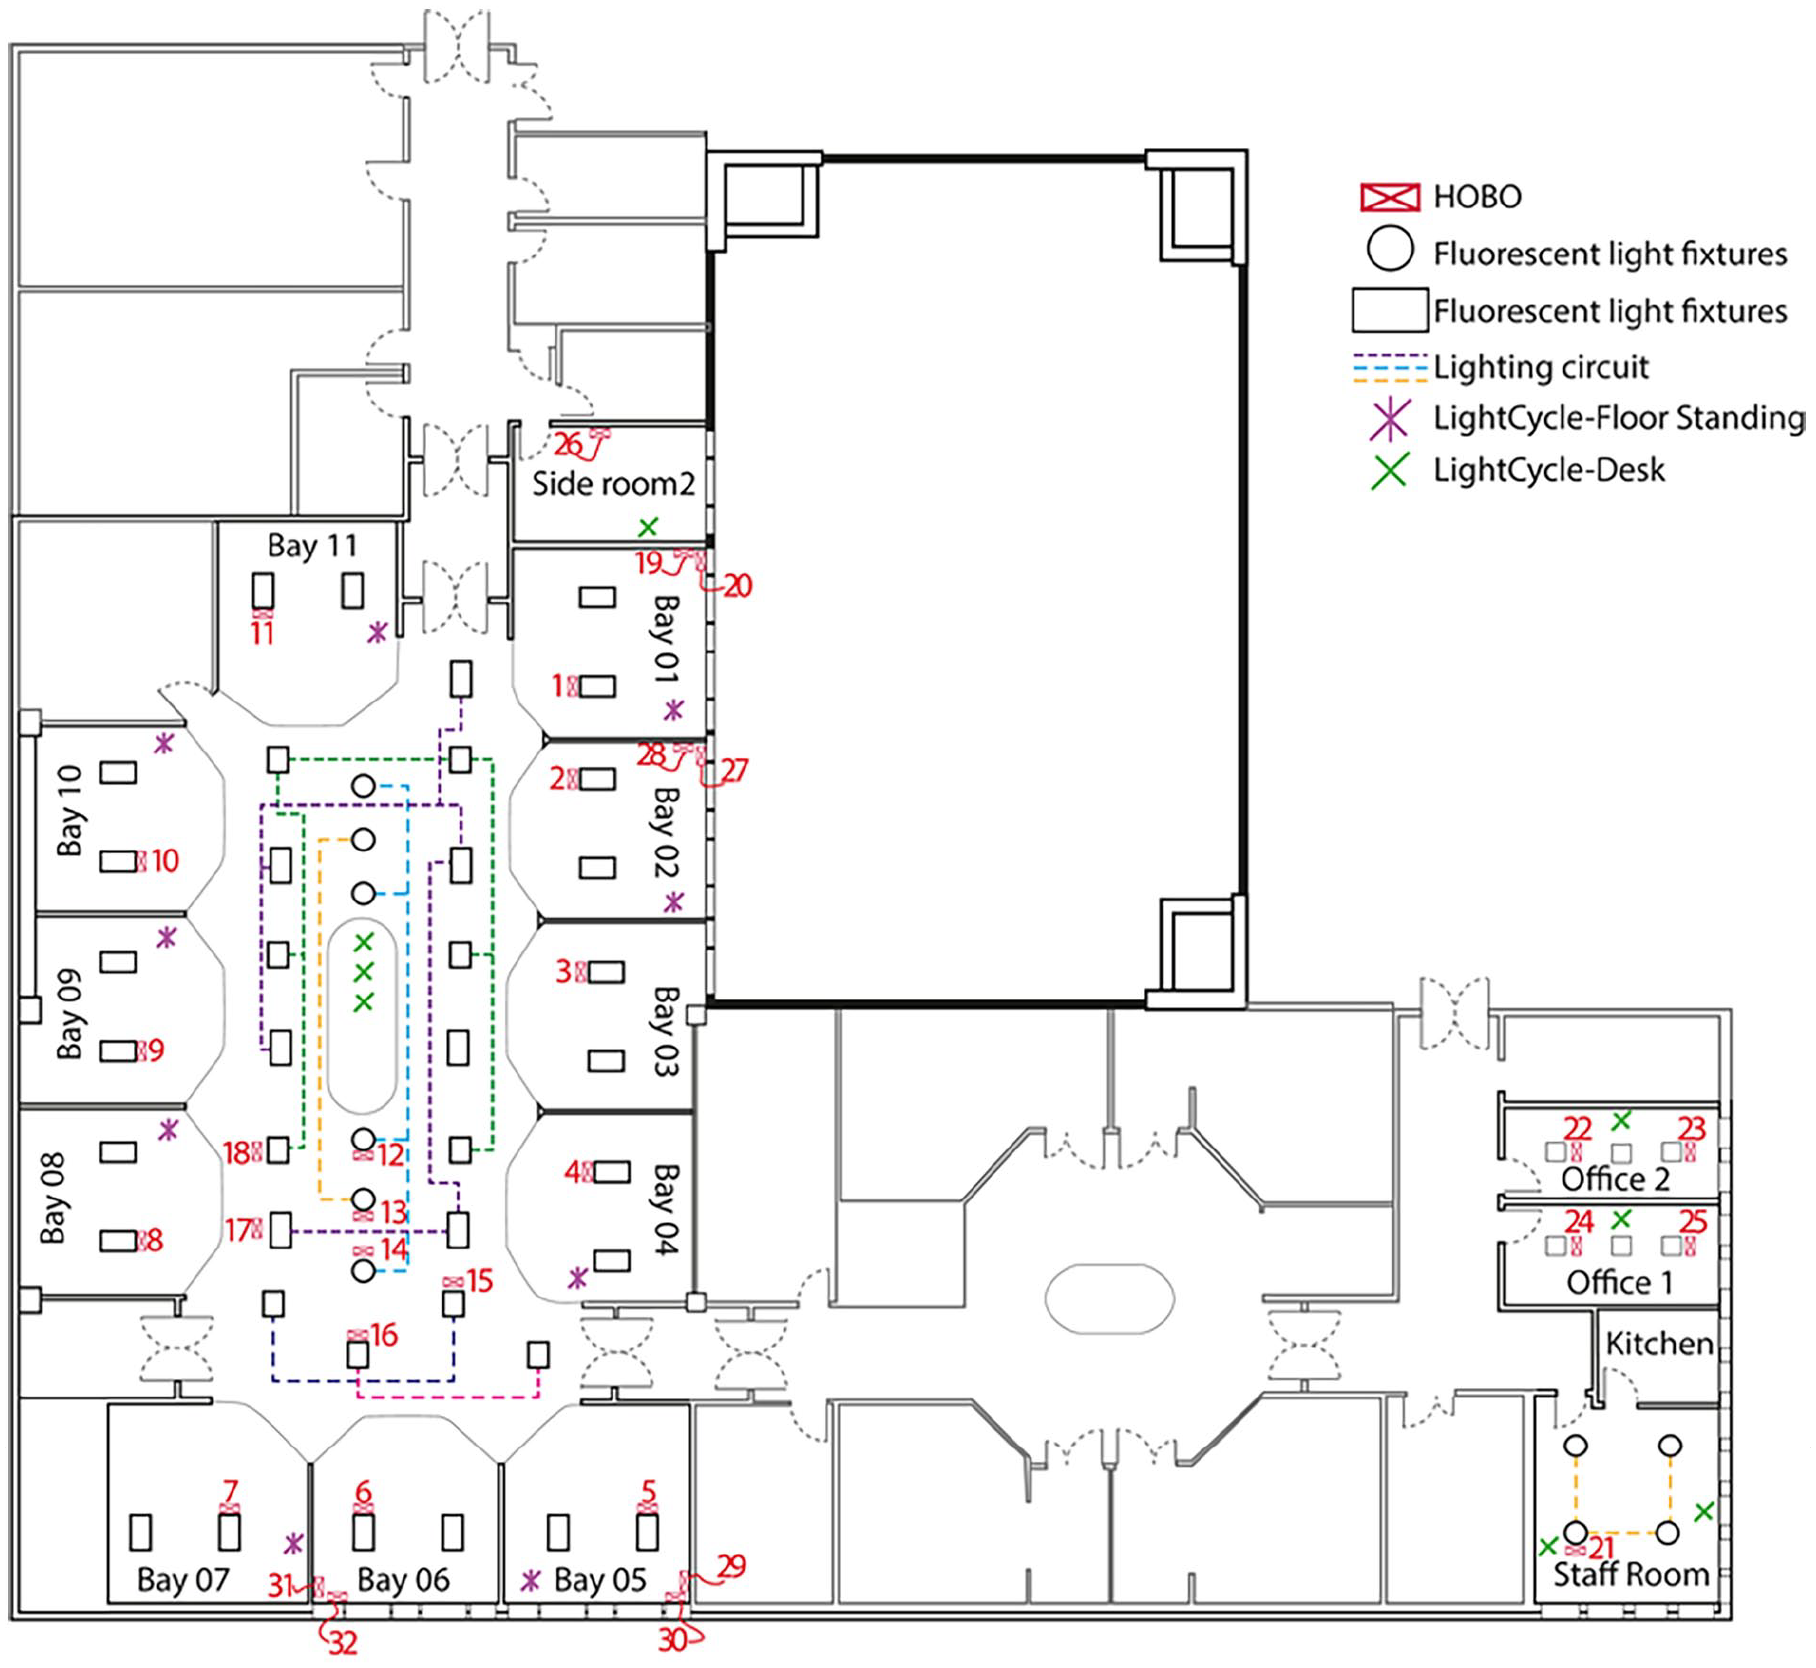
Floor plan of the Whittington hospital ICU with the HOBO’s location.
Devices and deployment
Dyson Lightcycle™ desk and floor light emitting diode (LED) luminaires (DLs) were used in the SE (full specification: https://www.dyson.com/content/dam/dyson/for-business/business-refresh/docs/roa/lighting/dyson-Lightcycle-tech-spec-in.pdf). Nine floor standing DLs were deployed in bed spaces 1–4, 7–11 and SR1. Eight desk DLs were distributed at the central station of the ICU, in offices where medical staff perform written and computer tasks, and in the staff room, as shown in Figures 1 and 2. All devices were the same model and each given a unique name for identification (Table 1). Users were able to adjust the colour and brightness of the light and, if enabled, a motion sensor mode would allow the DL to turn on automatically when movement was detected. Users were free to adjust the position of the lamps depending on the clinical situation and user preference.
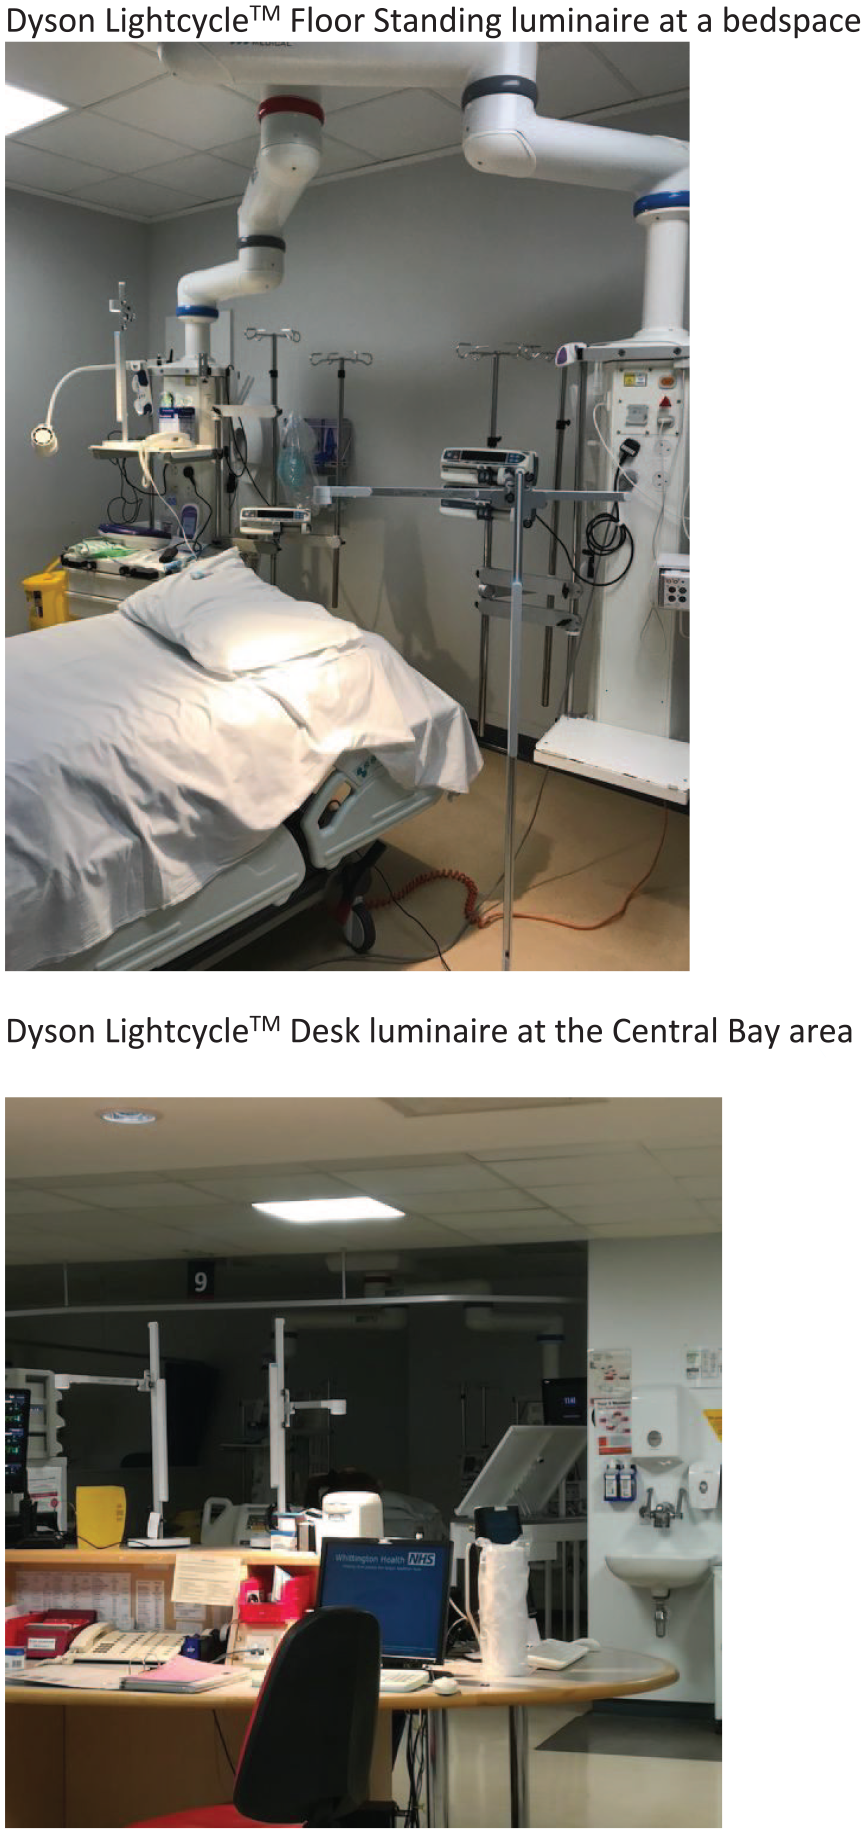
Photographs of Lightcycle™ luminaires at an empty bedspace and in the Central Bay area taken on 13th December 2019. Dyson Lightcycle™ Floor Standing luminaire at a bedspace. Dyson Lightcycle™ Desk luminaire at the Central Bay area.
Lightcycle™ luminaire location.
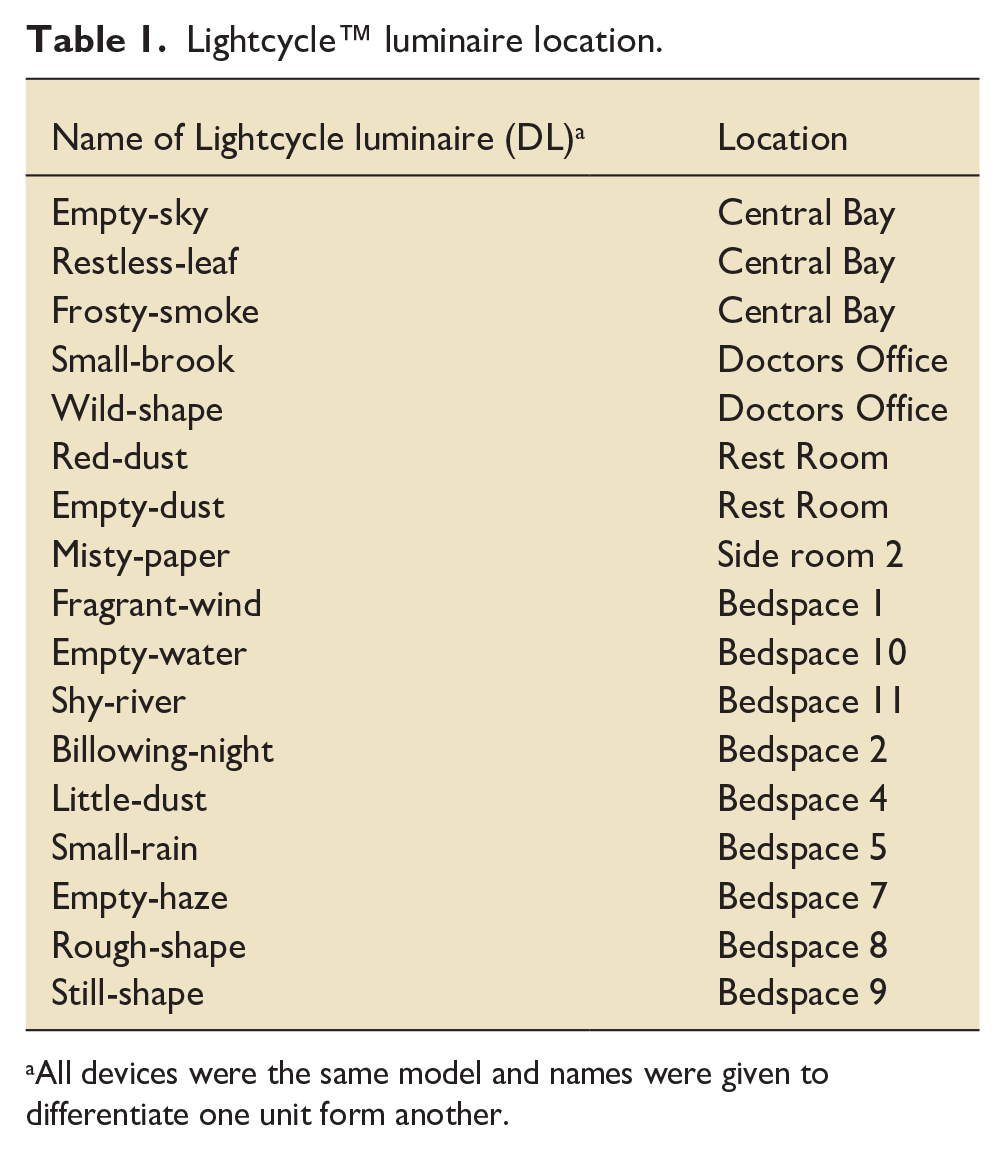
All devices were the same model and names were given to differentiate one unit form another.
Education and training of users
From 1st April to 30th September 2019 stakeholder meetings, presentations and newsletters promoted awareness and engagement in the SE. During this period the research team identified senior ICU nurses (‘team leaders’) who received specific training to operate the devices. The team leaders coordinated further training among other staff members. Posters were distributed throughout the ICU to provide a quick reference guide (Appendix 1). The research team performed further in situ training regularly during the SE period.
Phases
The SE had three phases: pre-deployment, deployment of the DLs and post-deployment (Table 2). The pre-deployment phase established a baseline for all metrics before the DLs were deployed. In this phase, users completed anonymised detailed questionnaires (DQs) about their wellbeing and the built environment of the ICU over a 3-week period (21st October–11th November 2019). Two weeks before the deployment phase, ‘Honest Observer Onset’ (HOBO) data loggers (Onset Computer Corporation, MA, US, https://www.onsetcomp.com) started recording illuminance data (25th October 2019–20th March 2020). After the DQs were completed and HOBOs installed, the DLs were deployed for 3 months (12th November 2019 until 12th February 2020). Users completed an abbreviated form of the DQ, called the ‘rapid answer questionnaire’ (RAQ), every 2 weeks during the deployment phase. After DL removal (post-deployment phase), HOBO monitoring continued, and follow-up DQs were performed (13th February–5th March 2020). The questionnaires are provided in the Supplemental Material.
Dates of installation, reinstallation of the devices and data download.
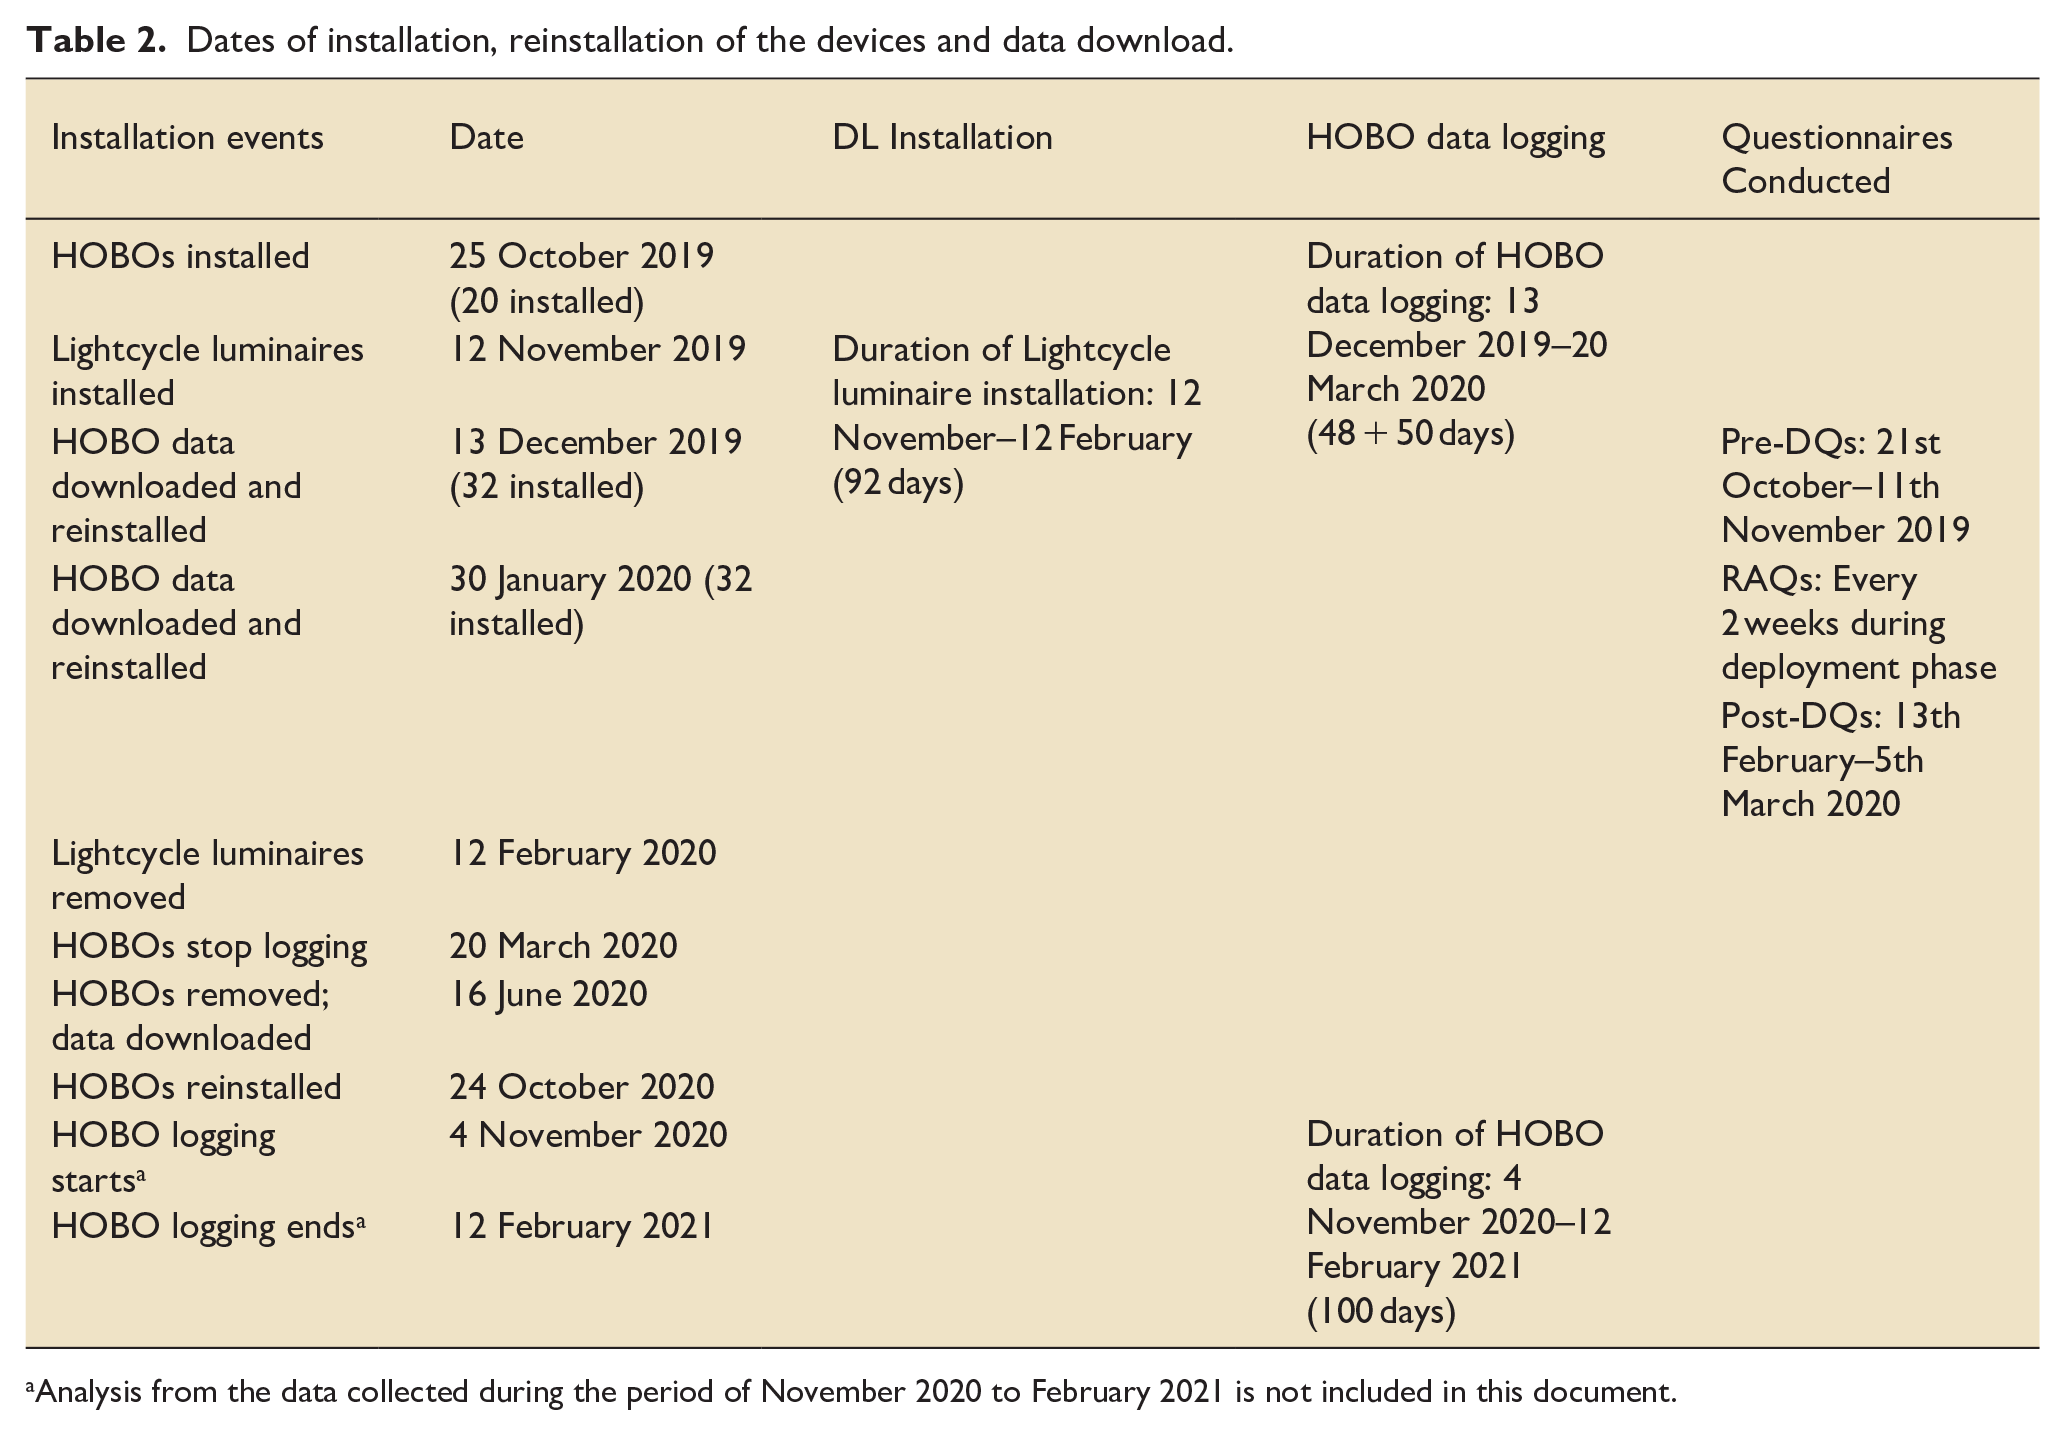
Analysis from the data collected during the period of November 2020 to February 2021 is not included in this document.
Monitoring
Two weeks prior to DL installation, 32 HOBOs were ceiling-mounted in positions throughout the ICU (Figure 1). These units reported illuminance in lux and were placed close to the light sources to monitor their output. Data were downloaded and the HOBOs reinstalled four times due to the limitation of memory within the devices. During the first four time periods, each HOBO recorded illuminance in lux every 5 min (Table 2). During the last installation illuminance was recorded every 10 min to ensure that they could cover the period between 12th November 2019 and 12th February 2020 without requiring recovery of data and reinstallation during potential Covid-related restrictions. In effect, the light from the luminaire was the ‘signal’, and stray light from daylight and other sources was ‘noise’. A simple measure of illuminance therefore does not accurately indicate when luminaires are in use. Mapping illuminance across the ICU was not feasible as 32 sampling points would not provide enough resolution. Instead, if the light levels when a given luminaire was on or off are well separated, a simple threshold value (specific to each HOBO) can be selected to determine the on/off state. For some of the HOBO units the illuminance was dominated by daylight, and in these cases this approach was not used.
The DLs were fitted with Raspberry Pi™ microcomputers, which also logged light colour information using two sensors (Rohm Semiconductor BH1745 Color Sensor and the AMS AS7262 Consumer Grade Smart 6-Channel VIS Sensor). The BH1745 recorded four channels (clear, red, green, blue) and the AS7262 six channels (red, orange, yellow, green, blue, violet). Data were wirelessly communicated to a website at which they could be viewed through and downloaded from a Grafana interface.
Wellbeing assessments
We used convenience sampling to conduct the wellbeing assessments of ICU staff. The pre- and post-DQs comprise several validated questionnaires modified for this SE to assess user (ICU staff) wellbeing and their perceptions of the built environment. These include the Stanford Sleepiness Scale (SSS), 16 Depression, Anxiety, Stress Scales (DASS), 17 Modified Pittsburgh Sleep Quality Index (mPSQI), 18 Fatigue Assessment Scale (FAS) 19 and adapted User Perception of Built Environment Surveys. 20 Forty-three nursing staff and 10 doctors were employed at the Whittington ICU at the time of the SE. All 53 staff members were approached to complete the pre- and post-deployment DQs by email invitation on three occasions, 3 weeks prior to and after DL installation. Staff were further invited through advertisement in the department’s online newsletter. Finally, ICU staff were approached in person 2 weeks before and after DL installation on alternate day and night shifts. RAQs were collected every 2 weeks by direct approach on the ICU, alternating day and night shifts.
Whilst collecting data about user perceptions of lighting, we also collected data relating to the perception of noise, air quality and temperature as control variables – in part to act as a control set of non-lighting-influenced outcomes. Further light-specific confounding factors were also accounted for, including the perception of natural as opposed to artificial light in the ICU, as well as glare from the sun and sky (as opposed to that from artificial lights). Lastly, staff were also asked to rate their perception of conditions overall in the pre-/post-DQs. This was to detect any changes to the overall conditions of the working environment, independent of the perceived change in lighting.
Statistical analysis
All quantitative variables were assessed for normality using the Kolmogorov-Smirnov (K-S) test and presented as a mean and standard error of the mean (SEM) where normally distributed, and median and interquartile range (IQR) where not normally distributed. The student t-test and Mann-Whitney U tests were used to assess statistical significance of differences between mean values of parametric and non-parametric data, respectively. Both statistical tests were conducted using a two-tailed hypothesis.
Results
Measured light usage and spectral data
The first stage of the analysis examines usage patterns of both the ambient lighting circuits and the DLs 2 weeks prior and over the duration of the installation. Total usage during the installation is summarised in Table 3 for the ambient illumination and Table 4 for the DLs. The data were further divided to examine whether there was a change in use of the ambient lighting during the period in which the DLs were installed. There was no difference in ceiling light usage either before (mean 5.10, SEM ± 1.21 h, p = 0.45) or after (mean 4.66, SEM ± 1.17 h, p = 0.34) installing the DLs, when compared to mean usage during the 3-month installation period (mean 5.33, SEM ± 1.16 h). The DLs most used were two in the central bay (DLs named ‘empty-sky’ and ‘frosty-smoke’), and two in the Doctor’s Office (‘small-brook’ and ‘wild-shape’; Table 4). Each of these was on for a mean duration of 20.5 (SEM ± 2.17) h per day. There was no evidence found to suggest that their use impacted that of existing ceiling lighting.
Estimated average daily hours of use of the ambient light installation using data from HOBOs, for the period before, during, and after installation of DLs.
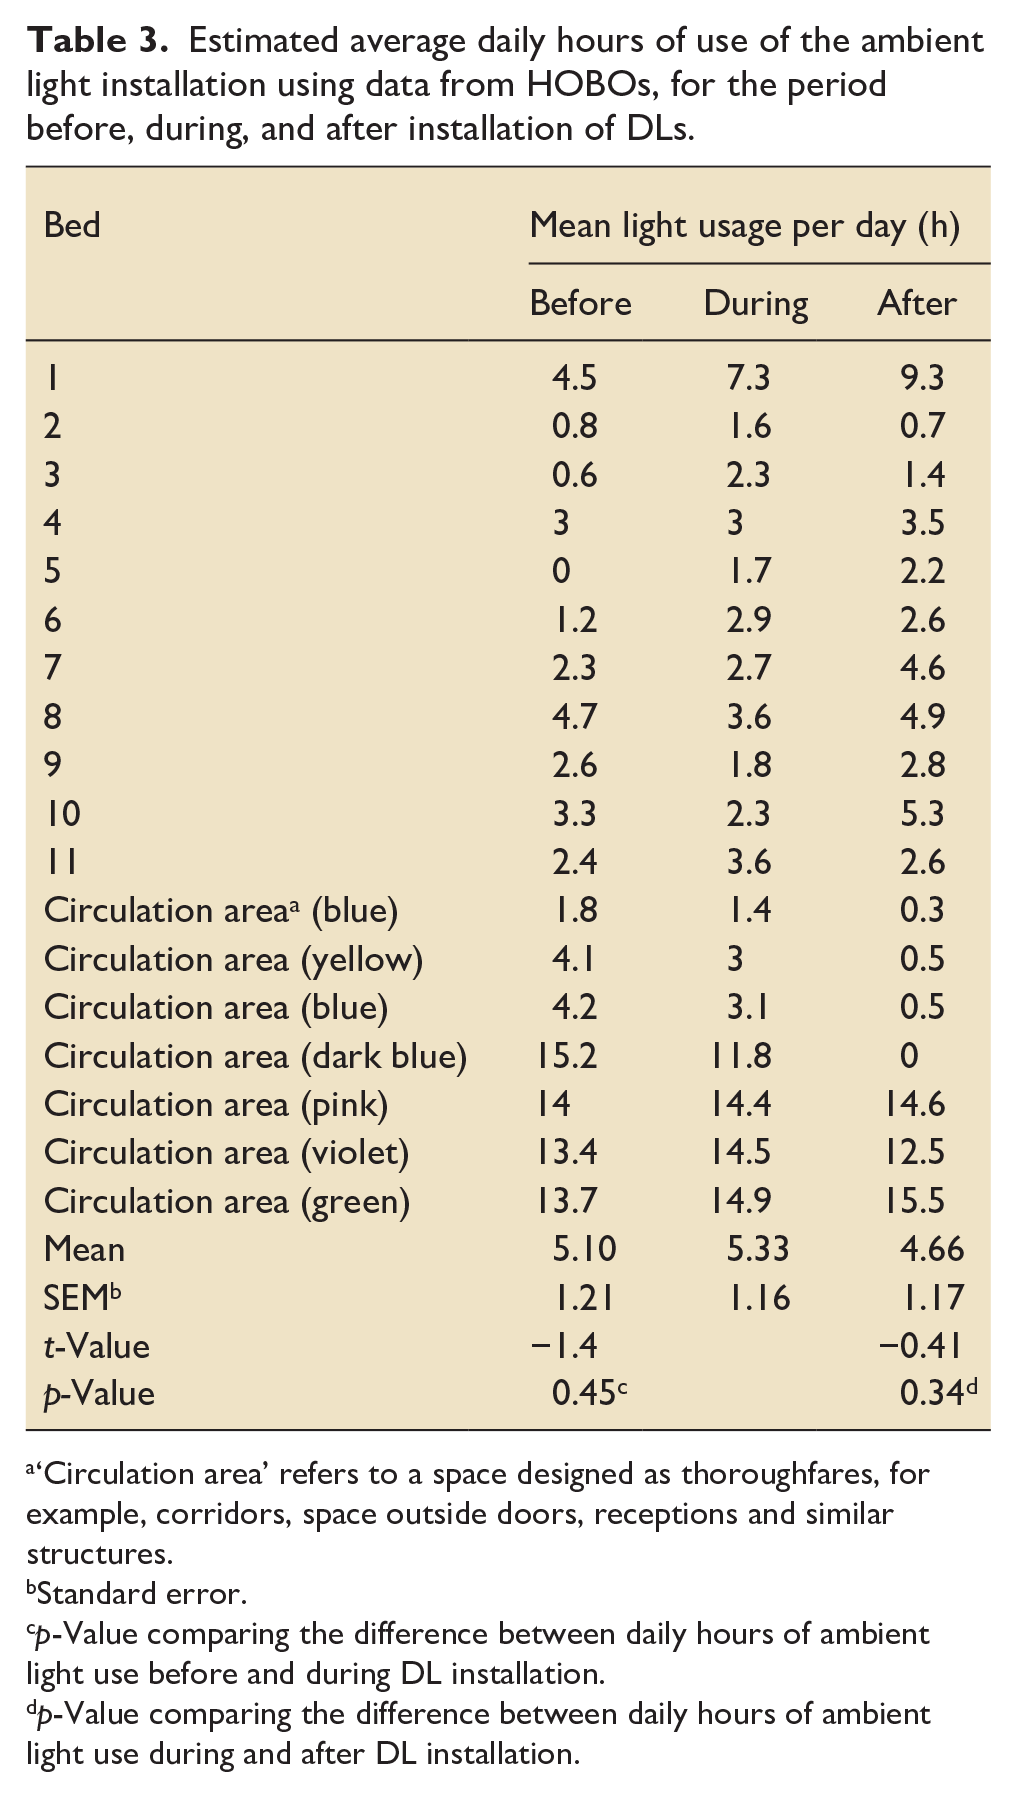
‘Circulation area’ refers to a space designed as thoroughfares, for example, corridors, space outside doors, receptions and similar structures.
Standard error.
p-Value comparing the difference between daily hours of ambient light use before and during DL installation.
p-Value comparing the difference between daily hours of ambient light use during and after DL installation.
Estimated average daily hours by sensor.
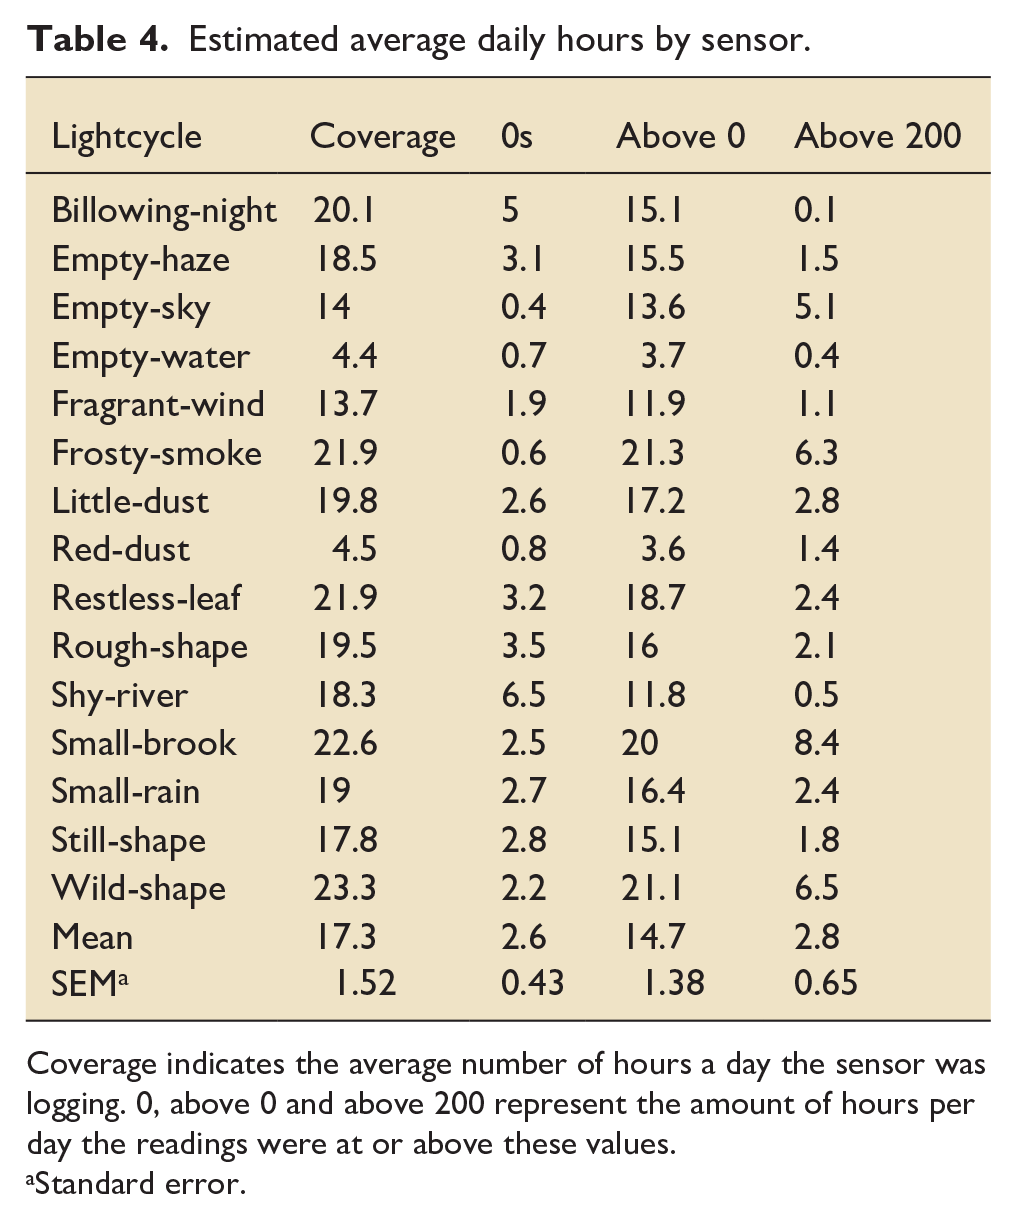
Coverage indicates the average number of hours a day the sensor was logging. 0, above 0 and above 200 represent the amount of hours per day the readings were at or above these values.
Standard error.
The Lightcycle data from the Raspberry Pi™ sensors contain both blank values (unit is unpowered and unable to log) and zeros (DL is off, but the unit is still powered). The blank values occurred in long stretches, and the percentage of missing values overall increased over the Christmas period, consistent with the units being switched off and disconnected from power (blank) or powered, but not switched on (zeros). By considering only readings above zero, it is possible to infer the hours of usage of DLs per day. On average, sensors recorded DL use for 14.7 (SEM ± 1.52) h per day but individually they varied widely.
General lighting at the bedside met the levels of a maintained illuminance required (300 lux) for nursing care according to current recommendations 21 (Appendix 3). In addition, minimum service standards of illuminance of 20, 100, and 1000 lux were met for night-time use, general daytime use (e.g. in circulation areas) and for clinical examination, respectively. The illuminance characteristics of the ICU are summarised in Appendix 4.
How the DLs were used
Most users found the DLs easier to control than the existing ceiling lights in terms of adjusting brightness (26/33 respondents (78.8%)) and colour (29/33 (87.9%)). In terms of mode of operation, 29/33 (87.9%) preferred to use their own judgement or their patient’s preference to adjust the DL settings. Three users (9.1%) simply switched the light on, and one (3%) used the motion sensor feature. Respondents reported that the floor-standing bedside DLs were most useful for a range of activities, including completing the chart at the bedside (22/33), performing a clinical task (20/33), as ambient lighting for the patient (19/33) and when performing writing or computer tasks (26/33). Furthermore, 14/31 respondents cited ‘adjustability’ or ‘control’ as particularly good features of the DLs. Several respondents commented the DLs were useful to limit stray light escape, thus preventing disturbance of the patient’s sleep, and helpful to perform clinical procedures during night shifts. Seven users commented that the floor DL was ‘heavy’ or too ‘bulky’, and may be a hazard during an emergency, some suggesting the addition of wheels may improve its mobility.
Impact of the built environment
Participants assigned a 12.5% higher satisfaction score rated from 0 to 8 (presented as mean ± SEM) of lighting overall during deployment compared to pre-deployment, although this was not statistically significant (6.06 ± 0.29 and 5.06 ± 0.60, respectively; p = 0.20). Scores fell to slightly higher than baseline levels when assessed in the post-deployment phase (5.56 ± 0.54; p = 0.60). Scores for perceived natural light present (1 = too little and 8 = too much) were very low and did not change before and during the deployment phase (2.89 ± 0.40 vs 2.82 ± 0.50; p = 0.92). Similarly, glare from natural light was perceived as low (2.28 ± 0.31 vs 2.06 ± 0.31; p = 0.63) and scores for artificial light were moderate, and unchanged during deployment (5.77 ± 0.35 vs 5.28 ± 0.38; p = 0.35). Mean scores for noise (4.77 ± 0.40 vs 4.82 ± 0.52; p = 0.88) and temperature stability (4.88 ± 0.23 vs 4.27 ± 0.27; p = 0.32) were relatively unchanged before or during deployment. Mean scores for perceived air quality (humidity, draft, freshness and odour did not differ significantly before and after DL deployment (Table 5).
Staff perception of different conditions in their working environment across the three phases of the study. a
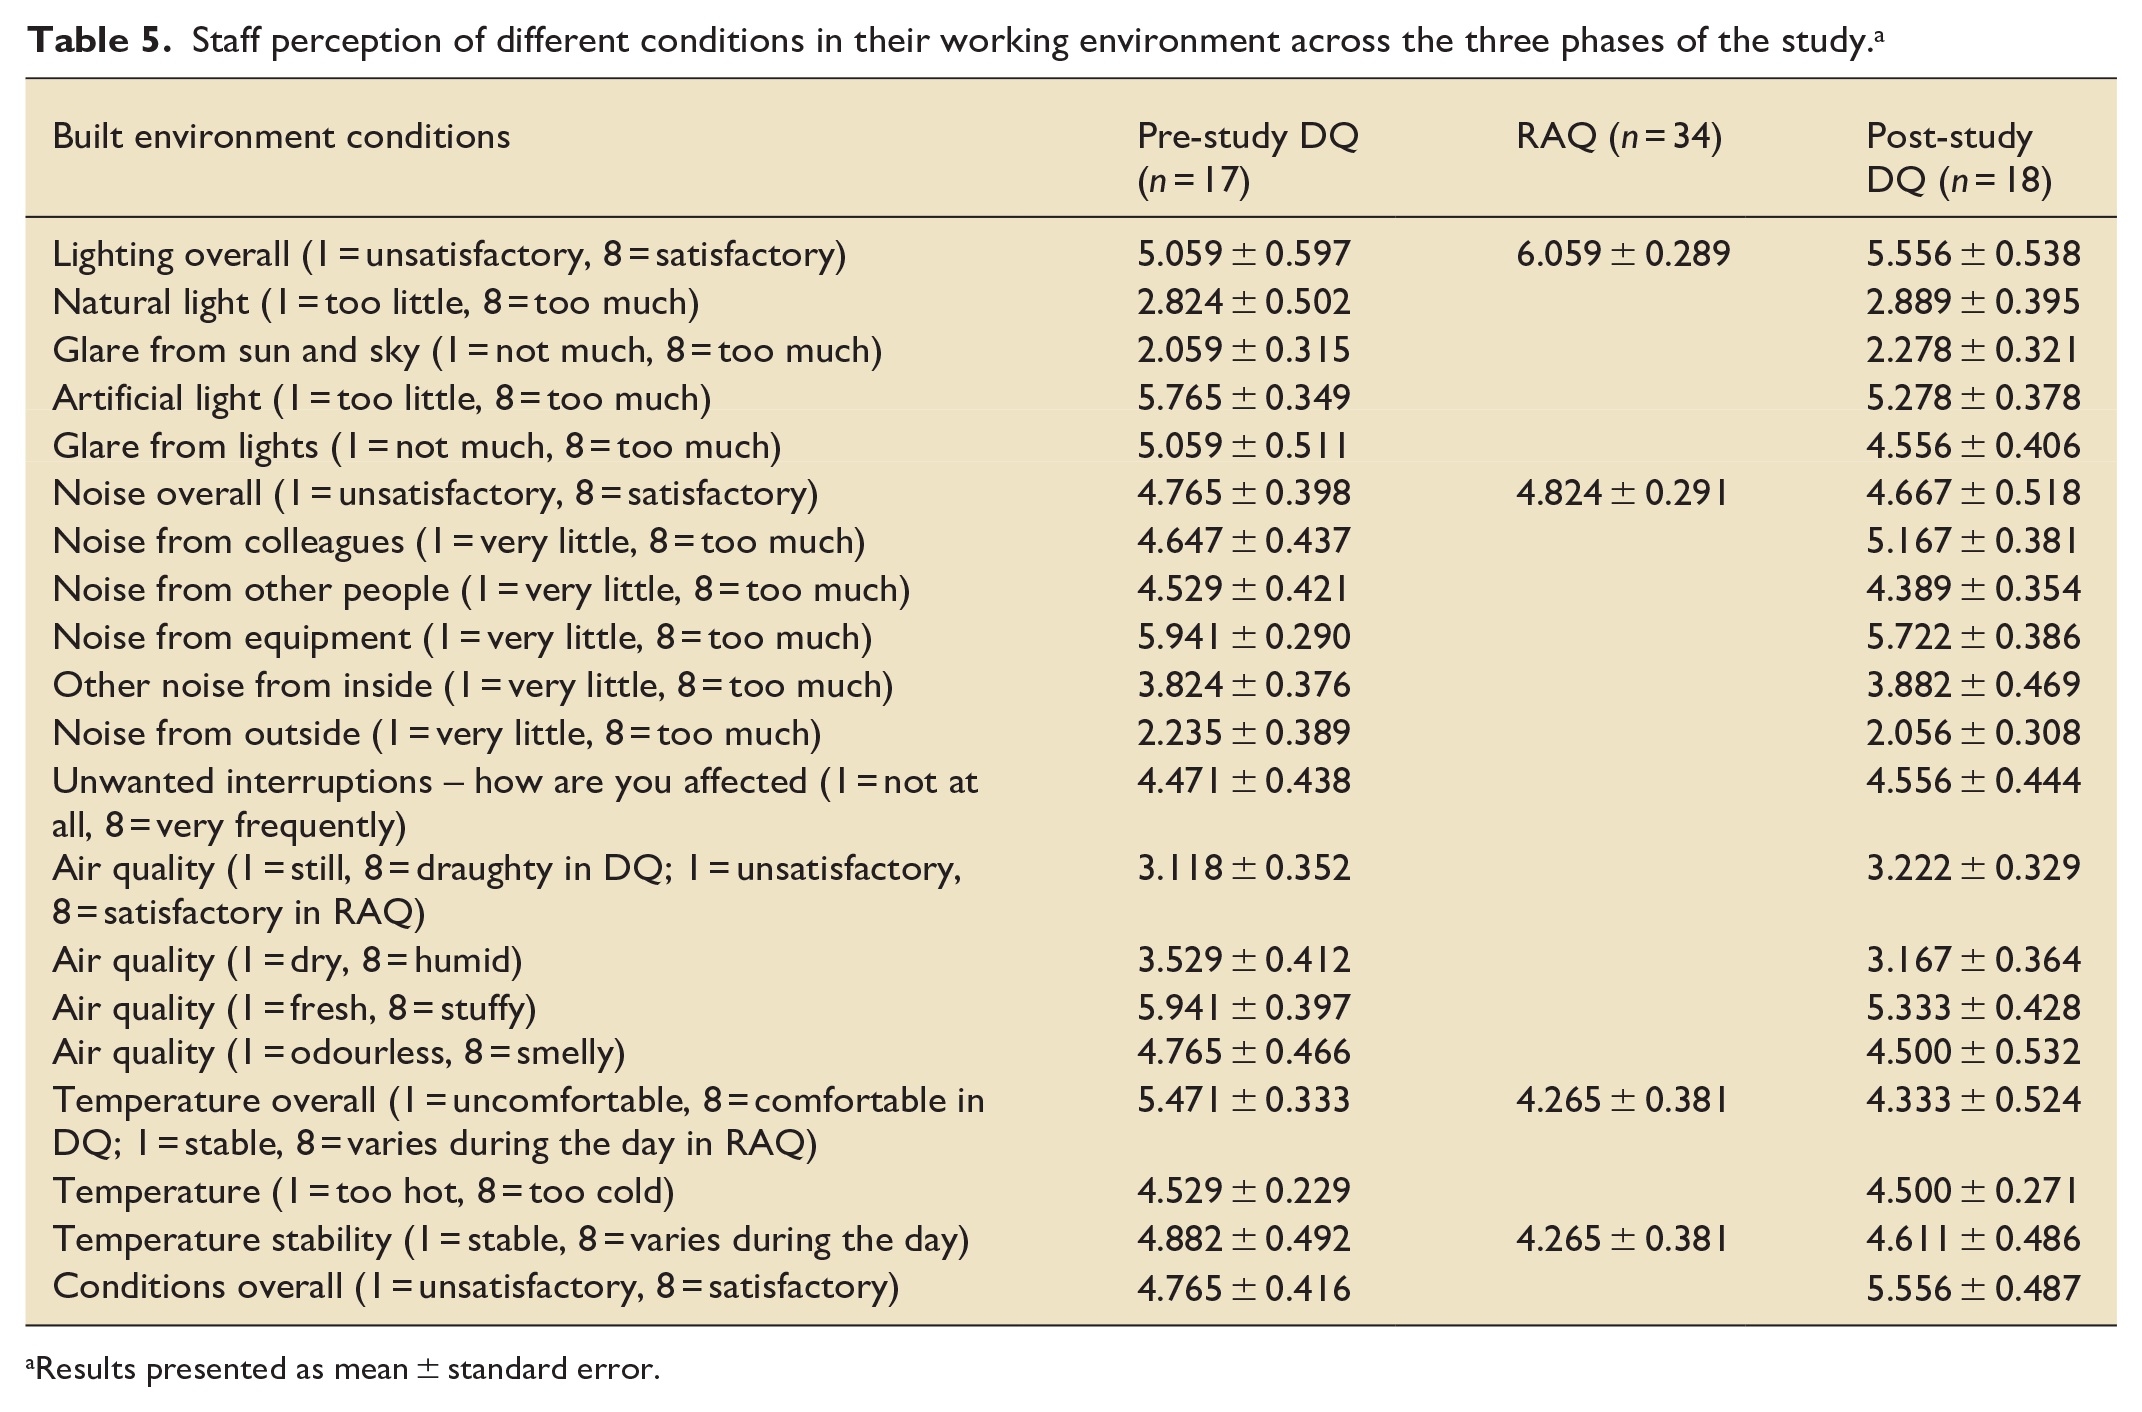
Results presented as mean ± standard error.
Effect of built environment factors on wellbeing
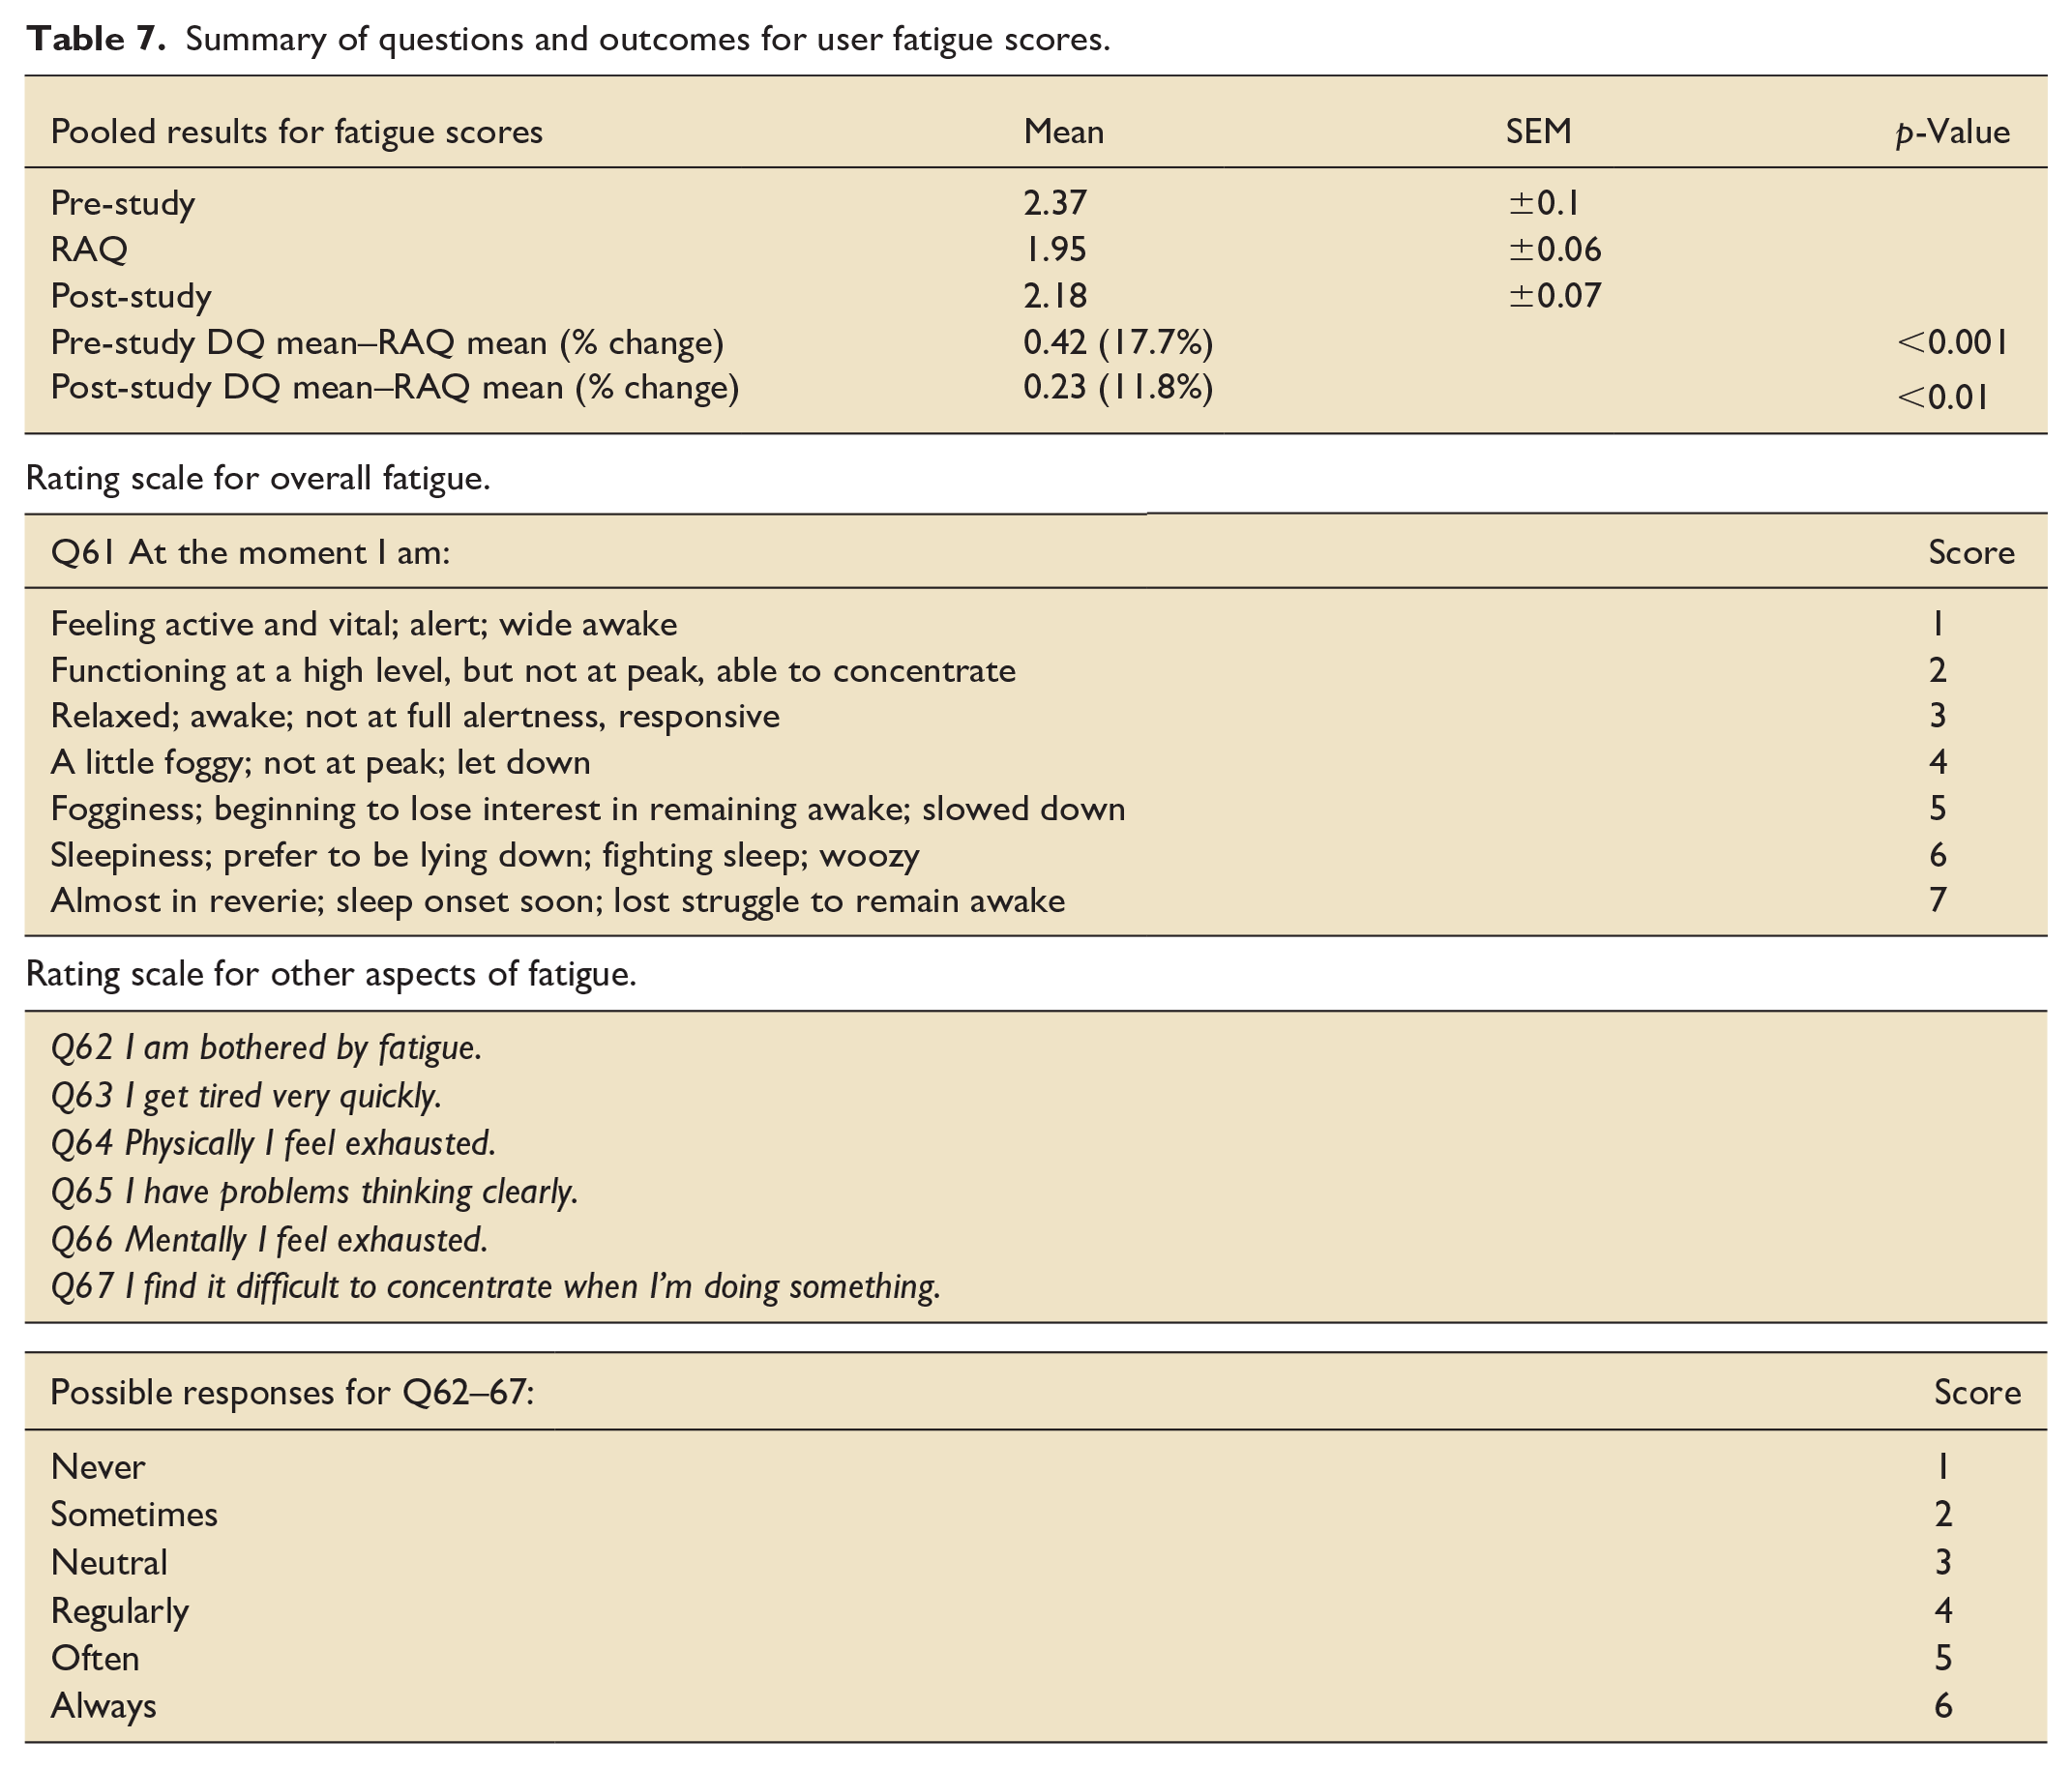
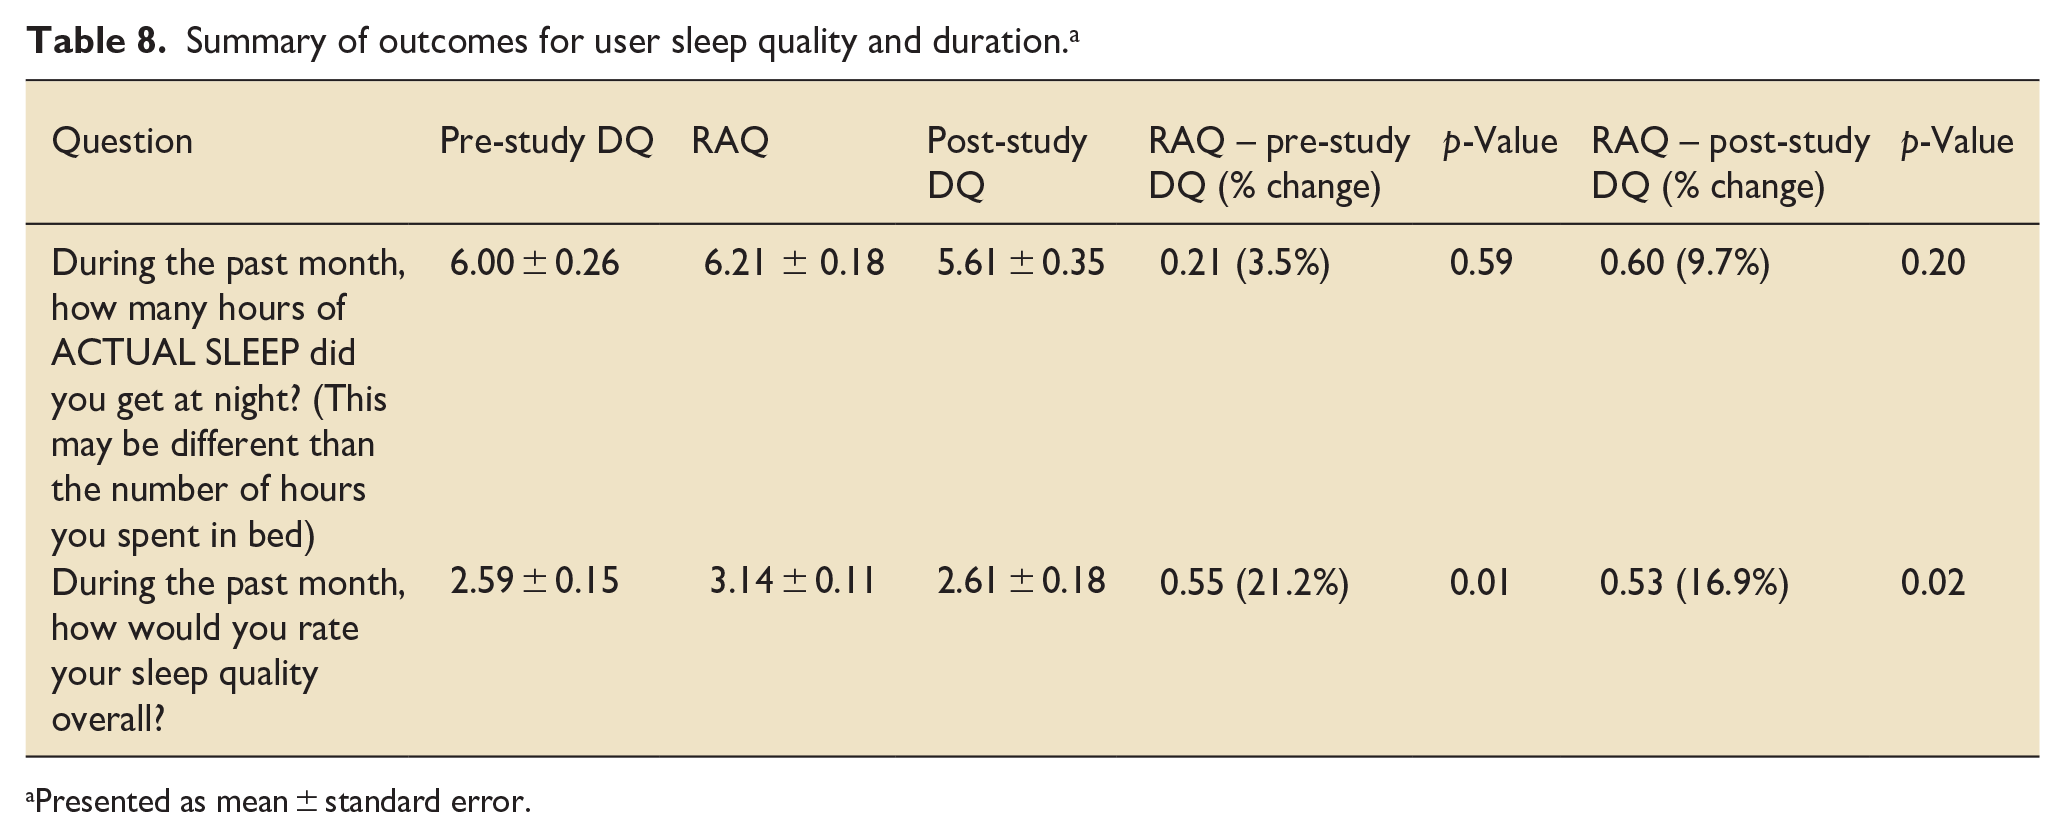
The pre-deployment DQ was completed anonymously by 15 nurses and 2 doctors, the RAQ by 30 nurses and 4 doctors, and the post-deployment DQ by 16 nurses and 2 doctors. The response rate for pre- and post-DQs was 17/53 (32%) and 18/53 (34%) of those approached (via email and in person). The average response rate for RAQ approaches (exclusively in person) was 5/7 (71.4%) per visit. All scores for wellbeing (mood, fatigue and sleep quality) improved when the DLs were in use. Scores for mood (rated from 0 to 3) improved by 0.27 (38%) (p < 0.001) and 0.37 (45.3%) (p < 0.001) during deployment compared to pre- and post-deployment, respectively (Table 6). The highest degree of improvement, ranging from 46% to 67.7%, was seen in domains such as the ability to feel positive, increased initiative to be proactive, a reduction in nervous energy, anxiety and panic, and the ability to relax. Five users described the lights made them feel ‘calm’, ‘comfortable’ and ‘good’, and a further 14 commented that the DLs were useful, easier to control than the existing lighting and made aspects of work easier. An improvement in fatigue scores was observed (where 1 = alert and 7 = struggling to remain awake). Mean fatigue scores reduced by 0.42 (17.7%) (p < 0.001) and 0.23 (11.8%) (p < 0.01) during deployment compared to pre- and post-deployment, respectively (Table 7). An improvement in user sleep quality was observed during the period of DL use by 21.2% (p = 0.01) compared to before the intervention and fell by 16.9% (p = 0.02) after the DLs were removed (Table 8). Furthermore, mean self-reported sleep duration increased from 6.0 (±0.26) to 6.21 (±0.18) h, and fell to lower than pre-intervention duration to 5.61 (±0.35) h (p = 0.59 and 0.20, respectively) after the DLs were removed. The pattern of change in sleep duration mirrored that of reported sleep quality, increasing during the intervention period and falling afterwards.
Pooled results for mood scores.
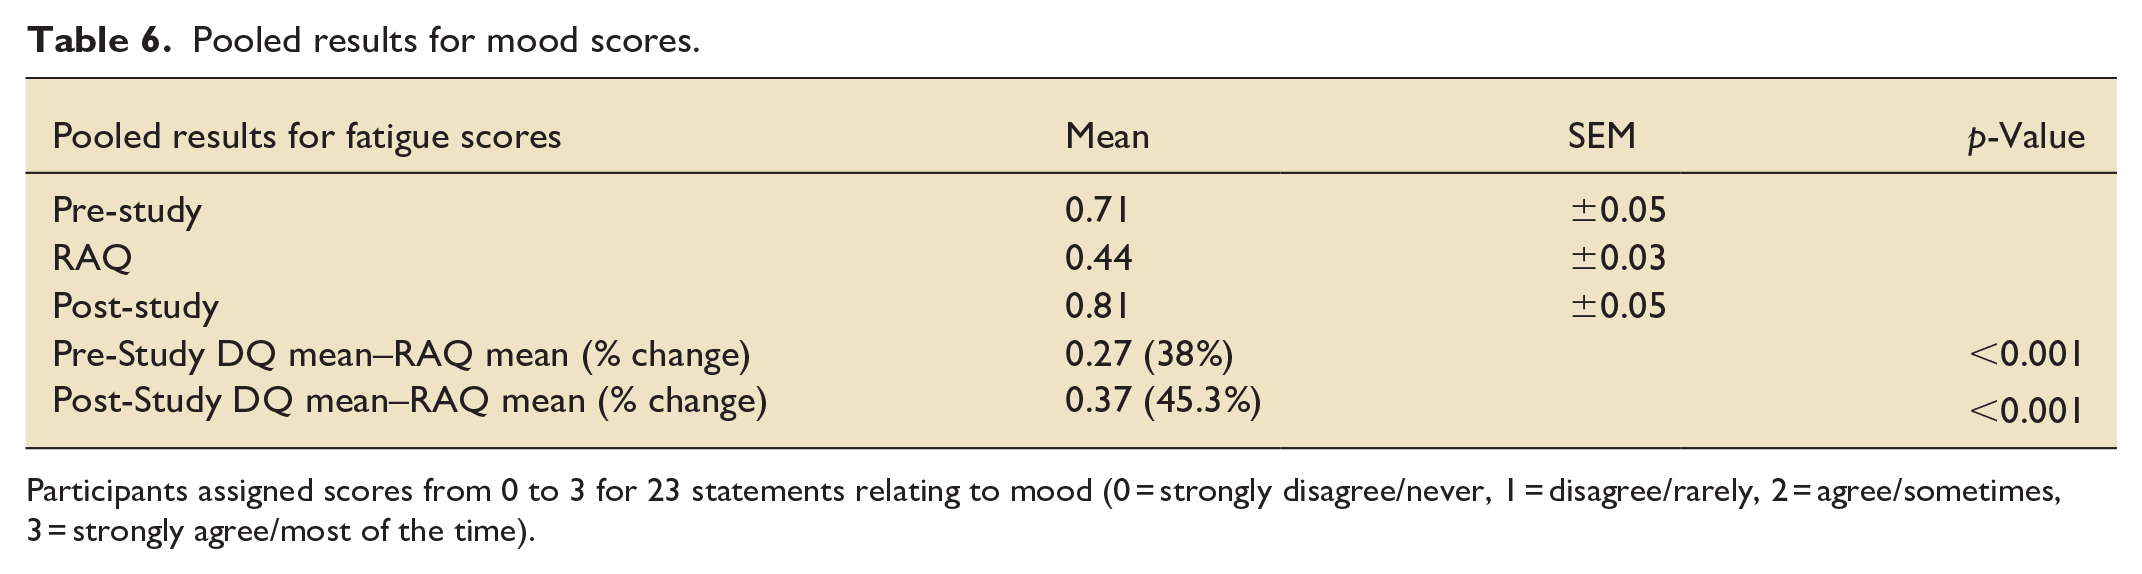
Participants assigned scores from 0 to 3 for 23 statements relating to mood (0 = strongly disagree/never, 1 = disagree/rarely, 2 = agree/sometimes, 3 = strongly agree/most of the time).
Summary of questions and outcomes for user fatigue scores.
Summary of outcomes for user sleep quality and duration. a
Presented as mean
Discussion
We have performed the first pilot feasibility service evaluation of its kind to determine the impact on staff wellbeing due to the quality of lighting on the ICU. We show that it is feasible to equip an ICU with a novel mode of lighting and evaluate both illuminance and user-centred outcomes.
Usage of the Dyson luminaires (DLs) was high (>70% per 24 h). The lack of any change to ambient light usage suggests the DLs were used as supplementary lighting, which appears to be in accordance with their relatively narrow distribution. Furthermore, the most used DLs were those in the central bay and doctors office, which also indicate they were often used as tasks lights. However, most surveyed users reported that the most useful type of DLs were those at the bedside. User comments and survey data support their use for multiple purposes such as during performance of clinical tasks (whilst avoiding disturbing patients) and documentation, and for providing lighting tailored to staff or patient needs.
Although not statistically significant, we observed a trend towards increased satisfaction of lighting with the use of DLs. It was clear that users felt that the ICU had very little natural light prior to the deployment phase and the DLs seemed to have little impact on this. Users appeared to have preferred adjusting the nature of the light to their needs or to those of their patient. Meanwhile, the DLs seemed to improve the scores relating to glare from artificial lights after their deployment. One user commented that DLs helped reduce headaches compared to existing lighting. This suggests that the ability to control lighting to the specific needs of the user, and the type of light offered by the DLs, seem to be important to the perception of lighting in the ICU. The fact that scores for perceived lighting conditions even after the DLs were removed remained higher than baseline scores suggest a possible ‘afterglow’ effect of DL use and may indicate persistent wellbeing effects. It may be argued that this is a placebo effect, however, improvements in the perception of other (control) elements of the built environment, such as noise, air quality and temperature, were not observed. A post-hoc power calculation suggests that a sample size of approximately 200 participants would be needed to detect a 12.5% improvement in perceived lighting quality, as observed in this SE, with 95% confidence and a β value of 0.8. 22
The most notable improvements in outcome were observed in all domains of wellbeing. Statistically significant improvements were observed in mood, fatigue scores and perceived sleep quality, peaking during the intervention and waning after the DLs were removed. Whilst, sleep duration and quality cannot be precisely ascertained without a quantitative assessment, the mPSQI is a validated tool and a recognised surrogate measure of sleep quality. 18 Furthermore, comments by users support the notion that the luminaires may contribute to feeling ‘relaxed’, ‘calm’ or being ‘therapeutic’. This may be due to the user controlling the colour and brightness to suit the time of day, or their own mood. Furthermore, it is possible the feeling of control adds to a positive wellbeing feedback loop. The nature of the emitted light may enhance the space rather than simply illuminate, thus further adding to a feeling of wellbeing. These data support those from studies which report effects of light brightness and colour on mood, mediated through both biological and psychological factors.7,23 ‘Negative mood states’, for example due to anxiety or loneliness in vulnerable groups such as the disabled or elderly, can be improved by lighting solutions. 24 There may be similarities between the subjects in these studies and ICU patients, particularly those in a post-critical illness recovery phase. Depression and loneliness are predisposing factors for delirium. In addition, low serotonin levels are known to be associated with low mood, depression and delirium. 25 Light therapy has been shown to improve circulating serotonin levels and mood, 26 and is a well-recognised treatment for seasonal low mood disorders.27,28 If mood can be enhanced using lighting solutions in the ICU, and if this benefit were conferred to patients, then perhaps the rates or severity of ICU delirium may be reduced. Given the morbidity and mortality associated with delirium, and the limitations of pharmacological therapeutics, there is an urgent need to investigate novel solutions, such as optimising the ICU built environment, to limit its impact.
There appears to be a signal towards benefit to the user when additional lighting is provided, compared to the current overhead fluorescent luminaires prevalent in most ICUs. In this SE, these benefits were demonstrated in ICU staff operating the device. However, it is conceivable that effects such as improved mood and reduced sleep disturbance may have patient benefits too. In designing such a study, a balance needs to be struck between installing automated ‘circadian’ lighting that could be installed in the ICU to light the whole space versus the benefits gained by user controllability, as demonstrated by this SE. It may be possible to use both types of luminaires together seeking to derive benefits from both methods.
Limitations
This SE has several limitations, which might be addressed in a larger definitive study. This was a non-randomised SE to help inform larger future studies. As such, it may be open to risks of selection, recall and recording bias, as well as to the impacts of confounding factors. Participants may have been susceptible to the Hawthorne effect, where behaviour is affected due to the perception of being observed. To limit this effect, we ensured that users were fully informed about the intervention, and that there was an adequate ‘run-in period’ for users to get used to the luminaires prior to data collection. Furthermore, medical staff on the ICU are accustomed to using new equipment and being part of clinical research. However, given the unblinded nature of this SE a type of performance or ‘novelty’ bias may have been a factor.
Only doctors and nurses were represented in this work. We did seek inclusion of all other MDT members, approaching them on multiple occasions both electronically and in person, and on both day and night shifts). However, none elected to partake-perhaps because they were only intermittently at the bedside. Greater efforts will be made in future studies to broaden inclusion.
Ambient light changes with season, which may have affected sleep and mood. However, the ICU built environment is such that entry of external natural light is limited, and the space is predominantly illuminated with overhead ceiling lights. Furthermore, pre- and post-deployment survey data were collected throughout different seasons, with natural light diminishing over the course of the SE period. Thus, it seems unlikely the improvement in wellbeing outcomes during the deployment phase were due to seasonal change.
Finally, during Covid 19 surges, the HOBOs could not be managed, and their memory became full, preventing data acquisition. There are thus some temporal discontinuities in the dataset. These waves also disrupted completion and writing up of the data.
Conclusion
The use of local lighting systems which allowed staff to adjust light colour, intensity and direction resulted in an improvement in all self-reported aspects of ICU staff wellbeing, and a trend towards improvement in satisfaction with lighting conditions of the built environment. Such impacts warrant further exploration in appropriately designed and powered larger-scale trials. Potential patient benefits also merit exploration.
Supplemental Material
sj-docx-1-inc-10.1177_17511437251315570 – Supplemental material for Improved intensive care lighting and staff wellbeing: A pilot feasibility service evaluation
Supplemental material, sj-docx-1-inc-10.1177_17511437251315570 for Improved intensive care lighting and staff wellbeing: A pilot feasibility service evaluation by Sampath Weerakkody, Jemima Unwin Teji, Edward Barrett, Margarita Kousteni, Lorna Flores-Villa, Emma Jenkins and Hugh Montgomery in Journal of the Intensive Care Society
Footnotes
Acknowledgements
We wish to thank Frédéric Nicolas and Karen Dawe at Dyson, who generously provided the Dyson luminaires; and Martin McDermott and Jonathan Lim Khai Pin who provided technical support to instal and retrieve data from the data loggers for these luminaires. HM is supported by the UK National Institute for Health Research’s (NIHR’s) Comprehensive Biomedical Research Centre (BRC) at University College London Hospitals (UCLH).
Declaration of conflicting interests
The author(s) declared the following potential conflicts of interest with respect to the research, authorship, and/or publication of this article: HM chairs Dyson’s Scientific Advisory Board. Dyson provided the luminaries and data loggers, but did not provide funding, or have a role in data analysis or interpretation, nor preparation of this manuscript.
Funding
The author(s) received no financial support for the research, authorship, and/or publication of this article.
Supplemental material
Supplemental material for this article is available online.
References
Supplementary Material
Please find the following supplemental material available below.
For Open Access articles published under a Creative Commons License, all supplemental material carries the same license as the article it is associated with.
For non-Open Access articles published, all supplemental material carries a non-exclusive license, and permission requests for re-use of supplemental material or any part of supplemental material shall be sent directly to the copyright owner as specified in the copyright notice associated with the article.