
Abstract
Background
Intensive care units are significantly louder than WHO guidelines recommend. Patients are disturbed by activities around them and frequently report disrupted sleep. This can lead to slower recovery and long-term health problems. Environmental sound levels are usually reported as LAeq24, a single daily value that reflects mean sound levels over the previous 24-h period. This may not be the most appropriate measure for intensive care units (ICUs) and other similar areas. Humans experience sound in context, and disturbance will vary according to both the individual and acoustic features of the ambient sounds. Loudness is one of a number of measures that approximate the human perception of sound, taking into account tone, duration, and frequency, as well as volume. Typically sounds with higher frequencies, such as alarms, are perceived as louder and more disturbing.
Methods
Sound level data were collected from a single NHS Trust hospital general adult intensive care unit between October 2016 and May 2018. Summary data (mean sound levels (LAeq) and corresponding Zwicker calculated loudness values) were subsequently analysed by minute, hour, and day.
Results
The overall mean LAeq24 across the study duration was 47.4 dBA. This varied by microphone location. We identified a clear pattern to sound level fluctuations across the 24-h period. Weekends were significantly quieter than weekdays in statistical terms but this reduction of 0.2 dB is not detectable by human hearing. Peak loudness values over 90 dB were recorded every hour.
Conclusions
Perception of sound is sensitive to the environment and individual characteristics and sound levels in the ICU are location specific. This has implications for routine environmental monitoring practices. Peak loudness values are consistently between 90 and 100 dB. These may be driven by alarms and other sudden high-frequency sounds, leading to more disturbance than LAeq24 sound levels suggest. Addressing sounds with high loudness values may improve the ICU environment more than an overall reduction in the 24-h mean decibel value.
Background
Environmental sound levels are usually reported as single daily values (LAeq24) that reflect mean sound levels over a 24-h period. For evaluation of sound exposure in the working environment, the LAeq has been reported for the standard eight hour working day (09.00–17.00 or equivalent) as LAeq8. In recognition of different working patterns in healthcare, sound levels in hospital environments are often reported as LAeq(day) and/or LAeq(night) where (day) and (night) usually map to shifts, commonly twelve hours in duration although this varies. 1 There is also a growing interest to report additional or alternative measures that recognise the subjective experience of sound as well as LAeq. 1
Sound levels in hospitals are measured against the World Health Organisation guidelines that recommend healthcare environments should aim for average values between 30 and 35 dB LAeq24 with maximum values of 40 dBA overnight. 2 These levels are consistently not achieved by intensive care units globally.3,4 Higher background noise affects communication. Good speech intelligibility requires a signal to noise ratio (speech to background noise) of 12–15 dB, although this varies on type and volume of background noise. 5 Spaces with hard floor/wall surfaces (such as hospital wards) amplify reverberation, and speech intelligibility is impaired. Increased vocal effort is required when background levels rise above 50 dBA and ongoing conversation tends to continuously increase sound levels, escalating the problem. 6 Increased noise levels have been shown to affect cognitive performance both in laboratory studies and in the workplace. 7 Patients admitted to ICU are disturbed by activities around them 8 and frequently report disrupted sleep.9,10 This can lead to slower recovery and long-term health problems. 11
We have previously shown that sound levels vary considerably by location within the ICU, suggesting that measures should not be taken from a single location as these may not be representative. 12 Our new analysis suggests standard environmental monitoring of sound is not adequate and does not take account of patients’ experiences of noise and disturbances when they are in hospital.
The concept of noise (specifically different from sound, noise is defined as ‘unwanted sound’) is contextual, subjective and will differ between individuals. What is unbearably loud for one will be tolerated by another. 13 Perception of noise depends on volume, duration of exposure, pitch, tone, information content, and frequency. This difference in perception means that two sounds at the same volume but at different frequencies will not be perceived equally. Sounds at higher frequencies (for example alarms) will seem louder and more disruptive. Measures of ‘loudness’, such as the Zwicker method used in this analysis, 14 take account of the likely psychological effect of sound on the individual which enables the human experience of sound to be quantified as well as intrinsic volume levels.
Studies that contributed to the 2009 World Health Organisation Publication ‘Night Noise Guidelines for Europe’ suggest that annoyance is not solely dependent on decibel level. 15 Different noises cause differing annoyance responses, even at the same volume. Steady noise levels (for example road traffic, or air conditioning units) tend to be less annoying than those which vary, particularly those which are higher in frequency, sudden, and unpredictable (for example alarms). Tolerance for noise is also time dependent. Sounds that would cause little intrusion during the day are much less tolerable overnight.
Sleep disturbances can occur when background sound levels are as low as 30 dBA, and peaks of 45 dBA have been shown to induce awakening. The elderly, shift workers, and those with physical or mental disorders are particularly at risk of adverse consequences of awakening and disrupted sleep. In critical care areas, this disruption to sleep patterns may contribute to the development of delirium. 16 Patients who experience delirium in hospital may have longer hospital stays and ongoing cognitive impairment after discharge home. 11
Methods
This phase of the SILENCE project (ref: NIHR PB-PG-0613-31034) ran at the Adult Intensive Care Unit, John Radcliffe Hospital, Oxford from late October 2016 to the end of the project in May 2018. This study involved environmental monitoring only. The project was run as a local quality improvement project (Oxford University Hospitals NHS Foundation Trust Datix ref: 3247). We did not recruit patients, nor collect identifiable information. Local ethics policies do not require formal review or approval for studies based on environmental data containing no information that can be traced back to individuals.
General environment, patient population and staffing levels
The adult intensive care unit (AICU) at the John Radcliffe Hospital admits both level 1 and level 2 patients. Staffing and ward round times are determined by the number of patients and their care needs so varies by day as required. Handovers for nursing staff are consistent (07:30 and 19:30). The average occupancy for the AICU is between 80 and 85% and the median (IQR [range]) length of stay is 3 (1.7–6.6 [0–67]) days. In keeping with standard hospital design and requirements, surface materials (floor, wall, and counter-tops) are wipe-clean. In December 2015, the SILENCE project replaced old metal bins with soft-close plastic-lidded bins throughout this bay and initiated a teaching programme to increase understanding of the importance of optimising the environment for patient care and wellbeing.17,18 There are no specific sound-proofing materials or reverberation reduction products installed.
Data collection
Sound level data were collected through a bespoke multi-microphone array that mapped sound levels across a single four-bed bay in the general adult ICU at the John Radcliffe Hospital, Oxford. Two self-contained side rooms open onto the main bay. The system of 64 microphones was designed specifically to locate sound origins and has been described elsewhere. 19 Briefly, the four microphone arrays (16 microphones per array) were positioned in the ceiling, roughly central to the main unit. Although the primary purpose of the array system was to identify the geographical source of high sound levels, the data collected also enabled sound levels to be analysed with a high degree of temporal resolution.
The dataset was processed initially in Spark (v2.3, The Apache Software Foundation) which removed the need for sampling and allowed the complete dataset to be analysed. Data were analysed within R Studio (v3.5, R Foundation for Statistical Computing, Vienna, Austria). Data outside upper (95th) and lower (5th) percentile limits (<29 and >52 data points/minute) were excluded and only days with full 24-h coverage were included.
We summarised data by minute, hour, and day of the week. At each timepoint the system captured third-octave frequency bands, 20 maximum, minimum, mean, and median values for standard sound level reporting (LAeq), and ‘loudness’ (measured in decibels). ‘Loudness’ can be calculated in a number of different ways, all of which result in a numerical estimate of “typical” human perception of sound. The Zwicker method is recommended as the most appropriate method for calculating loudness for time-varying signals 14 and was used for this project.
Results
The analysis dataset comprised data collected over 275 full (but not contiguous) 24-h periods between 28 October 2016 and 21 May 2018. This represents 65% of the 426 days on which data were captured between 26 October 2016 and 24 May 2018 (see Figure 1).
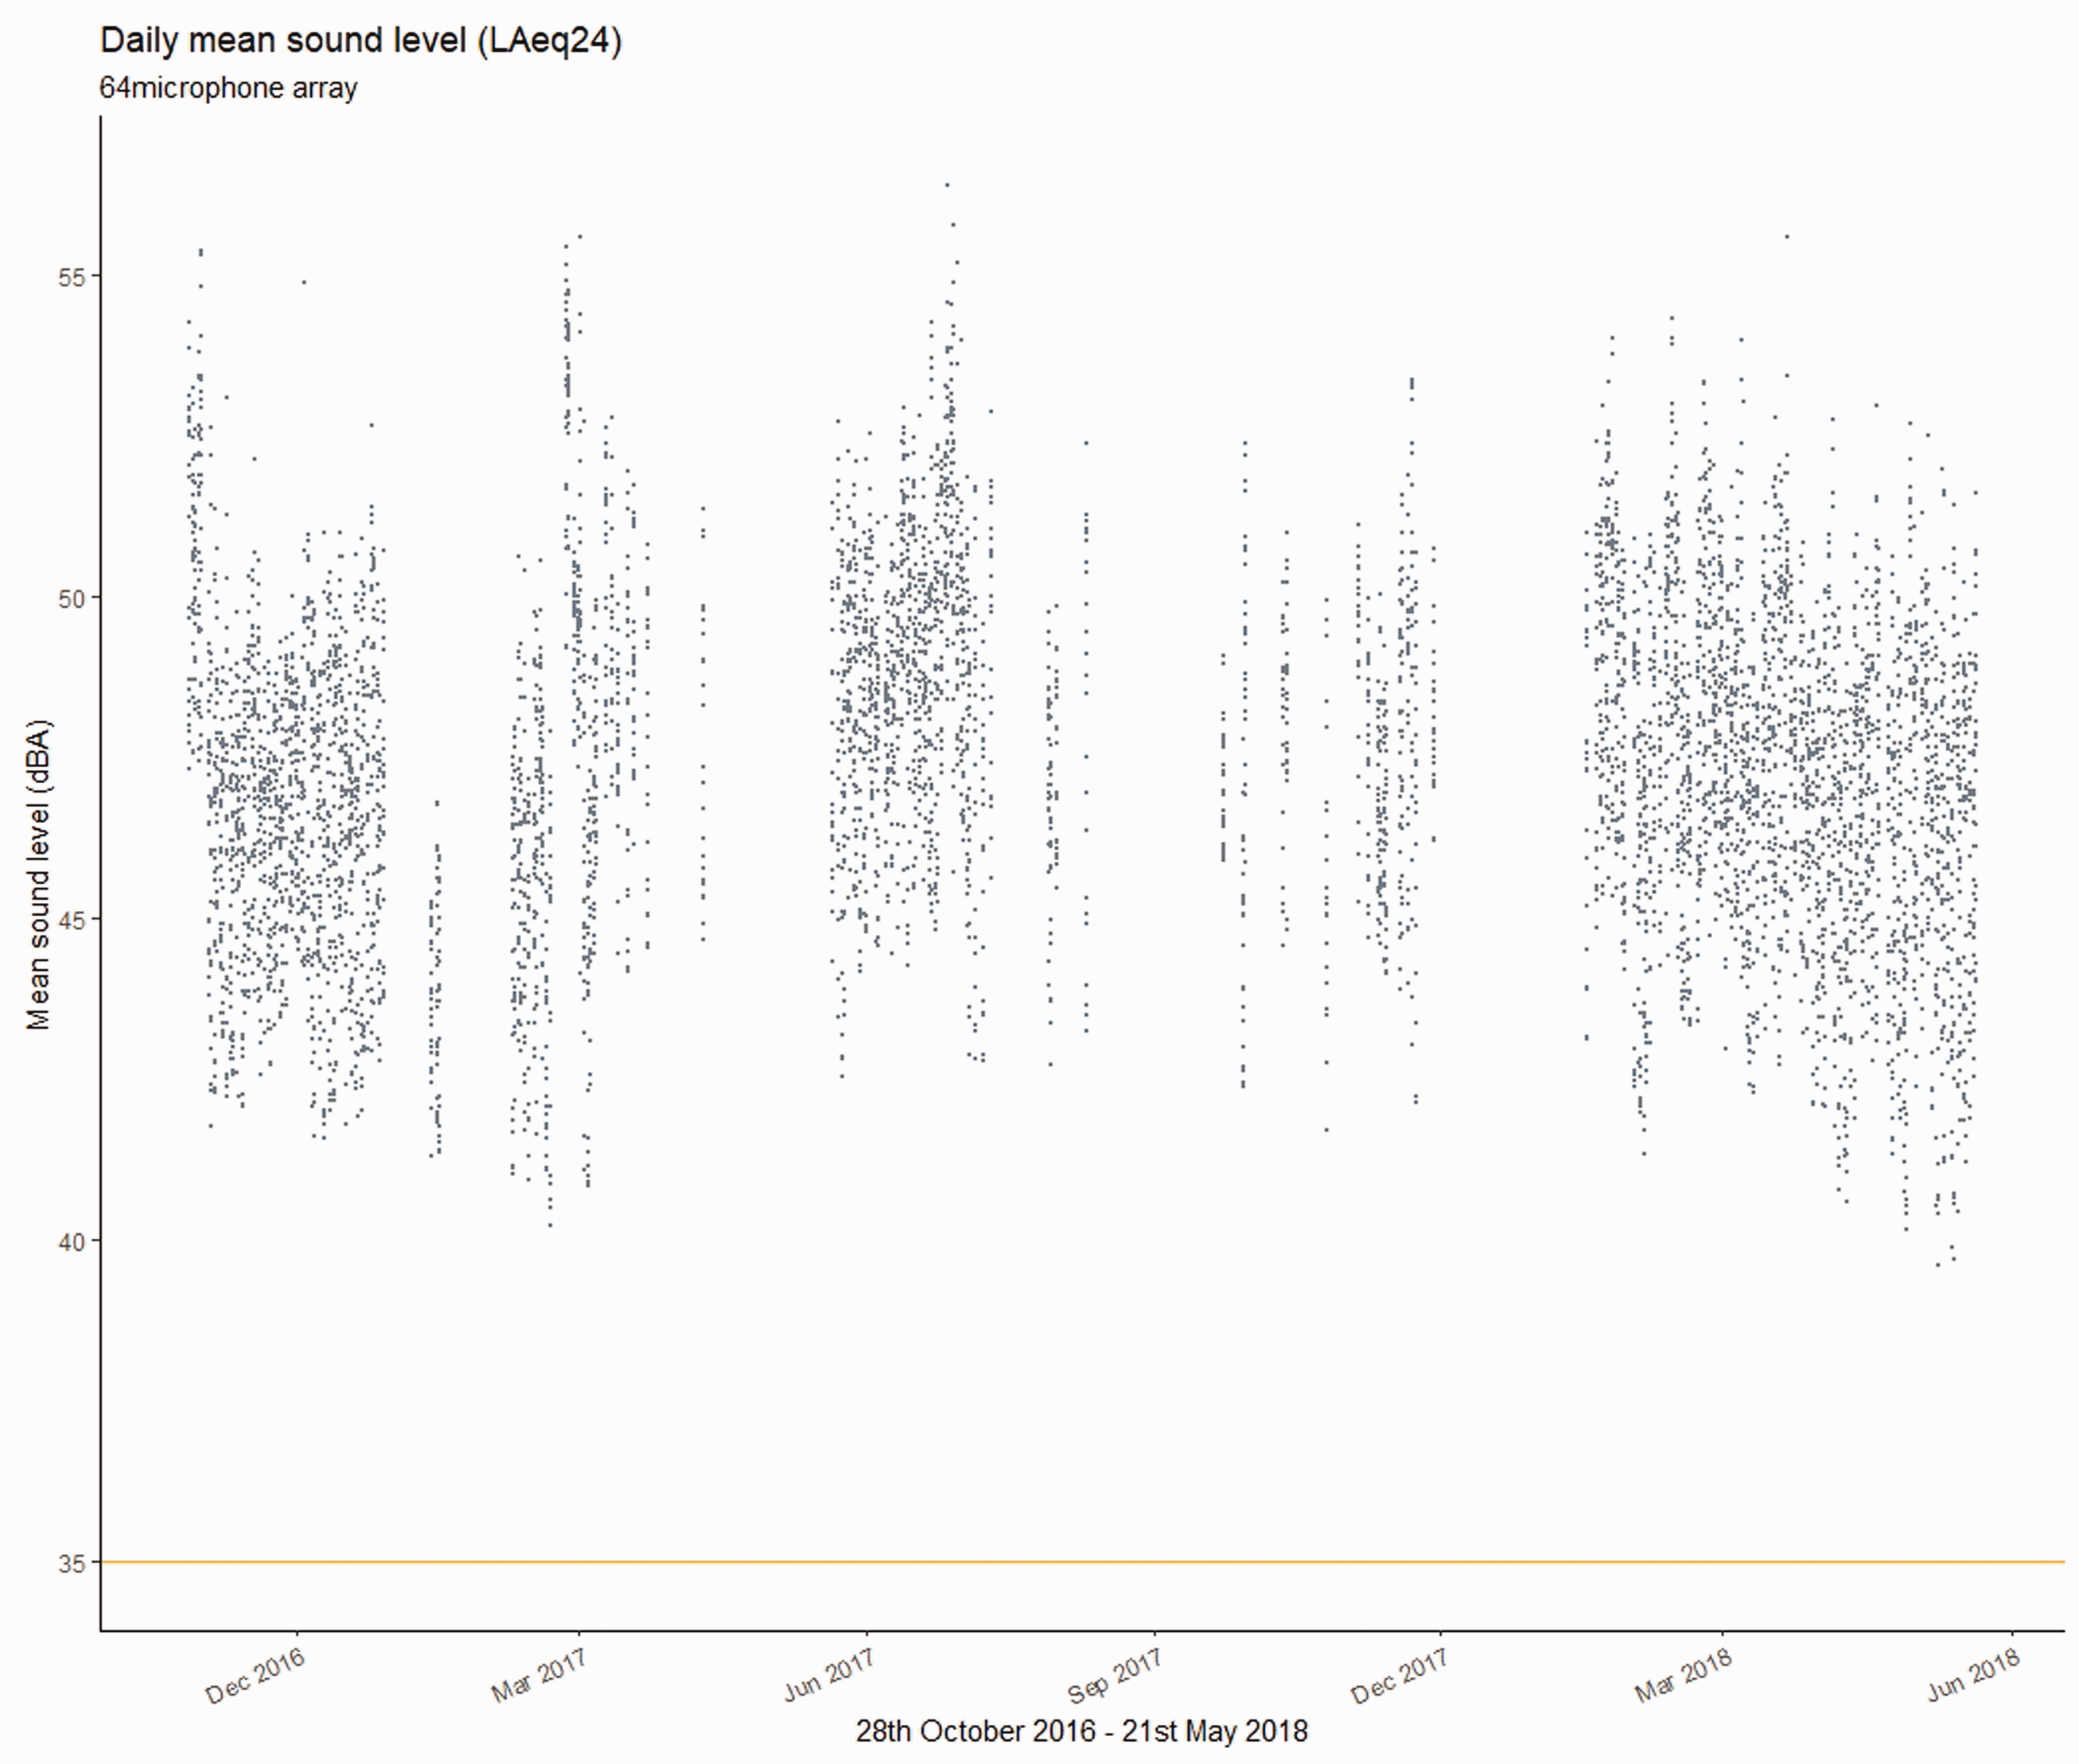
Mean sound level values per day from each of the 64 microphones from the array. The reference line at 35 dBA indicates the WHO guideline sound level.
On no day was the mean sound level (LAeq24) below the WHO guideline limit of 35 dBA.
Across the full timeframe the mean daily sound levels (LAeq24) recorded by individual microphones varied between 43.1 dBA (19 February 2017) and 53.2 dBA (26 February 2017), with an overall mean of 47.4 dBA. There was considerable variation between simultaneous values despite close proximity of microphone location.
The mean sound level for individual hours varied between a low of 39.6 dBA (02.00–03.00 9 May 2018) and a high of 56.4 dBA (07.00–08.00 27 June 2017). The highest LAeq(minute) value recorded in any hour was 101.7 dBA (between 21.00 and 22.00, 29 September 2017. The lowest LAeq(minute) value recorded during any hour was 21.6 dBA (between 06.00 and 07.00, 3 July 2017).
Hourly mean sound levels of combined data from all microphones are shown in the box and whiskers plot (Figure 2). This shows the ICU has a circadian rhythm with sound levels rising during the morning to a plateau between 45 and 50 decibels before falling again overnight. There is a slight reduction in sound levels around lunchtime.
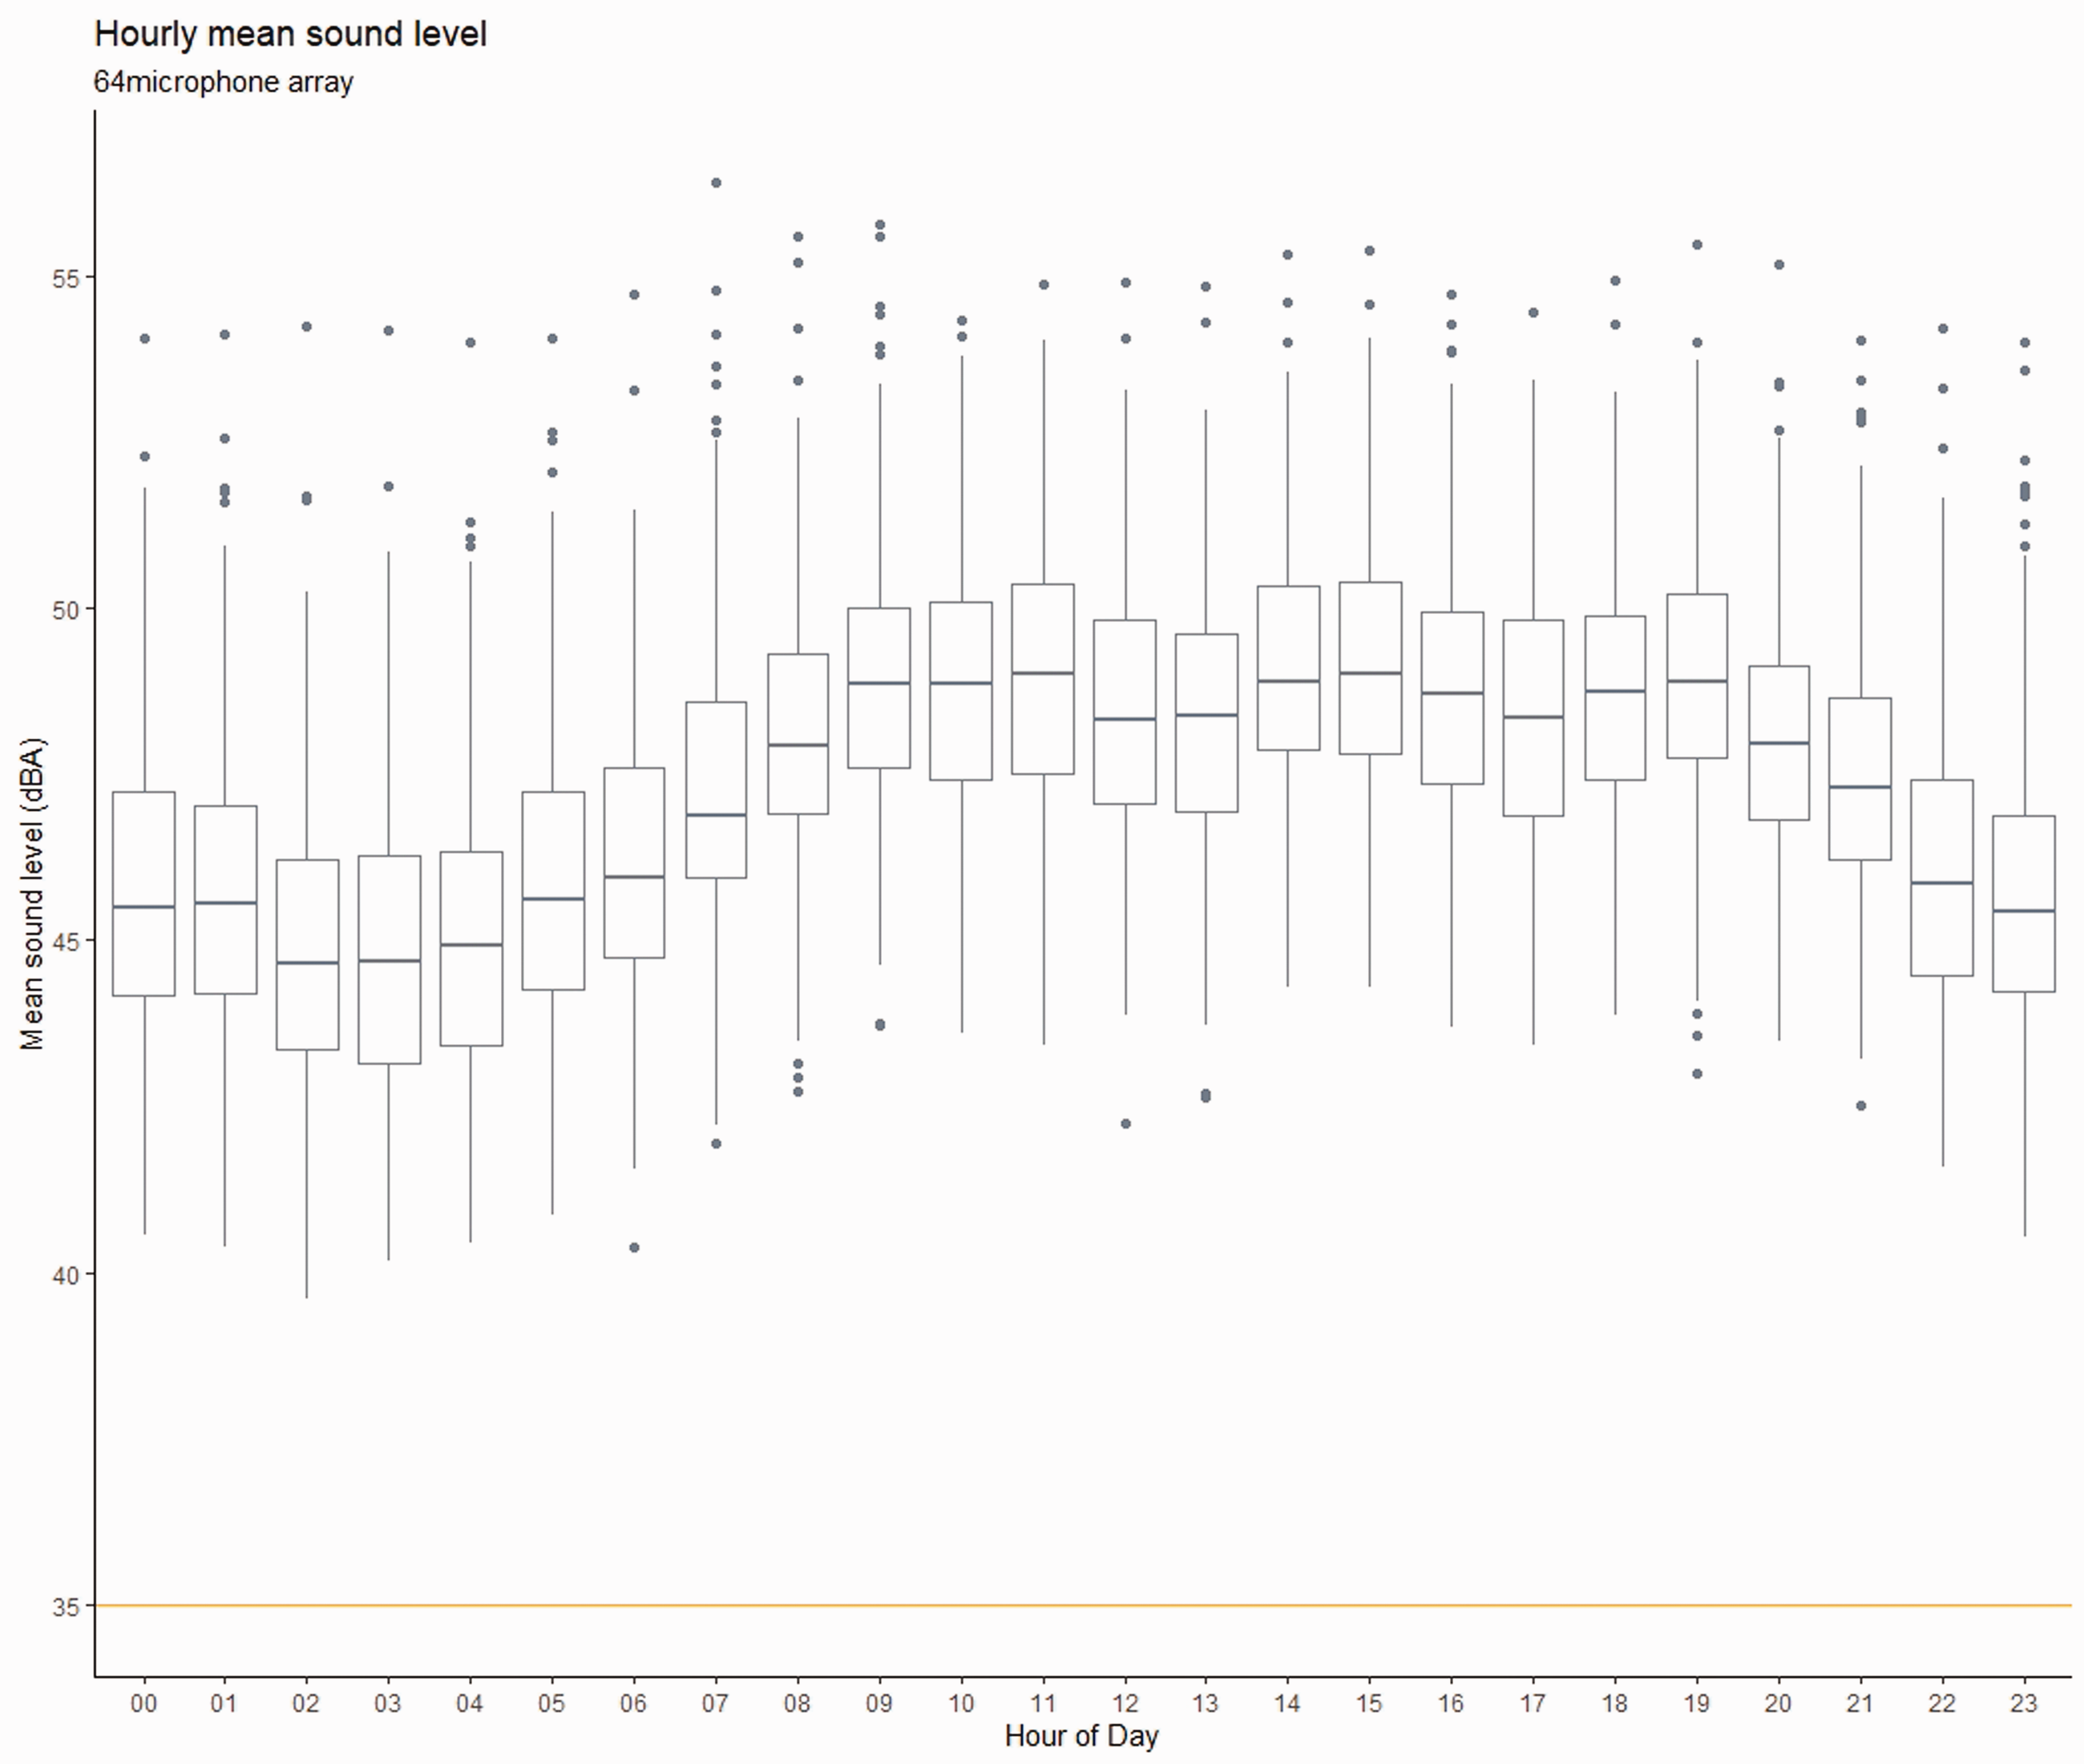
Mean sound levels (combined results from all microphones) by hour with reference line at 35 dBA indicating the WHO guideline sound level.
Loudness
Figures 3 and 4 show the relationship between the standard reporting measure for environmental monitoring, the daily mean sound level (LAeq24), and equivalent mean loudness. The mean loudness values (measured over 24 h) are higher than 60 dB nearly every day. Maximum standard A-weighted sound levels overnight (22.00–06.00) were never below the WHO overnight threshold of 40 dBA. Corresponding maximum loudness values were almost always >100 dB.
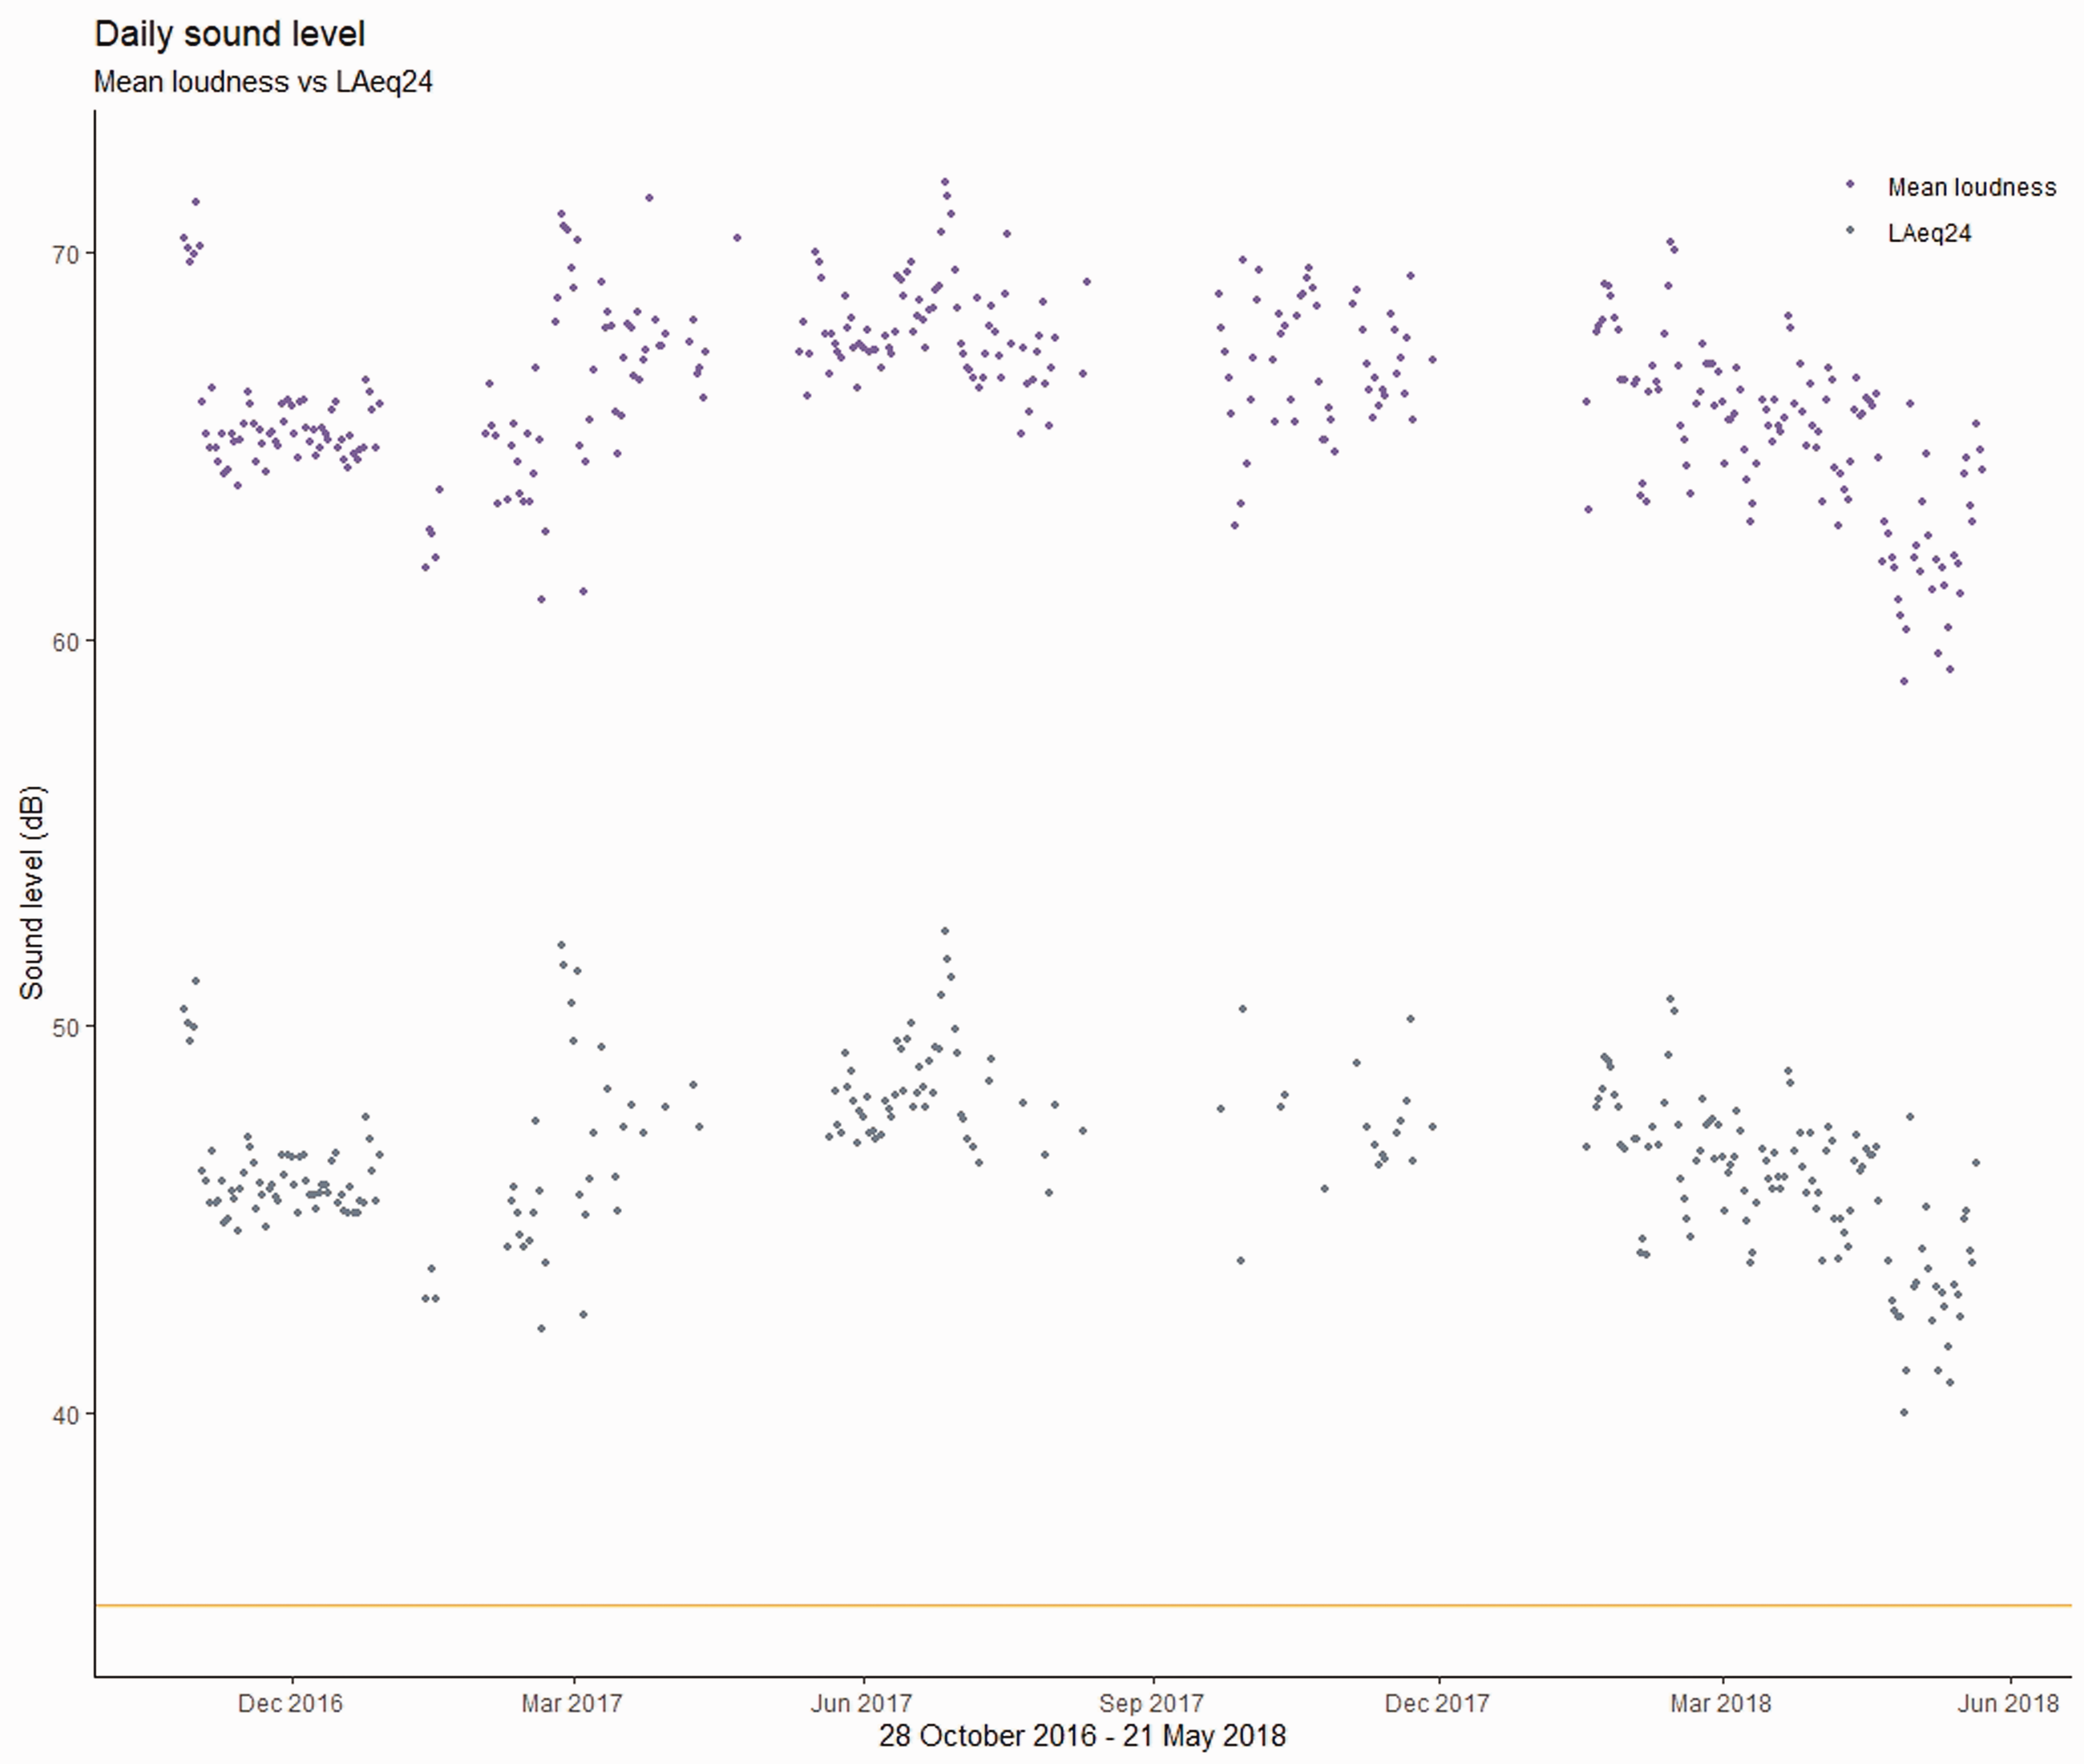
Daily sound levels (combined results from all microphones) comparing the standard reporting value (LAeq24) with corresponding mean loudness values. The reference line at 35dBA indicates the WHO guideline sound level (measured as LAeq24).
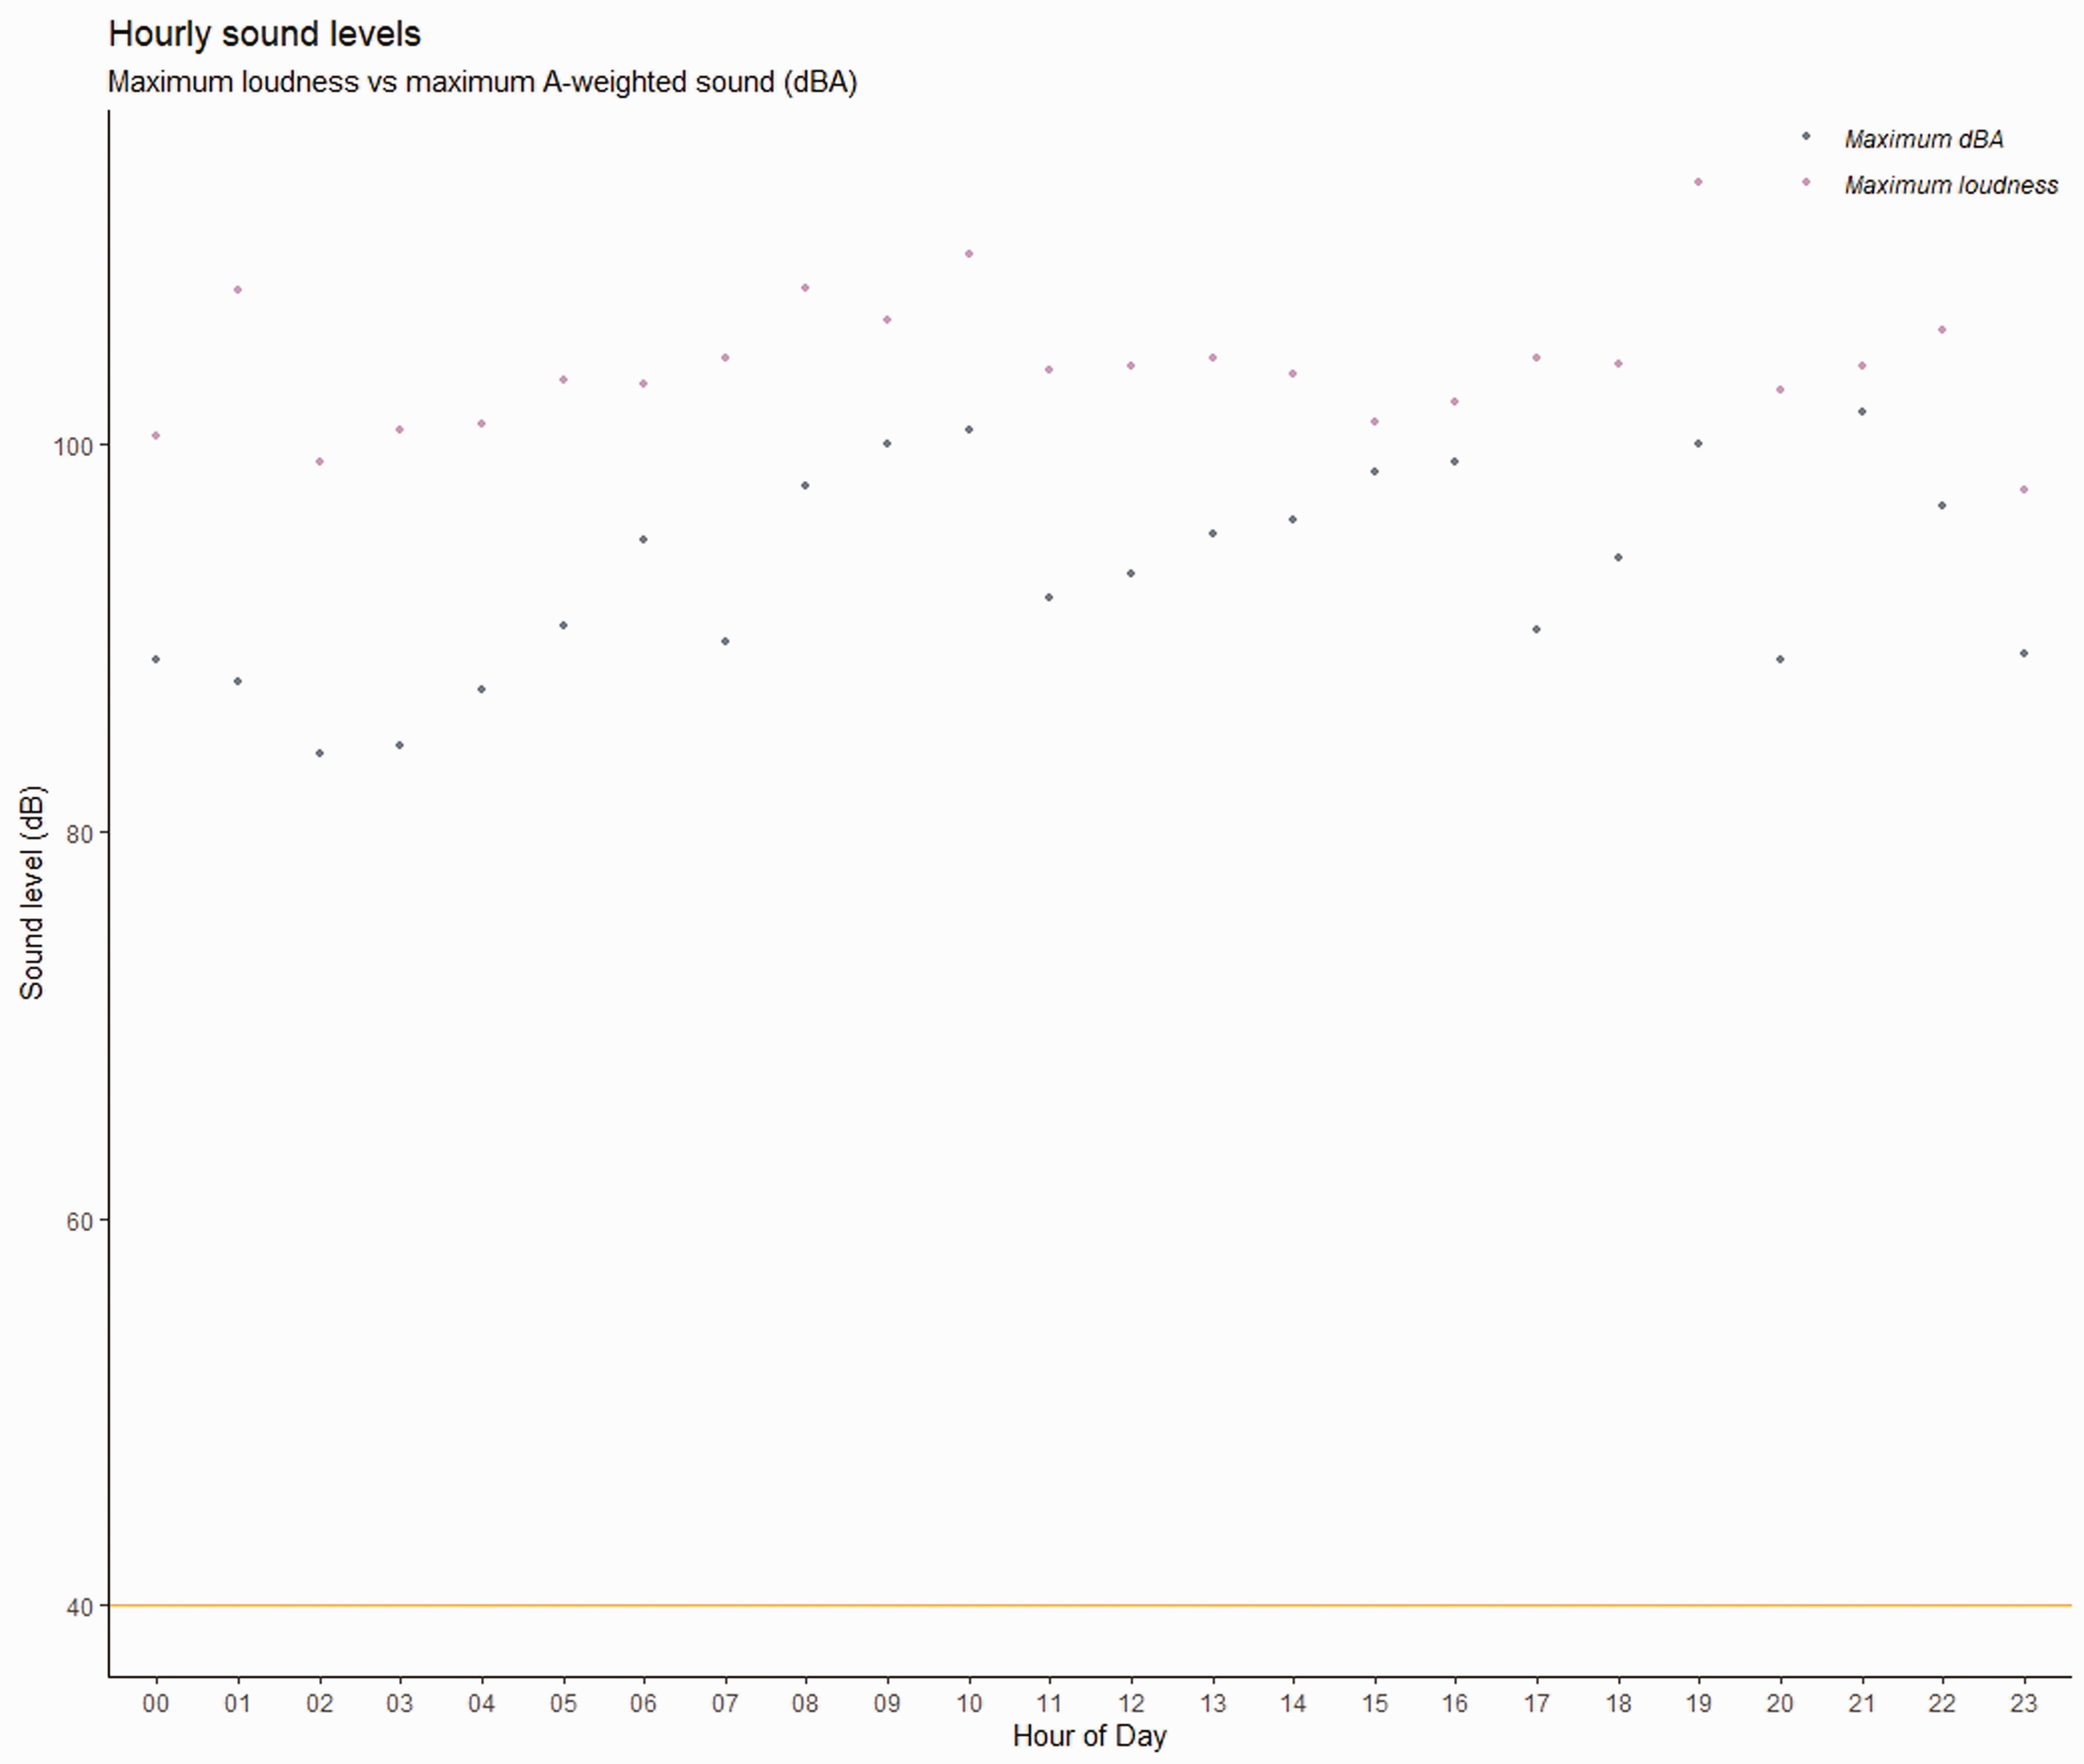
Combined results from all microphones comparing maximum dBA values with maximum loudness values by hour of day. The reference line at 40 dBA indicates the WHO guideline for maximum sound level overnight.
Sound level by day of week
Clinical activity in the ICU reduces at weekends due to variation in staffing levels and a reduction in elective surgical activity. It is reasonable to think this might translate into variable sound levels across the week. Differences between weekend and weekday levels were significantly different statistically (Mann–Whitney U test) but the difference was of no practical significance (see Table 1) and the reality of similarity in sound levels across the seven days is obvious in Figure 5.
Weekday versus weekend sound levels.

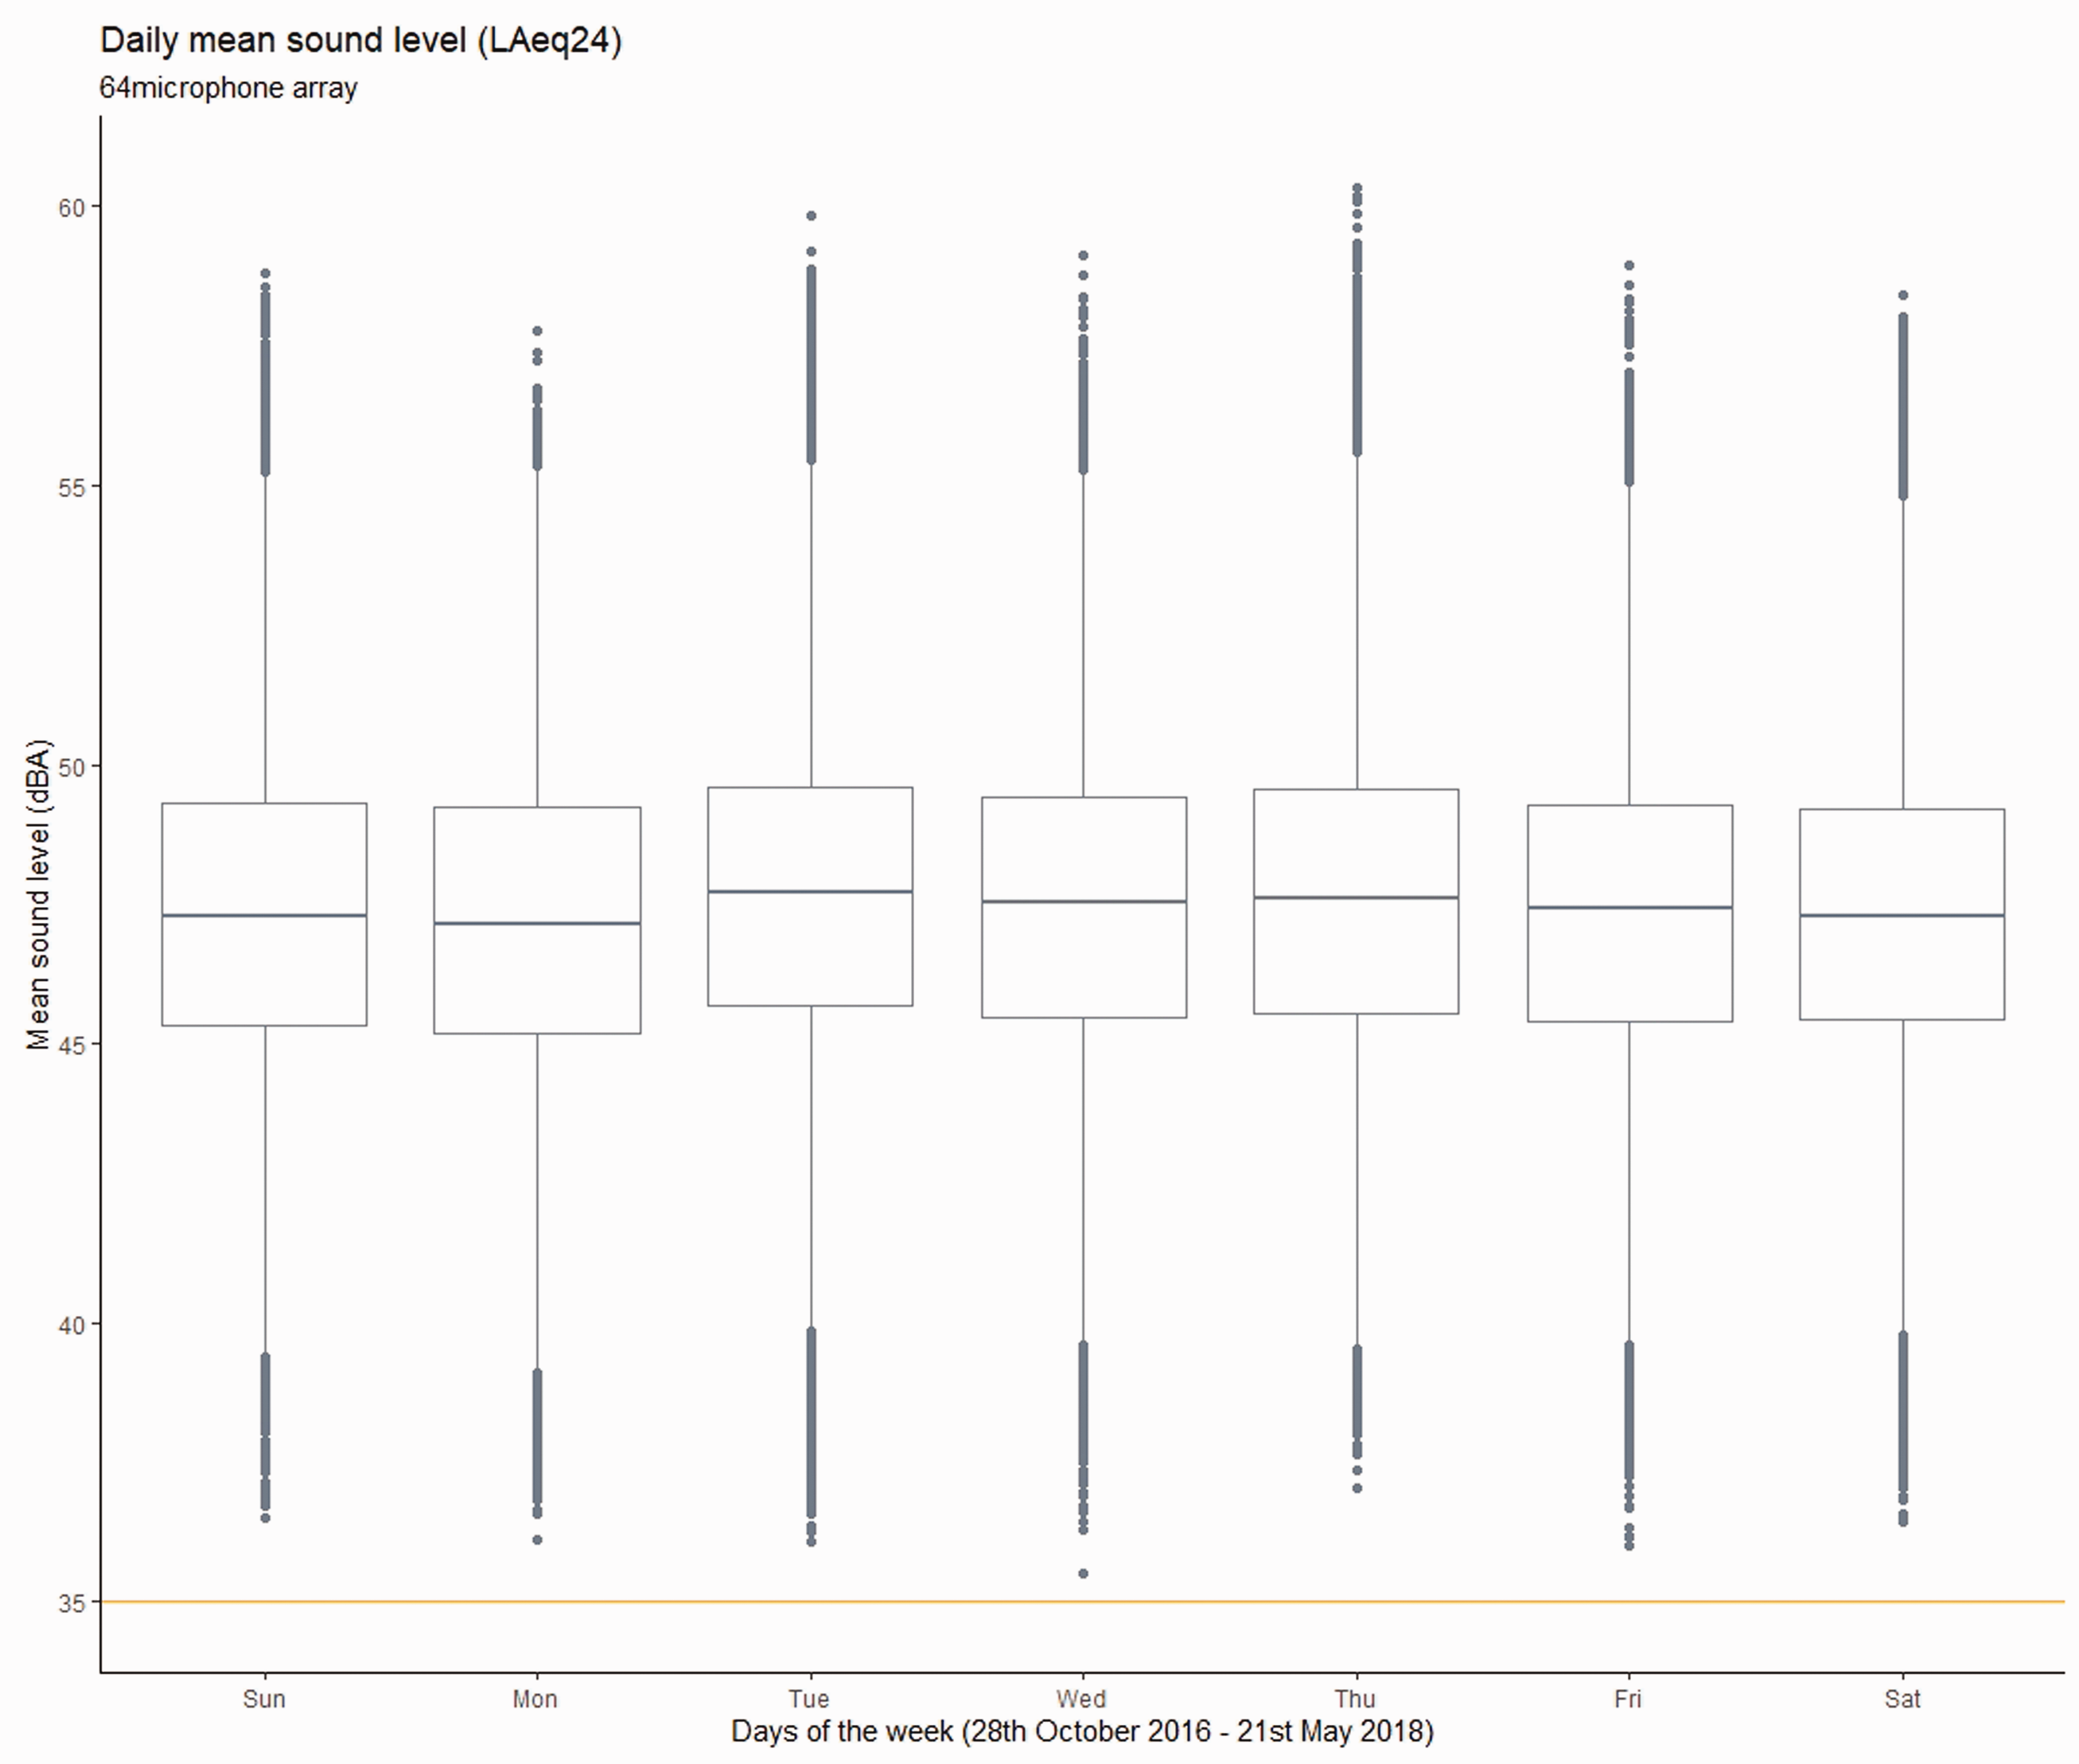
Mean sound levels (combined results from all microphones) by day of the week with reference line at 35 dBA indicating the WHO guideline sound level.
Figures 1 and 3 also show the trajectory of sound levels over the study period. Visually it appears that sound levels dropped towards the end of the study however more detailed analysis indicates a rise of just under 1 dB between the first three months of 2017 and the same three months a year later.
Between 13 January and 23 March 2017 (31 days included in analysis) the daily mean sound level values (LAeq24) varied between 40.2 dBA (20 February) and 55.6 dBA (2 March), with an overall mean across the quarter of 46.9 dBA. The highest value recorded during any single day was 96.8 dBA (between 09.00 and 10.00, 25 February). The lowest value recorded was 29.7 dBA (between 12.00 and 13.00, 20 February).
Between 17 January and 31 March 2018 (65 days included in analysis) the LAeq24 varied between 41.3 dBA (4 February) and 55.6 dBA (22 March), with an overall mean across the quarter of 47.8 dBA. The highest value recorded during any single day was 100.0 dBA (between 09.00 and 10.00, 5 March). The lowest value recorded was 26.5 dBA (between 23.00 and 00.00, 22 February).
Discussion
No LAeq24 was compliant with the WHO guideline limit of 35 dBA. All single hour average sound levels were also higher than 35 dBA. The lowest averaged hour level achieved was 39.6 dBA. This was in the early hours of the morning. All overnight values were higher than the WHO recommended maximum of 40 dBA. Over time, sound levels have risen. The increase of <1dB is not apparent to human hearing but the trend is consistent with other reports of sound levels in the ICU 3
The data demonstrate the ICU is quieter at weekends. However, the difference between weekdays and weekends is just 0.2 dB which is not detectable in practice. For a change in sound levels to be meaningful there needs to be a difference of at least 3 dB. Studies that assert statistical significance should also recognise that the clinical interpretation may be negligible. 21 The similarity in sound levels in this dataset suggests daily activity levels for the ICU remain constant. With reduced ancillary services available elsewhere in the hospital (scanning, X-ray, etc.) it might be supposed that interdepartmental transfers, reviews, and consultations would reduce at the weekend and that this might have an effect on sound levels. This does not seem to be the case. The similarity of sound levels across the week indicates that the soundscape of the ICU is principally affected by activities and behaviours within the ICU itself.
There has been much speculation on links between high noise levels, limited sleep, and developing delirium in the ICU. Outside of critical care there are known associations between poor sleep and disrupted psychological health.22,23 Patients admitted to the ICU frequently attribute noise and disturbance overnight to their poor sleep24–28 and a recent review has shown the risk of developing delirium in the ICU can be reduced by giving earplugs to patients. 29 This suggests that despite the development of delirium in the ICU being associated with severity of illness and some drug treatments, 11 and studies recognising that just 11–17% of arousals overnight can be attributed to noise,30–32 sleep and noise do have a role to play in the physical and psychological recovery of patients admitted to the ICU. 10
The high temporal fidelity of sound level monitoring highlighted the 24 h pattern previously identified. 4 This demonstrates clearly that sound levels fluctuate more than daily mean values indicate. It is also clear that peak sounds above 85 dBA are frequent, influencing the mean values. The early work from the SILENCE project also highlighted that patients admitted to the ICU could expect to hear sounds over 85 dBA up to 16 times overnight and more often during the day. 4 Sounds at this level are likely to be alarms and other equipment-related noises. Although other studies have identified speech as a source of noise in the ICU,33,34 normal speech volume is around 55 dB and, even accounting for the natural increase required to be intelligible above background levels, 6 it would be unusual for speech to register above 85 dB. This constancy of peak sounds throughout the day and night lead to limited reductions in sound levels overnight. Given that other work from the SILENCE project showed sound level data are also sensitive to location, 12 new standards for monitoring sound levels in the ICU are perhaps needed.
The LAeq of the AICU is unlikely to ever be high enough to be harmful to hearing but the qualities of sounds in the AICU are highly disturbing for both patients and staff. For in-hospital assessment of sound and noise, it is the experience of sound that is perhaps more relevant rather than physically damaging effects. The field of psychoacoustics is developing rapidly and the psychological effects of different sounds on humans are now being explored in more detail and reported more frequently. As a result, different measures that reflect the human perception of sound and understanding of noisiness are being explored.35,36 One of these measures is the Zwicker ‘loudness’ calculation 14 that produces a measurable value approximating the human experience of sound. In environments dominated by higher frequency sounds (such as alarms which are known to be more disturbing to humans than lower frequency sounds of the same volume), the loudness values will be considerably higher than routinely reported LAeq. In this environment the experience of LAeq 24 values of around 47 dBA is shown to be higher, registering loudness values around 65–70 dB; and peak sounds ∼85 dBA are perceived as being >100 dB. As well as being high volume, the qualities of alarm sounds mimic the ‘acoustic roughness’ 37 of a baby’s cry or human scream. A common sonic interval used for alarms is the tritone (two notes, three tones apart). The tritone is particularly dissonant and unpleasant to the human ear. This dissonance triggers an innate reaction within the amygdala, the area of the brain that processes fear/danger responses. 38 For patients who are already in a heightened state of arousal, the constant startle effect from alarms is likely to trigger additional adverse effects. Work is currently underway to reduce the harshness of alarms.39,40 This is unlikely to reduce hospital LAeq24, but the modified tones may reduce disturbance and stress response.
The nursing mental model 41 of the ICU centres on the patient. For nurses, bed space sound levels are something they can equate directly to their patients’ experiences of intensive care. It is also a physical space over which they have some degree of control. Sound levels vary logarithmically with distance from the noise source.42,43 The spatial analysis previously published 12 suggests that higher decibel levels are likely to be generated by alarms and other equipment commonly at patient bedsides. The proximity of patients to noise source maximises the ill effects of high sound levels. Alongside overnight peaks in loudness, this may go some way to explain why the environment is not quite as ‘restful’ as average night-time sound levels suggest. With evidence that 90% of alarms are ‘false positives’ 44 and recognition that alarms can contribute to patient disorientation and distress, 45 more needs to be done to reduce disturbance from patient monitoring equipment.
Noise cancellation or isolation (for example active headphones or ear plugs) might go some way to reduce the overall experience of sound but is most effective at frequencies below 500 Hz. It is largely not effective for frequencies above 1,000 Hz and the frequency range of patient monitor alarms in the ICU is 2.5–3.15 kHz. Introducing white or pink noise has been shown to improve working conditions in an open office 46 and to reduce annoyance in healthy volunteers. 47 Both include a broad spectrum of frequencies that result in a fairly high-pitched ‘hissing’. Pink noise differs in that higher frequencies are less prominent and may be more pleasing to the ear. It may also be possible to create individualised zones of silence 48 by manipulating the local sound environment around patients’ heads with acoustic masking or cloaking 49 that would make the immediate area around the top of the bed much quieter than the surrounding space.
Conclusions
It is clear that statistical significant differences in sound level do not necessarily translate into differences that can be detected by human hearing. Care needs to be taken to interpret sound data results in context, with an understanding of the features of environmental sound, and how different sounds are perceived. In the ICU, environmental sound protection perhaps needs to focus on reducing disturbances rather than lowering overall decibel values.
Identification of ‘loudness’ seems a more meaningful measure of noise levels in the hospital environment. The daily mean (LAeq24) is inappropriate for measuring sound levels in the ICU. Multiple high peaks influence the LAeq24, distorting the measure. Previous work has also shown how single point measures can be misleading in the ICU due to the specificity of localised sounds. The ‘loudness’ value, along with the other similar measures that calculate the psychological impact of sound, acknowledges that sounds of higher frequencies (such as alarms) will be more disturbing than lower frequency sounds at equivalent decibel levels. Recognition of ‘loudness’ as a more representative value of noise levels as experienced by patients needs further investigation but is a promising alternative to the LAeq24 for environments such as the ICU where the problem is disturbance rather than hearing damage.
Footnotes
Authors’ contributions
JLD and JDY designed the study; JLD analysed the data; both authors contributed to and approved the final manuscript.
Availability of data and material
The datasets analysed during the current study are available from the corresponding author on reasonable request.
Acknowledgements
Many thanks to Dr Markus Muller-Trapet, Dr Jordan Cheer, and Professor Filippo Fazi from the University of Southampton Institute for Sound and Vibration Research for their expertise and enthusiasm designing the microphone array. Also thanks to Dr Robert Hatch for creating the computing environment for data analysis and re-formatting the original dataset for Apache Spark.
Declaration of conflicting interests
The author(s) declared no potential conflicts of interest with respect to the research, authorship, and/or publication of this article.
Funding
The author(s) disclosed receipt of the following financial support for the research, authorship, and/or publication of this article: This paper presents independent research funded by the National Institute for Health Research (NIHR) under its Research for Patient Benefit (RfPB) Programme (Grant Reference Number PB-PG-0613-31034). The views expressed are those of the author(s) and not necessarily those of the NIHR or the Department of Health and Social Care.