
Abstract
Background
There is increasing evidence that access to critical care services is not equitable. We aimed to investigate whether location of residence in Scotland impacts on the risk of admission to an Intensive Care Unit and on outcomes.
Methods
This was a population-based Bayesian spatial analysis of adult patients admitted to Intensive Care Units in Scotland between January 2011 and December 2015. We used a Besag–York–Mollié model that allows us to make direct probabilistic comparisons between areas regarding risk of admission to Intensive Care Units and on outcomes.
Results
A total of 17,596 patients were included. The five-year age- and sex-standardised admission rate was 352 per 100,000 residents. There was a cluster of Council Areas in the North-East of the country which had lower adjusted admission rates than the Scottish average. Midlothian, in South East Scotland had higher spatially adjusted admission rates than the Scottish average. There was no evidence of geographical variation in mortality.
Conclusion
Access to critical care services in Scotland varies with location of residence. Possible reasons include differential co-morbidity burden, service provision and access to critical care services. In contrast, the probability of surviving an Intensive Care Unit admission, if admitted, does not show geographical variation.
Introduction
Equity of access is a central tenet of a modern healthcare system.1,2 Equity requires conditions whereby those with equal needs have equal opportunities to access healthcare. Intensive Care Units (ICUs) provide the setting to care for critically ill patients, requiring extensive resources. These cannot be provided in all locations and therefore patients who develop critical illness in remote areas often have to be transferred to regional centres.
There is a recognised variation in the provision of critical care services internationally 3 and a growing interest in the subject of geographical equity within national healthcare systems. 4 A recent study from Denmark concluded that, whilst there was only minimal geographical variation in Intensive Care admissions and interventions at the regional level, there was pronounced variation at the municipality level. 5 A further study, from Scotland, specifically of elderly patients, has shown regional variations in admission rates. 6 However, neither of these studies employed methods that allow direct probabilistic comparison of the areal units used in their study.
Scotland has large remote and rural areas, including many islands. Accessing critical care services from such locations requires the referring doctor to identify the need for ICU admission, the receiving intensive care physician to accept the patient and a retrieval service to transfer the patient. The aim of this project was to investigate whether location of residence in Scotland impacts on the probability of admission to an ICU and on outcome.
Comparing rates from geographical areas is methodologically complex,7,8 but recent developments in statistical methods and computational power have paved the way for more comprehensive, spatially adjusted models which provide better insights into geographical variations in service utilisation patterns.
We hypothesise that location of residence has no impact on the risk of admission to an ICU in Scotland. Additionally, we also hypothesise that geographical location of residence will not influence outcomes, if admitted to an ICU.
Methods and materials
Study design
This was a population-based Bayesian spatial analysis of patients who required admission to an ICU in Scotland, between January 2011 and December 2015.
Setting
Scotland has a land area of 78,770 km2, including 95 inhabited islands, and in 2011 had a population of 5,299,900. 9 There are 24 ICUs, which are all part of the National Health Service (NHS) in Scotland, 10 and all contribute data to a continuous national audit, administered by the Scottish Intensive Care Society Audit Group (SICSAG). The SICSAG database has been used in multiple previous investigations,6,11,12 and is routinely audited at the local level via local audit coordinators to ensure accuracy and completeness.13,14
Data sources
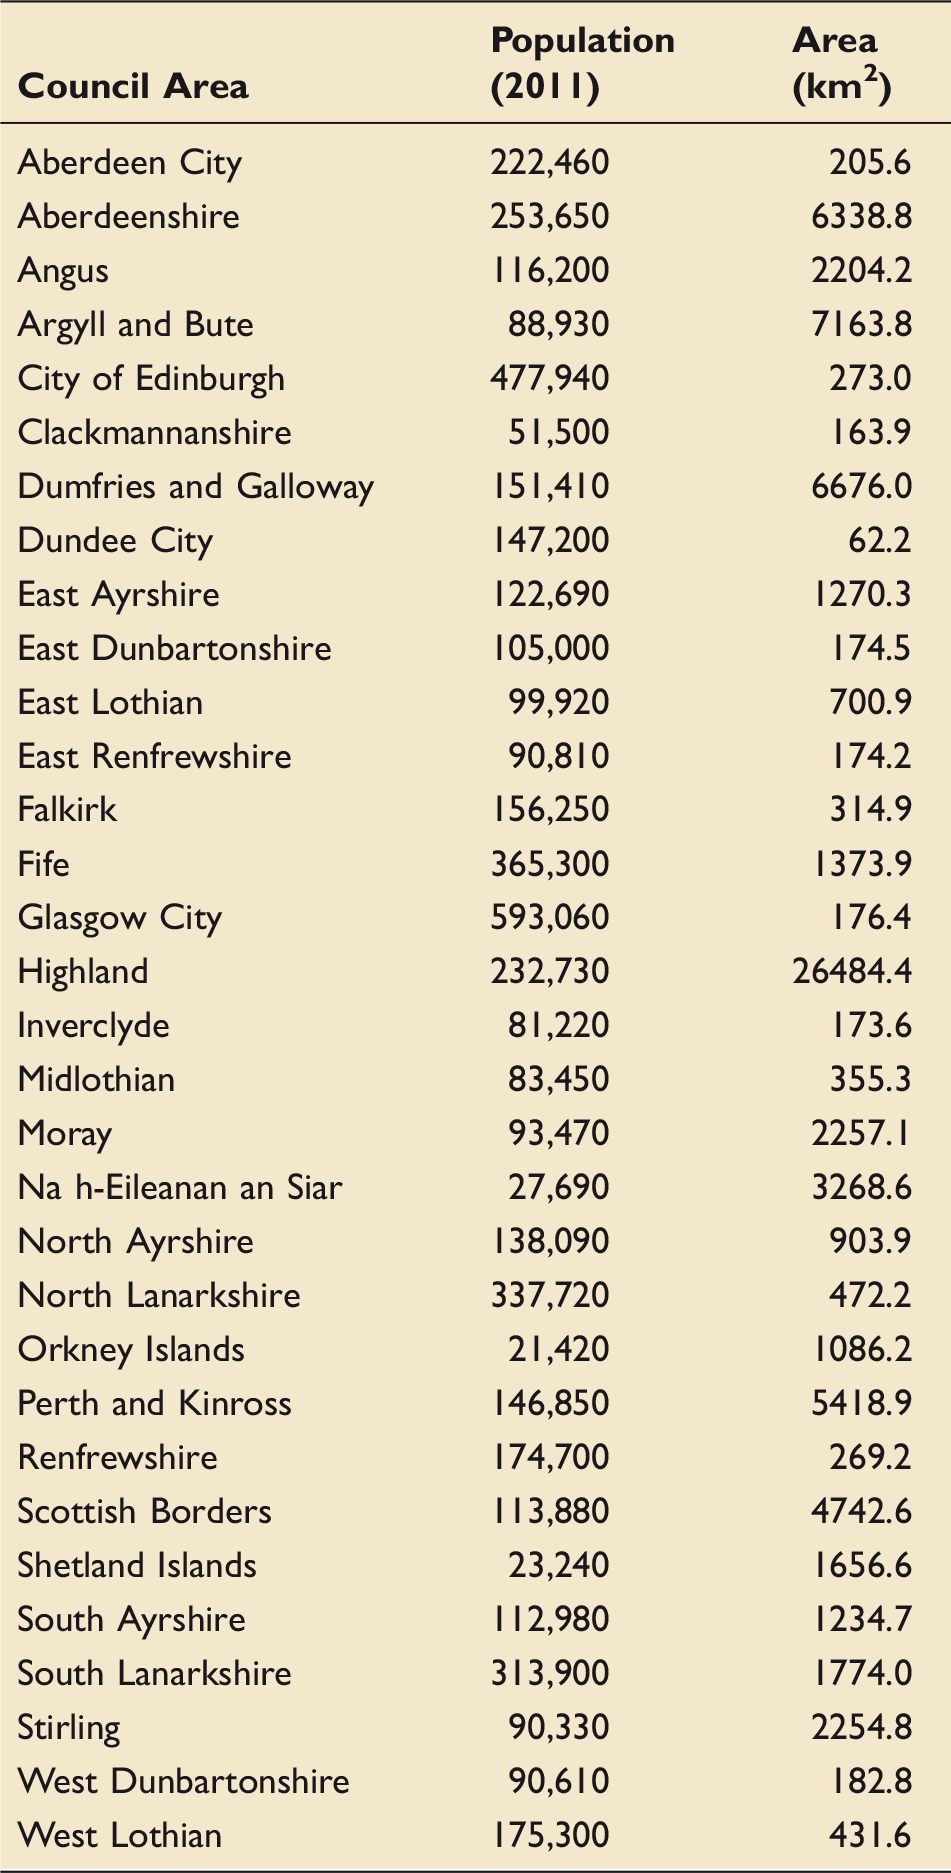
All patient-related data were obtained from SICSAG. The geographical analysis was based on Council Areas, which are geographic and administrative subdivisions of Scotland, overseen by local elected governments, similar in nature to American and English Counties. Geographic and demographic data on Council Areas are freely available from the Scottish Government. 15
Permissions
The study was approved by SICSAG and the Public Benefit and Privacy Panel for Health & Social Care (ref. 1617-0131). 16 All data were accessed and analysed using the North of Scotland “Safe Haven” (ref DaSH-179), provided by the University of Aberdeen, which is a secure remote server that hosts data, minimising the risk of breaches of patient confidentiality.
Participants
We included patients admitted to ICU with a diagnosis other than traumatic injury (the provision of critical care for trauma patients differs), aged 18 years or older, who required tracheal intubation and ventilatory support on the day of admission and whose main residence was in Scotland. We limited the study to patients who required ventilatory support on admission in order to select patients with “level 3” critical illness and exclude patients with “level 2” (high dependency unit, rather than ICU) needs. “Level 3” patients represent a relatively homogeneous group of critically unwell patients that could be compared across multiple sites. This method also eliminated the issue of up-transfer of patients from level 2 to level 3 care within a hospital, which could have impacted on the results. We extracted demographic details, home post codes, admission diagnoses, APACHE II score, Acute Physiology Score (APS) and probability of survival, and hospital outcome (death or survival).
Statistical methods
Demographic and spatial details of the 32 Council Areas in Scotland.
Statistical comparison of one or more geographical areas is complicated by spatial autocorrelation (dependence between areas) and the potential for unstable summary data, 7 where areas with low predicted or observed cases result in extreme and unreliable estimates of parameters. Bayesian hierarchical models overcome these issues through “spatial smoothing”, taking prior information from neighbouring areal units to mitigate the effects of instability and spatial dependence. 18
All data cleaning, analysis and cartography was performed using R. 17 A description of our model and prior specifications 19 can be found in the online supporting information (Supplementary Digital Content – Document 1).
The objective of the first analysis was to estimate the risk of being admitted to an ICU in Scotland, for residents of a given Council Area, relative to that expected if all Council Areas had the same admission rate as the national Scottish average. Given the demographic differences between Council Areas, we used age- and sex-adjusted five-year ICU admission rates. We performed direct age–sex standardisation using the European Standard Population (2013) as our reference population. This produced an age–sex-adjusted expected Scotland wide ICU admission rate. This Scotland wide ICU admission rate was subsequently applied to each individual Council Area to produce estimated counts of expected ICU admissions. 20
We used a Besag–York–Mollié (BYM) model, 21 which is recommended for hierarchical disease mapping studies, 8 and employs a conditional autocorrelation (CAR) prior distribution for the spatially structured random effect. 22 This is based on a pre-defined neighbourhood structure, which allows the model to smooth local rates relative to neighbouring area values. We chose a neighbourhood structure that assumed areas to be neighbouring if any part of their border touches another area. 23 The response variable in this model was the number of ICU admissions per Council Area (count), thus necessitating the use of a Poisson distribution, with an offset provided by the expected number of admissions to an ICU for each Council Area.
The same method was employed to estimate the risk of mortality, if admitted to an ICU. The APACHE II score 24 was used to calculate the number of expected deaths of patients admitted to an ICU by Council Area of residence. The APACHE II score is a commonly used prognostic scoring tool, combining acute physiological parameters, age and chronic health issues. Patients with a predicted mortality of greater than 50% were classified as “expected deaths”.24,25 The APACHE II model has been extensively validated. 13
The classical BYM model we used is defined below:
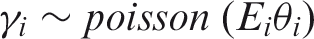
We used Integrated Nested Laplace Approximation (INLA), via the R package R-INLA, 26 which provides a computationally efficient and sufficiently accurate way to sample posterior means to produce Bayesian output. All risk estimates are presented with 95% credible intervals (CrI).
While the model used is not able to produce a summary statistic to quantify the variation in effect size, the “exceedance risk”, as described by Kang et al. 18 allows us to identify Council Areas in which there is a greater than 95% chance that the effect observed differs from the Scottish mean.
A recognised limitation of Bayesian hierarchical models with spatially smoothed conditional autoregressive priors is that they are not able to identify the spatial extent of clusters. 18 Our disease mapping method used aggregates of admissions and mortality per unit area. The areal unit used therefore influences the model output and data interpretation. 27 Our model involves a trade-off between granularity, statistical validity and clinically interpretable outputs. We believe that our unit area – Local Council Areas – is appropriate due to their mid-size, freely available demographic data and reproducibility throughout Scotland and the United Kingdom.
The APS is the sum of the values applied to the 12 physiological parameters used to produce the APACHE II score. 24 We have used this score to allow direct and objective comparisons of acute disease severity between patients.
Results
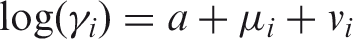
Baseline characteristics of patients included in the analysis.
ICU: Intensive Care Unit; IQR: interquartile range.
Effect of geography on the probability of admission to an ICU
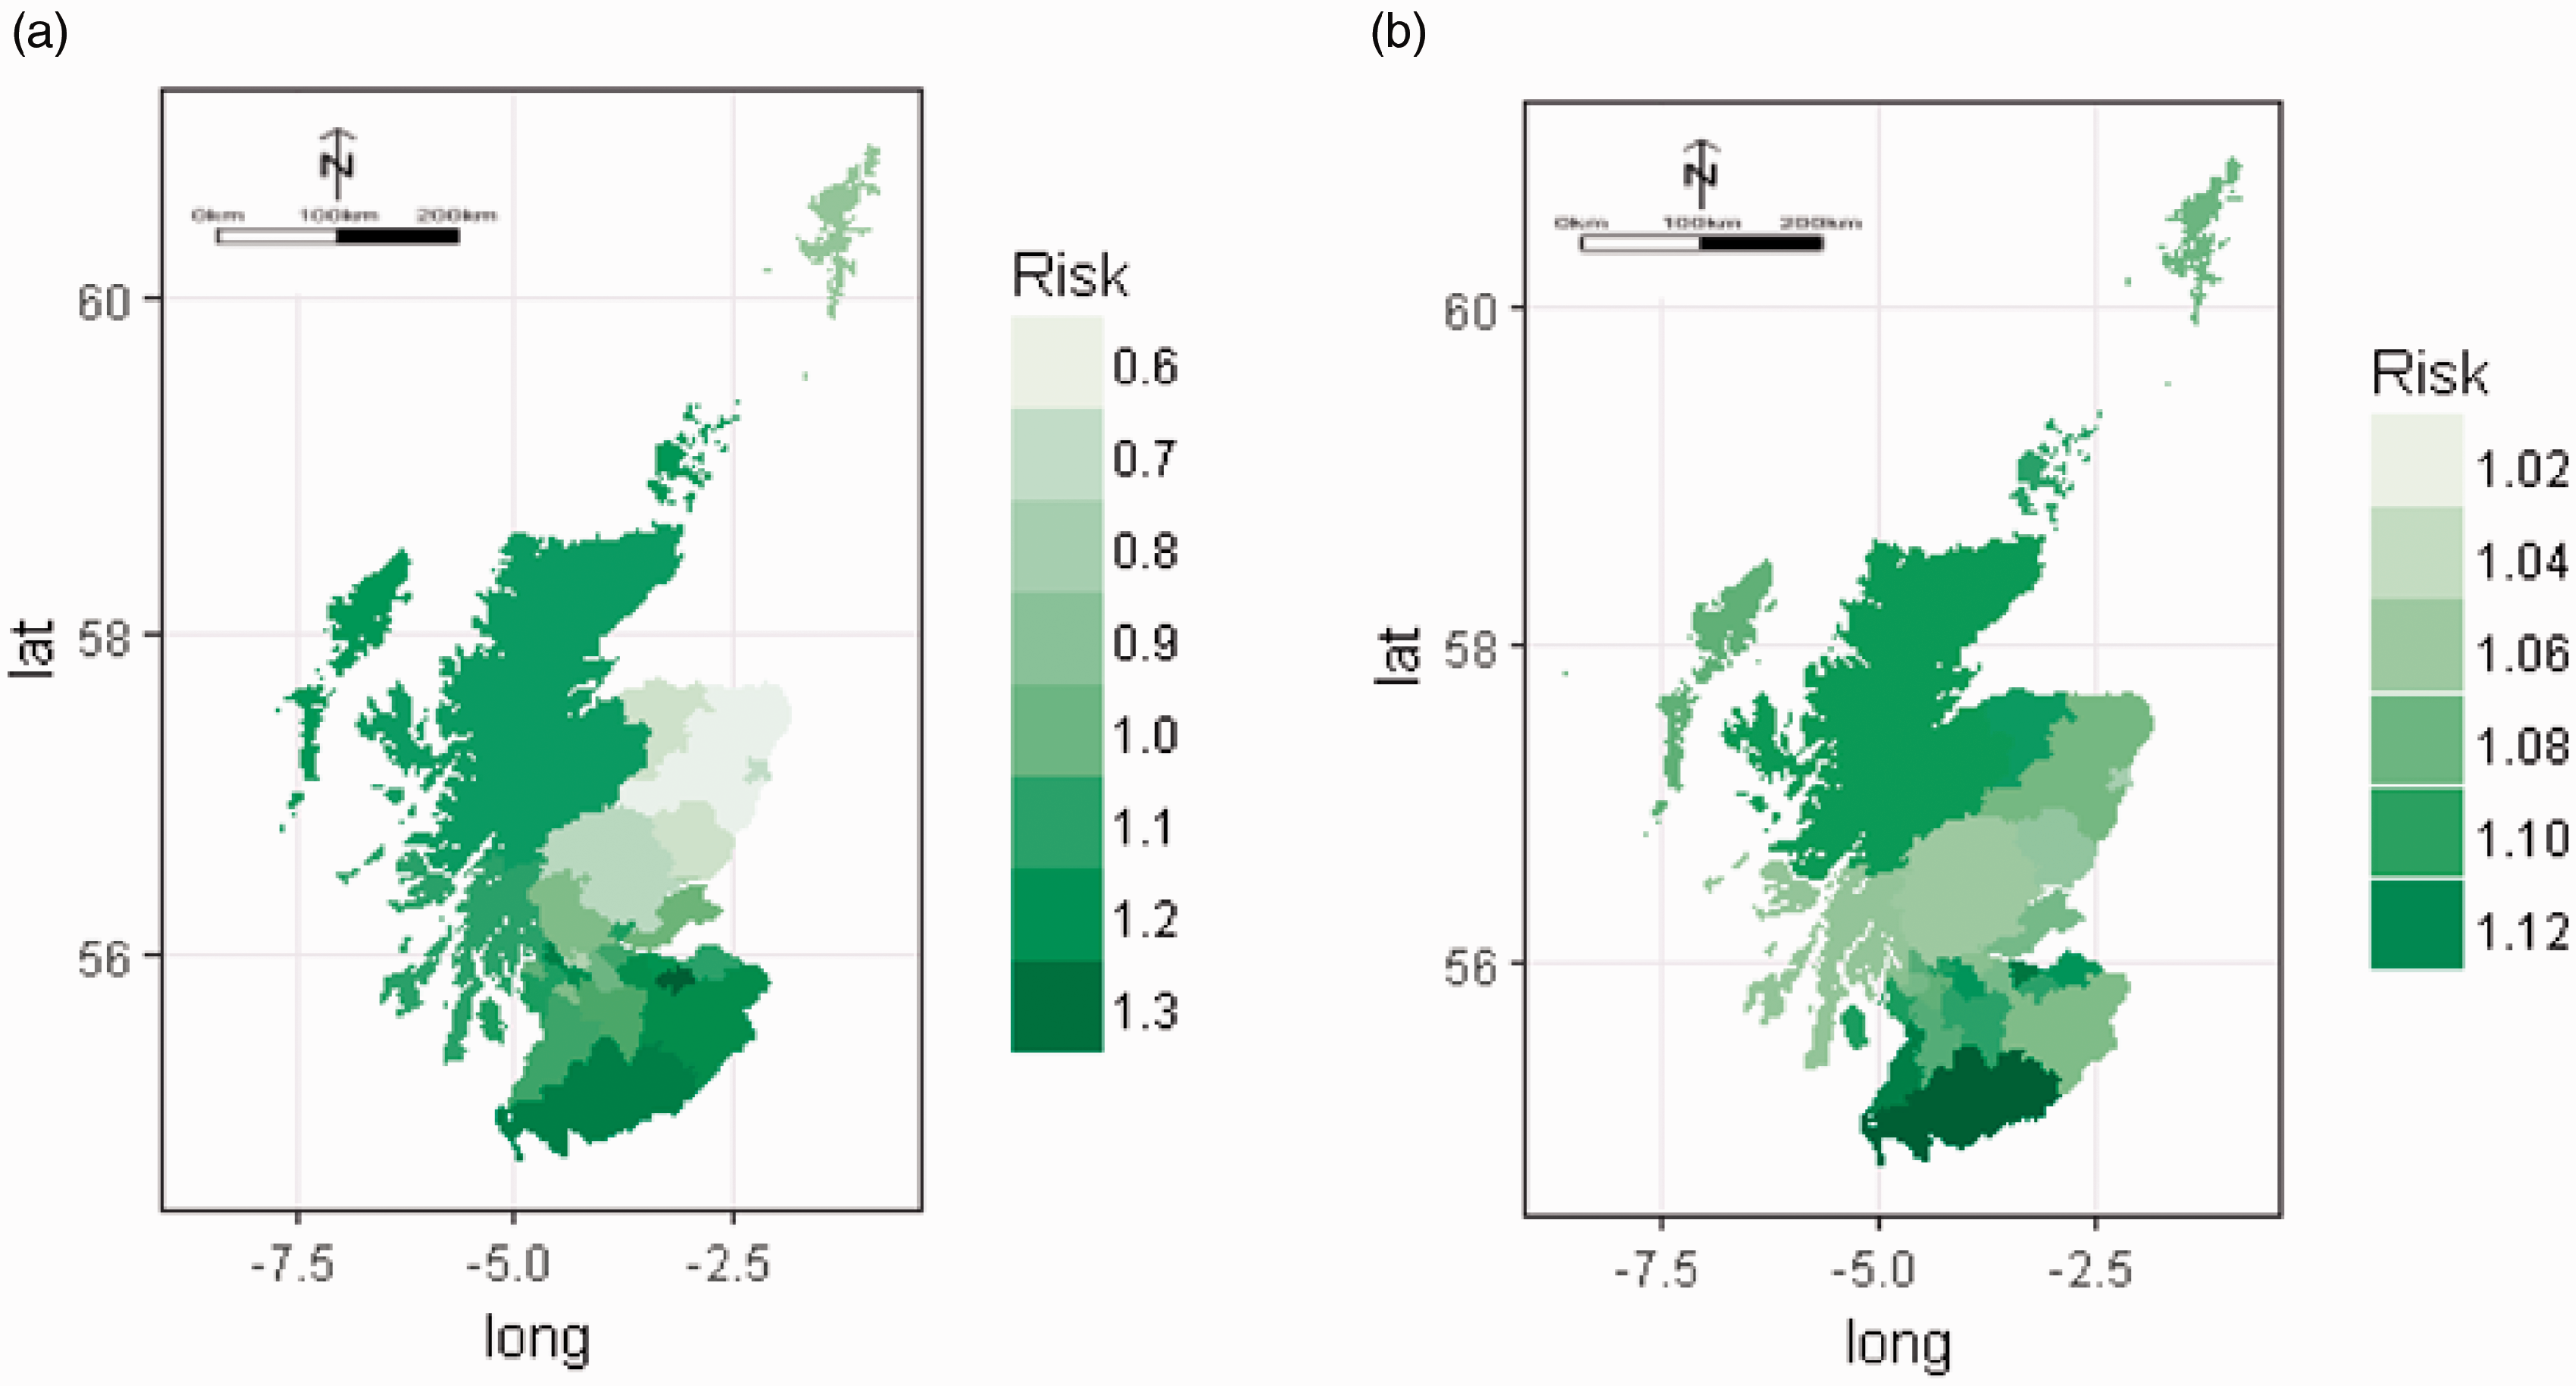
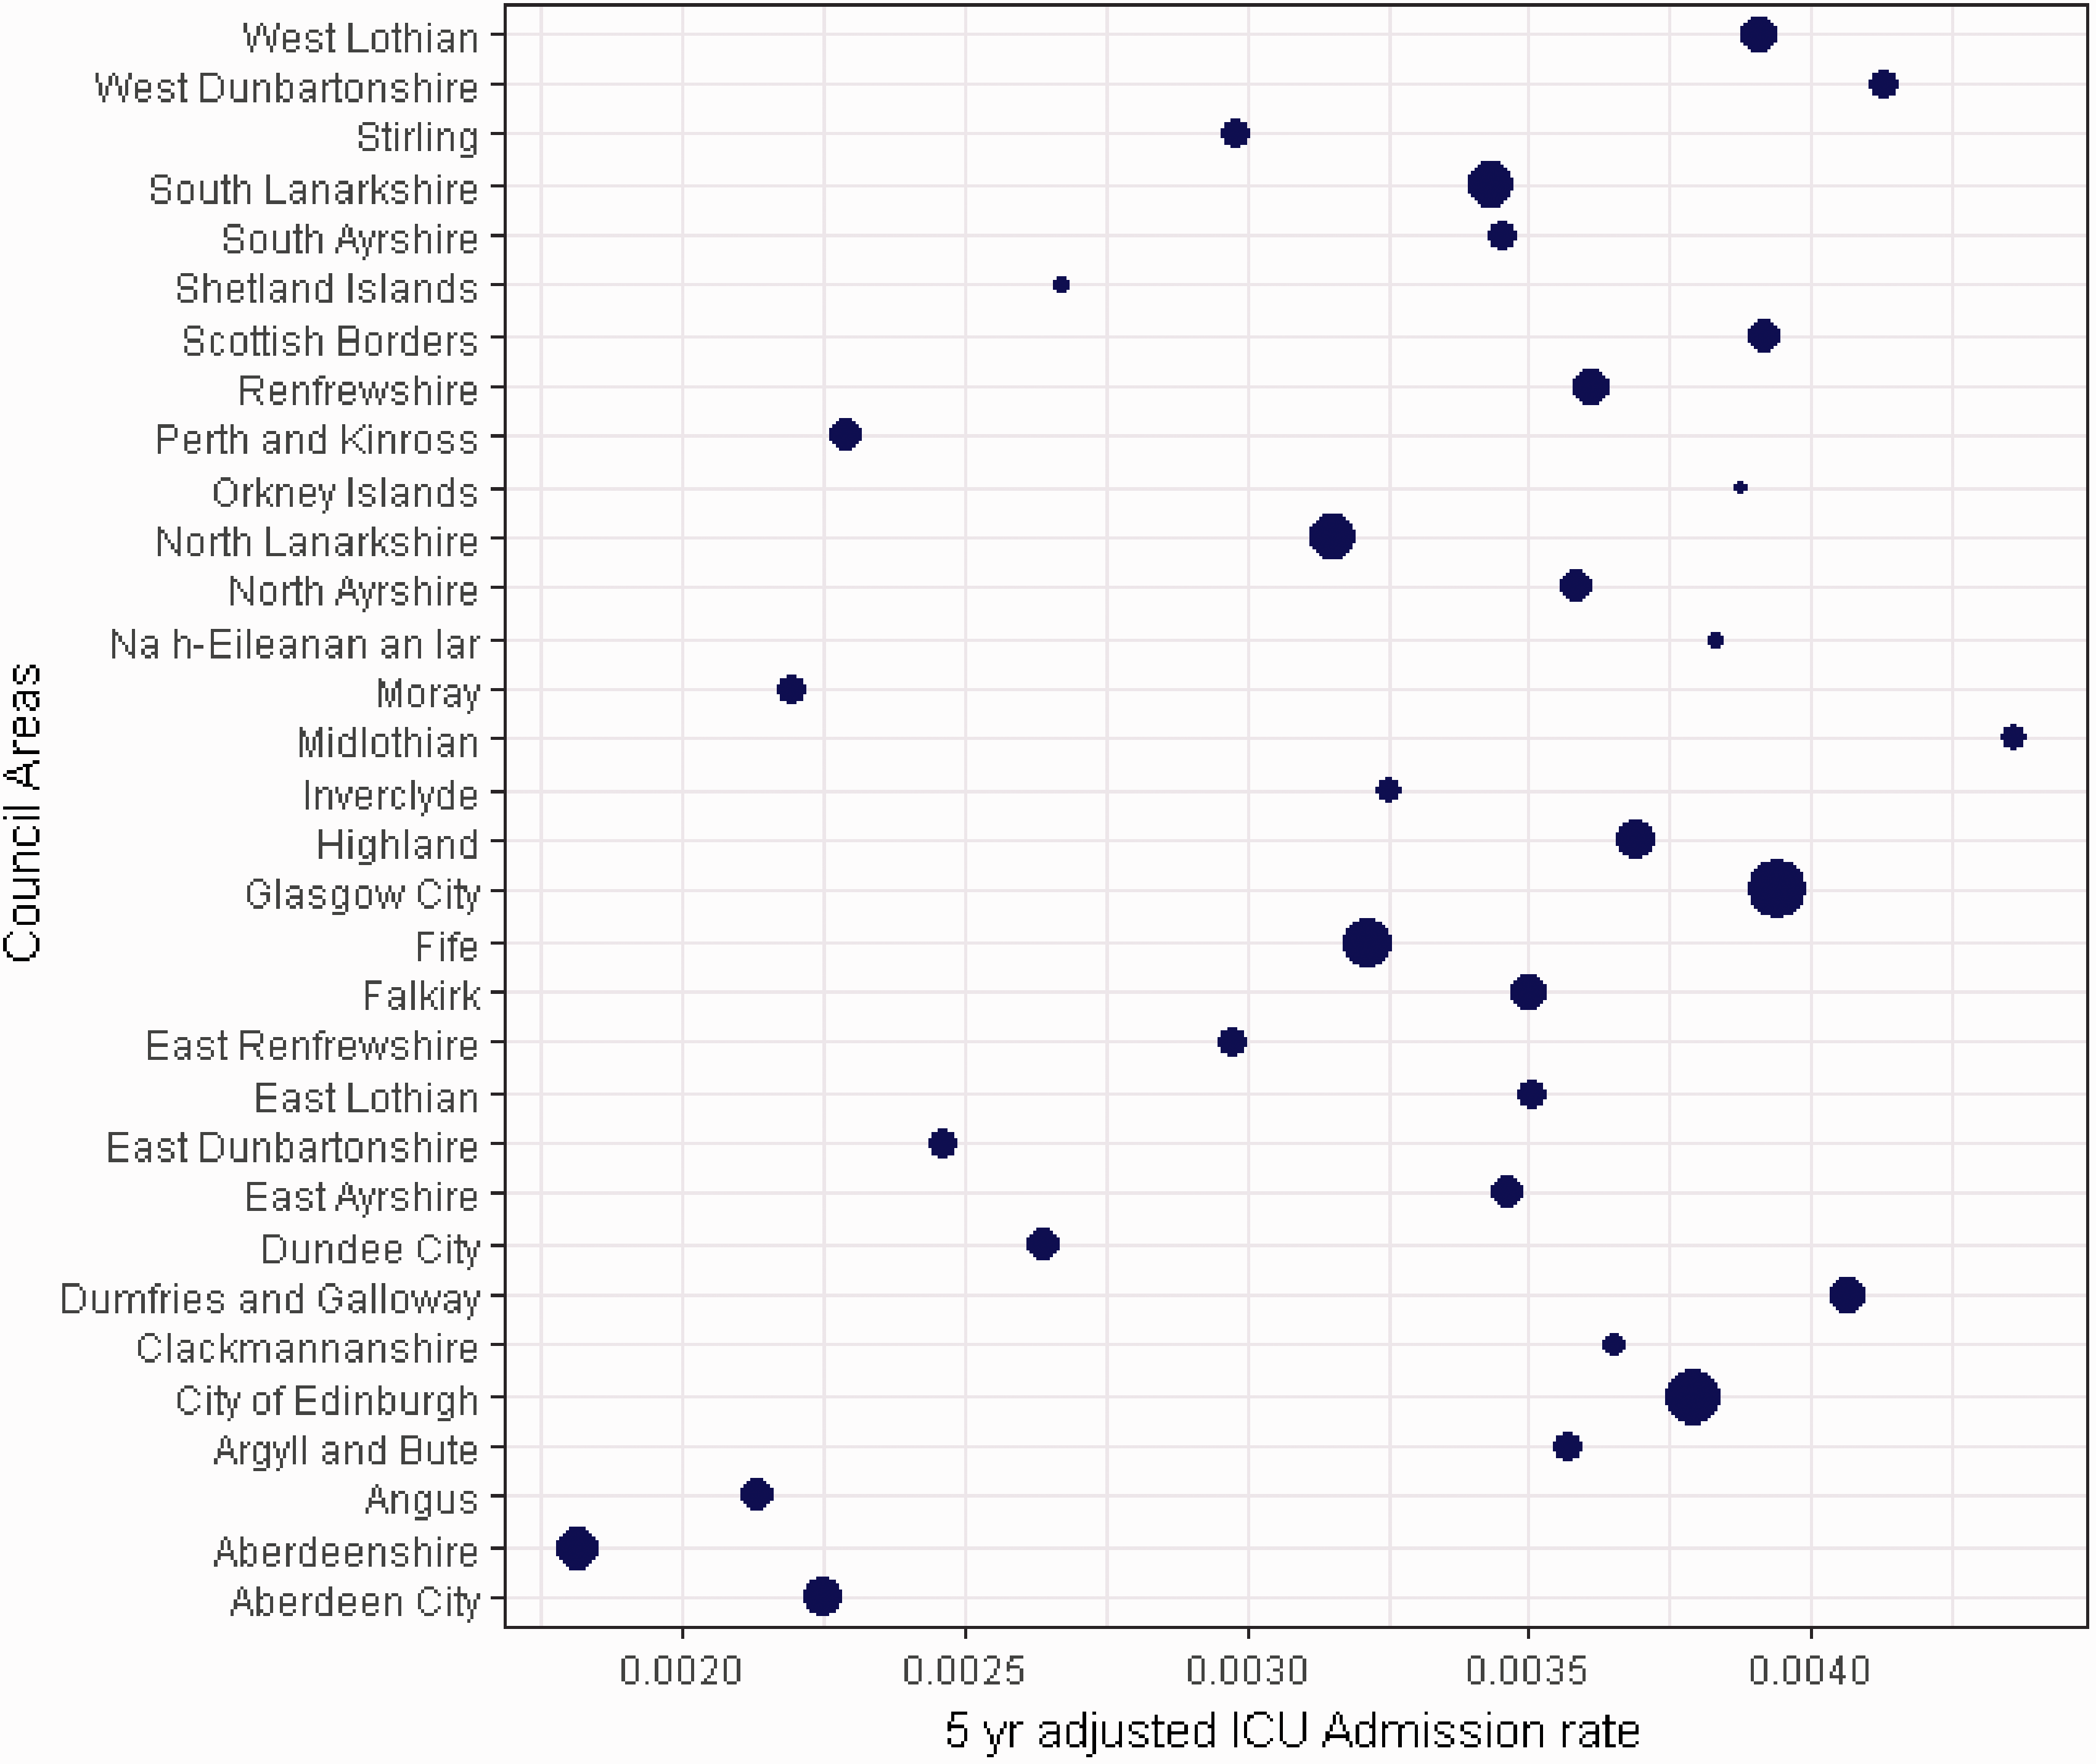
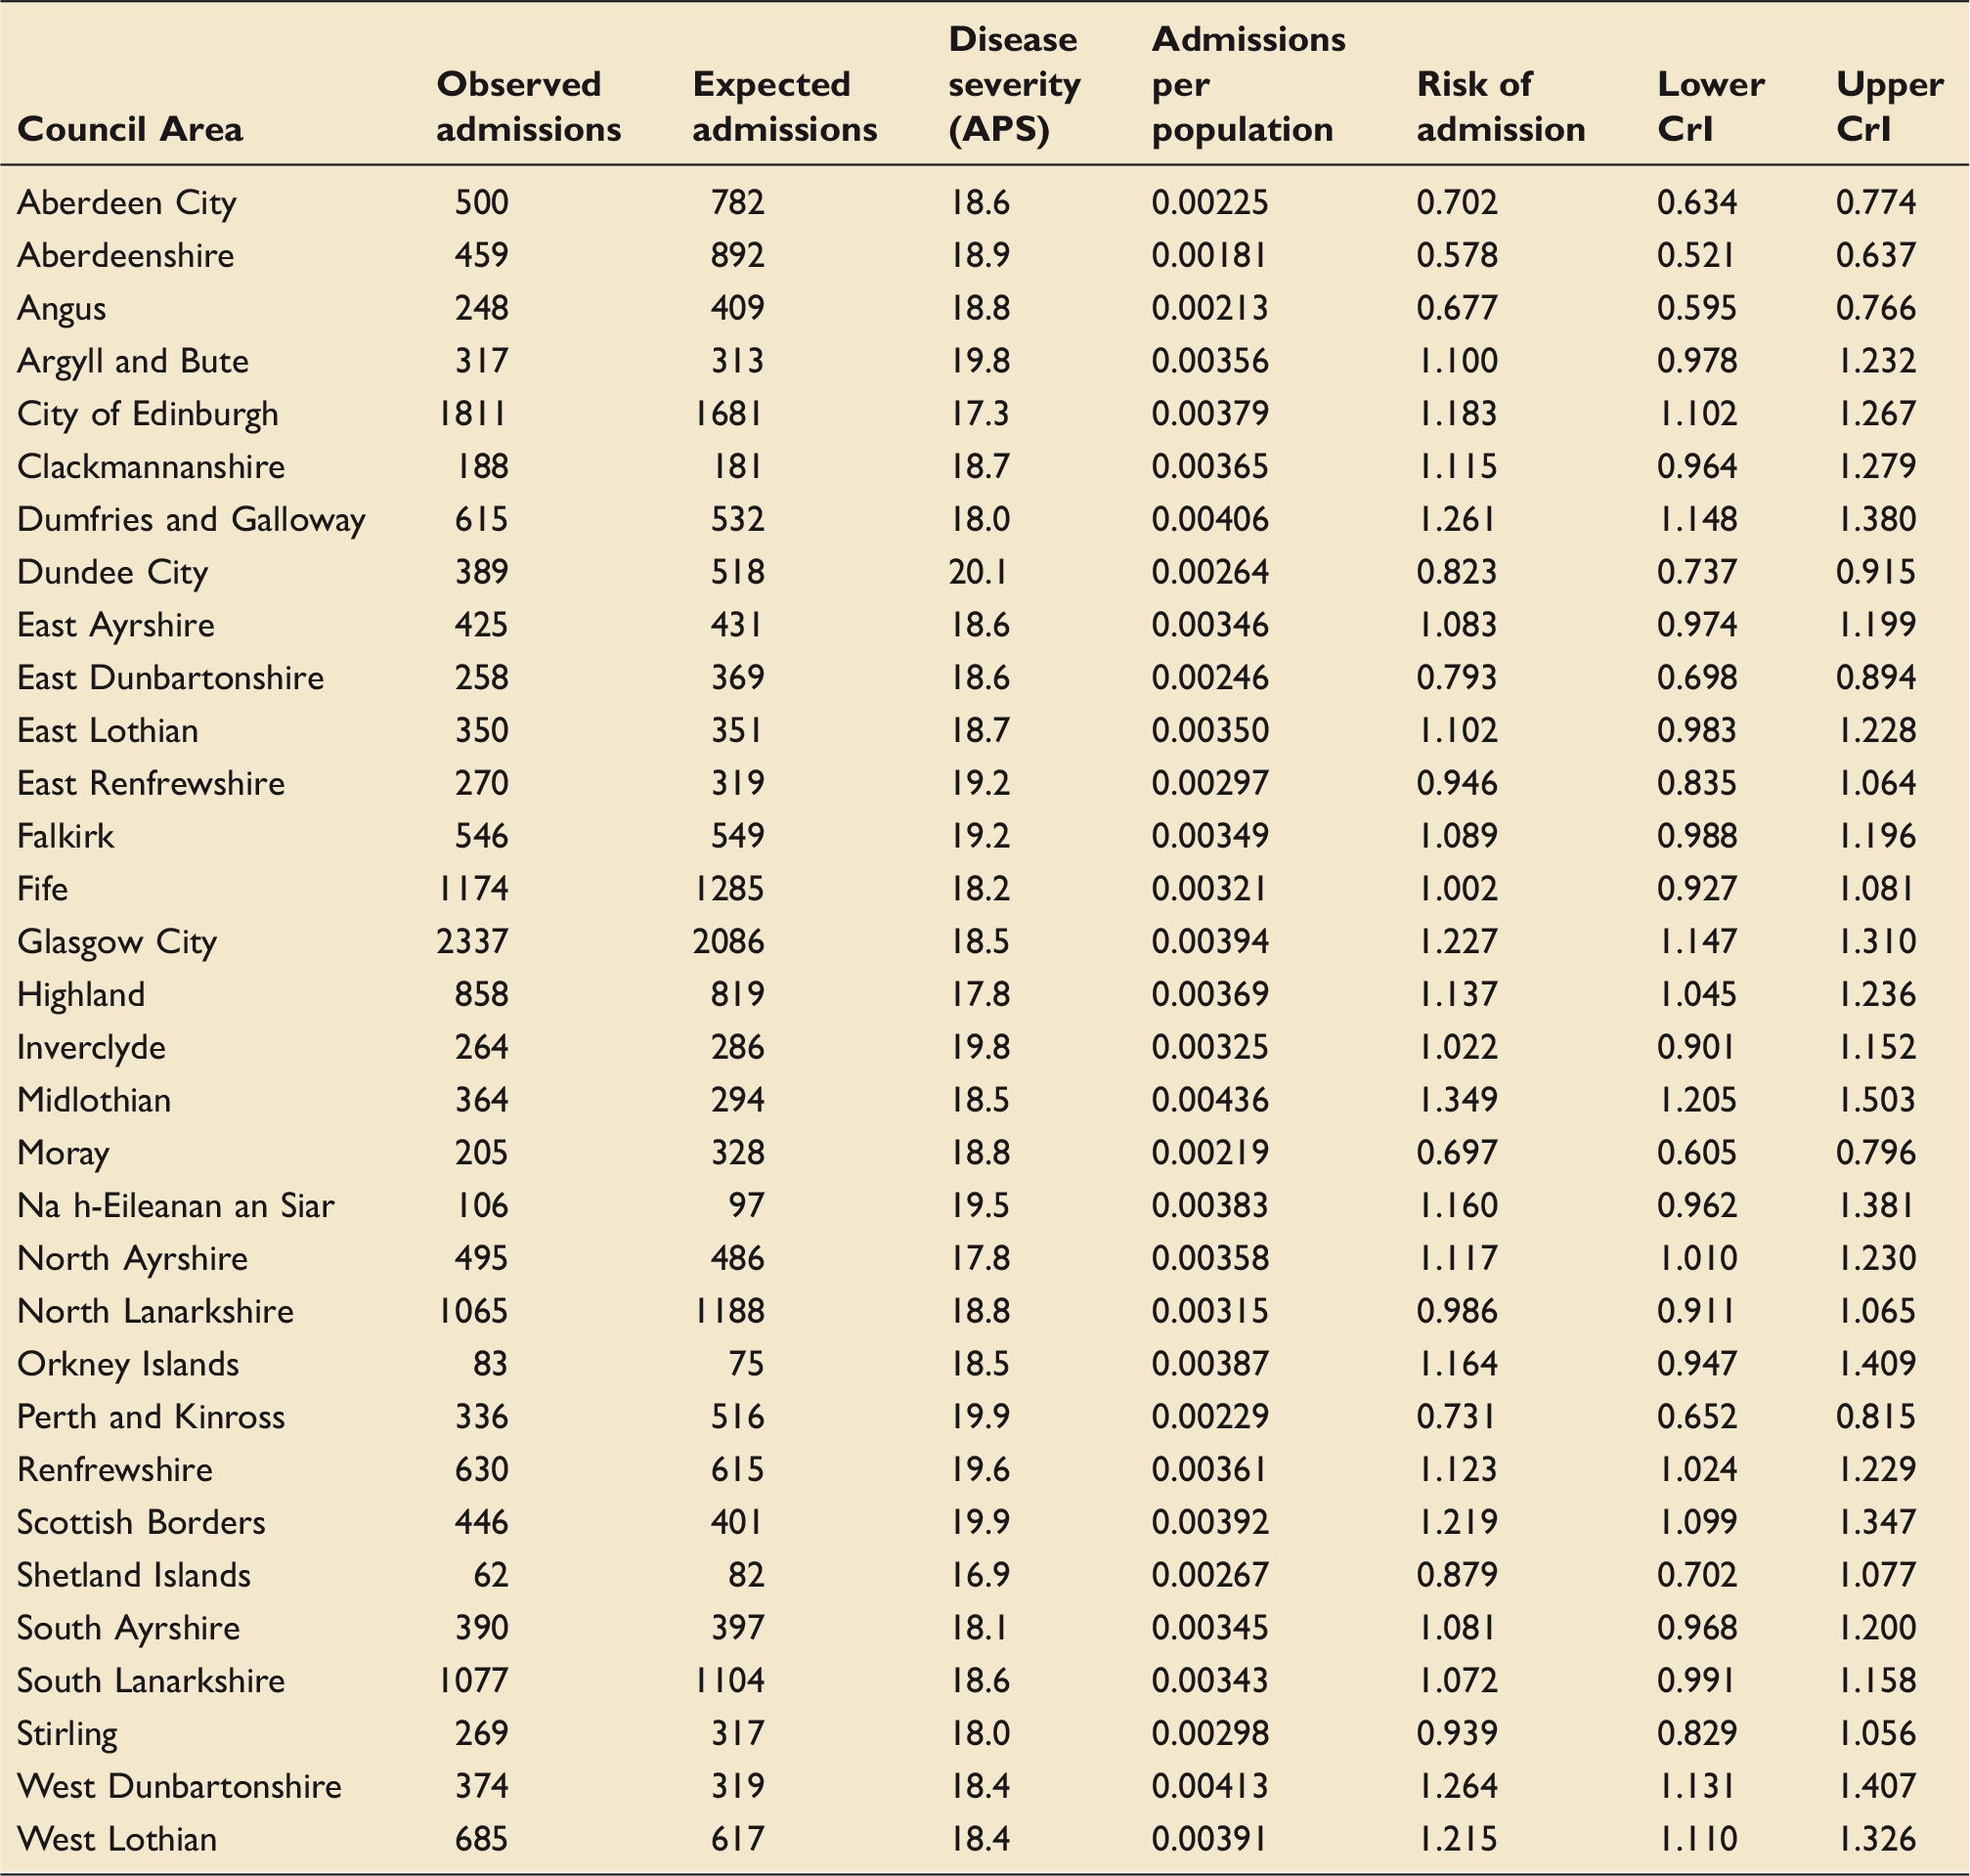
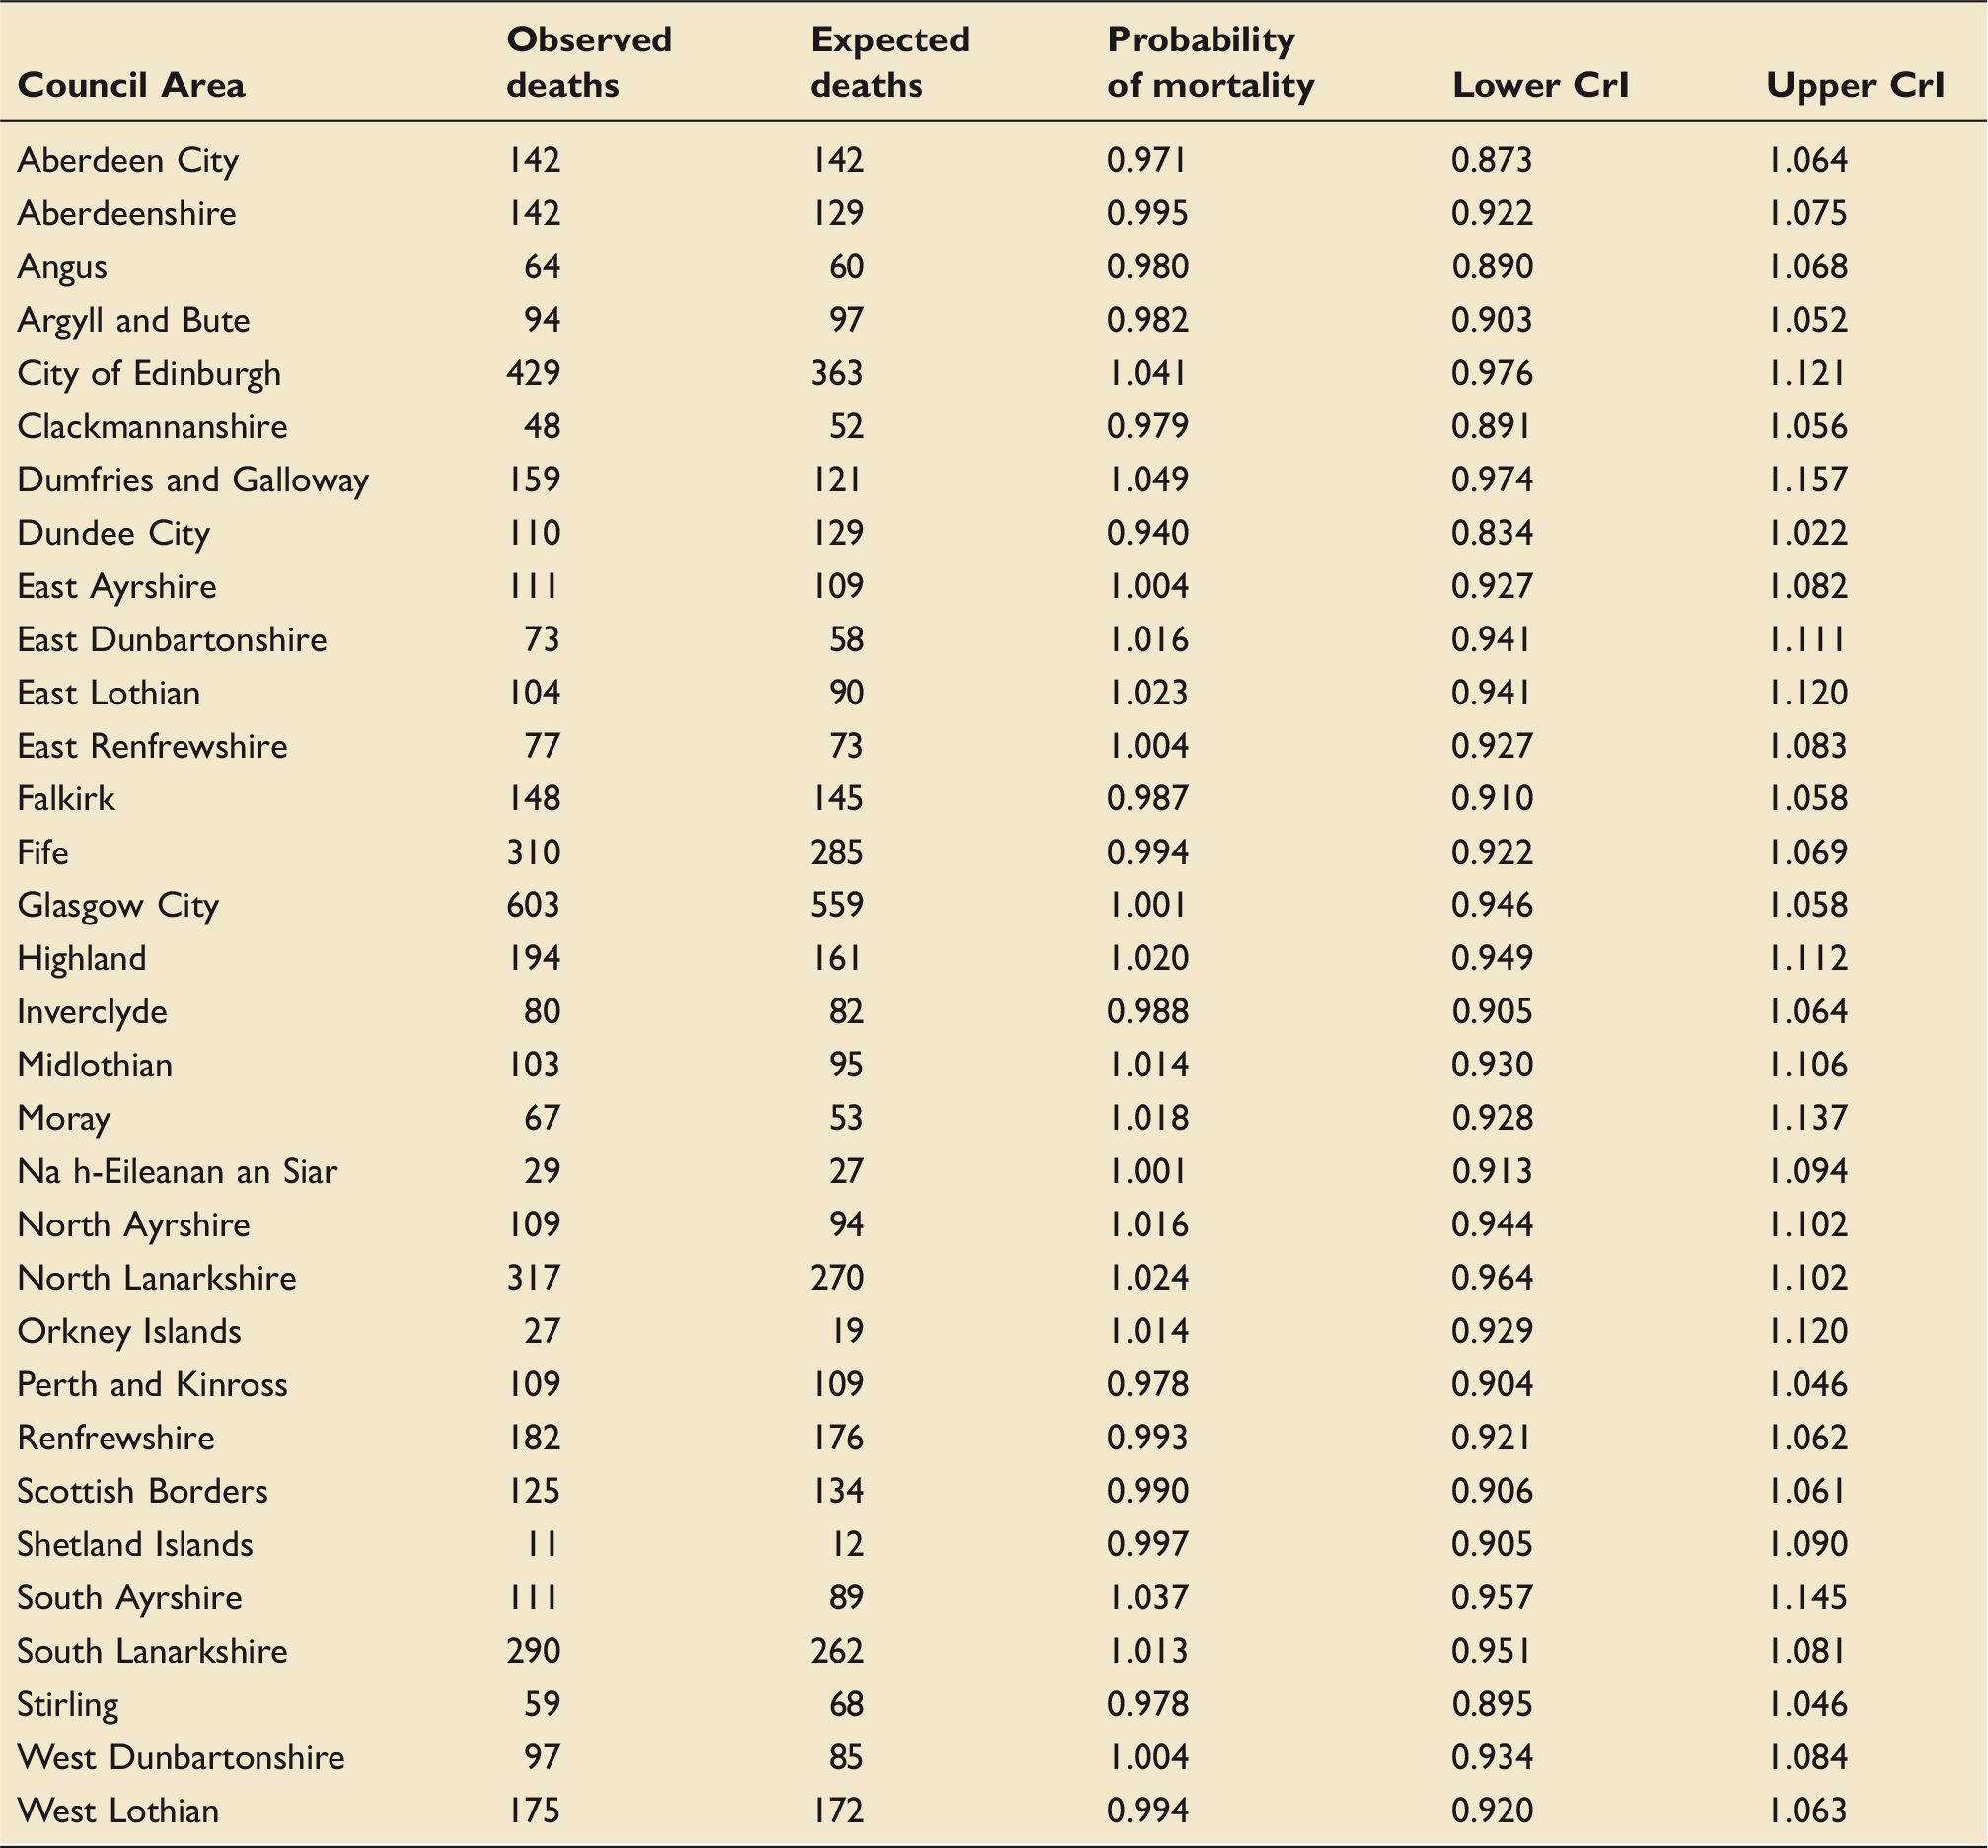
The crude Scottish five-year admission rate (number of ICU admissions per population) was 332 per 100,000 residents, and the five-year age- and sex-standardised admission rate was 352 per 100,000 residents. Table 3 shows the number of admissions, by Council Area, as well as the mean APS of each Council Area, which ranged from 16.9 (Shetland) to 20.1 (Dundee City). Interquartile range of the APS by area was 18.4–19.2. Table 3 also shows area-specific standardised admission rates, observed counts, expected counts and the relative risk of ICU admission, with 95% CrI. The ordered spread of admission risk, with 95% CrI are seen in Figure 1(a). The geographical relationships are demonstrated in Figure 2(a), which shows a model-derived risk map of admission to an ICU after spatial dependence has been accounted for. The Five Council Areas with the lowest admission risk (lightest green) are all located in the North East of Scotland. The five-year age- and sex-adjusted admission rates for each of the 32 Council Areas is shown graphically in Figure 3, with the size of the dot proportional to the population of each Council Area.
Council Area spatially adjusted risk of ICU admission (a) and in-hospital mortality (b) ordered by effect size. If 95% credible interval error bars do not cross one, the effect is statistically important. Model derived map of spatially adjusted risk of ICU admission (a) and in-hospital mortality (b). Crude 5yr age–sex-adjusted ICU admission rates by Council Area. Size of dot on dot plot is proportional to population size of Council Area. Area specific observed and expected ICU admissions with disease severity, admissions per population and risk of admission with 95% credible intervals.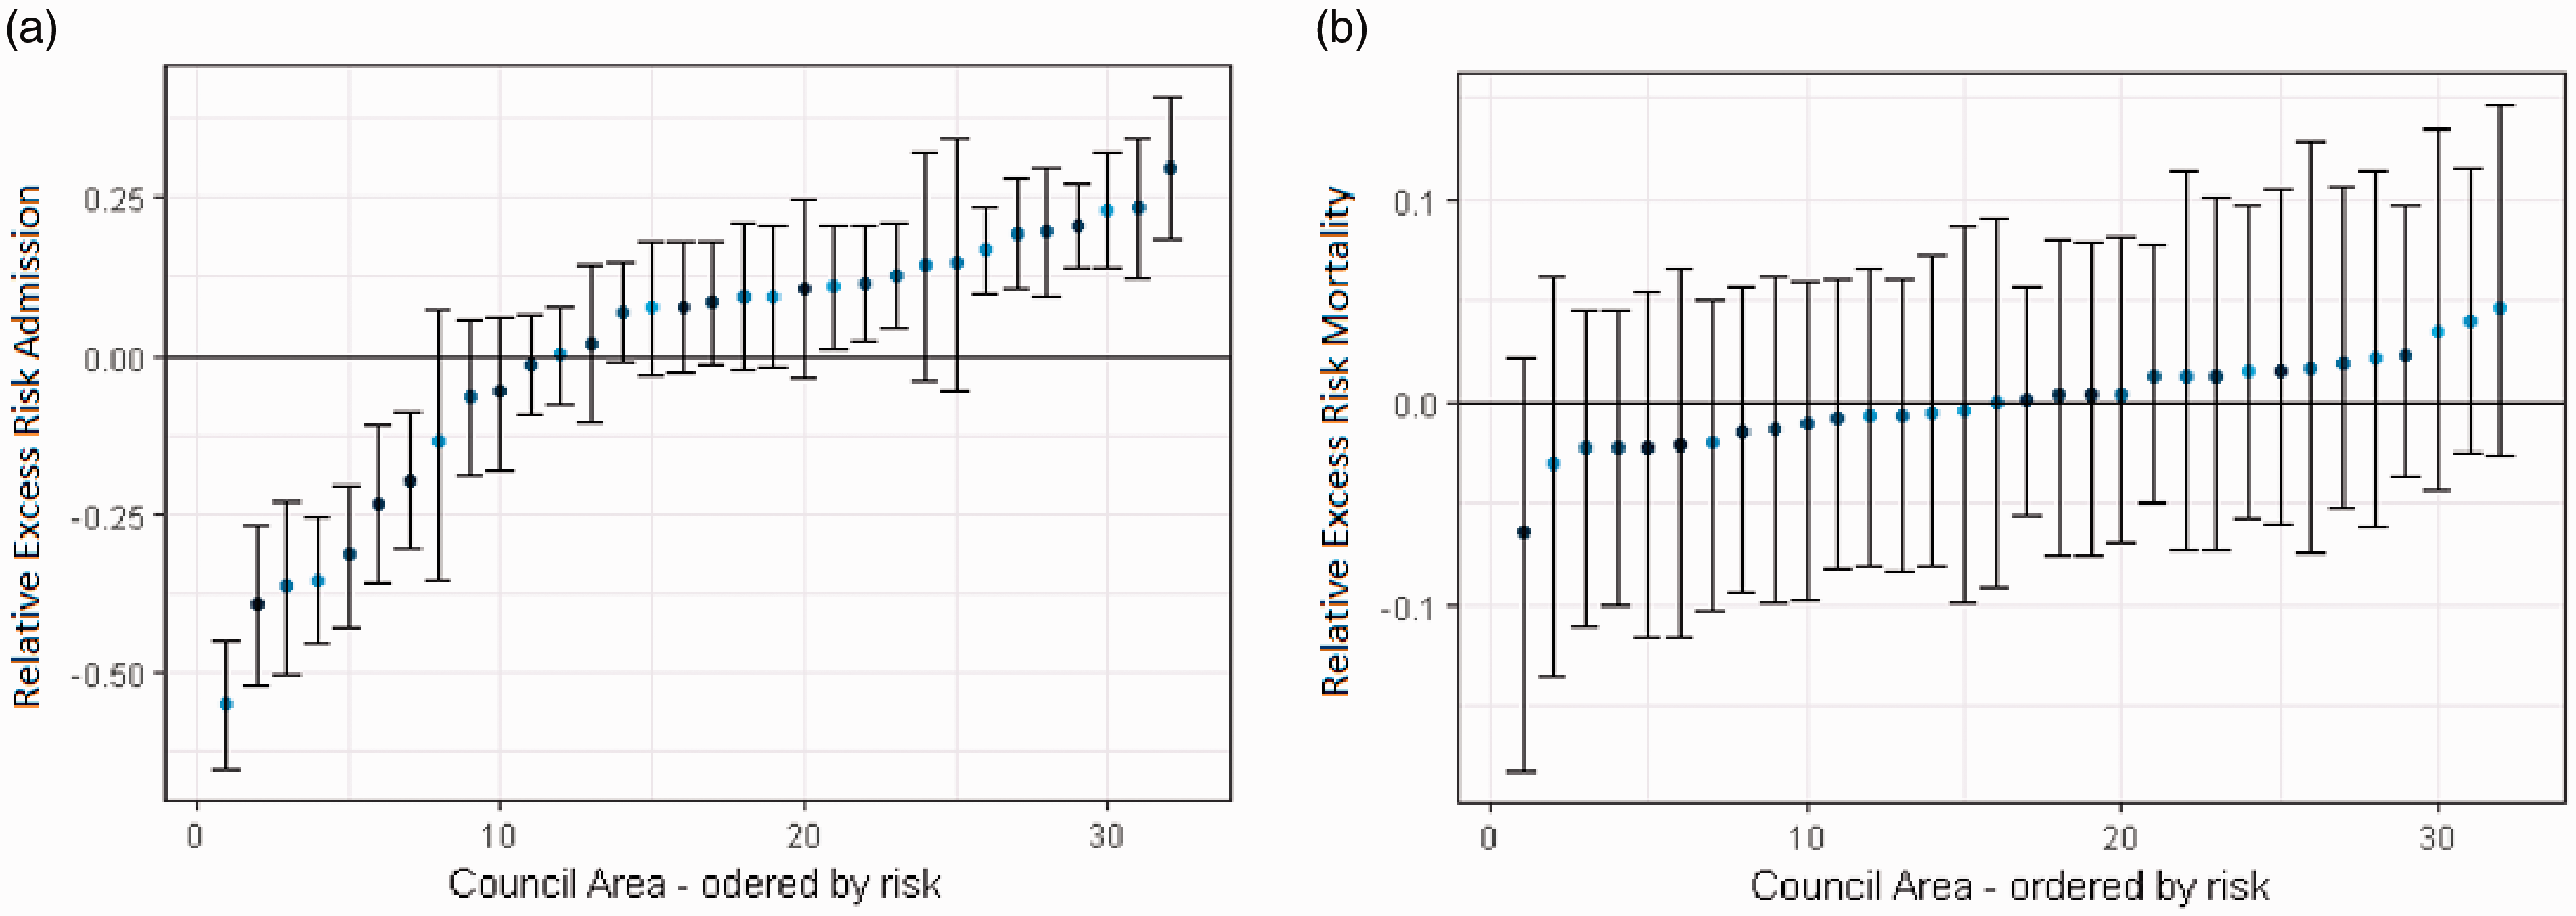
The likelihood of Council Areas having a higher risk of admission to an ICU than the Scottish mean is shown graphically in Figure 4(a). The darkest green areas have the highest likelihood of exceeding the Scottish average admission rate of between 99% and 100%, with the lightest green areas have a probability of 0% to 80%.
Model derived map showing the probability of the effect size of the Council Area exceeding that of the Scottish mean for ICU admission (a) and in-hospital mortality (b).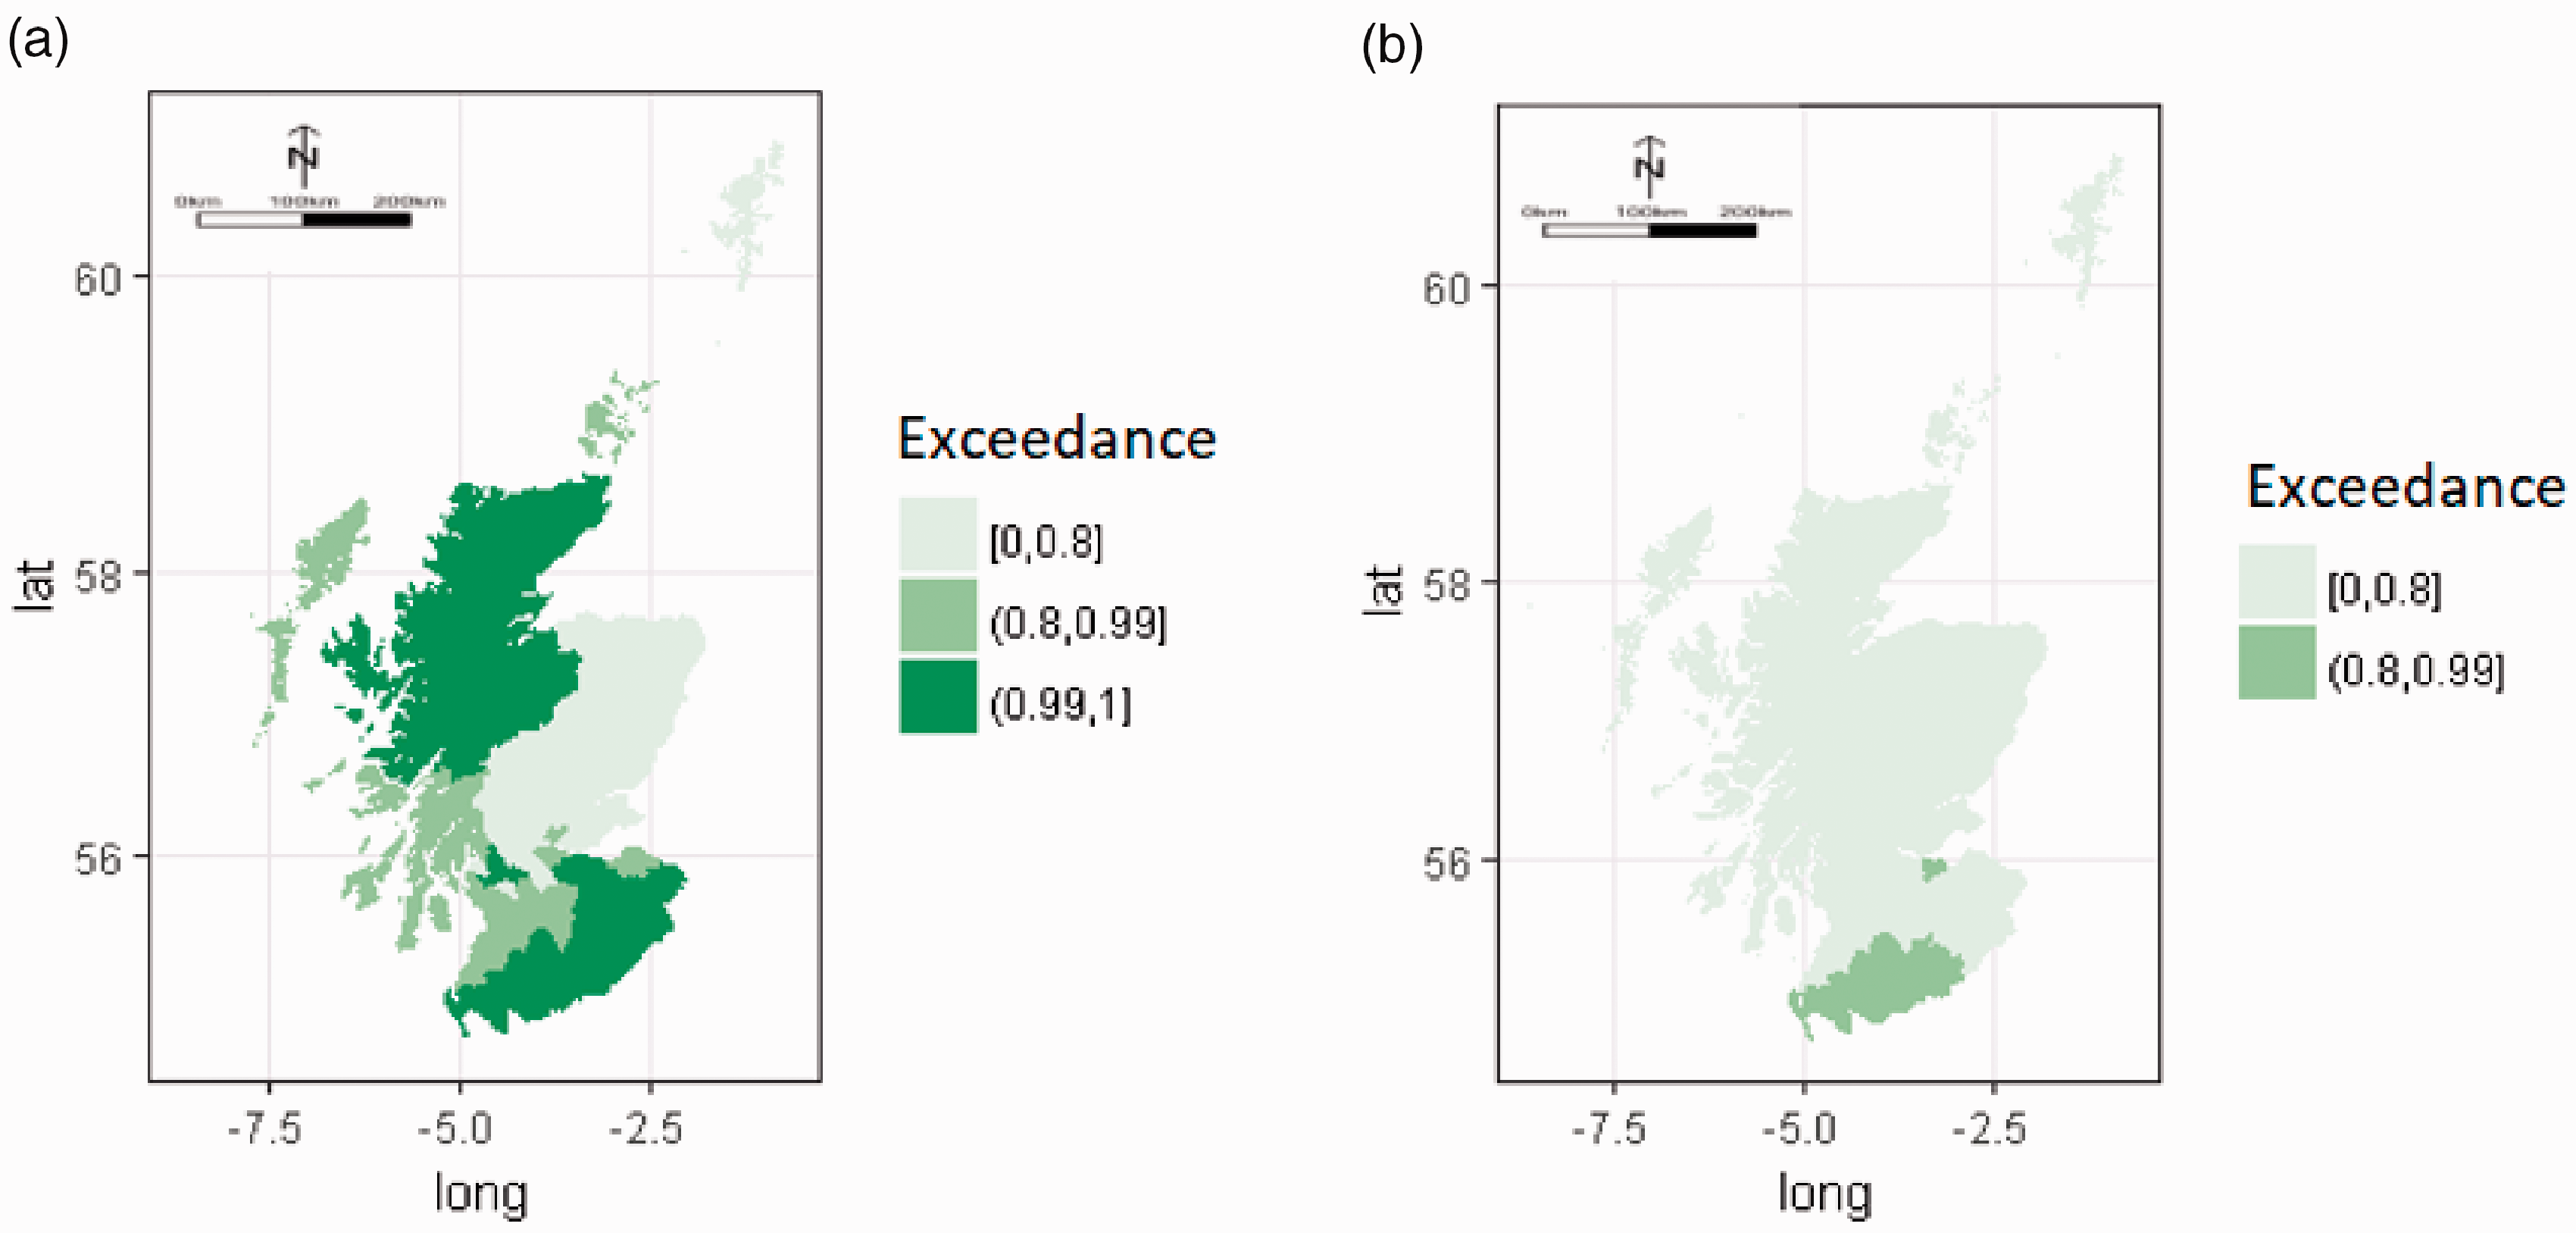
Effect of geography on mortality
Areas specific observed and expected ICU deaths with risk of mortality and associated 95% credible intervals.
Discussion
The recently published “National Clinical Strategy for Scotland” 4 has emphasised the importance of equity of access to healthcare services. We hypothesised that location of residence would not affect the probability of admission to an ICU or outcomes following such an admission.
Our study has identified a potential disparity in access to critical care services in Scotland, with the risk of admission to an ICU in Scotland varying according to location of residence. However, for those patients who are admitted to an ICU, the severity-adjusted probability of survival to discharge from hospital is similar, regardless of location of residence.
Whilst these differences appear to be clinically important, the interpretation of such data must be approached with caution. Disease mapping studies are designed to identify areas of potential disparity at the population level – not to identify causes of such disparities. 28 The spatially adjusted risk of admission to an ICU varies along a continuum by Council Area, although there is a cluster of Council Areas in the North East of Scotland that have lower admission rates than the Scottish mean, as derived from our model.
Patients from Aberdeenshire have around half the chance of admission to an ICU, as compared with the Scottish population as a whole. At the other end of the spectrum, patients from Midlothian have a one-third greater risk of admission to an ICU, compared to the rest of Scotland. Reassuringly, we have shown that the APS of patients admitted to ICUs in Scotland is similar and has no clinically important spatial variation – supporting evidence that Scottish ICUs have similar access thresholds for patients. 10
We recognise that we have undertaken a hypothesis generating study, and therefore explaining such effects seen in our data is not possible without additional, focused investigation. Future analyses of value may include a direct comparison of the spatial areas at either end of our admission rate spectrum with a focus on reason for ICU admission and demographics. Additionally, identifying the geographical pattern of true critical illness in Scotland, regardless of whether a patient is admitted to an ICU or not would provide valuable information. With this data it may be possible to investigate whether there is a cohort of patients that might benefit from ICU who are not accessing this service.
We believe our results are important for two key reasons. At the national level, we have added to the evidence base that geographic difference in ICU utilisation exist as shown by Cooke in the USA 29 and Vestergaard in Denmark. 30 Additionally at the national level, we have identified areas in which the risk of ICU admission is lower than the national average. Our data provide a stimulus to undertake additional investigation into quantifying the reasons behind these results, potentially at a local level.
The effects we have observed could be artefactual, representing demographic characteristics that were not accounted for by the age- and sex-adjustment, or differing admission practices (such as tertiary referrals). However, previous studies have also shown variation in admissions, for example Docherty et al. had previously shown age-related and possible regional variation in admission rates and intensity of treatment among the elderly population in Scotland.6,11
A limitation of our study is the use of Council Areas as the areal unit. These areas vary in size, but can be very large, and thus could hide detail – an issue sometimes referred to as the modifiable areal unit problem. 31 We would have preferred to use a smaller areal unit, which would have provided greater geographical granularity. However, the next available geography with georeferenced demographic data is the “intermediate datazone”, of which there are more than a thousand, resulting in unstable event rates and zero inflation issues.
The strength of this study is the use of Bayesian disease mapping methodology, which allows direct probabilistic statements to be made regarding the effect size of one areal unit compared to another. Bayesian disease mapping is an important means of identifying areas of disparity regarding disease and healthcare utilisation.
All health systems face challenges regarding equity of access, across the healthcare spectrum, and particularly so in remote and rural areas. 32 Establishing and identifying the cause of such disparities in access to healthcare services is not easy – particularly within time sensitive environments such as critical care. The reasons for potential disparities are likely to be wide ranging and multi-factorial. We argue that Intensive Care services, despite being expensive and resource intense should receive the same degree of prioritisation and attention regarding equity of access. Our study and the methodology employed can provide direction to further research in this area with the goal of ensuring each critically ill patient in Scotland gets the same high quality, timely management of their critical illness.
Conclusion
Access to critical care services in Scotland varies with location of residence. In contrast, the probability of surviving an ICU admission, if admitted, does not show geographical variation. This present study cannot explain the data patterns described, and further investigations are warranted.
Supplemental Material
INC914462 Supplementary material - Supplemental material for Equity of access to critical care services in Scotland: A Bayesian spatial analysis
Supplemental material, INC914462 Supplementary material for Equity of access to critical care services in Scotland: A Bayesian spatial analysis by Philip Emerson, David R Green, Steve Stott, Graeme Maclennan, Marion K Campbell and Jan O Jansen in Journal of the Intensive Care Society
Footnotes
Acknowledgements
We would like to thank the Scottish Intensive Care Society Audit Group for giving us access to the data.
Author's Note
Philip Emerson is currently affiliated with Department of General Medicine, Royal Adelaide Hospital, Adelaide, Australia.
Declaration of conflicting interests
The author(s) declared no potential conflicts of interest with respect to the research, authorship, and/or publication of this article.
Ethics approval
Ethics approval for this project was obtained from the appropriate committee.
Funding
The author(s) disclosed receipt of the following financial support for the research, authorship, and/or publication of this article: This project was supported by a grant from NHS Grampian Endowments.
ORCID iD
Philip Emerson https://orcid.org/0000-0002-1253-8700 Jan O Jansen ![]()
Supplemental Material
Supplemental material is available for this article online.
References
Supplementary Material
Please find the following supplemental material available below.
For Open Access articles published under a Creative Commons License, all supplemental material carries the same license as the article it is associated with.
For non-Open Access articles published, all supplemental material carries a non-exclusive license, and permission requests for re-use of supplemental material or any part of supplemental material shall be sent directly to the copyright owner as specified in the copyright notice associated with the article.