
Abstract
Aims
We aimed to measure the safety culture across a network of critical care units to compare units, track temporal changes and to present easy to interpret information back to staff.
Methods
We provided adapted paper versions of the short ICU ‘Safety attitude questionnaire’ to 14 critical care units annually between 2015 and 2017. The responses were analysed to establish scores for individual safety domains. Feedback used colour conditional formatted tables to allow easy identification of high and low scores.
Results
There was an inverse relation between median unit score and standardised mortality (rs = 0.4). Rates of staff fatigue increased between 2016 and 2017 (two-point change on a 1–5 scale).
Conclusions
A critical care network can usefully collect and feedback safety attitude questionnaires which show a relationship with patient outcome. Units should monitor overtime working.
Introduction
Safe and efficient care requires more than trained staff, provided with the appropriate resources. To deliver the highest standards of care staff must work in well-led organisations that prioritise patient safety, value and train their staff, and encourage team working. This ‘organisational culture’, also described as ‘Safety Culture’, is essential to delivering the highest standards of patient care. 1 One way that safety culture of a critical care unit can be assessed is by asking the staff for their opinions about the unit they work in using a ‘safety survey’.
In other high-risk industries, a demonstrable link between employee perceptions of safety culture and adverse incidents led to adoption of staff surveys to examine organisational risk,2,3 intensive care was then one of the first medical specialties to use these surveys. 4 More recently, safety surveys have been reviewed and recommended by the Health Foundation 5 and the Faculty of Intensive Care Medicine recommend their annual use in ‘Standards for Critical Care Units’. 6
Within the Greater Manchester Critical Care Network, we decided to organise the conduct of annual staff safety surveys across the 14 units in the network to provide critical care units with information about how staff viewed the safety culture of their units. The information was also intended to help inform the annual network review of critical care units. We hoped that showing units that they had good safety cultures would be motivating for staff working in the units and that the reasons for any lower scores could be explored in the network review process. To meet these aims we wanted to provide information back to units that was easy to understand and that was not too difficult to collect. We describe how we conducted these surveys, some results and recommendations for other networks.
Methods
The process was discussed and agreed by the unit medical and nursing leads in the clinical effectiveness committee of the network. The questionnaire was based on the short version of the ICU ‘Safety Attitudes Questionnaire’.
7
We modified some of the questions to reflect UK practice, for example in the descriptions of job roles. The anonymous questionnaire had 37 questions covering a range of domains of patient safety as summarised in Figure 1. Each question had a five-point Likert Scale for responses from ‘strongly agree’ to ‘neutral’ to ‘strongly disagree’ with a further option for ‘not applicable’. There were then questions to identify the responder’s role and time in the specialty, the questionnaires were also coded separately for each unit. The questionnaires were produced using ‘FormReturn’ (EB Strada Pty Ltd, Brisbane, Australia), printed and then distributed to the management teams of the individual units for distribution and collection over approximately four weeks in February and March for three years between 2015 and 2017. February and March were chosen to link with the annual network reviews in April and May. The completed forms were collected, scanned and imported into ‘FormReturn’ to allow for responses to be optically read and data exported into a Microsoft Excel spreadsheet. The five-point responses were then converted to numbers from −2 to +2, with the negatively worded items being reverse scored. The mean values for questions for each of the different safety domains were then calculated, hence each questionnaire provided a mean value for each of these domains. We then calculated the mean score for each of the domains for all of the responses for each of the units for that year. These values were then plotted on separate tables for individual units showing the mean scores for each unit for each domain, with other units identified by letter code and the specific unit identified by name. We used the colour code function in Excel
8
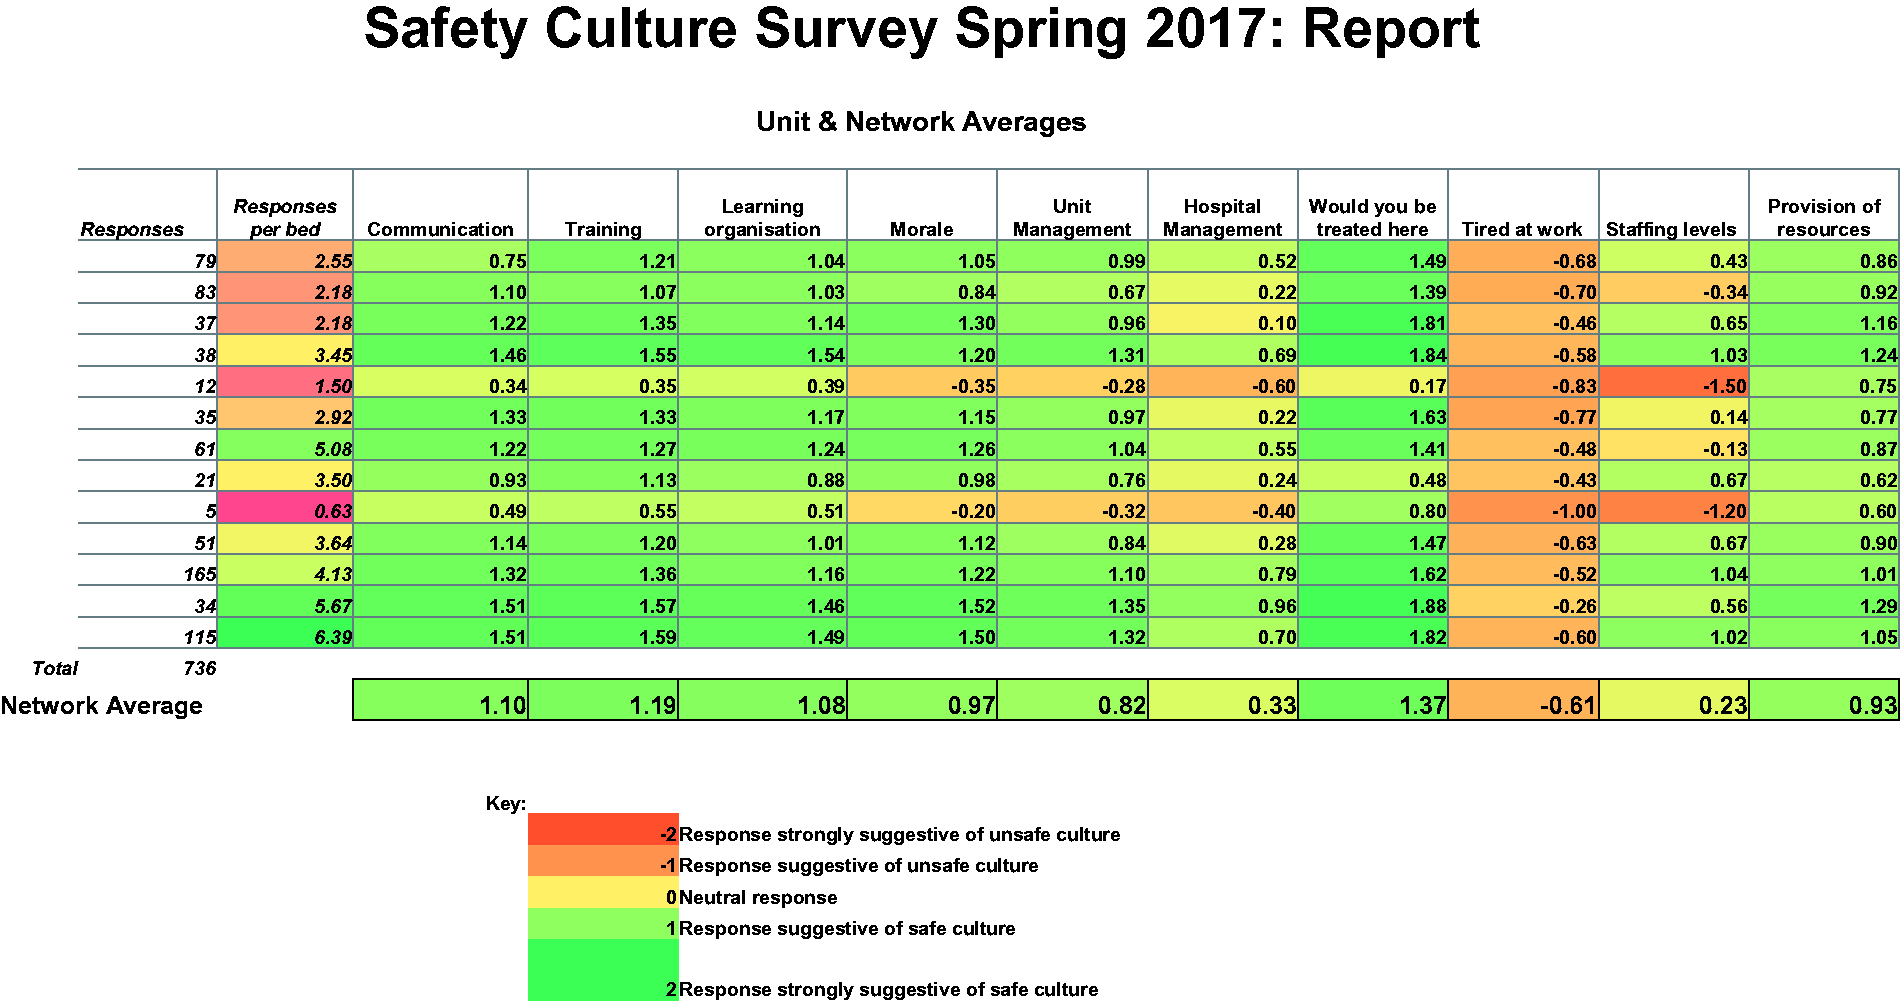
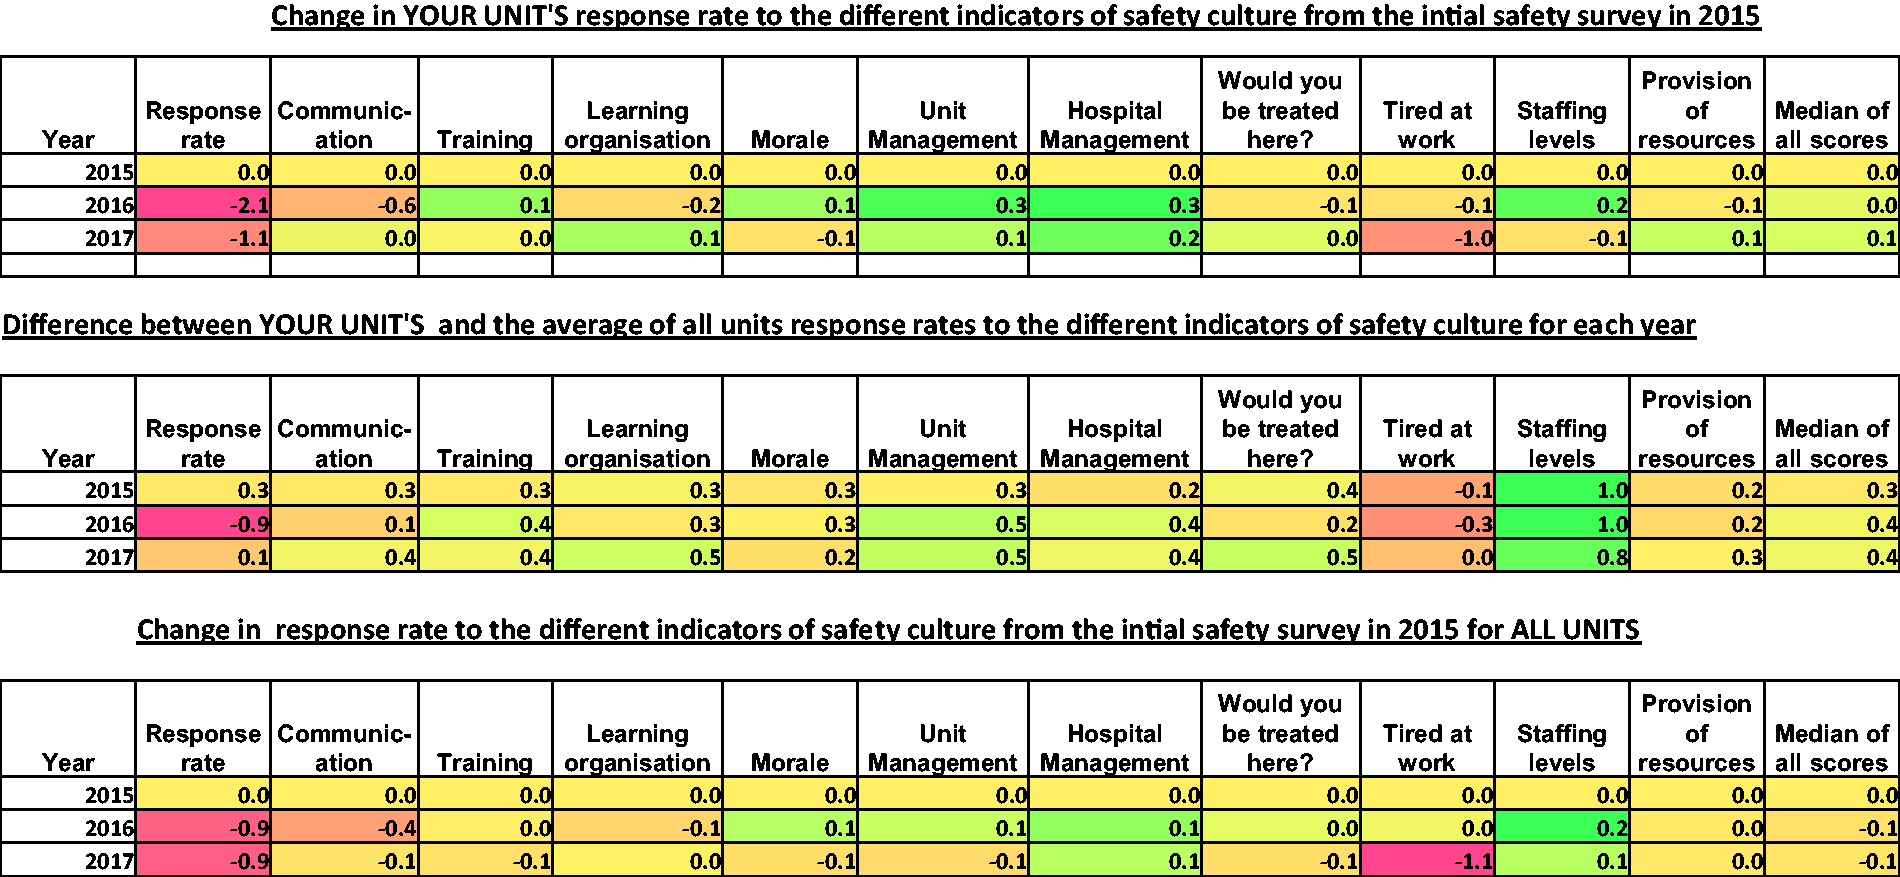
to colour each cell with greens for high scores and oranges and then reds for lower scores, an example is shown in Figure 2. In 2017, we also provided a similarly colour coded chart showing changes in their mean scores from the 2015 baseline for the unit for each of the two subsequent years. We provided this together with similar charts showing the difference between the individual unit scores and the network average scores for each of the three years. These charts, which are shown in Figure 3, gave units the opportunity to review changes over time as well as allowing them to compare themselves with other units in the network.
Copy of the one-page questionnaire send to staff adapted from the short ICU Safety Attitudes Questionnaire.
5
Presentation of annual survey results provided to units in 2017. The table shows the safety domains measured in the survey. Each row is for a critical care unit; the units were identified by letter code except for the unit receiving the report that was identified by name. The colour coding in each cell was provided by the conditional formatting in Excel.
6
Similar reports were sent in 2015 and 2016. Presentation of summary survey results provided to units to show changes over time, the first table shows how response rates changed for that unit from the 2015 baseline in 2016 and 2017; hence all values for 2015 will be zero. The second table shows the difference between the unit’s scores and the mean score for all the units in the critical care network for each of the three years. The final table shows the mean changes for the whole network for 2016 to 2017 from the baseline in 2015.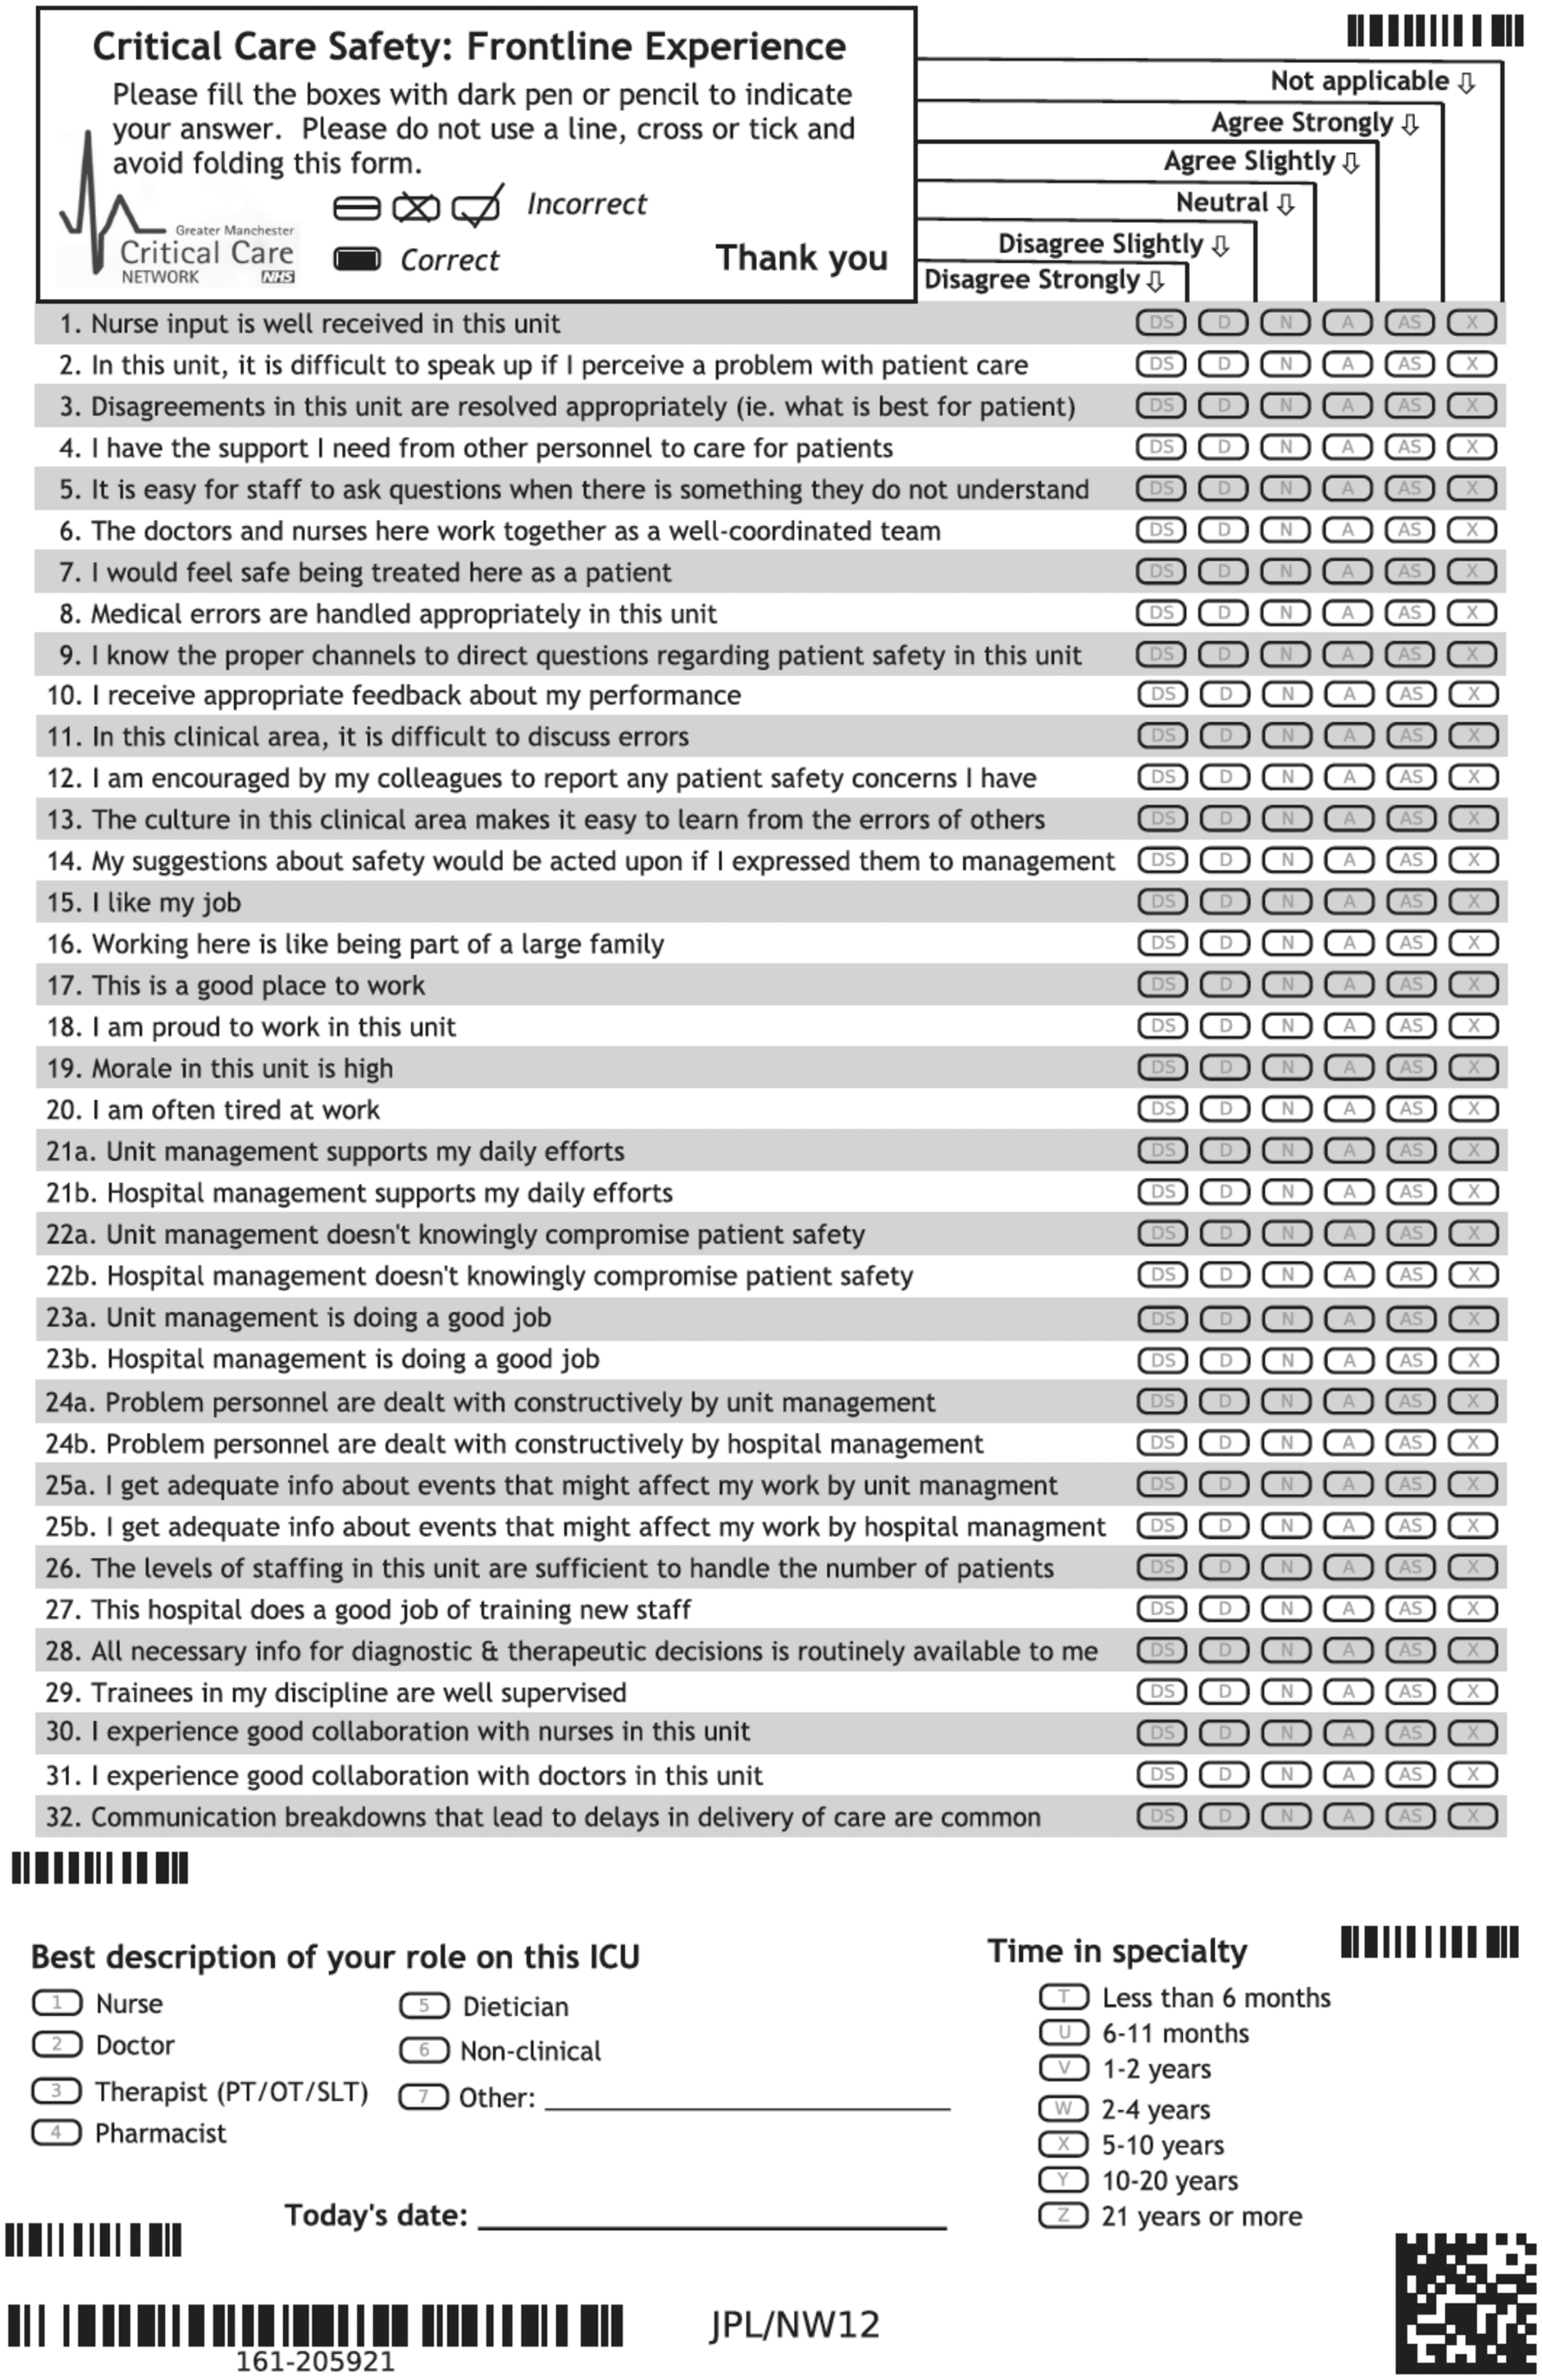
After the third year of data collection, we reviewed the results in more detail. All the responses were exported to a single file and the scale of responses was changed from −2 to +2 to a range of 1 to 5. For each returned questionnaire a score for each safety domain was calculated from the mean of the individual question responses for that domain. A median score for all of the domains for each questionnaire was then calculated. The median score for each unit for all domain scores was then calculated for each of the years. For ease of analysis, we grouped the years of experience of staff to either less than two years or two or more years and the job titles into nursing, medical and other. We calculated the response rates as the number of completed forms per critical care bed in the unit. We recorded the units’ standardised mortality rates (SMRs) from their Intensive Care National Audit and Research Centre reports.
We compared the responses of experienced and inexperienced staff using Mann–Whitney U tests and the responses of the three staff groups using Kruskal–Wallis tests. Spearman correlation coefficients were used to look for any relation between the units’ median scores and their SMRs and this was repeated to look for the relation between median scores and response rates. We did not explore how all the safety domains had changed over the three-year period as the colour coding looked similar for each year except for the domain ‘tired at work’. We therefore only explored if this domain had changed significantly over the three years and used the Kruskal–Wallis test to do this.
For each response, we calculated the median differences of all the scores from the median score of the questionnaire. For each questionnaire, we also calculated the median score for the safety domains for learning, communication, training and morale and again calculated the median differences in the individual questions for all of these domains from the median score for the domain. This was to provide information about the range of distribution of responses in individual questionnaires.
Results
Details of total number of returns per year and medians and interquartile ranges for individual units.
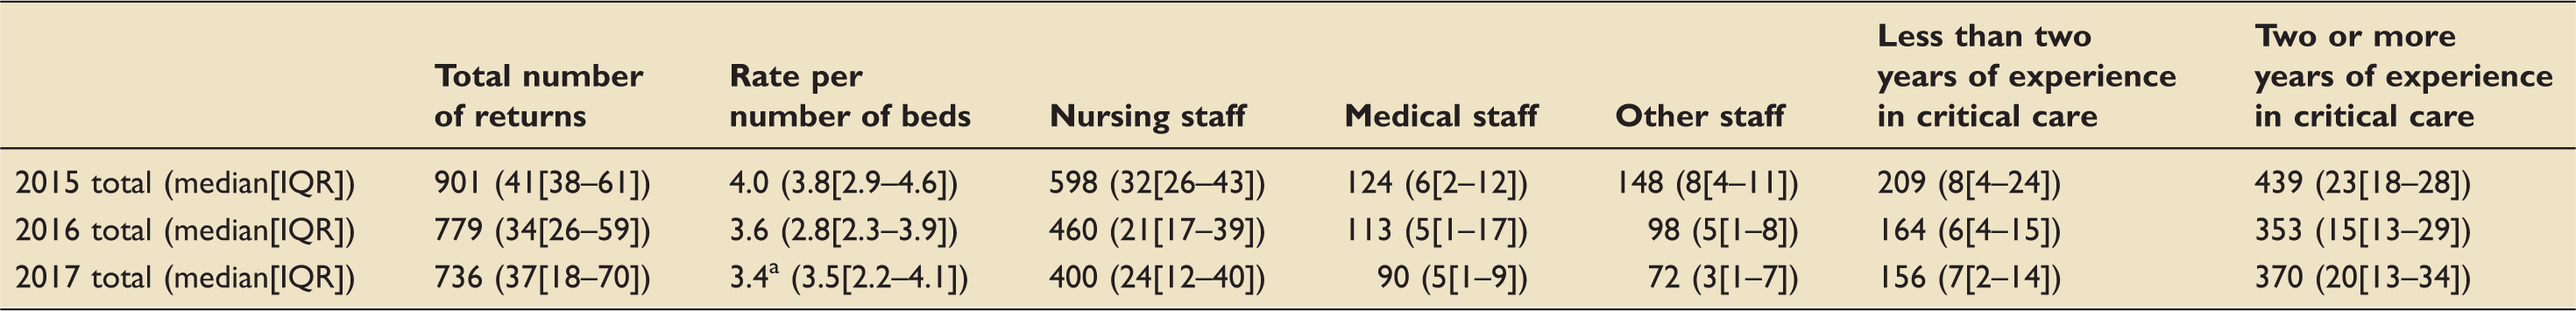
Note: 313 replies did not report their roles and 725 did not report their experience.
One nine-bedded unit did not take part in the 2017 survey.
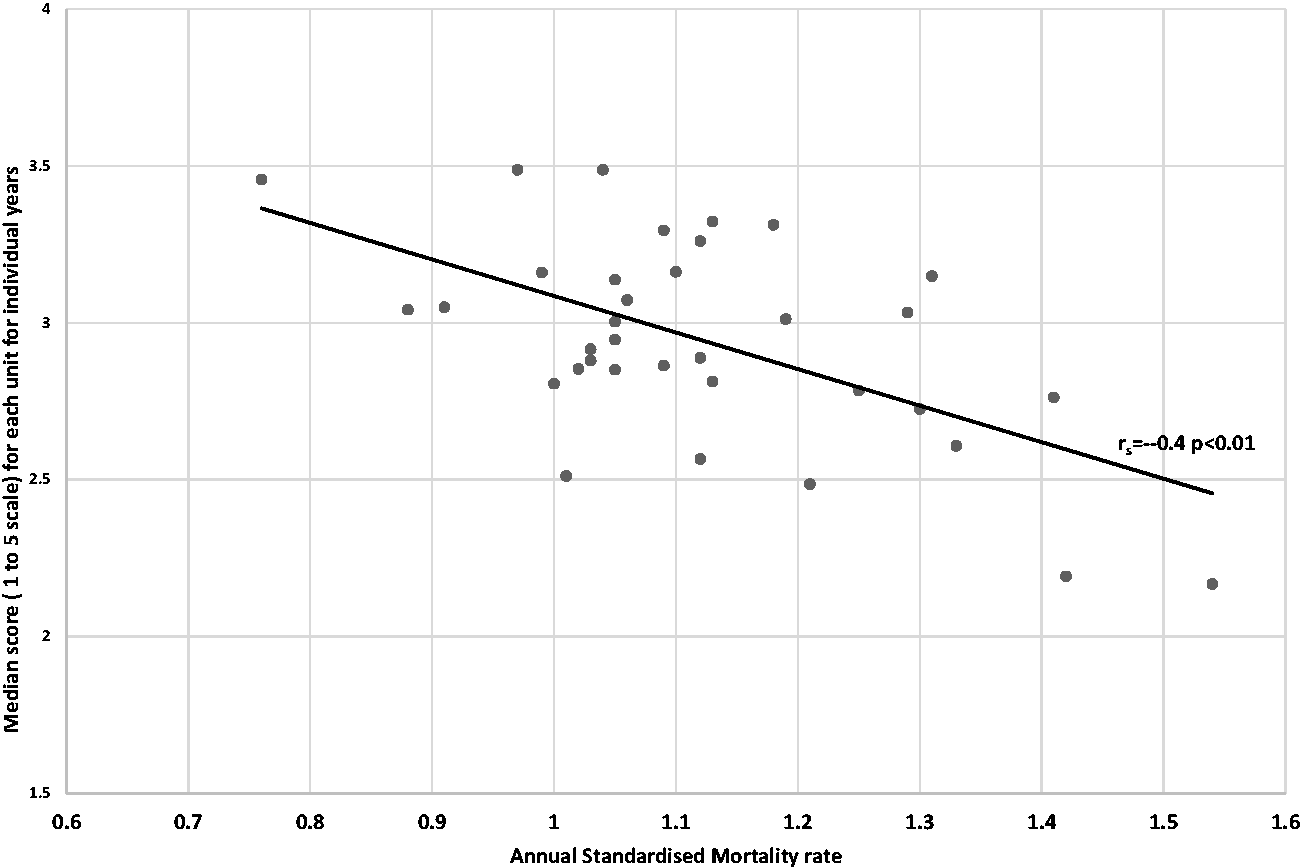
There was a significant inverse relationship between the units’ median unit survey scores and their SMRs (rs = −0.4, p < 0.01); this is shown in Figure 4. There was also a significant relationship between the response rates and the median scores for individual units (rs = 0.5, p < 0.01); this is shown in Figure 5.
Scatter plot showing the relationship between the number of completed forms per bed and the median score for each unit for the three years’ surveys (rs = 0.5, p < 0.001). Scatter plot showing the inverse relationship between the units’ median scores for the survey each year and the units’ standardised mortality rate (SMR) (rs = −0.4, p < 0.001).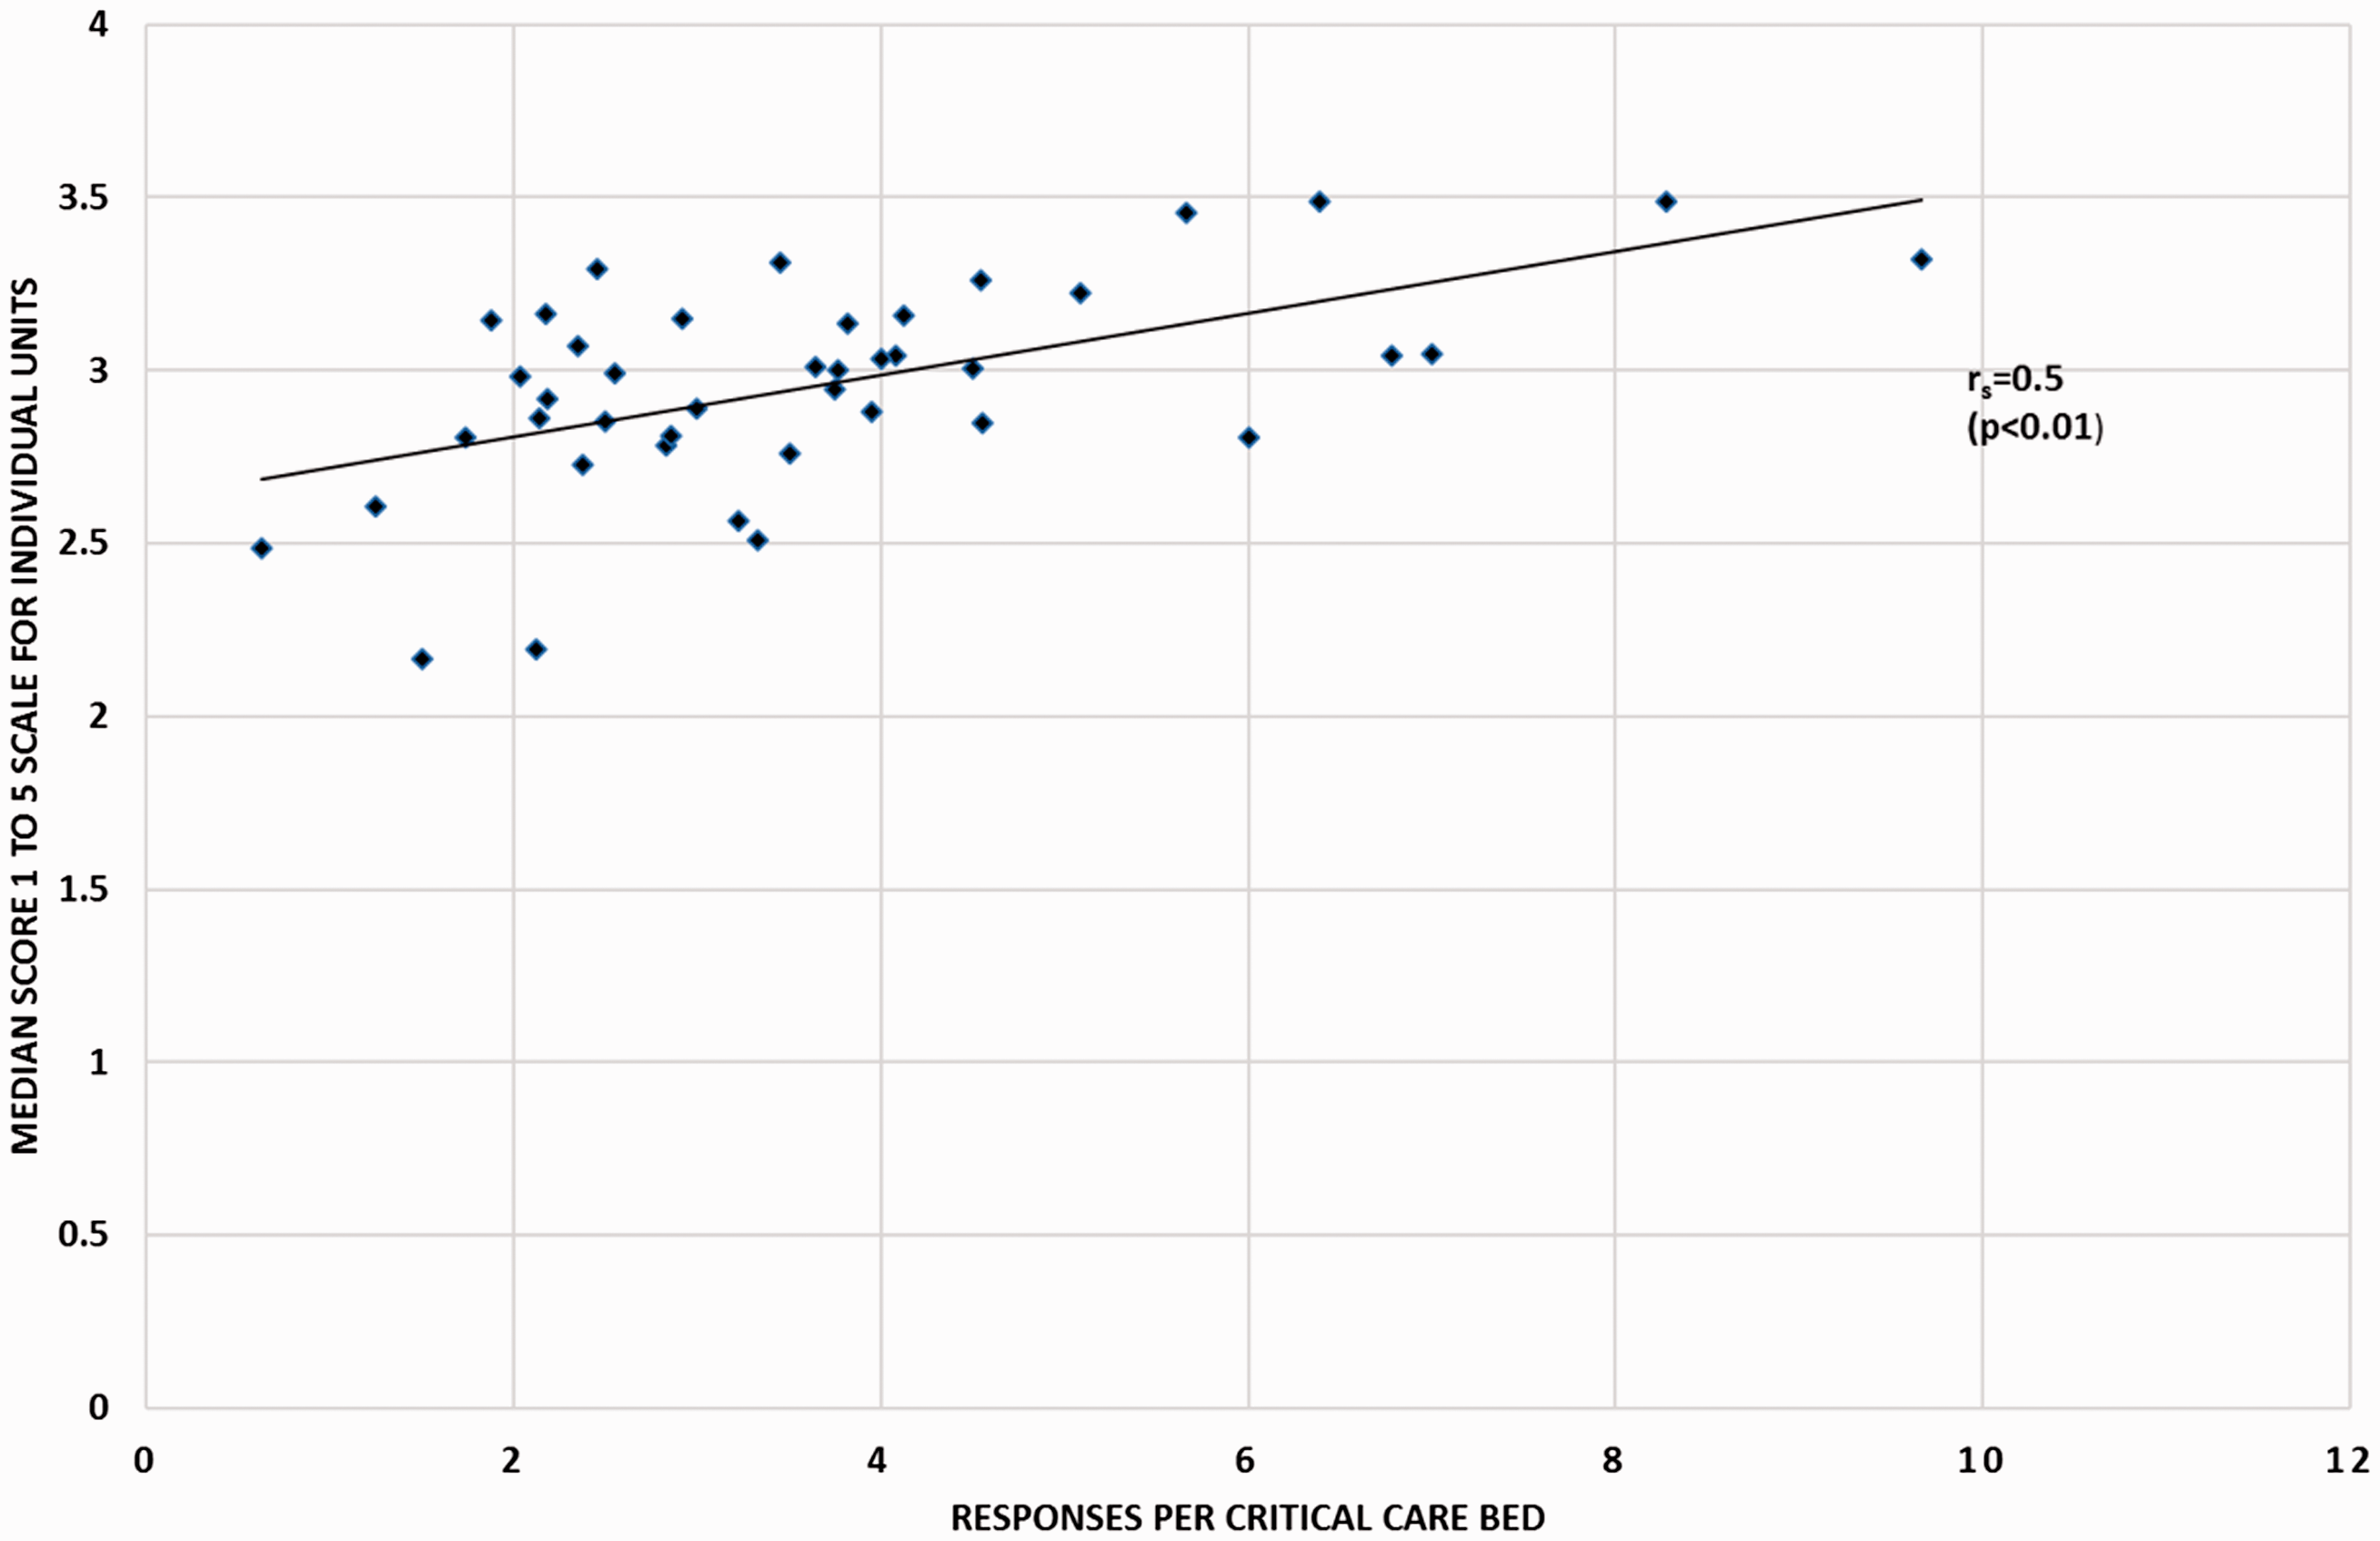
There was a significant change in the median scores for the responses to the question ‘I frequently feel tired at work’ between 2016 and 2017 (median scores with IQRs: 2015: 4.0 (3.0–4.0), 2016: 4.0 (3.0–4.0), 2017: 2.0 (2.0–3.0); p < 0.001).
Spread of responses in each questionnaire around the median response both for all 37 questions and for questions in the individual domains of communication, learning organisation, moral and training.
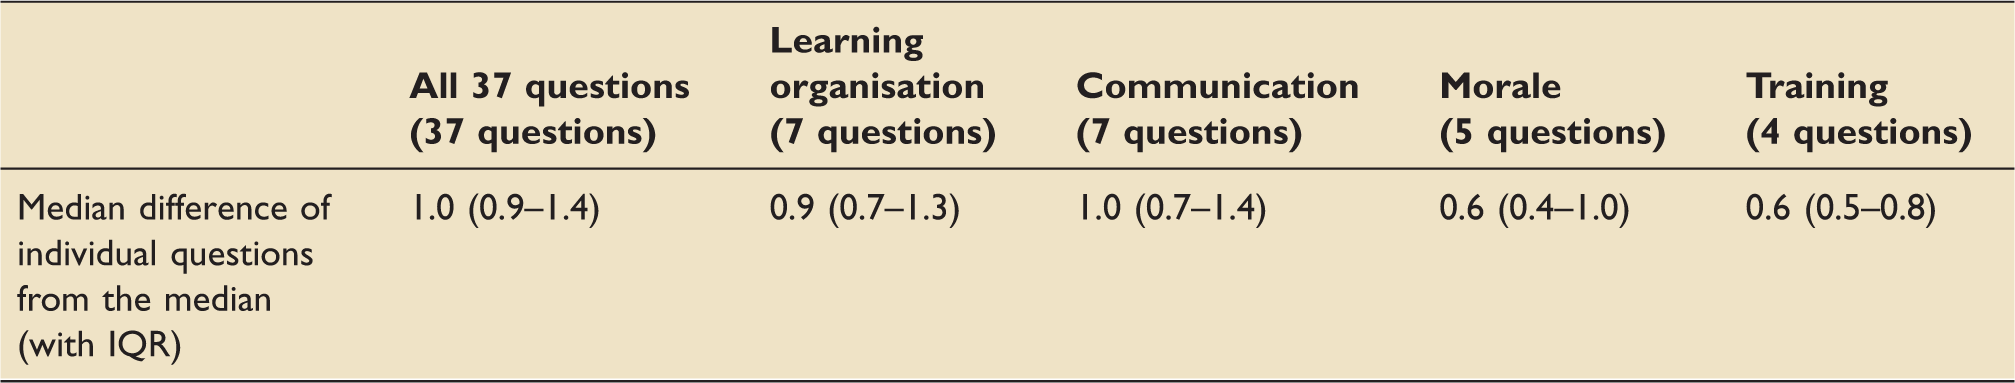
Note: The numbers are expressed as the median of individual differences in scores from the median score for all questions and individual domains.
Although we had made no attempt to formally assess peoples’ understanding of the feedback forms, discussion in subsequent network meetings and with individual staff suggested colleagues had found the information understandable and helpful. The questionnaires also provided additional information to help in discussions about areas for potential improvement in the annual network reviews.
Discussion
Our review has shown that a critical care network can distribute and collect annual safety surveys from staff working across critical care units and that this information can be provided back to units in ways that are easy to understand. The surveys have also been helpful in informing annual reviews. The study has some limitations. Firstly, we made some modifications to the survey without attempting to repeat the previous validations of the survey. 4 The relation between the survey results and mortality rates does, however, provide some validity to our survey results. Secondly, the response rates were lower than those described in research studies of safety surveys. This was probably because we allocated fewer resources to ensuring high completion rates in a non-research setting. The variation in responses in individual questionnaires from the mean response and the lower per question variation in the individual domains suggests the 37 questions collect more information than would obtained from a single question asking for a rating of a unit’s safety culture.
The differences between staff groups have been described in previous research that has also reviewed possible reasons for these differences. 9 Previous studies have also suggested that senior staff have a more positive view of their unit’s safety culture. 10 Although the two-year cutoff for seniority that we chose for pragmatic reasons does not match previous reviews, we also showed a similar trend.
Previous researchers have implicitly recognised a relation between response rate and median scores and have added a correction factor for this. 11 The use of a correction factor assumes that staff with negative views are more likely to complete a form. Another explanation is that units with good safety cultures would be good at distributing and collecting forms. This would make any correction inappropriate. Previous reviews12–14 have also established relationships between aspects of the responses to the safety survey and patient outcomes. Reviewing these studies, it is surprising that in our relatively small study, we found such a clear significant inverse relation between median survey scores and SMRs. This finding does, however, validate the modifications to the survey and suggests that, in our clinical context, the survey is measuring something relevant to patient care.
Other studies have shown how safety surveys can be used to trach improvements in safety culture in quality improvement initiatives. 12 Our survey has shown a worsening of the response to ‘I frequently feel tired at work’. This suggests that the survey can be used as we have described to track changes in patient safety culture. The reason for the increase in fatigue in 2017 does not seem to be a shortage of staff, as the responses to the ‘are you short of staff’ question remained constant. Possible factors include, for all staff, dealing with intractable problems associated with patient flow. For nursing staff, it may reflect increases in overtime payments to discourage the use of agency staff that will have increased working hours. For medical staff, fatigue may reflect ongoing stress around contract negotiations. In our network, we have recommended monitoring of individual staff’s hours of work and restricting overtime following periods of sick leave.
For units with good response scores and SMRs, the other responses did not change very much over the study period; we have therefore agreed with these units that they will be offered a choice of annual or biennial surveys (around half have chosen to continue the annual surveys). In the future, we have considered using electronic forms to collect responses. We have not already done this because previous descriptions of the survey have used paper forms, we also felt that staff may already be asked to fill in a lot of other online forms and we were also concerned that many nurses do not routinely access their work emails.
In summary, we would suggest that our questionnaire and processes can be used to monitor safety culture across UK networks of critical care units and that the information can be provided in clearly understandable formats for clinical and managerial staff. The information can also be used to help in addressing problems during the process of annual review. We would also recommend monitoring of work hours to restrict excessive hours of work.
Footnotes
Acknowledgements
The authors acknowledge Andrea Berry and Karen Berry, lead nurses for the network. They also acknowledge all the critical care staff in the network who helped distribute and collect the forms, and all the staff who completed the forms.
Declaration of conflicting interests
The author(s) declared no potential conflicts of interest with respect to the research, authorship, and/or publication of this article.
Funding
The author(s) received no financial support for the research, authorship, and/or publication of this article.