
Abstract
Therapeutic interventions administered on Critical Care are often dosed on the basis of patient body size, to ensure treatments are effective in achieving their goals and to prevent harm from overdose. Many treatment modalities use predicted weights estimated from descriptors such as sex, weight and height to reduce error that is associated with using total body weight in critically ill patients. In this article we review the size descriptors that have been described, their origin and calculation. We then examine the role they play in dosing of common therapies utilised in Critical Care and potential areas of research for the future.
Keywords
Patient populations are not uniform within medical practice. Appropriate dosing of a specific treatment modality will vary depending on patient age, sex, weight, height and race. The most common mechanism to individualise a treatment is to dose it according to patient weight.
Patient weight is assumed to confer information regarding a number of variables that ensure the appropriate quantity of treatment is delivered to the patient, reducing the risk of harm whilst ensuring treatment is efficacious. This method is commonly employed in Critical Care to prescribe medication, calculate daily nutritional requirements, ensure correct mechanical ventilation and in the correct dosing of renal replacement therapy (RRT).
Whilst total body weight (TBW) on admission to the Critical Care unit may be appropriate for patients with a normal body mass index (BMI), it may not be appropriate in the obese patients due to the relative increase in the proportion of the fat compartment. This article examines the size descriptors that look to address this problem and then considers whether they might be useful to ensure appropriate dosing of interventions commonly used in Critical Care.
Measuring weight in Critical Care
On admission to Critical Care, patients are generally confined to bed as a result of the severity of their illness and the support that they require. To facilitate safe and repeated measurement of a patient’s weight, specific technology has been developed and incorporated within the patient’s bed to allow weight measurement. This can be prone to error if items of equipment are placed on the patient’s bed. Hoist scales do not have this problem but their use is often impractical in the critically unwell patient due to limited access and the requirement for additional personnel.
Which weight – Size descriptors
Total body weight
Total body weight (TBW) = Patient weight (kg).
TBW presents the most commonly used patient weight indicator, as modern bed technology facilitates its measurement, and therefore is a convenient method for estimating treatment doses.
Despite its ease of measurement, there are a few disadvantages of using a patient’s TBW on admission to Critical Care. Patients often have received large volumes of resuscitation fluid prior to admission, thus TBW may not reflect the patient’s pre-hospital ‘normal’ TBW. An improved estimate of ‘normal’ pre-admission TBW may come from discussion with family members about a patient’s normal TBW as described by Determann et al. 1 In the obese, TBW will be skewed by the relative increase in fat mass in comparison to lean body mass; this can lead to inappropriately large treatment doses in the obese patient.
Body mass index
Body mass index
BMI or Quetlet’s index was first described in 1869 2 ; initially, the denominator was height cubed but further investigation utilising the relationship between BMI and the incidence of coronary artery disease in males settled on height squared 3 as its denominator. Whilst BMI is useful to categorise obesity and associated risks of morbidity and mortality in males, it has not been tested in females. BMI use as a dosing indicator is limited because it uses TBW as the numerator. Sex difference or ethnicity is not accounted for either.
Body surface area
Body surface area (BSA) = TBW0.425 (kg)× Height0.725 (cm)× 0.007184
Developed in 1916, 4 BSA was used as a way of characterising obese patients in respiratory and metabolic experiments. BSA has been used in the dosing of chemotherapy agents and is frequently used to give index values to measurements on the critical care unit, for example cardiac output, stroke volume and systemic vascular resistance. However, as it considers the same variables as BMI, it is liable to the same error.
Ideal body weight
Ideal body weight (IBW) for males (kg) = 50 + [0.9 ×(Height (cm) − 154)]
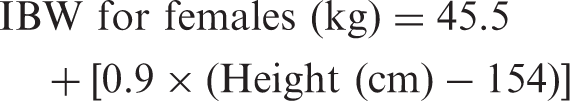
Initially derived from insurance data,5,6 IBW gave the weight for a given height that was associated with the lowest mortality. The formula has been further refined since then. 7 Whilst it takes into account male and female populations separately, it only uses one size descriptor and was not designed as a means for standardising individual treatments. It would seem the assumption that individuals of the same height should have the same mass is a generalisation too far. Despite this, IBW has become a popular weight descriptor on Critical Care; this is likely due to its ease of measurement and its use as a weight descriptor in the Critical Care literature.
Predicted body weight
Predicted body weight (PBW) for males (kg) = 50 + [0.91 ×(Height in cm − 152.4)]
Predicted body weight (PBW) for females (kg) = 45.5 + [0.91 ×(Height in cm − 152.4)]
PBW was the predictor of weight used in the ARMA study 8 that investigated the use of low tidal volume ventilation in patients with adult respiratory distress syndrome (ARDS). The method for calculation is remarkably similar to the calculation of IBW and was taken from the Handbook of Clinical Dug Data seventh edition. Interestingly, its use is seldom seen elsewhere in the literature and there does not seem to be significant evidence that this has been validated as a body size descriptor.
Fat free mass
Fat free mass (FFM) for males (kg) = (0.285 × TBW) + (12.1 ×Height
2
(m2))
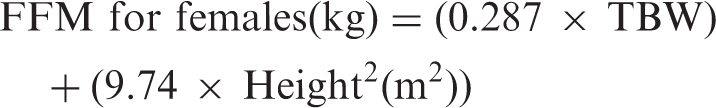
Initially, the value was described in animal models and then anthropometric data were used to develop a human model. The equation quoted above is derived in a study 9 that used total body water, body density and body potassium measurements to derive the FFM. FFM takes into account sex, weight and height and therefore has desirable dosing characteristics; however, the study that validated the equation was small and its primary aim was to assess the ability of BMI to estimate FFM.
Adjusted body weight
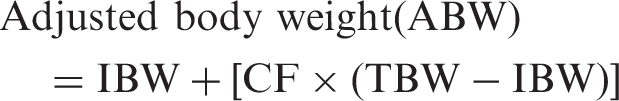
ABW was developed as a size descriptor for use in pharmacokinetic experiments. 10 A drug-dependent correction factor (CF) is applied to normalise the volume of distribution of a drug. Whilst it does consider height, weight and sex, the need for a CF makes its use cumbersome and limited to drug dosing. It also uses IBW and thus has similar limitations.
Predicted normal weight
Predicted Normal Weight (PNWT) for males = [(1.57 × TBW)−(0.0183 × BMI × TBW)] − 10.5
PNWT for females = [(1.75 × TBW) − (0.0242 × BMI × TBW)] − 12.6
Predicted normal body weight 11 incorporates an old version of the calculation for lean body weight (LBW) to represent the expected normal weight of an obese individual as the sum of their lean body mass and their predicted normal fat mass, which excludes excess fat mass. The estimation of LBW 11 used to calculate PNWT is based on a population whose maximum weights were far lower than those commonly experienced today, indeed as TBW increases beyond a certain point LBW actually decreases. The formula may, therefore, be subject to mathematical inconsistencies at extremes of weight.
Lean body weight
Lean body weight (LBW) for males (kg) = (9270 × TBW)/[6680 + (216 × BMI)]
Lean body weight (LBW) for females (kg) = (9270 × TBW)/[8780 + (244 × BMI)]
LBW describes the mass of non-fatty cells and connective tissue. It uses sex, weight and height data through its use of BMI. The formula describing LBW 12 demonstrated above is a recent modification 13 ; it was validated against a far greater range of BMIs in comparison to earlier studies. A recent meta-analysis 14 suggested that, with an allometric exponent added, LBW may be the most suitable descriptor for modelling an increase in clearance with body size. LBW appears to represent a convincing scientific estimate of body size.
Dosing of treatment
Drug dosing
The dose of a drug is determined by the plasma concentration that is required to achieve the desired effect. The plasma concentration of a drug following administration is dependent on its absorption (if not administered via the intravenous route), distribution, metabolism and excretion from the body. The duration of administration will also affect the plasma concentration of a drug. Pharmacokinetic studies in drug development derive this information usually in fit, young, normal weight individuals and give rise to the posology information included with drugs. The first problem in dosing Critical Care patients is that they do not reflect the study population.
Drugs that require tighter plasma concentration control will have a suggested dose by weight. In normal body weight individuals (BMI <30), it is generally accepted that the use of actual body weight ensures satisfactory drug dosing.
In obese individuals, the question of which weight to use is more complex as the fat compartment represents a larger proportion of their body weight. Obese individuals also have an increased cardiac output; this will effect the peak plasma concentration of a drug administered as an intravenous bolus. Extracellular fluid volume will also be increased as most of the water volume associated with adipose tissue is in the interstitial rather than intracellular space. The correct weight to use when modelling obese individuals remains a hotly debated topic amongst clinical pharmacologists. The principles that outline the correct body descriptor to use when calculating appropriate drug dose are given below, but it must be remembered that this should not be a substitute for knowledge of the drug being used.
LBW is closely related to cardiac output, 15 and cardiac output has been shown to accurately model the initial distribution of thiopental, 16 a hydrophobic drug. Given these relationships, it would seem that when given as a bolus to achieve a specific peak plasma concentration, hydrophobic drugs should be given based on LBW. Clearance is more closely related to LBW than TBW, 17 which would also support the use of LBW to maintain a certain plasma concentration. When hydrophobic drugs are given by infusion, often for sedation, accumulation in the poorly perfused fat mass becomes more significant leading to a prolonged context sensitive half-time and therefore effect when the infusion is turned off. This can largely be avoided by using drugs such as propofol and remifentanil or daily sedation holds. However, when longer acting hydrophobic drugs are given in divided doses rather than an infusion, TBW should be used as a result of the increased volume of distribution of the drug due to the increased size of the fat compartment.
Hydrophilic drugs, such as muscle relaxants, have a much smaller volume of distribution than hydrophobic drugs as they distribute to the lean tissues only. As a result, LBW provides a more accurate predictor of appropriate dose, not only because it represents the FFM but also because it reflects clearance more accurately than TBW. 17 Use of TBW is likely to increase the incidence of side effects and prolong the duration of action.
There is currently little information as to how underweight individuals (BMI <18.5) should be dosed. One option is to use paediatric dose calculations using TBW; however, drug metabolism in adults is different to that in children. In Critical Care, patients tend to be underweight as a consequence of malnutrition prior to their admission; as a consequence, drug pharmacokinetics may be different from normal individuals. Distribution may be affected by a relative reduction in fat mass and hepatic metabolism of drugs can be reduced or easily saturated due to a reduction in enzymes or conjugating factors.
RRT dosing
An international consensus decision 18 states that the actual delivered dose of continuous RRT should be an effluent rate of 20 ml/kg/h for both continuous veno–veno haemofiltration and continuous veno–veno haemodiafiltration. This decision was made on the basis of two large randomised controlled trials19,20 that failed to demonstrate a benefit with higher doses of RRT. Both studies used TBW for the prescription of RRT either at the time of randomisation 20 or TBW prior to the onset of acute illness. 19 There have been no studies to date that have looked at an alternative estimate in patient weight for the dosing of RRT; however, given that clearance of substances only occurs in the lean tissues; perhaps LBW may serve as a better estimate in the obese population. Indeed, LBW appears to offer the most accurate estimation of creatinine clearance using the Cockcroft and Gault formula. 21
Ventilation dosing
Positive pressure ventilation utilised for invasive respiratory support exposes patients to the risk of lung injury due to volutrauma, barotrauma and atelectotrauma. The ARMA 8 study demonstrated that selection of low tidal volumes improved survival in patients with ARDS. It utilised PBW based upon height to target particular tidal volume suggesting tidal volumes of 6 ml/kg PBW for ARDS, 6–8 ml/kg PBW in acute lung injury (ALI) and 8–10 ml/kg PBW in normal lungs. The limitations of PBW are discussed above. However, as there have been no studies yet looking at the ideal size descriptor that relates patient weight, height and sex to lung size or ventilator requirements it would seem prudent to continue to use PBW in the context of a ventilation protection strategy whilst we await further studies.
Nutrition dosing
Nutrition in critically ill patients is dosed on the basis of metabolic rate. Indirect calorimetry provides an accurate estimate of metabolic rate in patients; however, indirect calorimetry is not always available. As a result, predictive equations are used that give an estimate of energy requirements based on TBW. In the obese, due to the relative increase in the hypometabolic fat compartment, use of actual body weight could lead to an overestimation of energy requirements. This is demonstrated by the allometric relationship between actual body weight and basal metabolic rate.
The Penn-State equation has been found 22 to give the most accurate estimate of BMR when compared to indirect calorimetry data in critically ill patients across all weights and ages; however, its accuracy rate was still only 67%. The Penn-State equation uses an ABW with a CF of 0.25. The American Society of Parenteral and Enteral Nutrition recommend that the dose of enteral nutrition in critically ill patients should be calculated based on estimates from indirect calorimetry. 23 In the absence of indirect calorimetry, predictive equations that use actual body weight at the time of admission (or dry body weight) should be used with caution. In the obese, they recommend hypocaloric feeding with the feeding regime not exceeding a target of 11–14 kcal/kg/day or 22–25 kcal/kg/day IBW. However, they acknowledge that there is a lack of RCT evidence to support these recommendations.
The future
Populations are normally distributed and historically medicine has been concerned with treating the average person within that distribution, homogenising the heterogeneous. We are increasingly recognising the importance of individualising medical therapy. Critical Care is no different; indeed our patients are far more sensitive to the deleterious effects of over- and under-treatment. We use body size descriptors to extrapolate experimental data to fit the patient. The problem is deciding which to use. Prediction of LBW appears the most compelling as it aims to calculate the metabolically active mass, important for the prescription of pharmacotherapy, RRT and nutrition. It would seem reasonable that this weight is also related to lung volumes, but this needs further study. PNWT may also offer a solution to modelling of weight based on normal lean and fat compartments if it is updated.
The difficulty with applying these descriptors to patients in Critical Care is that, so far, very little research has been carried out to the impact of their use in Critical Care patients. Whilst the more recent size descriptors have been validated against populations with extremes of weight, these populations did not include critically ill patients. The same is true of the populations used to calculate posology data. It therefore remains to be seen whether individualisation of treatment using LBW or PNWT instead of TBW or IBW will have an impact on mortality and morbidity; further research is required to answer this question.
Footnotes
Declaration of Conflicting Interests
The authors declared no potential conflicts of interest with respect to the research, authorship, and/or publication of this article.
Funding
The authors received no financial support for the research, authorship, and/or publication of this article.