
Abstract
The state of health (SOH) and remaining useful life (RUL) of lithium-ion batteries describe the current aging degree of the batteries from different perspectives, and accurate and efficient battery health estimation is essential for their safe use. To improve the effectiveness and accuracy of the batteries’ health assessment models, this paper proposes a new method for SOH and RUL estimation of lithium-ion batteries. Convolutional neural networks (CNNs), bi-directional long short-term memory (BiLSTM), and attention mechanism (AM) to build a hybrid network model for capacity estimation of lithium-ion batteries, and further calculate the SOH and RUL estimation results. By using Center for Advanced Life Cycle Engineering (CALCE) lithium-ion battery capacity degradation data, we extracted the battery health indicator (HI) and verified the reasonableness of HI selection by using Gray Relational Analysis (GRA) and compared it with other network models to calculate the prediction accuracy by various evaluation indexes. The experimental results show that the method has higher estimation accuracy while avoiding the construction of complex battery mechanism degradation models and is highly generalized.
Keywords
Introduction
As an ideal energy storage device with high energy density, low pollution, and long service life, lithium-ion batteries are widely used in the field of new energy electric vehicles and energy storage.1–3 However, in actual operation, the continuous charging and discharging of batteries and their application in harsh environments such as vibration and high temperature can lead to irreversible battery damage and degradation of battery performance, bringing safety risks to the normal operation of electric vehicles and even causing permanent damage to the device.4–7
Therefore, accurate battery state of health (SOH) and remaining useful life (RUL) estimation is one of the key issues for efficient and safe energy utilization.8,9 However, the complex internal chemical structure and working mechanism of lithium-ion batteries lead to a rather complicated aging process, which makes it difficult to obtain accurate and direct SOH and RUL of lithium-ion batteries. Currently, battery SOH and RUL estimation methods are divided into two main categories: model-based methods and data-driven methods.4,5,10–12
The model-based method, in particular, is extensively employed in the field of SOH and RUL estimation because it can better reflect the internal physical and chemical changing features of the battery. The model parameters are mainly identified by filtering algorithms, typically extended Kalman filter (EKF), 10 Kalman filter (KF), 11 and particle filter (PF).11,12 Bressel et al. 10 utilized the EKF to estimate the SOH. Mo et al. 11 proposed a new PF-based RUL estimation method for lithium-ion batteries that combines the KF with particle swarm optimization (PSO). Saha et al. 12 implemented the PF to track the model parameters and then diagnosed the RUL based on a lumped parameter model.
The data-driven method, which has great viability, does not require proper physical and chemical model structure and instead mines the battery aging decrease law from battery historical operating data.13,14 In recent years, machine learning algorithms have been widely used in battery SOH and RUL prediction, such as support vector machines, 15 Gaussian process regression (GPR),16,17 probabilistic neural network (PNN). 18 Lin et al. 17 proposed a multi-feature based multi-model fusion method to estimate the SOH of lithium-ion batteries while considering battery historical data features, the SOH prediction model fused multiple linear regression, support vector regression, and GPR. Lin et al. 18 estimated the SOH of lithium-ion batteries using a PNN.
Some representative deep learning algorithms are convolutional neural network (CNN),19,20 recurrent neural network (RNN), 21 and long short-term memory (LSTM).9,22 Shen et al. 19 proposed a deep learning approach that utilizes a deep CNN (DCNN) for battery capacity estimation during partial charge cycles. Li et al. 20 established the one-dimensional CNN (1D-CNN) for lithium-ion battery SOH prediction and investigated the effect of different network architectures and parameters on SOH prediction accuracy. To overcome the shortcomings of a single neural network model, a hybrid model of battery has gradually emerged. RNN networks are suitable for dealing with time series problems. LSTM and gated recurrent units overcome the long-term dependence of RNNs on the inability to capture data by introducing a gating mechanism.21,23 Zhang Y et al.9 predicted the battery RUL by learning the long-term correlation of capacity degradation of battery using LSTM. Meanwhile, to improve the accuracy and effectiveness of the estimation models, many works have been done to improve the existing estimation models.21,24,25 By constructing an AST-LSTM NN, Li et al. 24 established a multi-cell shared prediction framework for battery SOH and RUL prediction. Zraibi et al. 25 established a CNN-LSTM-DNN hybrid model for lithium-ion battery RUL estimation and conducted experiments on two battery datasets from NASA Prognostics Data Repository and Center for Advanced Life Cycle Engineering (CALCE), with high prediction accuracy.
The attention mechanism (AM) is a resource allocation mechanism that can highlight the impact of more important information by assigning different weights to the input features so that features containing important information do not disappear as the step size increases.26,27 Qin et al. 27 proposed that combining the model with the RNN network makes it simpler for the model to learn long-term interdependencies in the sequence, which improves the model's prediction accuracy. To make full use of the measurable parameter data of lithium-ion batteries and improve the estimation accuracy and effectiveness of traditional models, this paper combines the advantages of CNN, bi-directional long short-term memory (BiLSTM), and AM, and designs an attention-based CNN-BiLSTM network model to estimate and evaluate SOH and RUL of the lithium-ion batteries. Extraction of battery health indicator (HI) using the CALCE of the University of Maryland includes CS2-35, CS2-36, CS2-37, and CS2-38. 28 The reasonableness of HI selection was verified by using gray correlation analysis (GRA) and compared with other network models, 29 and the estimation accuracy of the hybrid neural network model was verified by various evaluation indexes. The main contributions of this paper are as follows.
(i) The battery health factor criteria were established for the complex characteristics of the cyclic charge/discharge data of lithium-ion batteries, and the health factors were screened by the grey correlation analysis.
(ii) An attention-based CNN-BiLSTM hybrid neural network model is proposed to train the extracted battery capacity vectors and HI vectors in order to accomplish an accurate assessment of battery health status and effective estimation of remaining service life.
(iii) Attention mechanism is added to the network to make the model more focused on useful information in the feature vectors.
(iv) The accuracy of the designed model was verified by comparing it with other deep learning models using various evaluation metrics on the CALCE dataset, and excellent results were obtained.
Lithium-ion battery SOH and RUL analysis
Definition of SOH and RUL
The degree of battery performance degradation can be used as a reference indicator of SOH, which can be characterized by battery capacity and internal resistance.1,4 The specific equations are as follows.


To ensure the safe and stable operation of the system, the battery failure threshold is usually a reduction in capacity to 70%–80% of the nominal capacity.
30
In this paper, we choose the failure threshold for the battery capacity decay to 80% of the initial capacity, then the battery end of life (EOL) is defined as the equation (3):

RUL is defined as the number of cycles remaining for the battery to reach the failure threshold at a given output capacity as shown in equation (4).

Lithium-ion battery aging data analysis
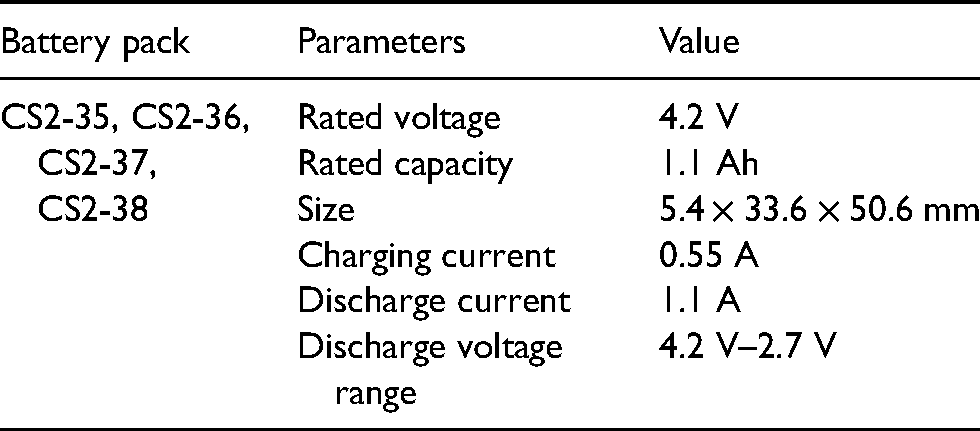
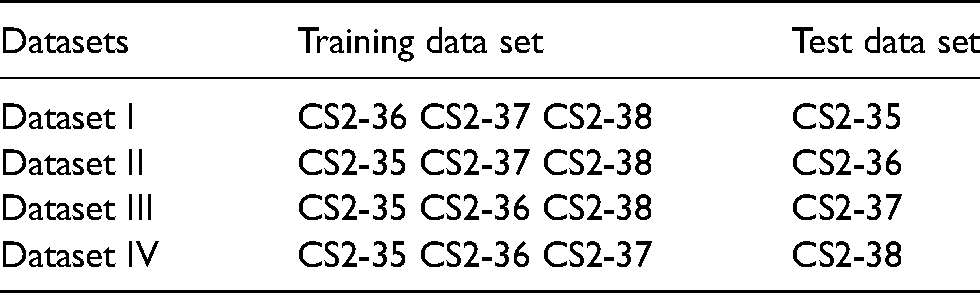
The aging experiments of lithium-ion batteries require a long period, and there are few publicly available aging experimental datasets, so the CALCE dataset was selected for testing, and its main technical parameters are shown in Table 1.
Test lithium-ion battery information.
The sampled values for each time series of multiple state parameters of the CS2 type lithium-ion battery are recorded in the data set for the complete cycle from normal to failure. The true value of the battery capacity per cycle is calculated or obtained by the ampere-time integration method, as shown in equation (5).
The data collected during the charging and discharging of lithium-ion batteries is discrete, so the integration process is transformed into a cumulative summation. Then, the following equations are obtained.
The curve of capacity degradation of the CALCE battery dataset (cells CS2_35, CS2_36, CS2_37, and CS2_38) is shown in Figure 1. It is noteworthy that the capacity degradation is not smooth downward, and there is a fluctuating part of the curve, indicating that each experimental cell has capacity regeneration phenomena, which is a polarization effect occurring within the cell. 31 This illustrates that the battery capacity cannot be estimated by the number of cycles alone.

CALCE battery capacity degradation curve.
The charge and discharge current and voltage curves of the CS2_35 at different cycle times are shown in Figure 2, which is one-dimensional time series data. The multifaceted external characteristics are extracted as HIs to assess the degradation of battery performance.

Current and voltage curves of CS_35 charge and discharge stages. (a) Charge voltage curve; (b) charge current curve; (c) discharge current curve; and (d) discharge voltage curve.
Attention-based CNN-BiLSTM
Basic algorithm theory
Convolutional neural networks
Two-dimensional convolution is mainly used for feature extraction of images.32,33 One-dimensional convolution is used for time series processing such as natural language processing.19,20 An illustration of 1D convolution is shown in Figure 3, and the output is calculated as:

The illustration of 1-D convolution.
A CNN consists of the convolutional layer and the pooling layer. Since the amount of battery cycle data is relatively less, adding a pooling layer will lose a large amount of information, so the structure of CNN consists of a convolutional layer only. The convolutional layer performs convolutional operations through local regions of the battery capacity data and outputs the corresponding feature mapping to extract the effective features on the battery HIs and historical capacity data.
Bi-directional long short-term memory
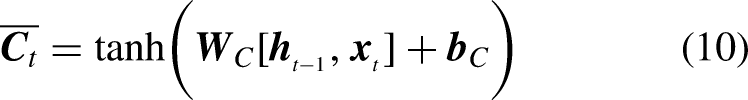
LSTM and BiLSTM as special types of RNN approach for modeling sequential data. The LSTM network consists of forget gates, input gates, and output gates. The structure of LSTM is shown in Figure 4. 34
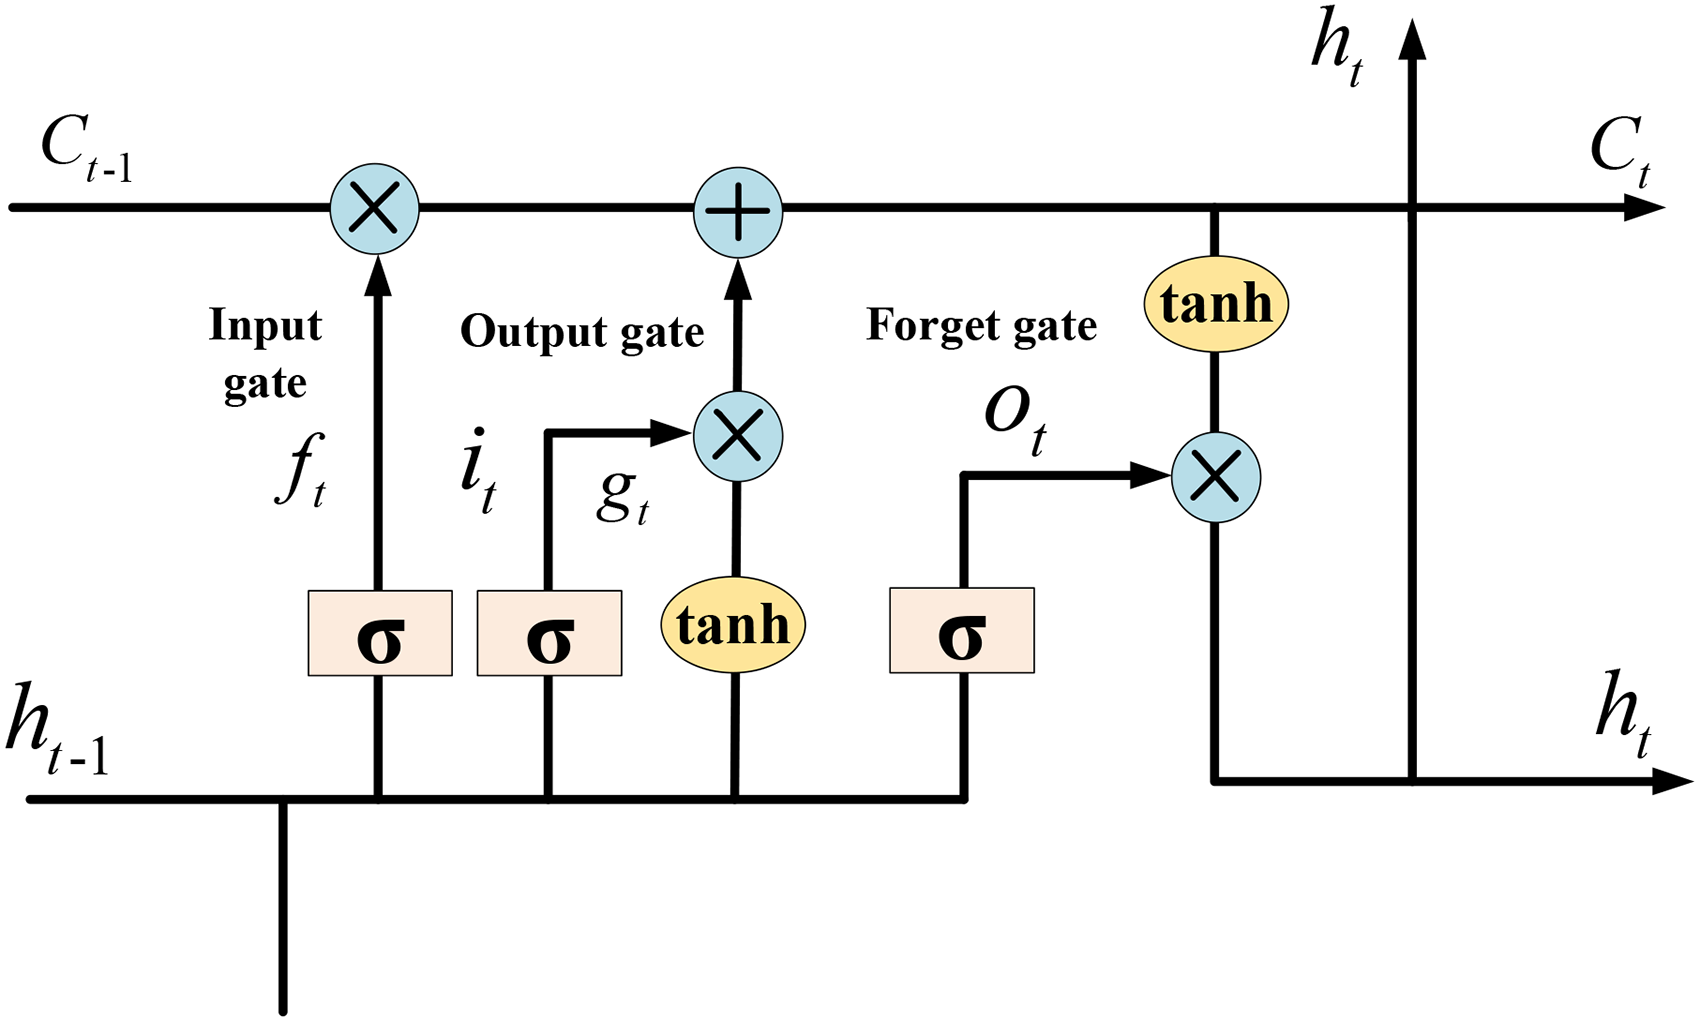
The structure of the LSTM network.
The forward propagation process equation is shown below.


BiLSTM sets up two layers consisting of LSTM with opposite directions, which are the forward layer and the backward layer, respectively. The structure of BiLSTM is shown in Figure 5. 35

The structure of bi-directional LSTM network.
Attention mechanism
As the length of the input sequence increases, it is difficult for the BiLSTM to save all state information, so this part introduces the AM. The AM assigns different weights to the inputs of BiLSTM to capture the global and local relationships, thus amplifying the input features that are strongly correlated with the battery capacity degradation trend. The AM is calculated as follows.


Model construction
CNN model can reduce the number of parameters in the training process of hybrid neural networks by learning the characteristics of lithium-ion batteries’ cyclic data in the overall structure and make the number of operations greatly reduced by sharing the weights of convolutional kernels to alleviate overfitting. RNN model has the problem of gradient disappearance or gradient explosion, and the LSTM model can only fit unidirectional data due to its structure, while the BiLSTM model is added to the original LSTM. The BiLSTM has a reverse LSTM added to the original LSTM, which can fit bidirectional information at the same time to capture the information that the CNN may ignore. The AM is added after the BiLSTM layer to make BiLSTM perform better in longer time series estimation tasks. The convolutional layer extracts the intrinsic features of the time series data, the BiLSTM can predict the battery capacity based on the extracted features, and the AM assigns weights to the features. The structure diagram of the hybrid neural network model is shown in Figure 6.

Structure diagram of attention-based CNN-BiLSTM model.
HI extraction and selection
The selection of HIs is extremely important. The τ-th HI sequence can be described as:
Step 1: Obtain the measured values of voltage and current in each charging cycle, the measured values of voltage change rate, internal resistance, and current in each discharging cycle, and establish the following HIs.
(i) Constant voltage charge time (CVCT): As can be seen from Figure 2(a), the CVCT gradually decreases as the number of charge–discharge cycles continues to increase. It can be seen that the charge voltage implies the characteristics of battery performance degradation, which can indirectly characterize the battery health status information. The CVCT is taken as the first HI to characterize the battery health status and is noted as HI (1).
(ii) Constant current charge time (CCCT) 36 : As shown in Figure 2(b), the constant current charge time decreases gradually with increasing charge–discharge cycles as the second HI to characterize the battery health status and is noted as HI (2).
(iii) Average internal resistance: With increasing charge–discharge cycles, the internal resistance of the battery shows a gradual increase trend, and the average internal resistance of the discharged battery in each cycle is obtained as the third health factor characterizing the health status of the battery and is noted as HI (3).
(iv) Terminal voltage conversion rate: During discharge, the battery terminal voltage gradually decreases and presents a gradual decrease with increasing charge–discharge cycles of the lithium-ion batteries, as the fourth HI to characterize the health status of the battery, and is noted as HI (4).
Step 2: After going through Step1 to calculate the CVCT, CCCT, Average Internal Resistance, and Terminal Voltage Conversion Rate respectively to form the HI sequence, the HIs are extracted from the CS2_35 as shown in Figure 7.
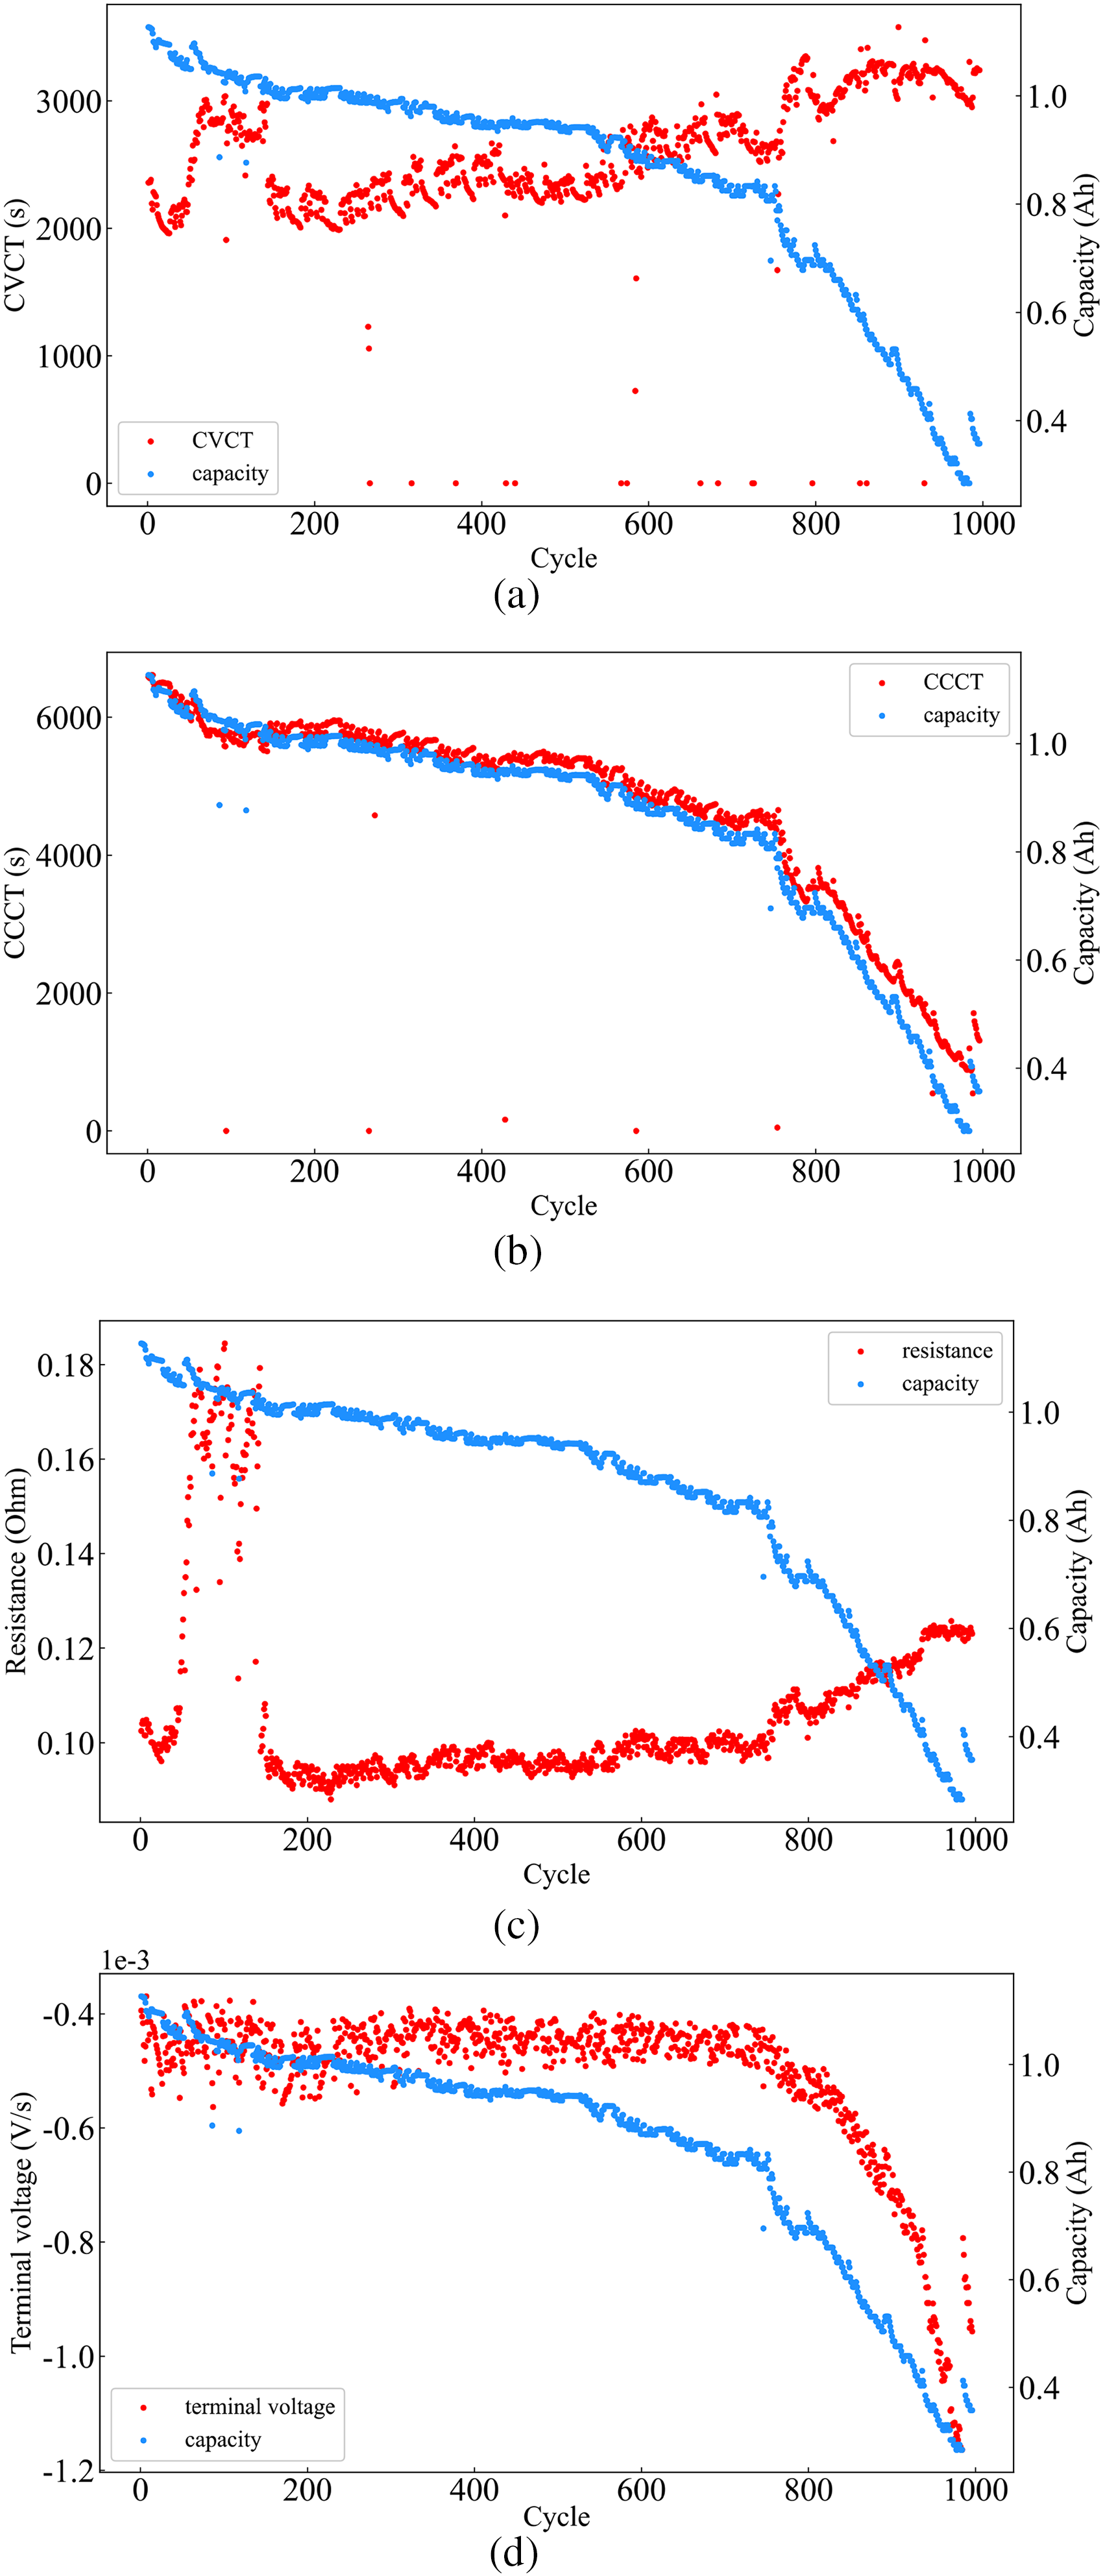
HIs and capacity curves. (a) Constant voltage charge time and battery capacity curve; (b) constant current charge time and battery capacity curve; (c) average internal resistance and battery capacity curve; and (d) terminal voltage conversion rate and battery capacity curve.
Step 3: Calculate and analyze the correlation between HI sequences and lithium-ion battery capacity using the gray correlation analysis method. The HI with a strong correlation with battery capacity was screened out by a heat map of health factor and capacity correlation, and the correlation between HI and battery capacity was extracted from CS2_35 as shown in Figure 8.

Heat map of HIs and capacity correlation.
The above correlation shows that the highest correlation with the battery capacity is the CCCT followed by the battery terminal voltage conversion rate. Therefore, the final filtered HI is CCCT and battery terminal voltage conversion rate.
Estimation process of SOH and RUL
The neural network has strong nonlinear expression capability, and the SOH and RUL of lithium-ion batteries are further estimated by finding the nonlinear function f that maps the first w battery capacity measurements and HI to the target capacity of the lithium-ion battery.

After the model is constructed and the battery HI data is acquired, the flowchart of the SOH and RUL estimation method based on the attention-based CNN-BiLSTM model is shown in Figure 9.

Flowchart of SOH and RUL estimation method based on attention-based CNN-BiLSTM model.
Experimental verification and comparative analysis
The hybrid network model established in Section 2.2 is used for the experiments. The processor used for the experimental hardware in this paper is Intel(R) Core (TM) i5-7200U CPU@2.30GHz with 16 GB running memory. The model is implemented with the support of the Tensorflow framework based on the Keras deep learning tool. The dataset was divided after pre-processing the CALCE dataset as shown in Table 2.
Dataset division.
Evaluation criteria
To verify the performance of the model in SOH and RUL estimation, root mean squared error (RMSE), mean absolute error (MAE), model coefficient of determination R2, and RUL absolute error (RULerror) are used as performance indicators for evaluation, and the formula is as follows:


Comparative analysis of models
Based on the data set division, the corresponding HI data were obtained by the calculation in the Model construction section, and the battery capacity estimation was carried out by the constructed model to further obtain the SOH and RUL estimation results, and the model parameters were set as shown in Table 3.
Layers and parameters of the model.
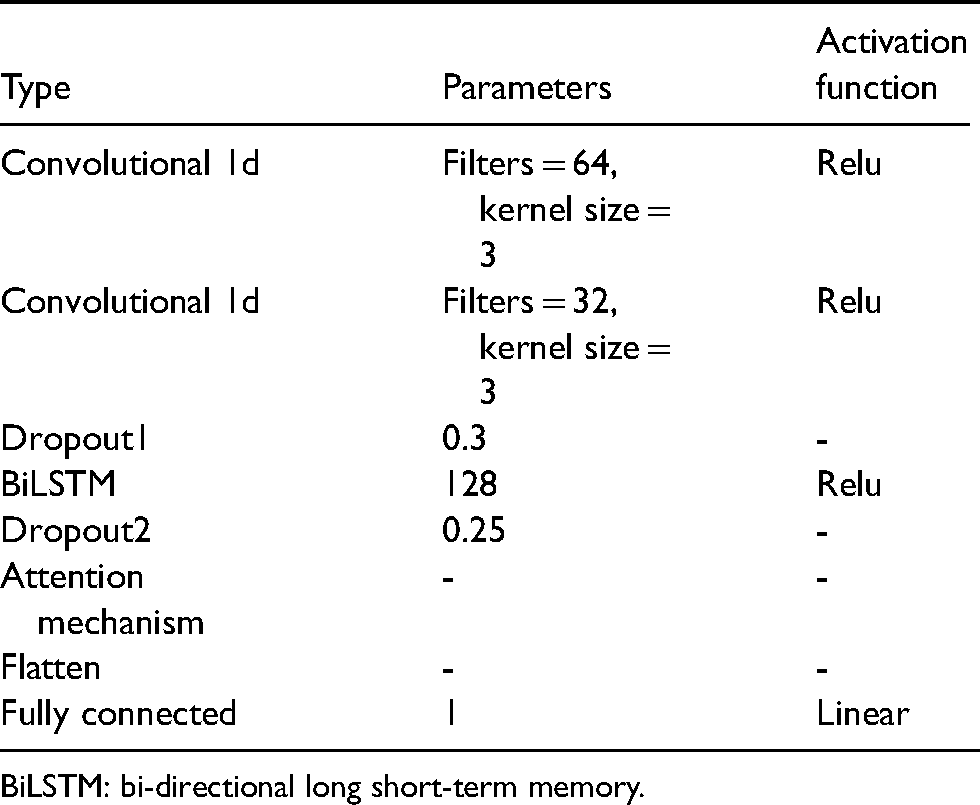
BiLSTM: bi-directional long short-term memory.
Meanwhile, to further verify the effectiveness and accuracy of the proposed method, it is compared with CNN, BiLSTM, CNN-LSTM, attention-based BiLSTM, and CNN-BiLSTM for training. The battery capacity estimation curves and the measured curves obtained by the six network models on lithium-ion battery test dataset I, dataset II, dataset III, and dataset IV as shown in Figure 10, and the quantitative results are shown in Table 4 for more intuitive analysis of the estimated effects of the six methods.

Comparison of results from different architectures. (a) Estimation results for dataset I; (b) estimation results for dataset II; (c) estimation results for dataset III; and (d) estimation results for dataset IV.
Comparison of model structure.

CNN: convolutional neural network; BiLSTM: bi-directional long short-term memory; LSTM: long short-term memory.
The experimental results show that the attention-based CNN-BiLSTM model has an excellent performance in all four datasets using different evaluation metrics. The SOH predictors MAE, RMSE, and R2 are better than CNN-BiLSTM, attention-based BiLSTM, and CNN-LSTM, and are close to CNN and BiLSTM network models. The RUL error is the highest among the six models the smallest value and the highest accuracy in the comparison. Taking data set I as an example, the MAE and RMSE of CNN, BiLSTM, CNN-LSTM, attention-based BiLSTM, and CNN-BiLSTM obtained (0.0138, 0.0193), (0.0176, 0.0221), (0.00347, 0.0391), (0.0384, 0.0410), and (0.0259, 0.0319), while the attention-based CNN-BiLSTM model with MAE = 0.0089 and RMSE = 0.0149 is lower than the other five network models, especially R2 = 0.9949, which has the best fit, and this index is significantly better than the other network models. Comparing the overall metrics from the dataset estimation, the attention-based CNN-BiLSTM model achieves 1.5% of the mean battery capacity estimation error and 2.13% of the root mean square error. Obviously, attention-based CNN-BiLSTM can meet the demand of SOH and RUL estimation of lithium-ion batteries with superior estimation capability. In summary, the indicators demonstrate that the proposed attention-based CNN-BiLSTM network model improves the estimation accuracy and long-term estimation performance of battery SOH and RUL by combining the respective advantages of CNN, BiLSTM, and AM.
To compare the estimation accuracy of the proposed methods in this paper more conveniently and intuitively, the RUL errors are compared, and the comparative results of battery estimation for the CALCE dataset are plotted in Figure 10, where the proposed attention-based CNN-BiLSTM model has better estimation accuracy compared to other network models. We can conclude that the attention-based CNN-BiLSTM model can better handle the long-term and short-term dependencies and more accurately estimate the battery capacity decay trend.
To further validate the effectiveness of the model proposed in this paper, next, the relevant results of the attention-based CNN-BiLSTM model and other models are further compared, as shown in Table 5.
Results compared to results of other papers.
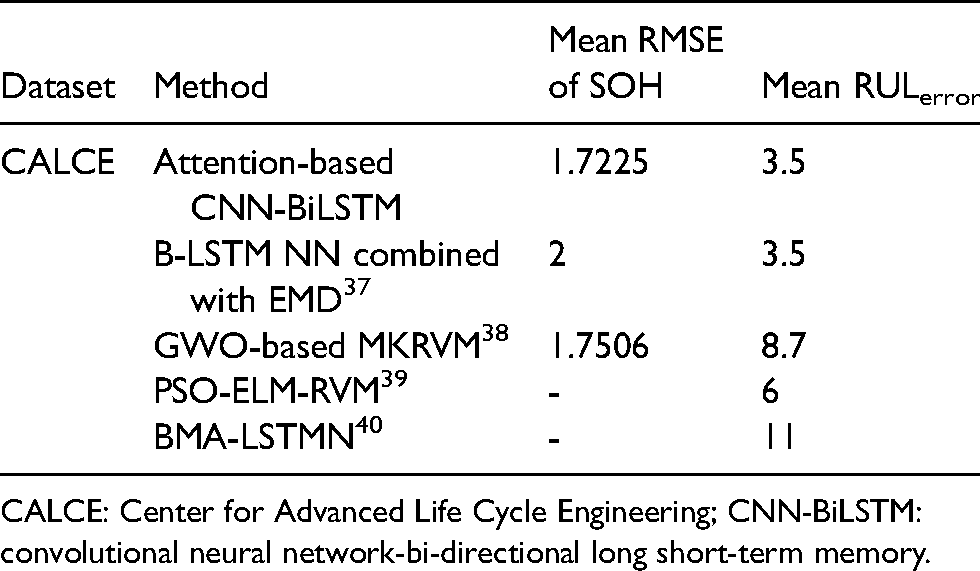
CALCE: Center for Advanced Life Cycle Engineering; CNN-BiLSTM: convolutional neural network-bi-directional long short-term memory.
The experimental results show that the proposed method has better performance, and the RMSE value is reduced by 13.9% in the battery SOH estimation compared to the B-LSTM NN combined with the EMD model, 37 which is also better than the GWO-based MKRVM model 38 ; in the RUL prediction, the mean RULerror results are the same as those of the B-LSTM NN combined with EMD model, with a reduction of 5.2, 2.5, and 7.5 cycles compared to the GWO-based MKRVM, PSO-ELM-RVM, and BMA-LSTMN predictions, respectively.
By comparing the accuracy of the attention-based CNN-BiLSTM model proposed in this paper with other models, it can be further concluded that the algorithm proposed in this paper can achieve excellent performance in the SOH and RUL estimation of lithium-ion batteries.
Conclusion
In this paper, an attention-based CNN-BiLSTM model is proposed for SOH and RUL estimation of lithium-ion batteries, and the model is validated based on the CALCE dataset, and the following conclusions are obtained.
(i) To extract the HI features for characterizing the internal state degradation of lithium-ion batteries and to verify the reasonableness of the extracted HI of battery by grey correlation analysis, in view of the complex characteristics of the cyclic charge/discharge data of lithium-ion batteries.
(ii) A framework for estimating SOH and RUL of lithium-ion batteries is constructed based on three independent networks and the extracted networks, using their respective characteristics to learn the extracted battery capacity vectors and HI vectors.
(iii) The CALCE dataset was tested using multiple evaluation metrics and compared with other typical deep learning models. The results show that the model achieves a mean battery capacity estimation error of 1.5% and a maximum root mean square error of 2.13%. The model can better explore the deep features of battery data, and the model fitting accuracy is higher, which validates the effectiveness and accuracy of the model, and provides a feasible method for power battery decommissioning detection.
In this study, only offline aging data of lithium-ion batteries have been studied, and the follow-up research will conduct further research on the application data of power batteries.
Footnotes
Acknowledgments
Thanks to the Center for Advanced Life Cycle Engineering (CALCE) for providing the lithium-ion battery dataset.
Declaration of conflicting interests
The author(s) declared no potential conflicts of interest with respect to the research, authorship, and/or publication of this article.
Funding
The author(s) disclosed receipt of the following financial support for the research, authorship, and/or publication of this article. This research was supported by the National Natural Science Foundation of China (grant no. 61673357), Shandong Province Key R&D Program Project (Public Welfare Category) (grant no. 2019GGX101012) and Shandong Province Higher Education Science and Technology Program Project (grant no. J18KA323).