
Abstract
Software reliability growth models are nonlinear in nature, so it is difficult to estimate the proper parameters. An estimation method based on a modified whale optimization algorithm in which parameters are estimated is discussed in this paper. The whale optimization algorithm is a new swarm intelligence optimization algorithm. This algorithm is not perfect enough. Based on the analysis of whale optimization algorithm, we point out the disadvantages of whale optimization algorithm, and propose a modified whale optimization algorithm algorithm from four aspects: choice regarding the dimension, exploration control, encircling prey modified, and candidate solution selection. The experimental results based on 34 benchmark functions demonstrate that the proposed modified whale optimization algorithm has better accuracy. The modified whale optimization algorithm is used to predict software reliability by predicting the faults during the software testing process using software faults’ historical data. The proposed modified whale optimization algorithm shows significant advantages in handling a variety of modeling problems such as the exponential model, power model, delayed s-shaped model, and modified sigmoid model. Experimental results show that the fitting accuracy of the modified sigmoid model model is minimal on three data sets. The modified whale optimization algorithm with the modified sigmoid model can provide a better estimate of the software faults.
Keywords
Introduction
With the development of computer technology, all kinds of software systems have permeated our modern society, involving wristwatches, telephones, home appliances, buildings, automobiles, aircraft, and other key areas, and play an increasingly important role. 1 An important issue in developing such software systems is to produce a high-quality software system that satisfies user requirements. Therefore, software reliability is becoming more and more important to researchers. The reliability of a software system can be defined as: “The probability of failure-free software operation for a specific period of time in a specified environment.” 2 Software reliability modeling is one of the important fields of theoretical research and engineering practice for software reliability. Various software reliability growth models (SRGMs) have been formulated over the years but according to an observation made by Lyu, 1 “There is no universally acceptable model that can be trusted to give accurate results in all circumstances; users should not trust claims to the contrary.” Every model has some advantages and some disadvantages; so, the choice regarding which model to follow for reliability prediction depends upon the requirements of the software. 3
The fault prediction process in SRGMs depends on representing the relationship between the time span of software testing and cumulative number of errors detected. 4 Most SRGMs, known in history, have two or three parameters to be estimated. They include the expected number of failures in the software by the end of the testing process and the initial failure intensity. 5 A number of unknown parameters such as the expected number of failures and the failure intensity are estimated using either the least square or maximum likelihood estimation techniques. Model parameters are normally in nonlinear relationships. This means that traditional parameter estimation techniques suffer from many problems in finding the best set of parameters to tune the model for better prediction. 6
The whale optimization algorithm (WOA) is a relatively new meta-heuristic optimization technique proposed by Mirjalili and Lewis, 7 which is inspired by the bubble-net hunting of humpback whales. WOA is easy to implement and has few adjustment parameters, which make it superior to particle swarm optimization (PSO), grey wolf optimizer (GWO), gravitational search algorithm, and so on. 8 As a result, WOA has attracted much attention and has been applied to handle many practical engineering application problems, such as training multilayer perceptrons in neural networks, 9 tracking the maximum power point (MPP) of photovoltaic systems, 10 optimizing the active and reactive power dispatch problem, 11 feature selection, 12 parameter estimation, 13 resource allocation, 14 and so on. Fundamentally, WOA is free from restrictive assumptions on the continuity, the existence of derivatives, the unimodality, and so on. It looks very attractive to use WOA for estimating the parameters of SRGMs.
In this paper, we analyze WOA and propose a modified WOA (MWOA). MWOA is used to predict software reliability by predicting the faults during the software testing process using software fault historical data. Moreover, an modified sigmoid model (MSM) is developed for a better estimate of the software faults. The rest of the paper is organized as follows: the next section presents a brief review of the works carried out in the area of software reliability prediction in research. The section “software reliability growth models” provides an overview of various SRGMS. The section “whale optimization algorithm” proposes the WOA briefly, and an MWOA algorithm is proposed in the following section. The section “performance test for MWOA” tests MWOA on 34 benchmark functions. In the section “Experimental evaluation,” detailed experiments results are provided. The final section concludes this paper.
Related work
As most of the SRGM are nonlinear in nature, the basic two methods (maximum likelihood and least square) are not suitable. 15 Neural networks and Bayesian learning are introduced for SRGMs’ parameter estimations.16,17 Interest in using evolutionary computation to solve prediction and software engineering problems expanded in the recent years.
Aljahdali and El-Telbany 18 explored genetic algorithms (GAs) as an alternative approach to derive these SRGMs. Souza and Vergilio 19 and Su and Huang 20 proposed an artificial neural-network-based approach for software reliability estimation and modeling. However, neural networks-based models were not easily interpreted; so, some other techniques were needed to be explored. Another technique inspired by GAs and named genetic programming was proposed to obtain software reliability model (SRM) for forecasting the reliability by Oliveira et al. 21 Zhang et al. 22 applied a PSO algorithm, for the estimation, but it was observed that the searching range is too large, the convergence speed is slow and accuracy is not high. The use of fuzzy logic to build an SRGM has also been explored by Aljahdali and Sheta, 23 who proposed a fuzzy model, which consists of a collection of linear sub-models joined together smoothly using fuzzy membership functions to represent the fuzzy model. Sharma and Pant 24 proposed a modified version of the artificial bee colony (ABC) to estimate the parameters of SRGMs. Alaa and Abdel-Raouf 25 explored the advantages of the GWO algorithm in estimating the SRGM's parameters. Choudhary and Baghel 26 used cuckoo search optimization to find the effectiveness of the reliability model. An approach based on an ant colony algorithm was proposed by Zheng et al. 27 to estimate parameters of SRMs. Zhou et al. 28 proposed a harmony search algorithm to estimate parameters of the SRM. Afterward Xiao and Dohi 29 studied the stochastic behavior of software fault detection process. It was shown that stochastic behavior-based SRMs outperformed the existing SRMs. After this, various stochastic techniques were used for parameter estimation of various SRMs, which gave better results than that of other traditional or evolutionary techniques. WOA is also a kind of swarm intelligence algorithm-based stochastic technique. In this paper, we explore the use of WOA and the proposed MWOA to predict the faults during the software testing process using software fault historical data. Detailed results are provided to explore the advantages of using MWOA in solving this problem.
Software reliability growth models
An SRGM can be considered as one of the fundamental techniques to assess the reliability of software quantitatively. Any SRM presents a mathematical function which illustrates defect detection rates. These models are classified in two categories: concave and S-shaped models. 3 Concave models are so-called because they bend downward. S-shaped models, however, are first convex and then concave. The two models have the same asymptotic behavior: The defect-detection rate decreases as the number of defects detected increases, and the total number of defects detected asymptotically approaches a finite value. Numerous researchers proposed various SRGMs to predict the quality of software components; three well-known SRGMs used in our study are discussed as follows.
Exponential model (EXPM)
This is a continuous time-independent and identical error behavior model. This model was first introduced by Goel and Okumoto
30
and is also known as the GO model.


It is important to realize that:
Power model (POWM)
The POWM is provided by Crow.
31
It is a graphical approach to perform analysis of reliability growth data and is simple and straightforward to understand. The model is based on the nonhomogeneous Poisson process model. The equations which govern the relationship between the time t and both


Delayed S-shaped model (DSSM)
This model describes the software reliability process as a DSSM.
32
Here, the per fault failure distribution is gamma. The number of failures per time period, however, is a Poisson type model using the classification scheme of Musa and Okumoto rather than considered as binomial. This model is also a finite failure model. The system equations for


Modified sigmoid model
There is no universally acceptable model that can be trusted to give accurate results in all circumstances; users should not trust claims to the contrary. Every model has some pros and cons; so, the choice regarding which model to follow for reliability prediction depends upon the requirements of the software. 3 Generally speaking, SRMs always go through three stages of generation, development and maturity, and the speed of each stage is different. For S-shaped models, usually at the stage of generation, the speed of change is slow; in the stage of development, the speed of change is quicker; in the mature stage, the speed of change is also slow. There is no universally acceptable single model that can be trusted to give accurate results in most or all applications. In view of the different growth characteristics at each stage of the model, a MSM is proposed in this paper to better fit the data and improve the accuracy of the model.
A sigmoid function is a mathematical function having a characteristic S-shaped or sigmoid curve. Sigmoid function shown in Figure 1 and defined by the formula (8) is often used in neural networks and logistic regression. For the SRMs, the sigmoid function is modified as formula (9).


The sigmoid curve.
Whale optimization algorithm
The WOA is a nature-inspired meta-heuristic optimization algorithm proposed by Mirjalili and Lewis in 2016. 7 WOA mimics the bubble-net feeding in the foraging behavior of the humpback whales. The humpback whales hunt close to the surface with trapping the prey in distinctive bubbles along a circle or 9-shaped path. The bubble-net hunting model is shown in Figure 2, and the mathematical model of WOA is described in three sections: encircling prey, bubble net hunting method, and search the prey.

Bubble-net feeding behavior of humpback whales.
Encircling prey
Humpback whales can recognize the location of prey and encircle them. Since the position of the optimal design in the search space is not known a priori, WOA expects that the present best candidate solution is the objective prey, and the other search agents will hence try to update their positions toward the best search agent. This behavior is mathematically formulated as:


Bubble-net attacking method (exploitation phase)
Two strategies are utilized to figure the feeding conduct of humpback whales as follows.
Shrinking circling system
This behavior is achieved by decreasing the value of a from 2 to 0 in equation (14) over the course of iterations. The new position of a search agent can be defined anywhere in between the original position of the agent and the position of the current best agent by setting random values for
Spiral redesigning position
A spiral equation is then created between the position of whale and prey to mimic the helix-shaped movement of humpback whales as follows:

In hunting whales swim around the prey in above two paths simultaneously. To update the whales’ positions, 50% probability is taken for the above two methods.

Search for prey (exploration phase)
To have a global optimizer, a randomly chosen solution is used to update the position instead of the best search agent found so far. So, a vector A with the random value >1 or <−1 is used to force a solution to move far away from the best-known search agent. This mechanism can be mathematically modeled as in equations (17) and (18).


Pseudo-code of whale optimization algorithm (WOA).
A modified whale optimization algorithm
Although WOA has several characteristics, there still exist its limitation for some complex problems, especially the phenomenon of premature convergence leading to local optimization and the deficiency of global search ability, which affect the performance of WOA. Through analyzing the basic WOA, four improvements have been made to improve the method for enhancing search performance and search quality, and an MWOA is proposed in this paper. The details are as follows.
Choosing dimensions
There is a probability p to choose between either the shrinking encircling mechanism or the spiral model to update the position of whales in the basic WOA. The choice probability p between the above two operations is the same for a whale during optimization. That is to say between the shrinking encircling update and spiral update, only one is selected for a whale. For some complex problems, this choice is difficult to well balance between exploitation and exploration. The choice probability p changes in each dimension of a whale in this paper. The probability p varies uniformly and randomly between 0 and 1, and the probability in each dimension is independent. So there is a probability p to choose shrinking encircling update or spiral update in each dimension of a whale for enhancing the search performance of WOA (see step 10 in Figure 4).

Pseudo-code of the modified whale optimization algorithm (MWOA).
Exploration control
The exploration control by the random number A in WOA, when |A| ≥ 1 WOA emphasizes exploration and allow performing a global search. A is a random value in the interval [−a,a] where a is decreased from 2 to 0 over the course of iterations according to equation (14). According to equation (12), when t > MaxIter/2, so t/MaxIter>1/2, 1 − t/MaxIter<1/2, 2(1 − /MaxIter) < 1, according to equation (14), a < 1, and |A|<a < 1. The range of A is shown in Figure 5(a). So, when t > MaxIter/2 there is only encircling prey without search for prey. However, search for prey is an exploration phase; it helps to avoid premature convergence. To improve exploration ability of the later iteration, we define a new control parameter B. The parameter B is calculated as follows:


The control parameters: (a) the range of A, the forward-slash (/) means |A| ≥ 1, and the backward-slash(\) means |A| < 1 (b) the range of B, the forward-slash (/) means B ≥ 0, and the backward-slash(\) means B < 0.
So B is a random value in the interval [−2, a]. B can take positive or negative values by the random number r during the whole search process. The range of B is shown in Figure 5(b). A random search agent is chosen when B ≥ 0(exploration phase), while the best solution is selected when B < 0 for updating the position of the search agents (exploitation phase). According to Figure 5(b), the search agents still have the opportunity to explore in the later iteration. The exploration decreases linearly with iterative t, which is advantageous to algorithm convergence (see steps 8 and 12 in Figure 4).
Modified encircling prey
In the encircling prey section of WOA, the search agents update their positions toward the best search agent. It is easy to make the algorithm trap into the local solution and lead to premature convergence. Hence, to enable all agents to get rid of the stagnation easily, a modified encircling prey is proposed as follows:

Candidate solution selection
In WOA, the newly generated candidate solutions are accepted without selection. This may cause the rebound of new search agents, which will reduce the convergence speed and the convergence accuracy. To decide whether or not it should become a member of generation t + 1, a trial vector


Performance test for MWOA
In this section, we compare the proposed MWOA with WOA based on the following 34 benchmark functions.
Benchmark functions
In this paper, MWOA is used to estimate the parameters of the SRGM. The parameters to be estimated are less than 10 in this paper. Therefore, the benchmark functions are chosen whose dimensions are not more than 10. A total of 34 benchmark functions are chosen from Doğan and Ölmez 33 and they are only briefly described in Table 1. A more detailed description of these functions can be found in Doğan and Ölmez 33 where the functions include many different types of problems, such as unimodal, multimodal, regular, irregular, separable, non-separable, and multidimensional.
Benchmark functions used in experiments.
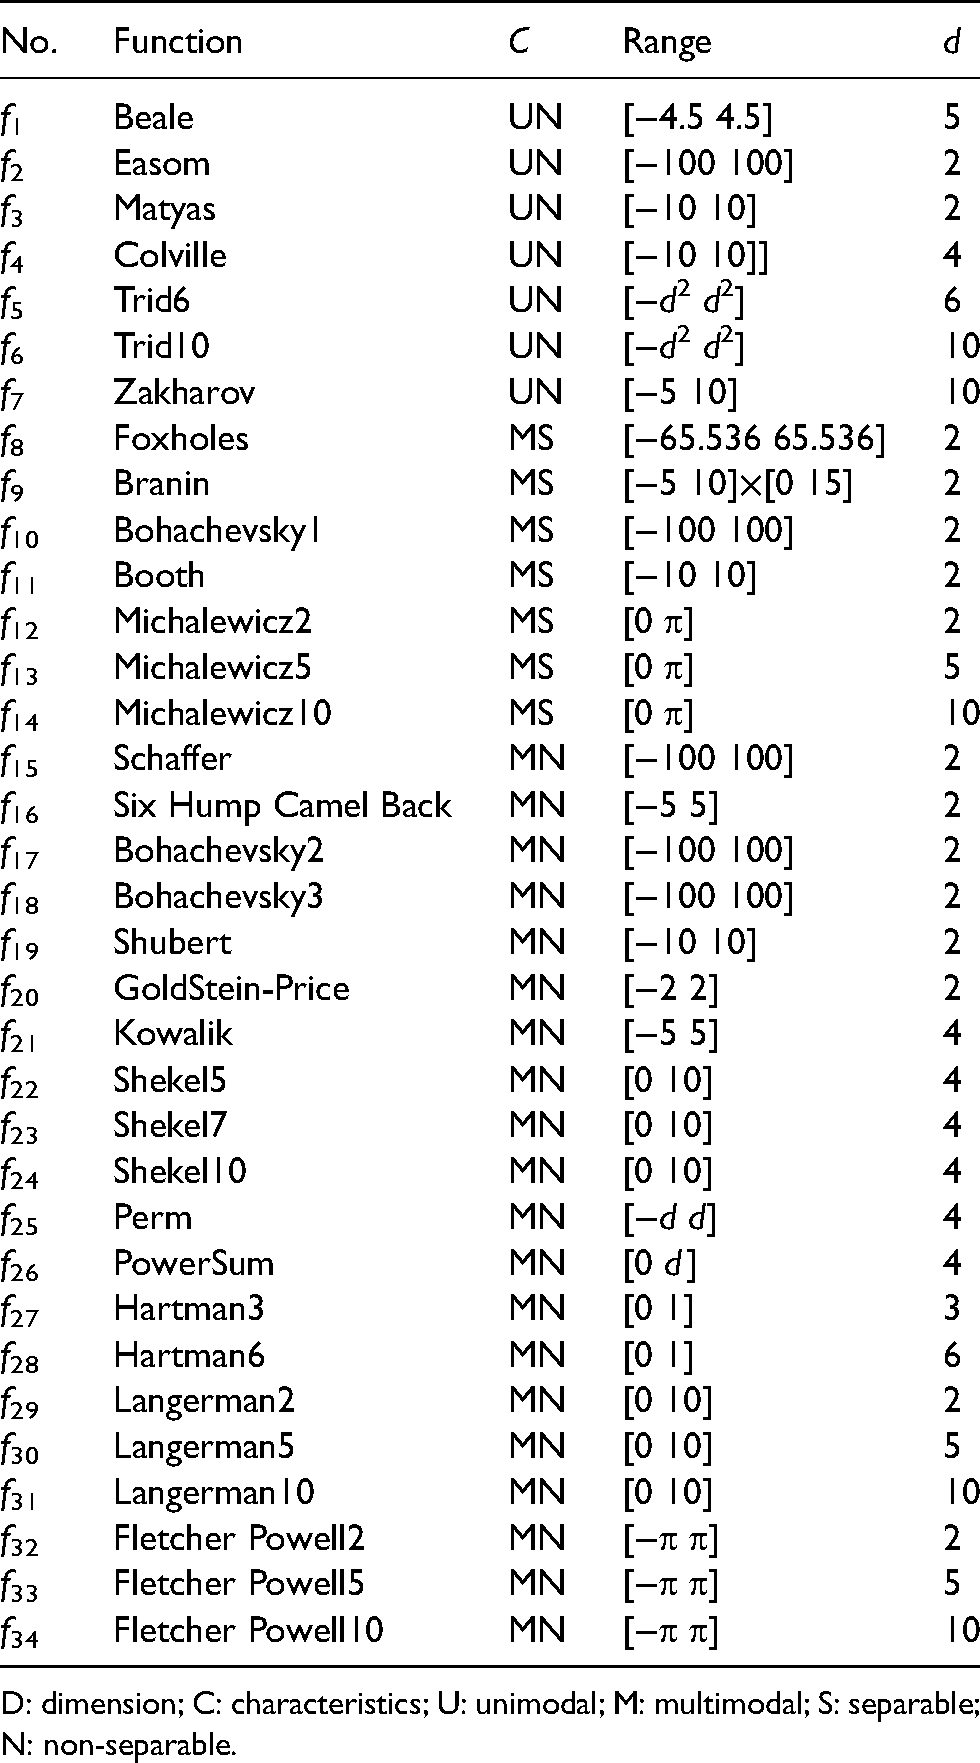
D: dimension; C: characteristics; U: unimodal; M: multimodal; S: separable; N: non-separable.
Algorithm settings
As mentioned before in the previous section, WOA and MWOA are parameter-free algorithms. There are no additional parameters except some common parameters of swarm intelligence algorithm, such as population size and maximum iteration number. For all the algorithms, a population size and maximum iteration number equal to 30 and 500 have been utilized. All results reported are obtained based on 30 independent runs. For clarity, the results of the best algorithms are marked in boldface.
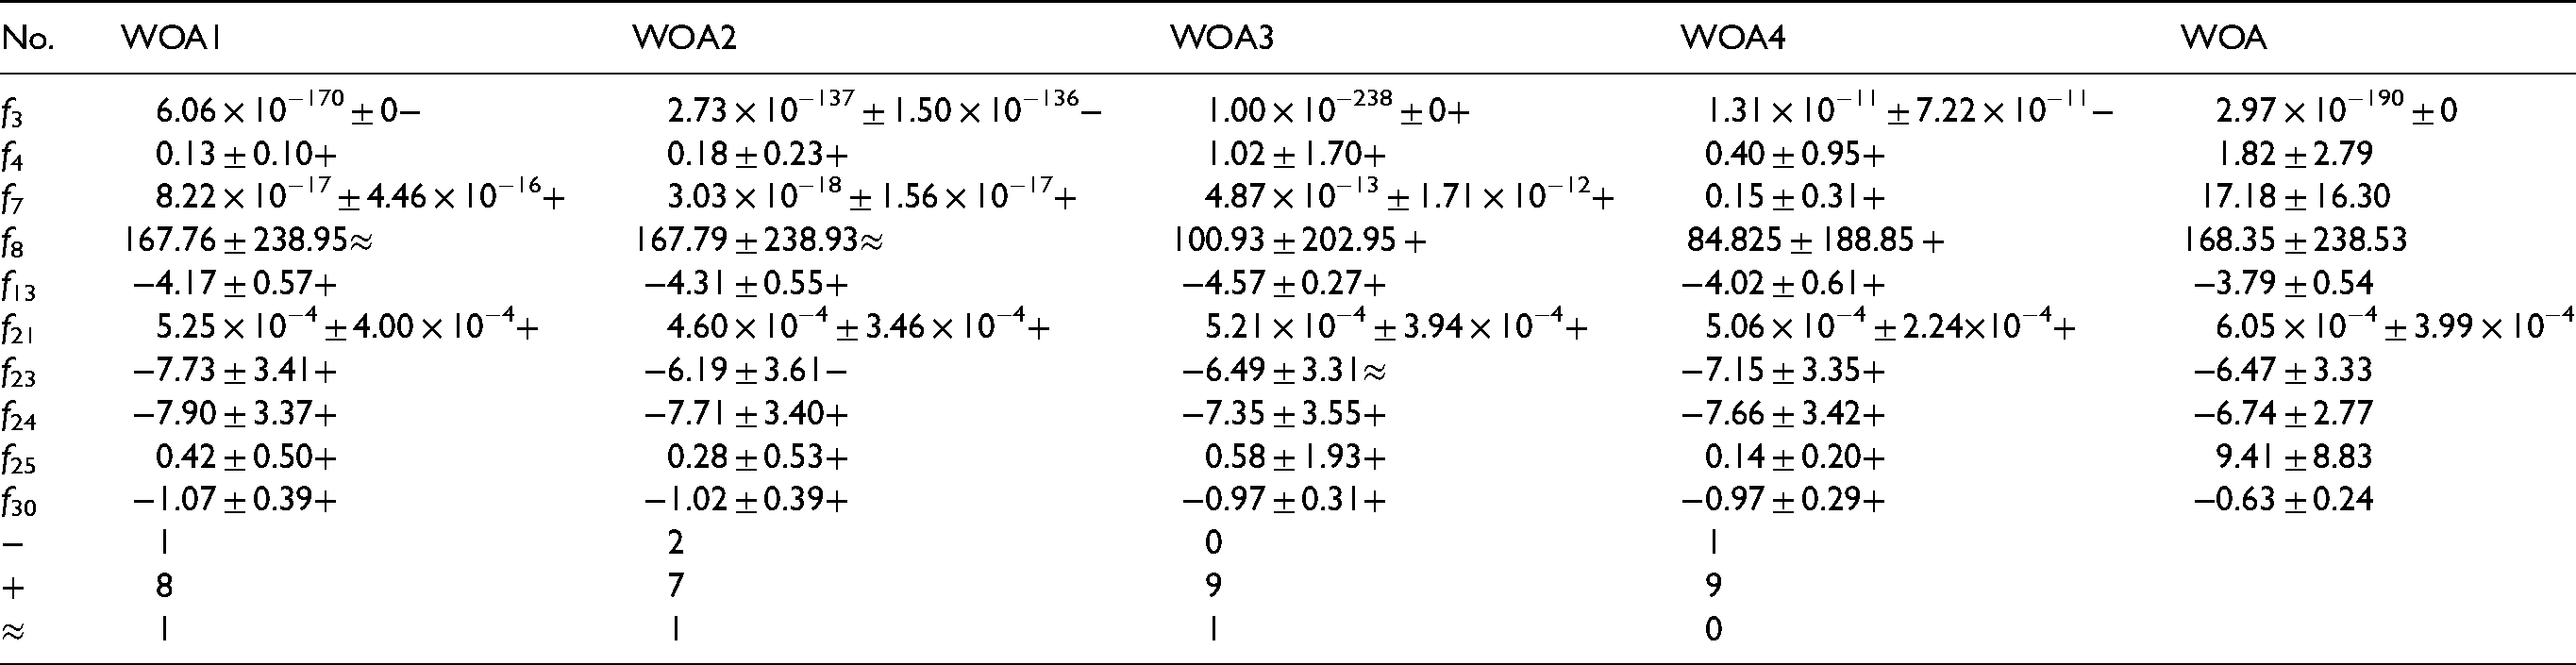
Test for four improved WOA algorithms
For the basic WOA, there are four improvements to improve the method for enhancing search performance and search quality. The first is “choice on dimension,” named WOA1.The second is “exploration control,” named WOA2. The third is “modified encircling prey,” named WOA3. The last is “candidate solution selection,” named WOA4. We tested the four methods with p = 0.5, n = 30, and MaxIter = 500 on 10 functions. To compare mean WOA1, WOA2, WOA3, WOA4 and WOA, Wilcoxon rank-sum tests (5% significance level) are performed. The signs −, +, and =, respectively, indicate that the comparison algorithm is inferior, superior, and equivalent to the basic WOA. The experiment results are listed in Table 2. From Table 2, the performance of the basic WOA algorithm is improved obviously by the four methods.
Comparison between whale optimization algorithm (WOA) and its improved WOAs.
Effect of different p value
A probability p was used to switch between the shrinking encircling mechanism and the spiral model to update the position of whales in WOA and MWOA. The different probability p will have an impact on the search performance of MWOA. In this section, we tested MWOA with p = {0.1, 0.3, 0.5, 0.7, 0.9}, n = 30, and MaxIter = 500 on 10 functions. The experiment results are listed in Table 3. From Table 3, it is found that MWOA can obtain better values when p = 0.9. Therefore, in this paper, the probability p is set to 0.9.
Comparison between different p values on 10 problems.

Test results
The overall performances of the algorithms are studied for a constant number of iterations. After a certain number of iterations, the algorithms are evaluated according to the mean, standard deviation and best fitness values found for each benchmark function. The statistical result is reported in Table 4. The h values are the results of Wilcoxon rank-sum tests (5% significance level). From Table 4, it is found that the best values of MWOA can achieve or approach the optimal solutions of all 34 benchmark functions. The best values of MWOA are less than those of WOA for functions f1, f2, f4, f 6, f 7, f 11, f 13, f 14, f 18, f 21, f 22, f 23, f 24,f 25, f26, f 28,f31, f32, f33, f34, and equal or equivalent to those of WOA for the rest of the functions except f3. The mean values of MWOA are less than or equal to those of WOA for 33 benchmark functions, and greater than those of WOA only for functions f3. General speaking, it can be concluded that as a whole the proposed MWOA significantly improves the basic WOA.
Comparison between WOA and MWOA.

WOA: whale optimization algorithm; MWOA: modified whale optimization algorithm.
In addition, we also compared the performance of our algorithm with that of PSO, 34 ABC, 35 and DE. 36 The parameter values were set as follows: c1 = c2 = 2 for PSO, F = 0.5, and CR = 0.9 for DE, limit = 20 for ABC. Experiments were executed for the same population sizes and switch probabilities established in previous tests. All experiments were run 30 times, independently. The mean error and its deviation were under investigation. A summary of obtained results is provided in Table 5. To compare the performance of different algorithms, the results are labeled by the “−,” “+”, and “≈.” The “−” denotes our algorithm is better than other algorithms. And the “+” and “≈” denote our algorithm is inferior to, equal to other algorithms. This comparison is between PSO, ABC, and DE with our algorithm MWOA. In Table 5, we can find that MWOA can perform better than other algorithms in most of the cases. Among these algorithms used for comparison, PSO is weaker in performance. It cannot provide better solution compared with MWOA algorithm. For the unimodal function f1–f7, MWOA can obtain the six better solutions than other algorithms except f3. For f3, DE can give the better solution than other algorithms. For multimodal functions f8–f34 with many local minima, the final results are more important because of these functions can reflect the algorithm's ability to escape from the poor local optima and obtain the near-global optimum. MWOA provides better solutions for some functions except f13, f14, f 22, f24, f25, f28, f 32, and f34. For these eight functions, the optimal solution can be obtained by ABC and DE. All in all, it can be observed that MWOA is inferior to, equal to, superior to compared algorithm in 11, 31, and 60 cases, respectively, out of the 102 cases. In general, the performance of MWOA is highly competitive with other algorithms in solving these problems.
Comparison between MWOA and other methods.

PSO: particle swarm optimization; ABC: artificial bee colony; DE: differential evolution; MWOA: modified whale optimization algorithm.
Experimental evaluation
To develop our new technique for solving the parameter estimation problem of SRGM, we used WOA and the proposed MWOA. Our objective is to estimate the parameters such that the error difference, between the actual fault and the estimated faults based on the parameter estimated using WOA or MWOA, is minimal. RMSE criterion is used to measure the performance. It is just the square root of the mean square error as shown in equation (24) given below:
Test/debug data sets
Three real measured test/debug data sets are applied in our proposed approaches. The first data set of 109 measurements was presented in the work by Jeet et al. and Alaa and Abdel-Raouf.17,25 The test/debug data was measured day by day, and includes the reading of the measured faults (xk), the accumulated faults (yk), and the number of test workers (twk) involved in the testing process. The second data set of 111 measurements presented in the work by Alaa and Abdel-Raouf 25 is used for our experiments. The third data set has 46 measurements and was presented in the work by Zheng et al. . 27 The number of measurements collected during the testing process is small. This represents a difficulty for traditional parameter estimation techniques.
Model parameter estimation
Our experiments explore the use of WOA and MWOA methods to estimate the parameters of three software projects using three known SRGMs (EXPM, POWM, and DSSM) and an MSM in this section. In our case, the range of the parameters for EXPM, POWM, and DSSM models are set as follows: β0ɛ[0,2000], β1ɛ[0,1]. The range of the parameters for MSM: β1 ɛ [0,1] for all data sets, β0, β2, β3 ɛ [−100,100] for data1, β0, β2, β3 ɛ [−300,300] for data2, and β0, β3 ɛ [500,1000], β2 ɛ [−10,10] for data3. For both WOA and MWOA, a population size and maximum iteration number equal to 40 and 1000 have been utilized. The result reported in Table 6 is obtained based on 30 independent runs. The best estimated parameters for the SRGM are given with the model equations in Tables 6–8. The convergence process was recorded by keeping an eye on the best individual after each generation.
The results of WOA and MWOA.

WOA: whale optimization algorithm; MWOA: modified whale optimization algorithm; POWM: power model; DSSM: delayed S-shaped model; MSM: modified sigmoid model; EXPM: exponential model; RMSE: square root of the mean square error; SRGM: software reliability growth model.
SRGMs with parameter estimated using MWOA—109 measurements.

POWM: power model; DSSM: delayed S-shaped model; MSM: modified sigmoid model; EXPM: exponential model; SRGM: software reliability growth model; MWOA: modified whale optimization algorithm.
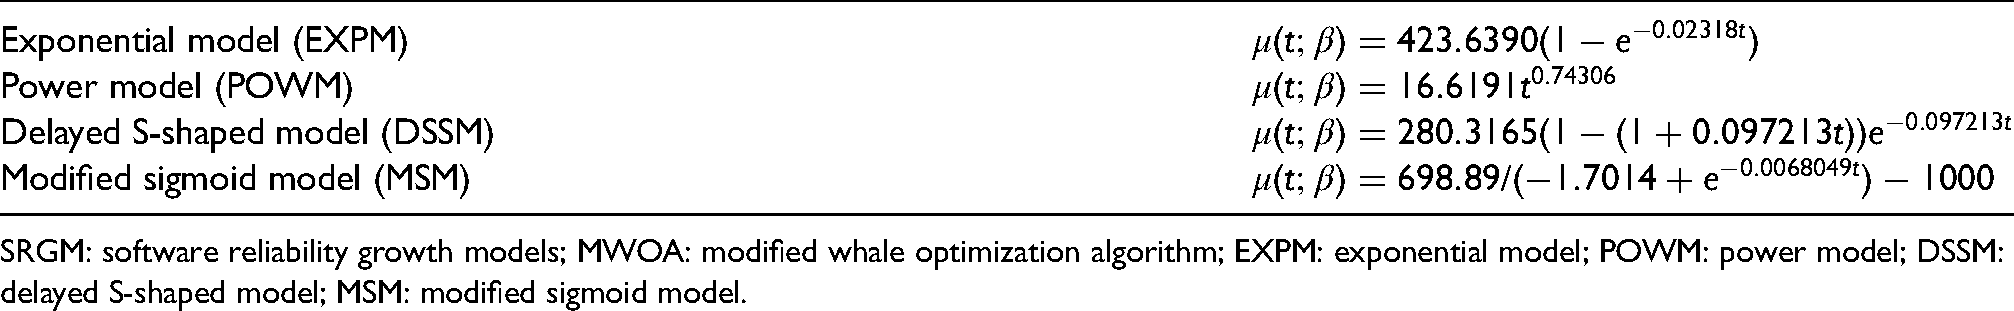
SRGMs with parameter estimated using MWOA—111 measurements.

POWM: power model; DSSM: delayed S-shaped model; MSM: modified sigmoid model; EXPM: exponential model; SRGM: software reliability growth model; MWOA: modified whale optimization algorithm.
From Table 6, it is found that the best RMSEs of MWOA are slightly less than those of WOA on data1 + EXPM, data1 + POWM, data2 + POWM, and data2 + MSM. They are same in other instances. The average RMSEs of MWOA are less than those of WOA in all instances. That shows the average optimization ability of MWOA is better than that of WOA. The standard deviations of MWOA are small in all instances. That shows MWOA is robust, and MWOA can overcome WOA's shortcoming that is easy to relapse into local best and premature convergence.
In Figures 6, 7 and 8, we show the best so far convergence curves of the evolutionary process obtained by MWOA for the four developed models EXPM, POWN, DSSM, and MSM on three data sets. The actual and accumulated faults (failures) curves for the four developed models are shown in Figures 9, 10, and 11.

Best so far convergence curve for the modified whale optimization algorithm (MWOA) using single models on 109 measurements.

Best so far convergence curve for the modified whale optimization algorithm (MWOA) using single models on 111 measurements.

Best so far convergence curve for the modified whale optimization algorithm (MWOA) using single models on 46 measurements.

Actual and estimated failures for the modified whale optimization algorithm (MWOA) using single models on 109 measurements.
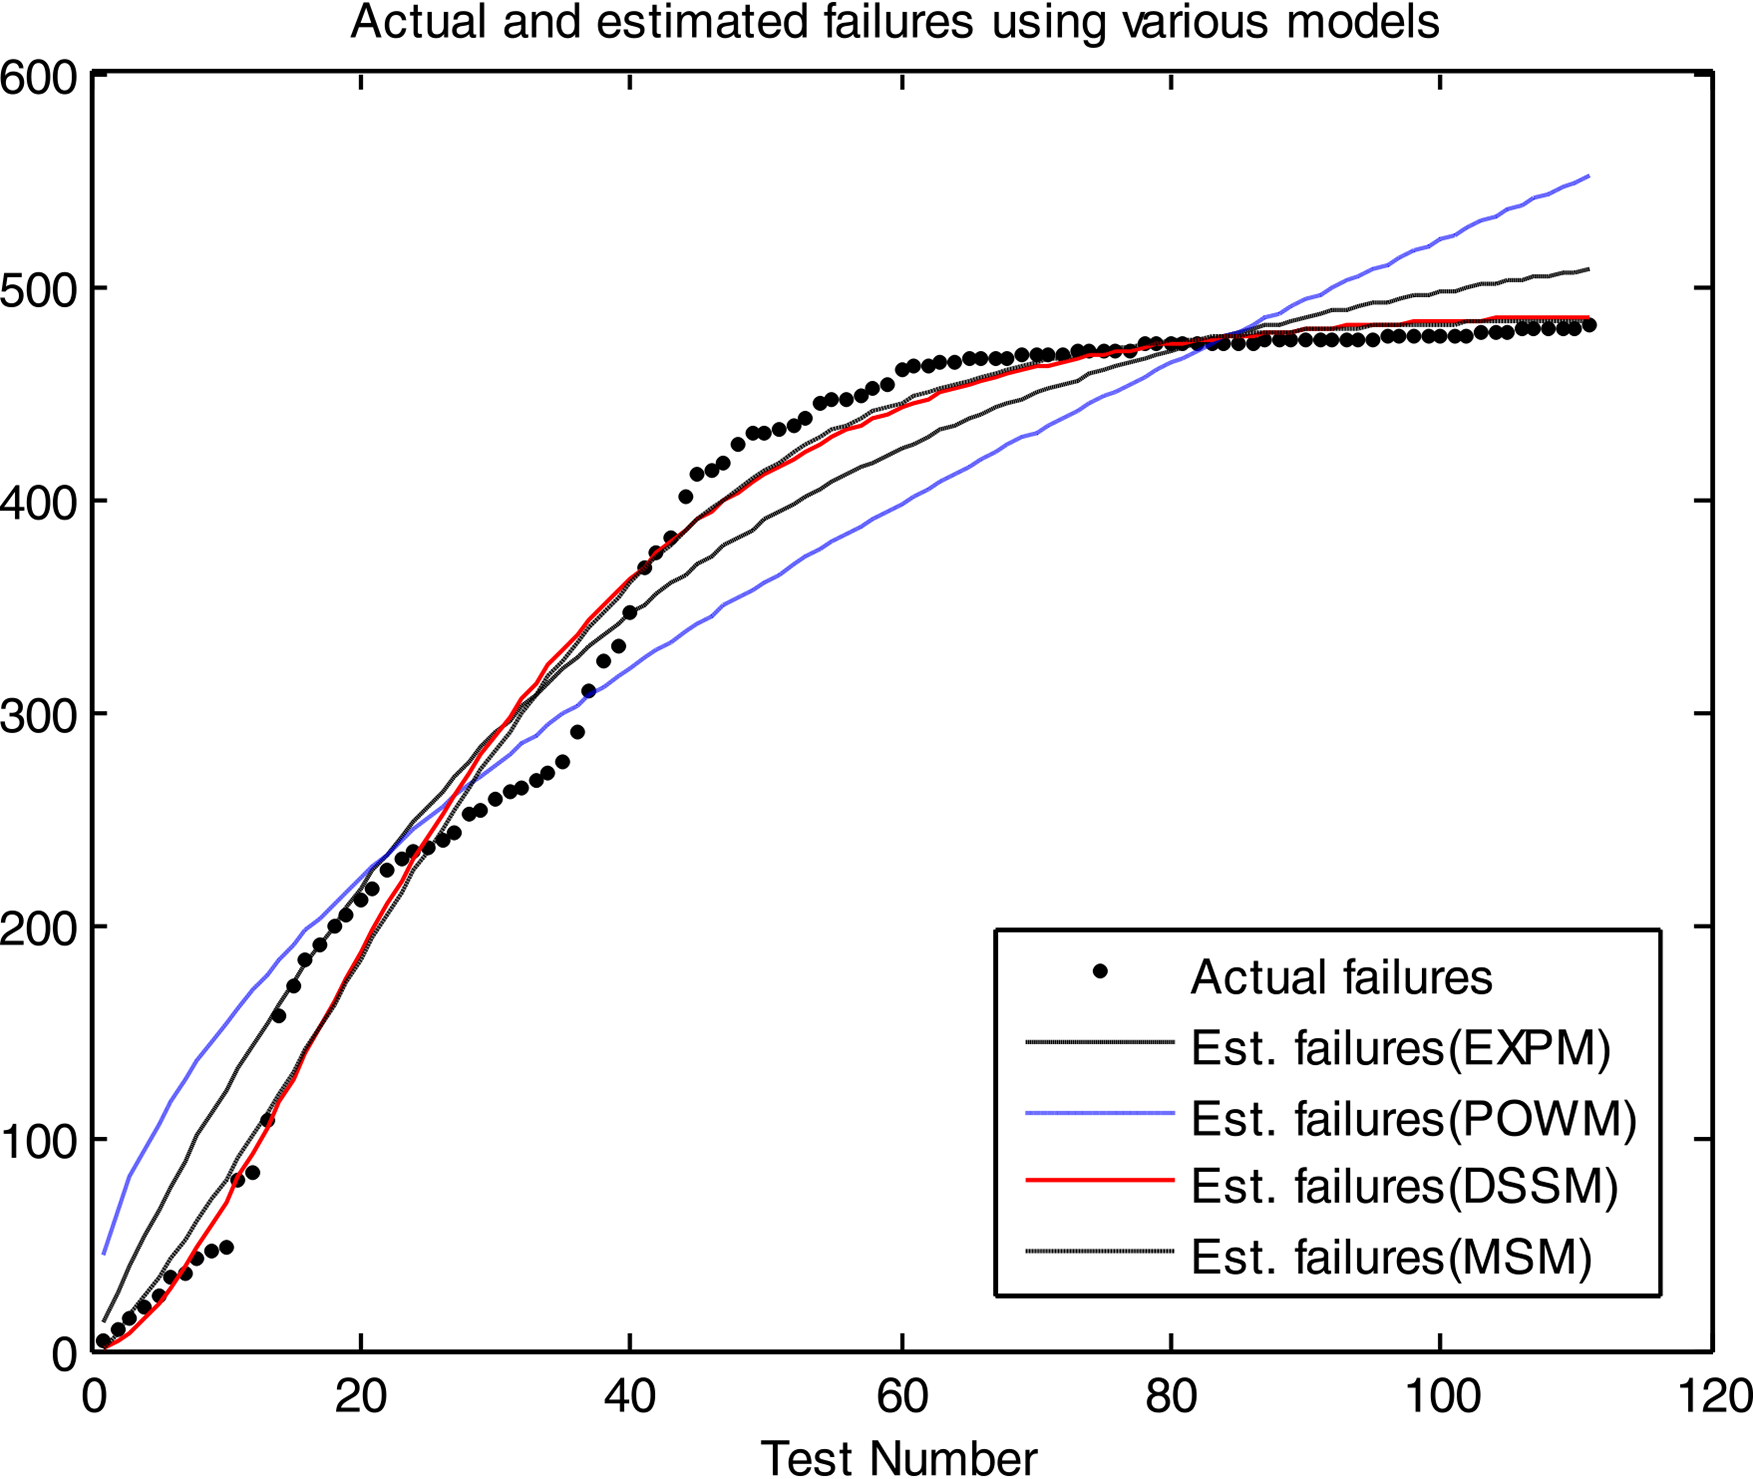
Actual and estimated failures for the modified whale optimization algorithm (MWOA) using single models on 111 measurements.

Actual and estimated failures for the modified whale optimization algorithm (MWOA) using single models on 46 measurements.
For three data sets, we find that the MSM model is able to provide the best results using MWOA tuned parameters. The model error is the minimum compared to other proposed models. That shows MSM is a good SRGM and can fit data well.
The results between MWOA and PSO, 20 dichotomous artificial bee colony (DABC), 22 and GWO 23 are shown in Tables 9 and 10. The RMSEs of MWOA and GWO are obviously less than those of PSO and DABC. Compared to other algorithms, MWOA obtains the best results.
SRGMs with parameter estimated using MWOA—46 measurements.
SRGM: software reliability growth models; MWOA: modified whale optimization algorithm; EXPM: exponential model; POWM: power model; DSSM: delayed S-shaped model; MSM: modified sigmoid model.
The best RMSEs of MWOA and other algorithms.

MWOA: modified whale optimization algorithm; RMSE: square root of the mean square error; EXPM: exponential model; POWM: power model; DSSM: delayed S-shaped model.
Conclusion and future work
In this paper, we explored the use of WOA to estimate the parameters of SRGMs. WOA is a new swarm intelligence optimization algorithm. This algorithm is not perfect enough. Based on the analysis of WOA, we point out the disadvantages of WOA, and propose an MWOA algorithm. Several benchmark functions are tested and the experimental results show that the proposed MWOA significantly improves the basic WOA. We also compared the performance of our algorithm with that of PSO, ABC, and DE; the performance of MWOA is also highly competitive with other algorithms.
We use MWOA to estimate the parameters of three known SRGMs (i.e. EXPM, POWM, and S-shaped model). Experimental results show that MWOA outperforms WOA, GWO, PSO, and DABC. MWOA gets minimum RMSEs.
An SRGM (MSM) is proposed in this paper. MWOA is used to estimate MSMs’ parameters on three data sets. Experimental results show that the fitting accuracy of the MSM model is better than that of three known models. The MSM model can provide a better estimate of the software faults.
For future work, we plan to explore using MWOA in developing a multi-stage hybrid structure growth model which can provide an advanced relationship between μ(t;β) and λ(t;β) to better model the software reliability prediction process. MWOA can build a multi-stage hybrid structure with a set of parameters which can provide an accurate estimate of the software faults.
Footnotes
Declaration of conflicting interests
The authors declared no potential conflicts of interest with respect to the research, authorship, and/or publication of this article.
Funding
The authors disclosed receipt of the following financial support for the research, authorship, and/or publication of this article: This work was supported by the National Natural Science Foundation of China (Grant no. 61772269), and the key project of Anhui natural science research (Grant no. KJ2016A514).