
Abstract
We propose an improved image matching algorithm that combines the minimum feature value algorithm to extract feature points and the direction gradient histogram to calculate the description vector. This algorithm is oriented to RFID multi-tag identification and distribution optimization in the actual scenario, and the traditional SURF algorithm has the problems of low matching accuracy and high complexity in multi-tag matching. This algorithm effectively improves the positioning accuracy of the RFID multi-tag positioning system. The experimental results show that the matching success rate of the improved algorithm in this paper is 87.4%, which is 50% higher than the SURF algorithm. Not only the matching accuracy is greatly improved, but the running speed is also increased by 48%. The algorithm in this paper has high matching accuracy and real-time performance.It provides an effective way for RFID multi-tag real-time fast matching and precise positioning.
Introduction
As radio frequency identification (RFID) technology is widely used in many fields, the research on multi-tag identification and distribution optimization is gradually deepening.1,2 Lyu et al. proposed a global/local attention method that recognizes multi-tag images from coarse to fine by imitating the way humans observe images. 3 Yu et al. proposed a multi-tag optimization method based on image analysis and particle swarm optimization (PSO) neural network. PSO neural network is used to train and predict multi-tag distribution under the maximum reading distance. 4
In the field of radio frequency identification, the distribution of multiple tags has an important impact on identification performance. The premise of studying the optimization of multi-label distribution is to accurately grasp the position of the multi-label. 5 In this paper, image matching is used to improve the positioning accuracy of RFID multi-tags and achieve the ultimate goal of improving recognition performance. When we study the problem of multi-tag image matching, feature matching is the key. Feature matching is to find the distance between similar feature points between two images, and the nearest neighbor distance ratio method is the most commonly used method. Generally speaking, target feature extraction and matching mainly include SIFT (Scale Invariant Feature Transform), SURF (Speeded Up Robust Feature), ORB (Oriented FAST and Rotated BRIEF) and other methods. These three algorithms have their own advantages and disadvantages. The SURF algorithm is more efficient than other algorithms in processing image matching due to its small amount of calculation, fast calculation speed, and accurate parameter estimation. It is currently the most popular in the field of image matching algorithm.6–9 Many scholars have made many improvements to the SURF algorithm. Sharofiddin et al. proposed an image registration method based on the optimized SURF algorithm. The article extracts image features through the SURF algorithm and uses the RANSAC algorithm to filter the matching points, but the matching time is relatively long. 10 Zhang et al. proposed an image registration method based on the optimized SURF algorithm, but this article needs to be improved in terms of accuracy and real-time performance. 11
Aiming at the problem of multi-tag matching, We proposed an improved algorithm for the actual scenario of RFID multi-tag identification and distribution optimization. The innovation of this paper is to combine the minimum feature value algorithm and the HOG algorithm to match multi-tag RFID images, which can not only improve the extraction efficiency of feature points, but also reduce the time of feature extraction and matching. At the same time, it improves the positioning accuracy of the RFID multi-tag positioning system. Through simulation experiments, we can find that the algorithm has a multi-tag matching success rate of 87.4%, which is 50% higher than the SURF algorithm, and the running speed is also increased by 48%. Since the HOG algorithm operates on the local unit of the image, it can maintain good invariance to the geometric and optical deformation of the image.
Algorithm design
Algorithm flowchart
The image matching process of the improved algorithm proposed in this paper is shown in Figure 1. It is mainly divided into four stages: reading the picture and graying, corner detection by minimum eigenvalue algorithm, calculation of description vector by HOG algorithm, and creation matching pairs.

Algorithm flow chart.
Algorithm principle
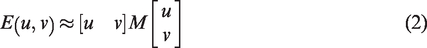
After reading the picture and graying it, the algorithm first creates a

Among them,
Among them:

Among them,
The algorithm defines a score function, which determines whether a window contains a corner as equation (4):

In the formula,
After extracting the feature points, the algorithm calculates the gradient of the abscissa and ordinate directions of the image, and calculates the gradient direction value of each pixel position accordingly. The gradient of the pixels in the image is:

In equation (5),


With the above calculation formula, the algorithm divides the image into several image blocks, and each block is divided into several cells. Every 8 × 8 pixels form a cell, and every 2 × 2 cells form a block.The gradient histogram is constructed in the unit of cell to form a bin-dimensional vector, the gradient histogram is normalized within the block, and the vectors corresponding to all blocks are arranged in spatial order to form the final feature descriptor.
Finally, when establishing a match, the algorithm determines the matching degree by calculating the Euclidean distance between two feature points. The shorter the distance, the better the match.
Experiments
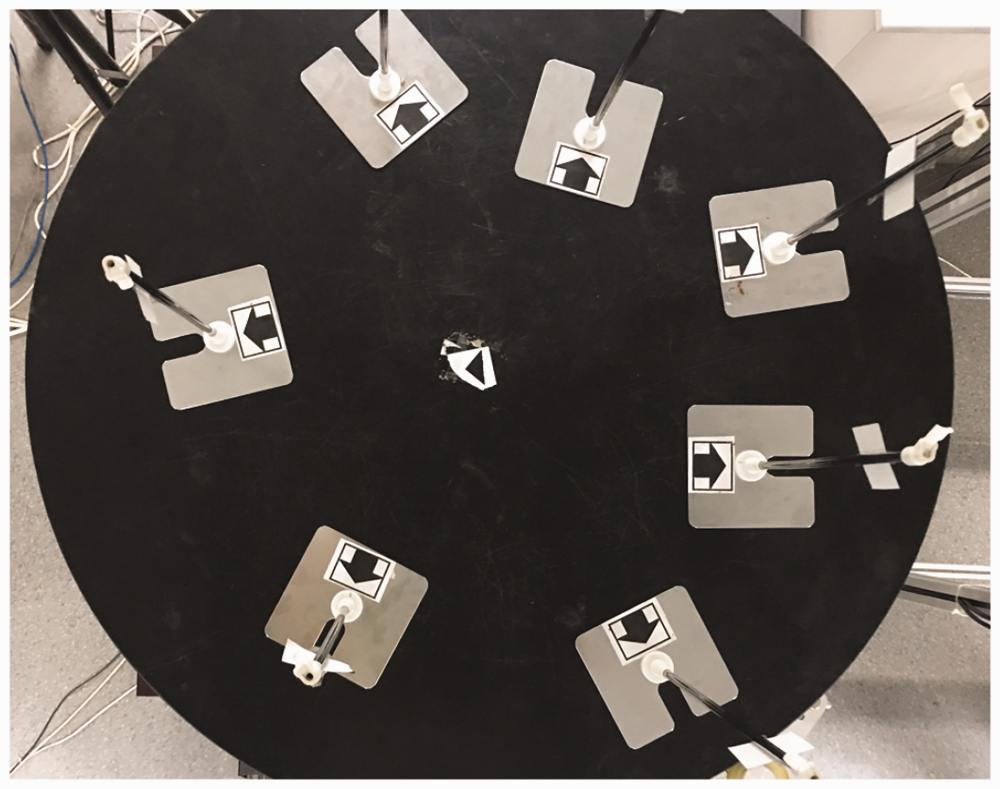
In order to verify the accuracy of the improved algorithm, the simulation experiment was implemented on a computer with an Intel(R) Core(TM) i5-9300H CPU2.4 GHz, Window 10 operating system, and MATLABR2018a environment. First, the images of this experiment are collected in the RFID dynamic test system. 12 The system is mainly composed of antenna, CCD camera, control motor, RFID reader, conveyor belt and control computer. Figure 2 shows the structure diagram of the RFID multi-tag dynamic test system, and Figure 3 shows the physical diagram of the RFID multi-tag dynamic test system.

RFID multi-tag dynamic test system structure diagram.

Physical map of RFID multi-tag positioning system.
This experiment analyzes and compares the algorithm in this paper with the SURF algorithm in terms of operating speed and matching accuracy. In order to verify the robustness of the algorithm in this paper, the images selected in the experiment are square RFID multi-tag image, rectangular RFID tag image, and circular RFID tag image.
The square RFID multi-tag image matching results are shown in Figures 4 to 6. The image matching results of the second type of rectangular RFID tags are shown in Figures 7 and 8 below. The image matching result of the third round RFID tag is shown in Figure 9 below.

Square RFID multi-tag image matching results in first group. (a) SURF matching results and (b) matching results in this paper.

Square RFID multi-tag image matching results in second group. (a) SURF matching results and (b) matching results in this paper.

Square RFID multi-tag image matching results in third group. (a) SURF matching results and (b) matching results in this paper.

Rectangular RFID tag image matching results in first group. (a) SURF matching results and (b) matching results in this paper.

Rectangular RFID tag image matching results in second group. (a) SURF matching results and (b) matching results in this paper.

Image matching result of round RFID tag. (a) SURF matching results and (b) matching results in this paper.
For square RFID multi-tag images, the running time, the number of feature points, the number of successful matches and the matching rate of the two algorithms are shown in Table 1 below. In the Table 1, the matching rate is shown in formula (8):

Image test results of square RFID tags.

In the formula, A represents the matching rate, N represents the number of matches, and F represents the number of feature points.
It can be seen from Table 1 that, the running speed of the algorithm in this paper is 54.8% higher than that of the SURF algorithm. The average matching rate of this algorithm is 92.0%, which is higher than the 43.9% of SURF algorithm.
For different other label images, the running time, the number of feature points,the number of the number of successful matches and the matching rate extracted by the two algorithms are shown in Tables 2 and 3. It can be seen from Tables 2 and 3 that for rectangular and circular RFID tag images, the running speed of the algorithm in this paper is 57.3% higher than that of the SURF algorithm. The average matching rate of this algorithm is 82.8%, which is higher than the 43.3% of SURF algorithm.
Image test results of rectangular RFID tags.

Image test results of round RFID tags.

In order to verify the time and accuracy of the image registration method of this algorithm, Table 4 shows the comparison results of the three algorithms. For specific data, see https://blog.csdn.net/weixin_42064706/article/details/114700977
Comparison of tag image test results of different algorithms.

Synthesizing Tables 1 to 4, it shows that compared with SURF algorithm and literature algorithm,13,14 the algorithm in this paper has better matching effect and shorter time-consuming.
Localization
According to the same method in the previous section, we performed image matching processing on the multi-tag images acquired by the vertical CCD camera. The photographed vertical RFID multi-tag image is shown in Figure 10. The multi-tag image obtained in the horizontal direction is shown in Figure 4. After processing the multi-tag image through image matching, we obtained the three-dimensional coordinates of the multi-tag from the horizontal and vertical directions.
Multi-tag image in vertical direction.
According to the literature, 15 we modeled the relationship between the three-dimensional coordinates on the multi-tag image and the three-dimensional coordinates in the actual space. Finally, we got the position of the multi-tag in the world coordinate system. The actual three-dimensional coordinates refer to the position in the multi-tag world coordinate system, which is obtained by testing with a handheld laser rangefinder. The comparative analysis between the measured three-dimensional coordinates and the actual three-dimensional coordinates is shown in Table 5.
RFID multi-tag positioning results of different algorithms.
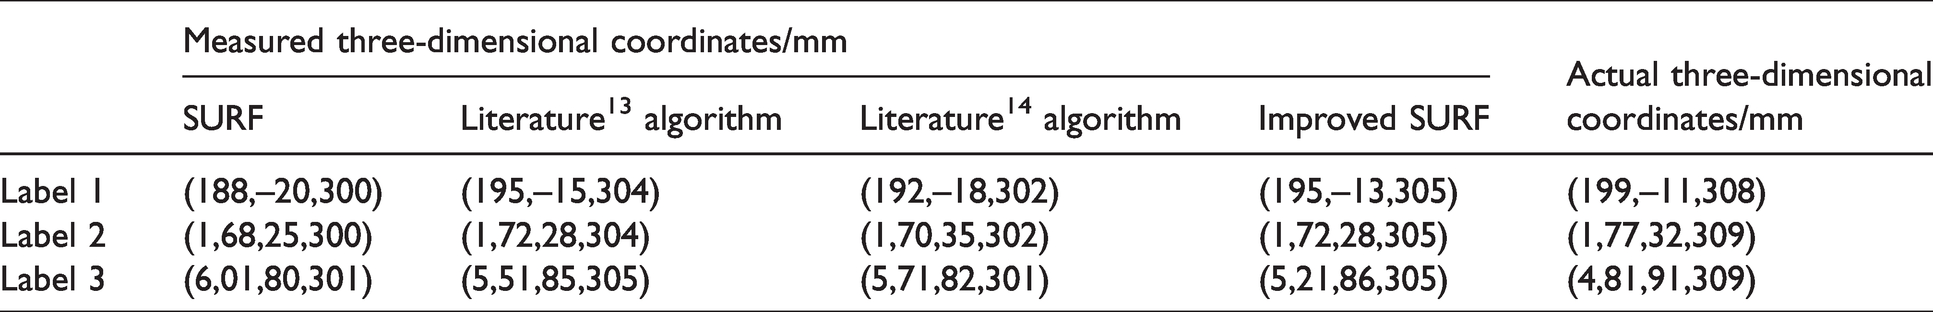
It can be seen from Table 5 that the error of the algorithm in this paper is within 6 mm, which is closer to the actual value. It is better than the comparison algorithm and the algorithm in literature. 15 The article achieves the purpose of improving the positioning accuracy of the RFID multi-tag test system.
Conclusions
Aiming at the feature point pairing of RFID tags, this paper proposes a fast RFID image matching algorithm for multi-tag identification and distribution optimization. This paper uses the smallest feature value corner detection to extract more effective feature points, and then uses the gradient or edge direction density distribution to describe the appearance and shape of the target in the image to obtain the feature descriptor, and finally obtain the tag matching pair. Experimental results show that the improved algorithm proposed in this paper is simpler and more effective than the SURF algorithm. It not only increases the number of feature points, but also increases the successful matching rate by 50% and shortens the matching time by 48%. This algorithm effectively improves the positioning accuracy of the RFID multi-tag positioning system.The algorithm in this paper is accurate and real-time, and provides an effective way for multi-tag real-time fast matching and precise positioning.
Footnotes
Declaration of Conflicting Interests
The author(s) declared no potential conflicts of interest with respect to the research, authorship, and/or publication of this article
Funding
The author(s) disclosed receipt of the following financial support for the research, authorship, and/or publication of this article: This work was supported by National Natural Science Foundation of China (NNSFC) (61771240), the Fund Project of Jiangsu Engineering Laboratory for Lake Environment Remote Sensing Technologies (JSLERS-2018–003), China Postdoctoral Science Foundation (2016T90452), and Six Talent Peaks Project in Jiangsu Province of China (XYDXX-058).