
Abstract
Many proteomics studies have been devoted to investigate the gel-based methods for separation and fractionation of complex protein mixture extracted from tissues, cells, and other biological specimens. In order to fractionate, identify, and quantify proteins when coupled with mass spectrometric identification or other immunological tests, accurate image alignment method for possible significant protein diversity under different experimental conditions is of high demand. Although lots of protein spot matching and alignment methods have been proposed for two-dimensional gel electrophoresis image, very few methods work well because of dynamic appearance changes and structure changes for gel electrophoresis images. To address these difficulties, we propose a hierarchical transformation-guided registration method to not only align the global shape changes by affine transformation but also alleviate the local structure changes between two gel electrophoresis images by no-rigid deformation registration. The non-rigid registration method is used to obtain the local displacement with shape changes. Since such initial affine transformation can alleviate the global transformation difference between two images, it becomes efficient to use non-rigid registration to refine the registration result. The visualized and quantified experimental results show that our method is more accurate and robust to identify the variability between individual proteins.
Keywords
Introduction
Two-dimensional polyacrylamide gel electrophoresis (2DE) is considered as a powerful tool for separation and fractionation of complex protein mixtures from tissues, cells, or other biological samples. Many proteomics and protein studies are dedicated to understand 2DE development for further analysis of the differentially regulated protein spots using mass spectrometry and western blotting. It provides the first step for further analysis of the differentially regulated protein spots using mass spectrometry and western blotting to disclose both physiological mechanisms and proteins associated with clinical pathologies that is used to discover biomarkers in many cases.1–3
In order to fractionate, identify, and quantify across individual proteins, 2DE image registration is of great importance to align the geometric distortion and to find the correct matched spots to identify the differential protein. The image registration methods for 2DE images can be classified into three main categories: (1) landmark-based method, (2) intensity-based method, and (3) combination of landmark-based method and the intensity-based method.
The landmark-based method is used to detect the landmarks (e.g. spot, scale-invariant feature transform [SIFT], and Harris) as feature points and then finds the correspondences for estimating the transformation between two images.4–6 The landmark-based method can be utilized to make up the non-uniform distribution of the gel spots from different gels. Rogers and Graham 4 proposed an iterative method to match the 2D points and combine the transform estimation. However, these methods need to extract the corresponding spots that are computationally expensive and hard to guarantee accuracy. And generally, the landmark is chosen by the transformation estimation. Also, the optimal choice of the spots for guiding the matching remains an open question that is not necessarily in conformity with the physical reality. 7
Intensity-based method uses some criterions (e.g. sum of squared difference, mutual information, and cross-correlation) to drive the registration.8–11 The software Z3 using intensity-based frame is the first system for 2D gel image registration. 10 These methods can make full use of pixel information. But it is also computationally expensive.
The third frame is the landmark combing with the intensity information.8,12 The extracted landmark constraints can compensate for appearance changes between images. And the intensity information constraints can focus on the shape changes between the spots in two images. However, the inaccuracy of the landmark and the insufficient corresponding pairs lead to deteriorate the performance for 2D gel image registration.
Although lots of methods have been proposed, very few works well for gel comparisons due to complex physical and chemical processes. The locations of proteins generally vary in different images. Figure 1 shows the two pairs of 2D gel images. (1) The red contour of ventricle region in the top images denotes the different shapes in each pair of images. (2) The location of protein spots is slightly different in images (c) and (g). And the image in (c) is the directly aligned image from (a) and (b). The image in (g) is the directly aligned image from (e) and (f). (3) It shows that the intensity range is different from the histograms (d) and (h). Not only whole gel expands but also protein spot shapes as well as the image intensities slight change in the local regions. Hence, image registration algorithm is required to have the capacity to deal with the challenge of both global and local deformation of shape and intensity for 2DE image.

Examples showing the differences between gel electrophoresis images. The red contour of ventricle region in the top images denotes the different shapes in each pair of images. The second row is the difference of location and intensity range. There are two image pairs (a) and (b), (e) and (f). The location of protein spots is slightly different in image (c) and (g). And the (c) is the directly aligned image from (a) and (b). The (g) is the directly aligned image from (e) and (f). The intensity range is different from the histogram (d) and (h), and (d) is for image pairs (a) and (b), (h) is for image pairs (e) and (f).
To address the above difficulties, we propose a hierarchical transformation-guided registration framework to accurately align the two images. Since the transformation not only includes the global affine transformation but also local deformation, we estimate two mappings in a hybrid manner: (1) affine transformation model that characterizes the mapping by spatial mapping consistency to iteratively recover the corresponding point and estimates the motion distortion transformation
In our experiments, we have comprehensively evaluated the registration performance for 2DE images with comparison to the landmark-based or intensity-based registration method, including the Demons13,14 and landmark-based method with affine transformation. Through quantitative measurements and visual inspection, our proposed alignment method outperforms other methods.
Methods
The goal of our 2DE registration is to align any two images with possible significant physical and chemical gap for further analysis of the differentially regulated protein spots. We register a moving image Affine transformation estimation. We first extract the SIFT feature in the moving image and fixed image, which can sparsely cover the whole image. The correspondence detection scheme is established for global consistence alignment. Further refinement of the initial correspondences is performed by using iterative spatial vector consistency mapping. Then, we can remove mismatches via transformation-guided with corresponding spatial vector consistency mapping, which can alleviate the motion distortion and make global alignment much more efficient. No-rigid deformation estimation. After we approximately transform moving image
Affine transformation estimation stage
Considering the global alignment efficiency, we select a set of landmarks automatically with any structure features that can sparsely cover the whole image. Then, an iterative correspondence detection scheme is established for motion distortion. Thanks for completing and complementary imaging information, we can deploy the state-of-the-art landmark detector method to accurately extract the stability landmarks and obtain underlying correspondence in both images. The establishment of correspondence between images is to find the point pairs that represent the same structures in two images. Correspondence matching can be performed either on point intensities or on higher level feature descriptors. The SIFT 15 algorithm is used in our schemes. Since the approximate affine transformation highly depends on the ratio of inliers and the distribution of inliers has been established, we obtain the well correspondences set by the following two steps.
The correspondences are estimated coarsely
We employ the Best-Bin-First (BBF) algorithm 15 to estimate the correspondences between two images. And the BBF algorithm cannot guarantee that all matches are correct. Fortunately, the SIFT descriptors are invariant to image scaling and rotation. The main incorrect matches can be removed by the SIFT keypoints’ orientations. We measure the orientation difference by them. If the difference of orientations is more than a threshold, then the correspondence is discarded. Experiments show that most incorrect matches are excluded by this criterion. We calculate the distance from each mapped point to the correspondent point in pre-defined reference image to discard the mismatches. The distance is used to measure whether thecorrespondence is along the estimated spatial deformation. 16
The correspondences are refined finely using L2E estimator
Since the transformation between gel electrophoresis images is non-rigid, we can apply the optimal transformation with

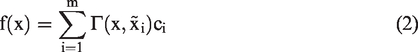


The derivative of the L2E cost function is used to calculate the minimized L2E functional

Although the robust estimation algorithm can calculate the global transformation matrix correctly with less mismatches, the alignment accuracy cannot be guaranteed, especially, when shape changes in the local region. We take the further procedure for improving alignment accuracy after L2E estimator removing the mismatches.
No-rigid deformation estimation stage
In order to relieve the intensity difference in two images, we utilize the histogram matching to normalize two images with the same local illumination in whole image before no-rigid deformation. Given two images, moving image

The goal of this is to obtain the histogram matching function

Finally, the objective function
Next step is to estimate dense deformation for each pixel. Since the affine transformation is done by above stage, the next stage is to finish an optimization that aims at calculating the displacement of each pixel to obtain an intelligent alignment of the images.
Let

Results
Dataset
In total, there are three group protein images dataset: KO-WHY1, KO1-3, WT, which are obtained from Fujian Provincial Key Laboratory of Plant Functional Biology. Total proteins were separated by sodium dodecyl sulfate-polyacrylamide gel electrophoresis (SDS-PAGE) after isoelectric focus (IEF) and then the gels were stained by Comassie Blue R250. And 56 image pairs from three group protein images dataset are chosen in the following experiments, where each pair has 2D protein separation patterns visualized.
Setting of parameters
Demons and our improved Demons
The iteration number is 20. For L2E, since it is non-convexity that the L2-minimizing estimate with the multi-dimensional Gaussian function in our method, the deterministic annealing is employed by controlling the annealing rate γ. The initialization of γ, λ, and σ2 are 0.5, 0.1, and 0.05, respectively. 18
Registering 2D gel image and results
To evaluate the proposed framework, first the number of feature matching with different frames is compared. The initial matches are obtained by SIFT, the refined matches by the SIFT keypoints’ orientations, and the final matches are shown in Figure 2. In order to visualization of results, the matches are drawn by one-eighth sparse. Actually, the number of initial matches is 987 in (a) and it contains many mismatches, the number of refined correspondences is 936 in (b), the number of final correspondences is 823 in (c). The mismatches have been removed to a large extent. It is apparent in Figure 2 that the SIFT keypoints’ orientations can be used to delete the apparent mismatches. And the L2E frame does well to obtain the correspondences without mismatches in this example.

The correspondences with different steps for our frame: (a) the correspondences (987 matches) are obtained by BBF frame, (b) the correspondences (936 matches) are refined by the SIFT keypoints’ orientations, and (c) the final correspondences (823 matches) are refined by the L2E frame.
We compare the correspondences obtained by different frames for eight pairs of image data. For example, RANSAC, L2E, and the proposed framework are used for correspondence estimation between the images. And all original matches are from the SIFT. Table 1 shows (1) the obtained matched correspondences (O) by calculating Euclidean distance (ED) between the matched point and registration point and (2) the final correspondence fraction of correct matches (F (%)) with different estimators, which are measured by the ED between the correspondences. If the distance D is less than a threshold T (the value of T is 0.5 in our experiment), the correspondence is a correct match. The best result for each dataset is shown in bold.
Comparison of the number of obtained (O) matched correspondences as well as fraction of correct matches (F (%)) with different estimators for intra subjects.
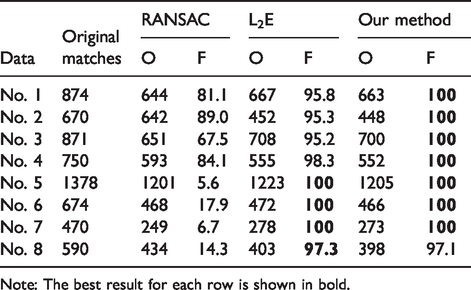
Note: The best result for each row is shown in bold.
And to validate the proposed registration framework, we compare the accuracy of registering with Demons, landmark-based method with affine transformation, and the proposed hierarchical transformation-guided registration for 2DE image. The preprocessing is same that the affine transformation is done by our proposed framework. The result of landmark-based method is obtained using the refined correspondences as control points. The registration accuracy is measured through the following four qualities of alignment image: mutual information (MI)


In Table 2, the registration accuracy is listed with different registration methods, which is measured by MI, PSNR, and RMSE for all image pairs. The values for those criterions are obtained from calculating the measure between the registration point and the matching point (the best result is that the two locations overlap). The values of MI and PSNR are as higher as better, and the higher value indicates that the results have more relevant items. The value of RMSE is as lower as better, and the lower value indicates that the result is more accurate. The best result for each row is shown in bold. It is apparent that the proposed registration framework achieves more accurate registration results than other methods.
The mean and standard deviation of MI, PSNR, and RMSE with different registration methods.
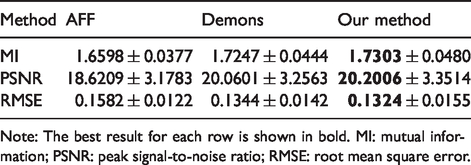
Note: The best result for each row is shown in bold. MI: mutual information; PSNR: peak signal-to-noise ratio; RMSE: root mean square error.
As shown in Figure 3, the results are shown for four pairs of images, and each pair of images is put in a blue rectangle. And in each blue rectangle, the first row is the two original images and second row is the directly aligned images (the left of the second row) and registered images (the right of the second row). In the second row, the images are aligned by single channel image. In the aligned images, the image colored in red is from the fixed image, the image colored in green is from the moving image, and the image colored in yellow is the overlapped spots. If the aligned images show many yellow spots, the spot is aligned well and the image pairs have greater similarity. The spots can be aligned well in the registered image pairs. The different spots and misaligned spots can be identified easily, which is especially in the regions indicated by colored circles, where No. 4 image pair has an apparent misaligned point pair as shown by a green circle. It is clear that the proposed registration method achieves more accurate registration results for the further analysis of the differentially regulated protein spots.

Registration results of datasets No. 1 (a), No. 2 (b), No. 3 (c), and No. 4 (d), respectively. Top row shows the original images, bottom row shows the unregistered overlap image and registered overlap image. In the second row, the images are aligned by single channel image. In the aligned images, the image colored in red is from the fixed image, the image colored in green is from the moving image, and the image colored in yellow is the overlapped spots.
Conclusion
In this paper, we have presented a hierarchical transformation-guided registration method for 2DE image. In order to address the changes of protein locations generally and shape development, we deploy affine transformation model to obtain the global alignment and use the deformable model to alleviate the local shape differences. Since there is no rigid deformation between the gel electrophoresis images, we combine the conventional non-parametric registration method – demons and the entropy of image to complete the deformable registration to alleviate the appearance of differences. We have intensively evaluated the registration accuracy on 2DE image and compared with landmark-based method and intensity-based method, where our proposed method achieves highest registration accuracy compared with other counterpart registration methods.
Footnotes
Acknowledgements
The authors would like to thank Dr Jiayi Ma for providing source code for the L2E algorithm and Drs Cachier and Wang for the Demons algorithm.
Declaration of Conflicting Interests
The author(s) declared no potential conflicts of interest with respect to the research, authorship, and/or publication of this article.
Funding
The author(s) disclosed receipt of the following financial support for the research, authorship, and/or publication of this article: This work has been supported by the National Natural Science Foundation of China (Grant Nos. 61701117, 61702101, 61501120), the Research Foundation for Education Bureau Young Scientists of Fujian Province (Grant No. JA15173), Natural Science Foundation of Fujian Province (Grant No. 2017J01736), and the Fund of Cloud Computing and Big Data for Smart Agriculture (Grant No. 117-612014063).