
Abstract
The accuracy of the leukocyte nucleus segmentation is an important preprocessing step in the leukocyte automatic analysis. However, different dyeing conditions or different illumination conditions may cause capturing different color leukocyte images in microscopic imaging system, which will result in the over-segmentation or under-segmentation of the leukocyte nucleus. A leukocyte nucleus segmentation method based on enhancing the saliency of the saturation component is proposed. While applying the set of calibration offset values
Keywords
Introduction
One’s immune system protects his body from an extraordinarily large variety of bacteria, viruses, and other pathogenic organisms by identifying and killing them.1–3 The immune system also constantly detects the body for the presence of abnormal cells such as tumor cells and virally infected cells, and destroys such cells when they are found. Leukocytes are the key point in the immune system. They are all produced and derived from a multipotent cell in bone marrow, including granular types such as neutrophil, eosinophil, and basophil, and nongranular types such as lymphocyte and monocyte.4–6 Therefore, leukocyte analysis can be used as a reference to human health diagnosis in clinical medicine.7,8
Over the past few years, researchers who were working in the field of leukemia detection by medical image processing have investigated ways of segmenting leukocytes automatically from blood smear images. The majority of the segmentation methods of the leukocytes in microscopic images that have been proposed are generally based on edge and border detection, region growing, filtering, mathematical morphology, clustering, and so on. Ritter proposed a fully automatic method for segmentation and border identification of all objects that do not overlap in an image from a peripheral blood smear slide. 9 Madhloom et al. 10 proposed a segmentation method by using morphological operations to extract the leukocytes from other blood cells and background. Sarrafzadeh and Dehnavi 11 proposed a method based on K-means clustering and region growing to detect leukocytes from a blood smear microscopic image and segment its components, the nucleus, and the cytoplasm. Color images are a very rich source of information and regions can be segmented better in terms of color as compared to grayscale images. However, selection of color space is also a vital issue in color-based clustering. Arslan et al. 12 proposed a color- and shape-based algorithm for segmentation of white blood cells in peripheral blood and bone marrow images. Liu et al. 13 proposed a segmentation method combined mean shift clustering, color space conversion, and nucleus mark watershed operation to segment leukocyte. Marzuki et al. 14 proposed a leukocyte nucleus segmentation method by using active contour; the segmentation results are based on the parameter values obtained from segmentation process. Yang et al. 15 proposed a method of leukocyte segmentation based on S component and B component image; the Otsu’s histogram thresholding method 16 is used in the S component to segment the leukocyte nucleus (OS); however, when the image is dyed too lightly, it will result in over-segmentation or under-segmentation. Many beneficial explorations have been carried out for leukocyte segmentation, but majority of these methods have some defects to different extent, such as complexity of arithmetic, difficulty to confirm parameters, and so on. The proposed method shows how to segment the leukocyte nucleus of the blood smear microscopic images by enhancing the saliency of the saturation component (ESSC). The segmentation accuracy (SA) and effectiveness are comparatively analyzed with the related leukocyte nucleus segmentation methods.
Space vectors selection for the leukocyte nucleus segmentation
RGB and HSI are commonly used to describe color space.17–19 A variety of colors are obtained by mixing red (R), green (G), and blue (B) color channels in RGB color space. And the RGB color space is usually used in devices for color display. Hue (H), saturation (S), and intensity (I) compose the HSI color space, which is suitable for human’s visual characteristic. So the HSI space is chosen to segment the leukocyte nucleus.
The conversion relationship between HSI color space and RGB color space is shown below


Figure 1(a) shows a typical captured blood smear image. Normally, the leukocyte region is the region of interest (ROI) while the other regions are the background regions. As we all know, the ROI regions are composed of leukocyte nucleus region (L1) and leukocyte cytoplasm region (L2), and the background regions are composed of background with erythrocyte region (L3) and background without erythrocyte region (L4) as shown in Figure 1(a). Figure 1(b) to (d) shows its H, S, and I components. It is not hard to find that the chrominance values in leukocyte nucleus regions, cytoplasm regions, and erythrocyte regions have no obvious difference in H component and I component. However, the chrominance values in the four regions of the S component have a remarkable difference, and the chrominance values of nucleus regions are the biggest. So we can segment the leukocyte nucleus regions using OS method. 15

The H, S, and I components corresponding to the captured blood smear image: (a) Blood smear image, (b) H component, (c) S component, and (d) I component.
On the basis of large numbers of experimental analysis, when the OS method is used to segment the leukocyte nucleus, the segmentation result is efficient in most instances. However, when the blood smear is dyed lightly, it will result in over-segmentation or under-segmentation by directly using the OS method. Thus, the robustness and universality of the segmentation will be broken. Figure 2(a) shows a typical captured blood smear dyed deeply, its S component is as shown in Figure 2(b) whose chrominance values of leukocyte nucleus regions are bigger than those of the other regions, and its segmentation result is as shown in Figure 2(c) which is efficient. Figure 2(d) shows a typical captured blood smear dyed lightly, its S component is as shown in Figure 2(e) whose chrominance values of leukocyte nucleus regions are close to those of the erythrocyte regions, and its segmentation result is over-segmented as shown in Figure 2(f). In order to make the OS method to segment the leukocyte nucleus more accurately and efficiently, and improve the robustness and universality further, the ESSC is proposed.

The segmentation results by the OS method in different conditions: (a) The blood smear dyed deeply, (b) the S component of (a), (c) the segmentation result of (a), (d) the blood smear dyed lightly, (e) the S component of (d), and (f) the segmentation result of (d).
The mathematical model and principles of the ESSC
From equation (2), it is not hard to find that the S has a direct relationship with R, G, and B.

When min{R, G, B} = G

Suppose that

If

If

When min{R, G, B} = R or min{R, G, B} = B, it can also be proved that SC is bigger than S. So when the R, G, and B decrease at the same time, the S increases. It provides the possibility to increase the saliency of the leukocyte nucleus region.
In order to analyze the increased difference of the saliency in the four different regions, 3000 blood smear images are tested as samples. Considering that there are five different types of leukocytes, so the five different types of leukocytes were analyzed, respectively. Table 1 shows the experimental statistical results for the average chrominance values
The average chrominance values of the three components in leukocyte regions.

Table 2 shows the experimental statistical results for the average chrominance values
The average chrominance values of the three components in background regions.
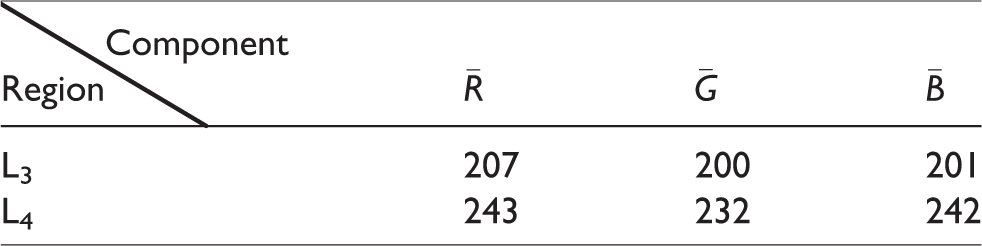
According to the experimental statistical data from Tables 1 and 2, we have calculated the
In order to evaluate the increased saliency of S, set the saliency increase rate RC as

Here five typical strategies are chosen for analysis. The calculation results in the five typical strategies are shown in Table 3.
The change rule of the S along with the change of the

From Table 3, it is not hard to find that
The segmentation of the leukocyte nucleus
The rough segmentation of the leukocyte nucleus
The rough segmentation process of the leukocyte nucleus by the proposed method is shown in Figure 3. First, the captured blood smear image I0 shown in Figure 3(a) can be calibrated to be IS as shown in Figure 3(b). Its RGB components are adjusted as follows


The rough segmentation process of the leukocyte nucleus by the proposed method: (a) I0, (b) IS, (c) SC, and (d) the segmentation result.
The formula is that the I0
R
, I0
G
, and I0
B
were subtracted by
The SC component of I0 is as shown in Figure 3(c) in which the leukocyte nucleus saliency is superior to that in Figure 2(e). The leukocyte nucleus can be segmented successfully in the SC component by Otsu algorithm as shown in Figure 3(d). In this way the rough segmentation of the leukocyte nucleus has been completed.
The precise segmentation of the nucleus and the judgment of the lobular nuclei
After the rough segmentation of the leukocyte nucleus, there are some other small regions outside the leukocyte nucleus region which are the stains or platelets as shown in Figure 3(d), so it is necessary to remove these nonleukocyte nucleus regions to achieve the leukocyte nucleus precise segmentation. And because some nuclei are lobular ones in the neutrophil and eosinophil, it will lead to the wrong counting of the leukocyte if we do not judge the lobular nuclei. So it is very necessary to judge the lobular nuclei after the leukocyte nucleus precise segmentation. 20 The basic process for the leukocyte nucleus segmentation and lobular nuclei judgment is as shown in Figure 4.
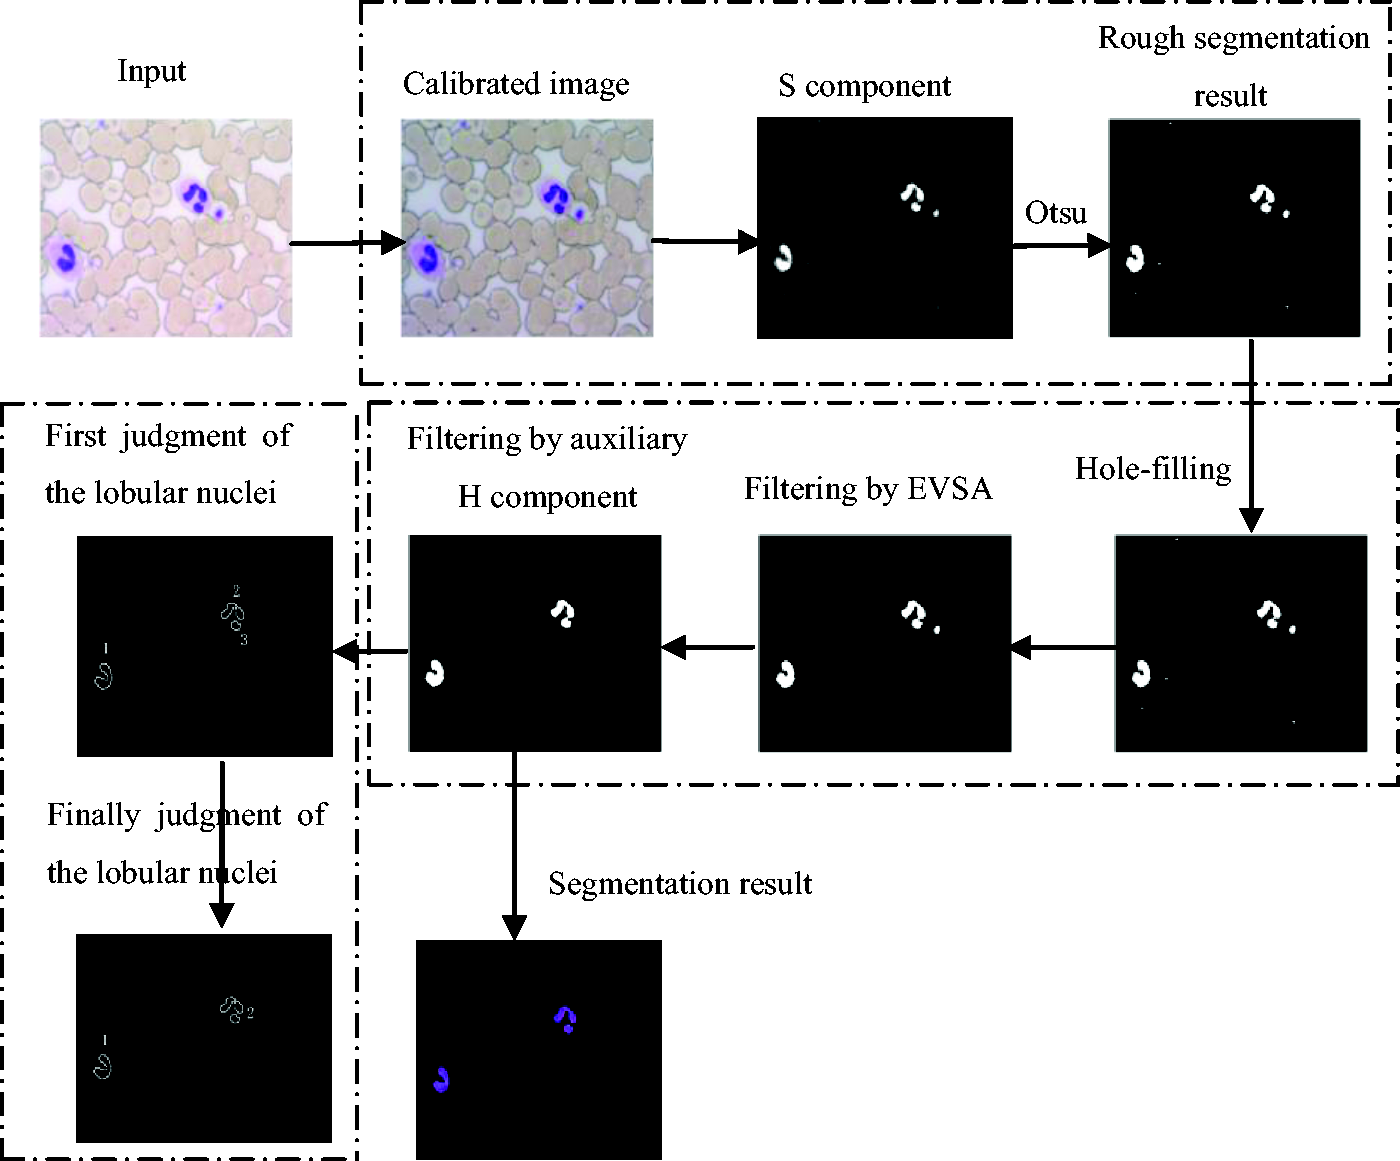
The basic process for the nucleus segmentation and lobular nuclei judgment. EVSA: empirical value of the small area.
After completing the rough segmentation of the leukocyte nucleus, the nonleukocyte nucleus regions are removed. The empirical value of the small area (EVSA) is adopted to filter the smaller stains and platelets regions. Its specific operation process is the morphological hole-filling which is operated on the leukocyte nucleus rough segmentation result to make the leukocyte nuclei better-knit, then an appropriate area threshold (set by large numbers of experimental statistical analysis for the lobular nuclei of the leukocyte) is used to filter the smaller stains or platelets regions but some bigger ones still exist. Because the leukocyte is compound of the nucleus and the cytoplasm which surrounds the nucleus, but stains or platelets regions have no cytoplasm at all, the bigger stains or platelets regions can be sufficiently singled out by judging whether the surrounding has the cytoplasm. As we know, the values of H component in cytoplasm regions are bigger than the other regions, so the leukocyte nucleus can be precisely segmented by the auxiliary H component analysis. After the leukocyte nucleus precise segmentation, the empirical value of the distance between the centroids (EVDC) is adopted to judge the lobular nuclei. Its specific operation process is that the boundary is extracted from each region which has eight adjacency labeled. 21 Then the Euclidean distance D between the centroids of any two regions is calculated. If the distance D is bigger than the distance empirical value D0 (set by large numbers of experimental statistical), it means that the two regions are two independent leukocyte nuclei. Otherwise, they belong to the same leukocyte nucleus. After repeating the above steps until all the regions have been judged, the final judgment is completed as shown in Figure 4.
Experimental results and analysis
Data description
All the algorithms were implemented with Visual C++ 6.0 on a Windows XP operating system with a 3.30 GHz Intel Core i3-3220 CPU and 4 GB memory. Peripheral blood smears are prepared with Wright–Giemsa dye. Three thousand different microscopic images with 1024 pixel×768 pixel size were captured by a CCD camera, and they were collected from the People’s Hospital of Sichuan Province. The desired segmentation standard of the ROI is manually extracted by the specialist in hematology.
Segmentation results
Six representative samples at different dyeing conditions or different illumination conditions are chosen for analysis randomly from the 3000 tested blood smear samples which are shown in Figure 5(a); Figure 5(b) shows the leukocyte nucleus segmentation results, Figure 5(c) shows the final judgment results of the lobular nuclei, Figure 5(d) shows the RGB images of the leukocyte nucleus segmentation results.
The experimental results show that in the case of different dyeing conditions or different illumination conditions, the segmentation results are efficient, and the lobular nuclei can be rightly judged even when the stains exist.

The segmentation results of the leukocyte nucleus by the proposed method: (a) The captured blood smears, (b) the segmentation results, (c) the final judgment results of the lobular nuclei, and (d) the RGB images of the segmentation results.
The experimental results show that the proposed method can not only make the Otsu algorithm to segment the leukocyte nucleus in the S component more accurately and efficiently, but also improve the robustness and universality further.
Evaluation of the segmentation results
In order to evaluate the segmentation results of the proposed method, three criterions are used:
The first is SA. The SA is defined as follows
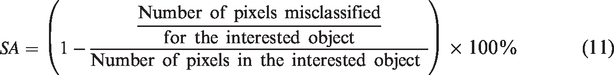
The second is a synthesized criterion. The over-segmentation rate (OR), under-segmentation rate (UR), and overall error rate (ER) are synthesized to evaluate the ability of the segmentation method in segmenting the ROI from an image.
22
Op is the number of segmented pixels not belonging to the object, Up is the number of under-segmented pixels belonging to the object, and Dp is the actual number of pixels of the object manually extracted by the specialist in hematology. OR, UR, and ER can be described as follows

The third is relative distance error (RDE). Yang-Mao et al.
23
proposed the RDE to evaluate object segment results. Let 
We compare the segmentation results with the other five methods: Miao’s method, 24 Roopa’s method, 25 OS, 15 Gram–Schmidt orthogonalization (GSO), 26 and marker-controlled watershed 27 to ensure the performance of the proposed method in the same experimental samples. The experimental results are shown in Table 4. From Table 4 we can see that the SA of Miao’s method is 97.18%. It is higher than that of our method 97.14% but the difference is very small. The time consumption of Miao’s method is 0.32 s while our method is 0.29 s. Except Miao’s method, our method has the highest SA value. As to OR, our method is 0.0431, which is slightly worse to Miao’s method but superior to the other four methods. The UR of our method is 0.0757 and that of GSO is 0.0727. Our method in UR is worse than GSO but superior to the other four methods. The RDE of our method is 0.0286, which is slightly bigger than that of Miao’s but much smaller than that of the Roopa’s method, OS, GSO, and Watershed method. By comprehensive consideration, the segmentation result of the proposed method is as good as Miao’s and is more efficient than the other four methods.
Segmentation result evaluation of the proposed method comparison with other methods.

ER: error rate; GSO: Gram–Schmidt orthogonalization; OR: over-segmentation rate; RDE: relative distance error; SA: segmentation accuracy; UR: under-segmentation rate.
To verify the applicability of our method, we did an experiment on a new leukocyte dataset which consist of another 2000 images from the People’s Hospital of Sichuan Province and 100 randomly selected leukocyte images in Cellavision dataset. 24 And the segmentation result is shown in Figure 6. The images in Figure 6, I–III are from People’s Hospital of Sichuan Province and their dyeing conditions or illumination conditions are different. In Figure 6, IV–VIII are images of five different leukocyte classes from the Cellavision dataset. Figure 6(a) shows the leukocyte images to be segmented. Figure 6(b) shows the leukocyte nucleus segmentation results and Figure 6(c) shows the RGB images of the leukocyte nucleus segmentation results. As can be seen, the segmentation results are efficient. The SA on the new leukocyte dataset is 96.97%, the OR is 0.0437, the UR is 0.0813, the ER is 0.0303, and the RDE is 1.1065. It reflects the general applicability of our method.

The segmentation results of the leukocyte nucleus by the proposed method: (a) The images to be segmented, (b) the segmentation results, and (c) the RGB images of the segmentation results.
A large number of experimental results show that the SA, robustness, and applicability of the proposed leukocyte nucleus segmentation method have been further improved.
Conclusion
A leukocyte nucleus segmentation method based on ESSC has been proposed. Compared with the three existing leukocyte nucleus segmentation, the ESSC has been proved to be highly efficient for the leukocyte nucleus segmentation at different dyeing conditions or different illumination conditions. It is based on the EVSA to filter the smaller stains and platelets regions; the big stains and platelets regions are filtered by the auxiliary H component analysis. The empirical value of the distance between the centroids (EVDC) is adopted to judge the lobular nuclei. It outperforms the three existing algorithms in SA (97.14%), OR (0.0456), ER (0.0286), and RDE (1.1013). The experimental results show the high SA and robustness of the proposed method. Good segmentation results provide an important foundation for leukocyte automatic analysis.
Footnotes
Declaration of Conflicting Interests
The author(s) declared no potential conflicts of interest with respect to the research, authorship, and/or publication of this article.
Funding
The author(s) disclosed receipt of the following financial support for the research, authorship, and/or publication of this article: This work was supported by the 863 National Plan Foundation of China under Grant No. 2007AA01Z333 and Special Grand National Project of China under Grant No. 2009ZX02204-008.