
Abstract
This article examines the growth and structural transformation of South Korea's network media economy from 2010 to 2022 as part of the Global Media and Internet Concentration Project. Using CR4 and Herfindahl–Hirschman Index measures, it analyzes revenue trends and market concentration across telecommunications, media services, and core internet sectors. Despite overall industry growth, concentration levels declined due to the rapid expansion of digital cultural industries. However, oligopolistic control persists in the telecoms sector, while global platforms and major domestic players are increasing their influence in online media services. As a result, Korea's media economy has become increasingly dualized, characterized by concentrated infrastructure sectors alongside diversified media services. The article highlights that rapid industrial expansion does not necessarily ensure the decentralization of market power, and it calls for critical perspectives on market concentration and industrial restructuring in the digital age.
Introduction
In the early 21st century, South Korea (hereafter Korea) has rapidly developed its own popular culture and digital technologies and continuously increased its global reach. Korea has particularly developed its digital platforms, including OTT (over-the-top) platforms, Internet portals, and fan streaming services, to become one of the most advanced non-Western countries in the information and communication technologies (ICTs) sector. Through consecutive mergers and acquisitions (M&As), local digital industry firms have also attempted to expand their market share in the national market, while global media platforms play a pivotal role. Since numerous global platforms entered Korea in the mid-2010s, Korea has had to develop local digital platforms to compete with global digital platforms, reflecting the increasing role of global forces (Kim and Jin, 2024).
The recent growth of media and cultural industries embodies significant changes in Korean companies’ industrial structure and adaptations to emerging business strategies, including corporate integration. These developments represent the diversification of media and cultural industries or national industrial strategies based on corporate growth and market concentration. The shifting trends in revenue and market concentration within Korea's network and media economy, covering telecommunications, internet access, online and traditional media services, and key internet sectors, have been one of the key subjects in media concentration practice, because Korea is one of the very few countries that advance distinctive growth in the digital technologies, such as broadband, mobile services, and the Internet, in terms of the number of users and penetration rates, which have been among the highest in the world. 1
Numerous previous works have analyzed the growth of the Korean digital economy and industries, as well as market concentration (Byun, 2020; Jun, 2009; Kim and Jin, 2024; Park, 2016; Won and Park, 2021). However, the primary focus has been on developing media ownership regulations that adapt to the changing media landscape, as well as addressing issues of growth and monopolization within specific sectors, such as the platform or cultural industries (Byun, 2020; Jun, 2009; Park, 2016; Won and Park, 2021). There is a noticeable lack of comprehensive diachronic studies that encompass the entire media industries. Furthermore, despite recent changes and the rapid expansion of the Korean media landscape, few researchers have focused on the evolving Korean internet and platform industries, often due to the limited availability of historical data and observation opportunities (Kim and Jin, 2024). 2
To address this gap, this article investigates the structural transformation of Korea's telecommunications, media service, and internet industries from 2010 to 2022. As part of the Global Media and Internet Concentration Project (GMICP), it analyzes revenue distribution and market concentration across these sectors to examine the distinctive trajectory of Korea's network media economy. The GMICP is a global initiative involving research teams from 38 countries and has tracked the evolving media landscapes worldwide since the 1980s. Given the project's focus on industry revenues and market concentration, the data and analysis focus on explanatory and interpretative dimensions. However, by providing a time series analysis that offers a bird's-eye view of Korea's media economy, this article aims to contribute to academic and policy debates on market concentration in large media and platform conglomerates, as well as the broader socioeconomic repercussions of such structural consolidation.
Following GMICP's industrial classification, this article categorizes the Korean network media economy into three main fields: telecommunications and internet access, online and traditional media services, and the core internet sectors. This categorization encompasses the subindustries that constitute the largest share of Korea's network media economy. It enables a comprehensive analysis of the revenue scale of major actors in these sectors, the dynamics of vertical and horizontal integration, and the resulting trends in market concentration. The telecoms and internet access sectors include wireline, wireless, internet service providers (ISPs), and multichannel video distribution industries. The online and traditional media services sector encompasses broadcast TV, pay TV services, online video services, the production and distribution of film, TV and online videos, digital games, broadcast radio, music services, newspapers, online news media, and book publishing. The core internet sectors focus on internet advertising and app distribution. Sector-specific data were gathered from official reports by Korean government agencies concerning the cultural and ICT sectors. Additionally, company-specific analysis was conducted using financial disclosure data from publicly traded companies as well as corporate white papers.
As a methodological approach, it utilizes concentration ratios (CRs) and the Herfindahl–Hirschman Index (HHI). Media concentration, in this article, is defined as economic concentration within the media economy, where a few companies dominate the market by owning most of the property, capital, and labor power, controlling the majority of sales, and increasing their market presence through acquisitions, mergers, and the disappearance of competitors (Fuchs, 2023; Meier and Trappel, 1998). Revenue-based CR4 and HHI measures are frequently employed methods for assessing market concentration across various media sectors. While these measures have limitations, such as overstating the dominance of firms with large market shares and inadequately capturing the influence of media organizations on audiences, they nonetheless offer a standardized metric that effectively reflects differences in market power among industry actors and enables macro-level comparisons of media economies over time (Josifides, 1997; Yim, 2003). The CR approach evaluates market concentration by summing the market shares of leading firms; a CR4 (the four-firm CR) exceeding 50% and a CR8 (the eight-firm CR) surpassing 75% are considered indicators of significant market concentration. In contrast, the HHI method provides a more precise measurement by squaring the market share of each firm and summing the resulting values, enabling a more nuanced assessment of market structure (Noam, 2009). According to the US Department of Justice (2010), markets with an HHI below 1500 are classified as unconcentrated; those scoring between 1500 and 2500 are considered moderately concentrated, and markets exceeding 2500 are deemed highly concentrated.
Overview of the Korean network media economy from 2010 to 2022
Since 2010, Korea's network and media economy has experienced significant growth, transforming the industrial landscape. Factors such as the widespread adoption of smartphones and the expansion of Korea's cultural industries have shifted the media industrial landscape from being centered on traditional media to being oriented around digital and online media.
To begin with, revenues in the three sectors that comprise the media economy—telecoms and internet access, media services, and core internet sectors—all experienced growth despite the rapid transformation of the media landscape in the 2010s. The total revenue of the network and media industries was 62.8 trillion KRW in 2010 and increased significantly throughout the 2010s, reaching 77.8 trillion KRW in 2016 and 118 trillion KRW in 2022. Among these, the revenue of the telecoms and internet access sector increased from 33.3 trillion KRW to 39.3 trillion KRW, the media services sector surged from 28 trillion KRW to 67.7 trillion KRW, and the core internet sectors rose from 1.5 trillion KRW to 11.1 trillion KRW over the same period (Table 1). Along with this growth, the network media economy has assumed an increasingly significant role in the Korean national economy. In 2010, the total revenue of the industries examined in this article amounted to 4.6% of Korea's nominal GDP, whereas by 2022, this proportion had risen to 5.1% (Statistics Korea, n.d.). Meanwhile, during the same period, employment in these sectors decreased from 486,000 to 448,000, suggesting an increase in labor productivity within the Korean media economy (Korea Creative Content Agency, 2012, 2024; Ministry of Science, ICT and Future Planning, 2016; Ministry of Science and ICT, 2024).
Development of the media industries, 2010–2022 (unit: trillion Korean won, %, current prices) (1).
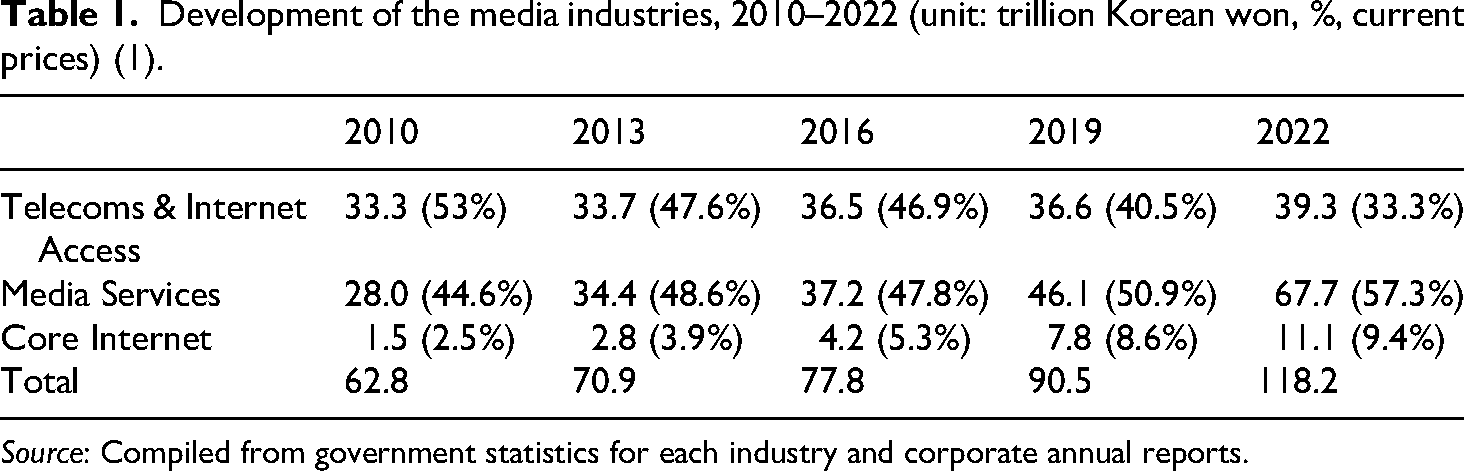
Source: Compiled from government statistics for each industry and corporate annual reports.
The share of each sector within the media economy underwent significant changes over the period. The share of the media services and core internet sectors increased from 44.6% and 2.5% in 2010 to 57.3% and 9.4% in 2022, respectively. This shift in proportion became more pronounced in the late 2010s with the expansion of new media services, including online video services, the growth of the platform industry, and the resulting increase in smartphone usage. This demonstrates that the core of the entire media industry has shifted from the telecommunications sector to the media service industries, specifically to the cultural and platform industries.
Revenue and concentration trends in the Korean media economy
Telecoms and internet access sectors
Since the early 2000s, with the widespread adoption of mobile phones and household internet access, Korea's telecoms and internet access sectors have been dominated by three major telecom companies: KT, SK Telecom, and LG Uplus (Jin, 2011). These companies have maintained oligopolistic competition across all subindustries within this category. This area encompasses wireline services, including traditional landline phones and other phone services offered by cable and online providers, as well as wireless services, which provide mobile voice and data. Additionally, ISPs deliver internet access through wireline, cable, and satellite, while multichannel video distribution involves delivering linear video programming to users via cable, satellite, and IPTV services.
Throughout the 2010s, the revenues of these subindustries, excluding the wireline sector, have significantly increased. The revenues of the sectors—wireline, wireless, ISPs, and multichannel video distribution—were 3.8 trillion KRW, 22.9 trillion KRW, 4.3 trillion KRW, and 2.2 trillion KRW, respectively, in 2010. By 2022, these figures changed to 1.3 trillion KRW, 25.7 trillion KRW, 5.1 trillion KRW, and 7.2 trillion KRW. While the revenues from the wireless and ISP sectors maintained their shares at 65% and 13%, respectively, similar to the levels of 2010, the revenue share of the wireline sector plummeted from 11.4% in 2010 to 3.4% in 2022. This decline is related to the decrease in landline telephone subscriptions in Korea, which fell from 80% in the early 2010s to 65% in 2015 and 22% by 2022, resulting in a decline in revenue (Korea Communications Commission, KCC, 2022) (Table 2) (Korea Communications Commission changed its name to Korea Media and Communications Commision in October 2025).
Revenues for the telecoms and internet access sectors, 2020–2022 (unit: trillion Korean won, %, current prices).
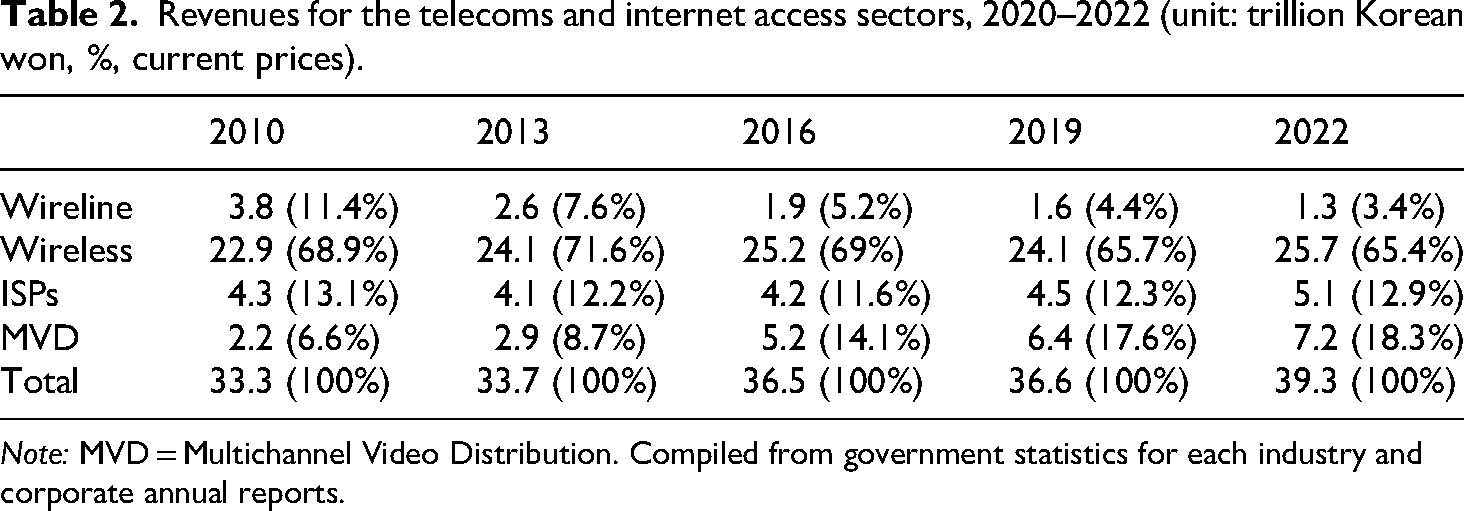
Note: MVD = Multichannel Video Distribution. Compiled from government statistics for each industry and corporate annual reports.
On the other hand, revenue from the multichannel video distribution sector has significantly increased since the mid-2010s, driven by the growth of IPTV services in this sector. The number of IPTV subscribers in Korea exceeded 10 million in 2015, and by 2022, it increased to 20.6 million, making this service the highest-grossing subcategory within this sector (Korean Statistical Information Service, 2024). Meanwhile, the increase in revenue in the wireless sector can be attributed to the rise in smartphone and various smart device usage across all age groups. Revenue in the wireless sector surged starting in 2013, when the smartphone penetration rate surpassed that of feature phones and reached 70%, continuing to increase by 2022, with the penetration rate reaching 94% (KCC, 2024).
The telecoms and internet access sectors had been highly concentrated from 2010 to 2022. The CR4 and HHI scores for the entire telecoms and internet access field remained at high levels, from 90.9 and 3064 in 2010 to 94.9 and 3080 in 2022. The concentration in the wireline and wireless sectors slightly decreased due to the narrowing revenue gap between the three major telecom companies. However, as of 2022, the CR4 scores were 89.3 and 96.5 for the wireline and wireless sectors, respectively, and the HHI scores remained around 3500. This high market concentration is primarily attributed to the oligopolistic structure formed by the three major telecom companies, a strategy established by the Korean government after the Asian financial crisis in the late 1990s to protect and foster the domestic telecom industry from foreign capital, which still persists today (Jin, 2011) (Table 3).
Concentration scores for the telecoms and internet access sectors, 2010–2022.
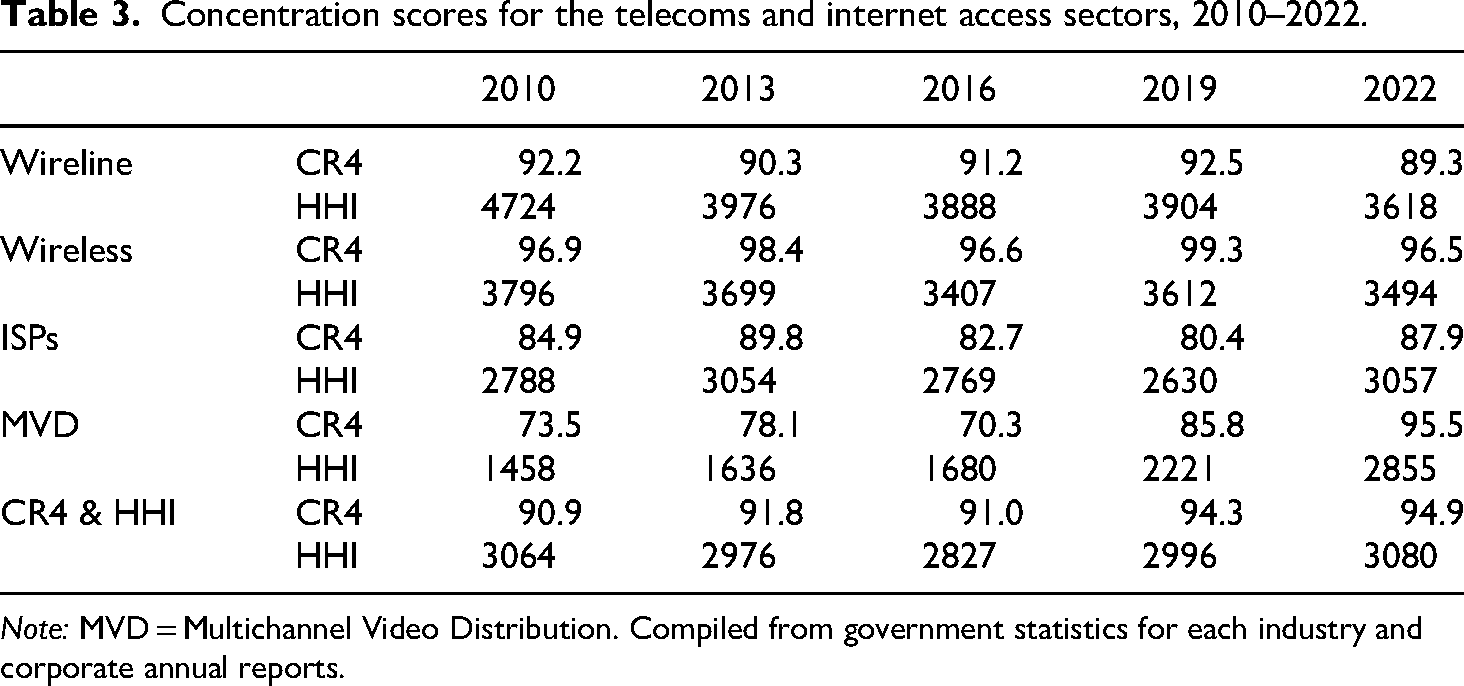
Note: MVD = Multichannel Video Distribution. Compiled from government statistics for each industry and corporate annual reports.
Notably, the concentration in the multichannel video distribution sector sharply increased from 2010. SK, KT, and LG have strengthened their ownership by merging with satellite and cable-based TV distribution companies—LG's acquisition of CJ HelloVision in 2019, SK Telecom's acquisition of T-broad in 2020, and KT's acquisition of Hyundai HCN in 2021 (Jin and Park, 2023). These mergers were enabled by the growth of IPTV services from major telecom companies and a continuous decline in cable TV subscriptions, which dropped from a peak of 14 million in 2016, diminishing revenues for smaller providers such as D'Live, T-broad, and CMB (Korean Statistical Information Service, 2024). This is a typical example of horizontal integration in the media industry, where large telecom and media corporations consolidate competitors within the same industry to achieve economies of scale and increase market dominance (Hesmondhalgh, 2019; Mosco, 2009). As Garnham (2004) noted, given that the media system is a product of economies of scale and scope, it is inherently inclined toward concentration by its very nature. Consequently, market concentration in Korea's telecom and internet access sector has seen a significant increase since 2010.
Online and traditional media services
The online and traditional media service sectors experienced rapid growth from 2010 to 2022. This category includes broadcast TV, which encompasses public service terrestrial broadcasters such as KBS, MBC, and SBS, as well as pay TV programming services that involve television channels providing programs for a fee through channel usage contracts with TV networks. These services include shopping channels and general programing TV channels, such as JTBC, MBN, and TV Chosun. Additionally, the category covers online video services based on subscription video-on-demand and transactional video-on-demand, as well as broadcast radio, which includes only those radio broadcasters whose primary source of revenue is radio broadcasting. Furthermore, the film-TV-online video production sector encompasses companies involved in film development and production, as well as broadcast video production, including major cultural enterprises’ production companies, CJ's production company, Studio Dragon, and JTBC's production arm, SLL. The film-TV-online video distribution sector covers film distributors. Finally, this field encompasses traditional media services, which include newspapers, book publishers, magazines, and other online media services, such as the gaming industry, music services, and online news media.
The revenue of all media service industries, excluding the magazine sector, continuously increased, resulting in a total growth of approximately 39.7 trillion KRW, from 28 trillion KRW in 2010 to 67.7 trillion KRW in 2022. The industries that experienced the most significant growth were film-TV-online video production, gaming, and music sectors, with a total revenue increase of 30 trillion KRW over the period, which accounted for the majority of the overall revenue growth in this field (Table 4).
Revenues for online and traditional media services, 2010–2022 (unit: trillion Korean won, %, current prices).
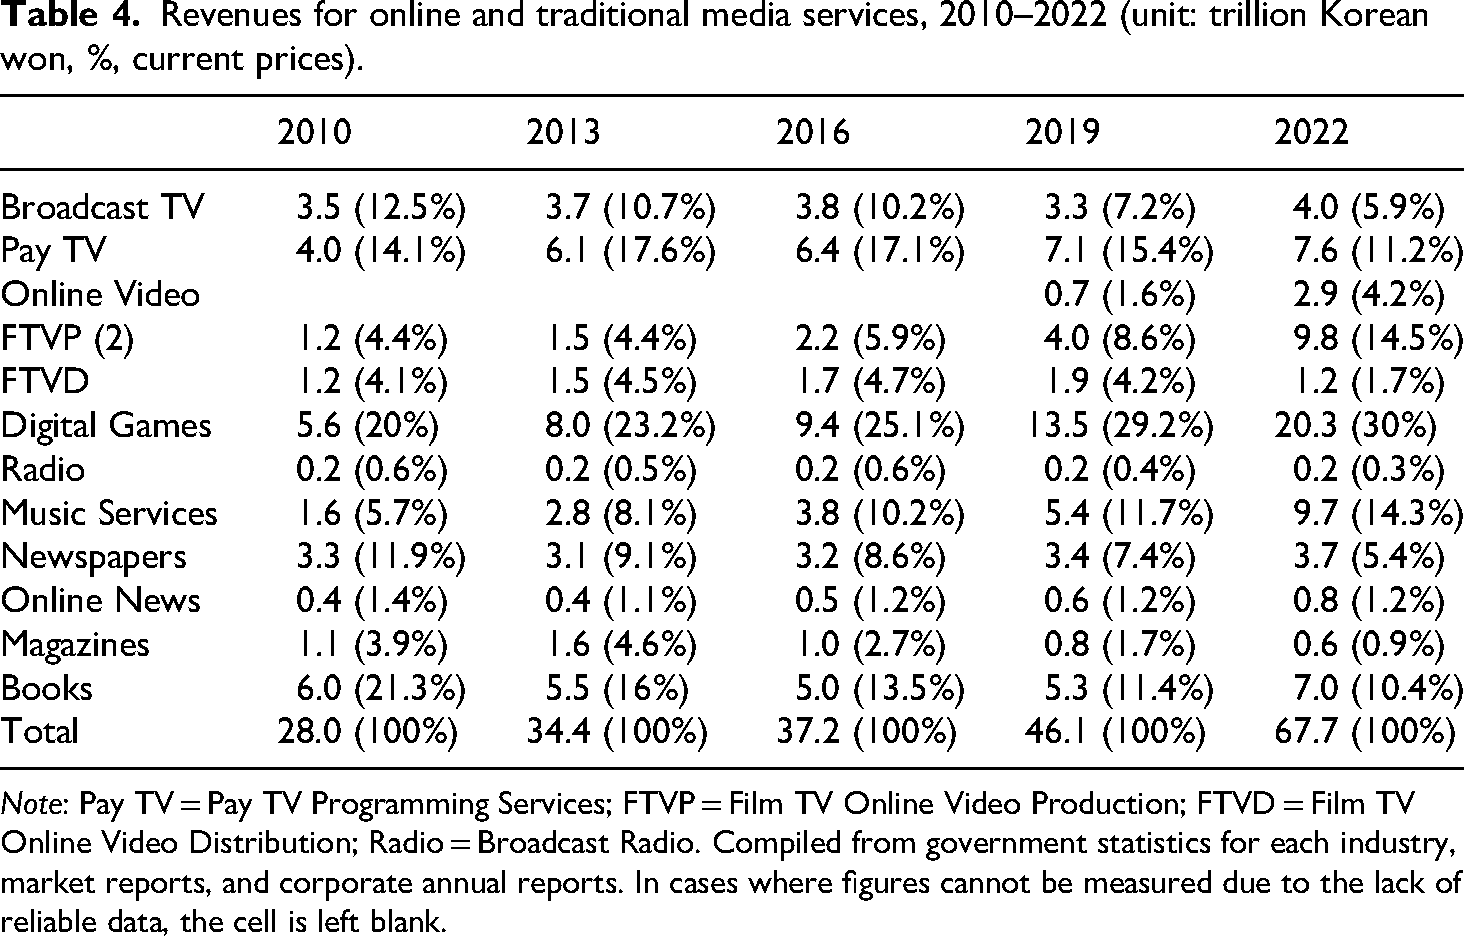
Note: Pay TV = Pay TV Programming Services; FTVP = Film TV Online Video Production; FTVD = Film TV Online Video Distribution; Radio = Broadcast Radio. Compiled from government statistics for each industry, market reports, and corporate annual reports. In cases where figures cannot be measured due to the lack of reliable data, the cell is left blank.
Conversely, the revenue share of traditional media services such as newspapers, books, magazines, broadcast TV, and pay TV programming services has markedly decreased despite their revenue growth. This decline is attributed to the shift from traditional to online digital media services since the 2010s, driven by both the domestic and global popularity of Korean media content and the expansion of the Korean cultural industries. Notably, the broadcast TV and newspaper sectors, despite generating revenues close to 4 trillion KRW in 2022, experienced only modest revenue growth of 468 billion KRW and 344 billion KRW, respectively, since 2010. This indicates that the evolving media landscape has had disparate impacts on online and traditional media service sectors. The profitability crisis in traditional media services has been exacerbated by the contraction of the advertising market for legacy media following COVID-19 (Yoon et al., 2024). Consequently, major broadcasters, including KBS and SBS, have implemented extensive restructuring to reduce staff, signaling a broader industry contraction (Kim, 2025).
Meanwhile, it is important to note that the rapid expansion of media industries does not necessarily guarantee financial soundness or sustainable revenue growth for market players (Jin and Park, 2025). The expansion of the media industry does not inherently promote competition or decentralize market power through the self-regulating logic of the market. This belief is grounded in a market-friendly assumption that the market can effectively regulate itself, which often fails to align with the realities of the media industry (McChesney, 2004). For instance, despite increasing revenues, Korean online video service companies such as Wavve, Tving, and Watcha have incurred net losses due to escalating production costs, exacerbated by competition from global platforms like Netflix (Content Wavve, 2023; Tving, 2023; Watcha, 2023). This trend has prompted mergers among domestic online video service providers. By the end of 2022, CJ ENM's Tving merged with KT's Seezen, and in December 2023, Tving and Wavve signed a memorandum of understanding to merge (Jeong, 2024; Lee, 2022).
The market concentration of the media service field remained relatively low until 2022. From 2010 to 2022, the CR4 score of this sector consistently hovered around 20, and the HHI has also remained below 200. At the individual industry level, the concentration scores for the broadcast TV, newspaper, and book industries have either remained stable or slightly decreased as the revenue disparity between players within these industries has narrowed. Given the low growth rates of these sectors and the entrenched industry structure centered around major players, these concentration levels are anticipated to be maintained (Table 5).
Concentration scores for online and traditional media services, 2010–2022.
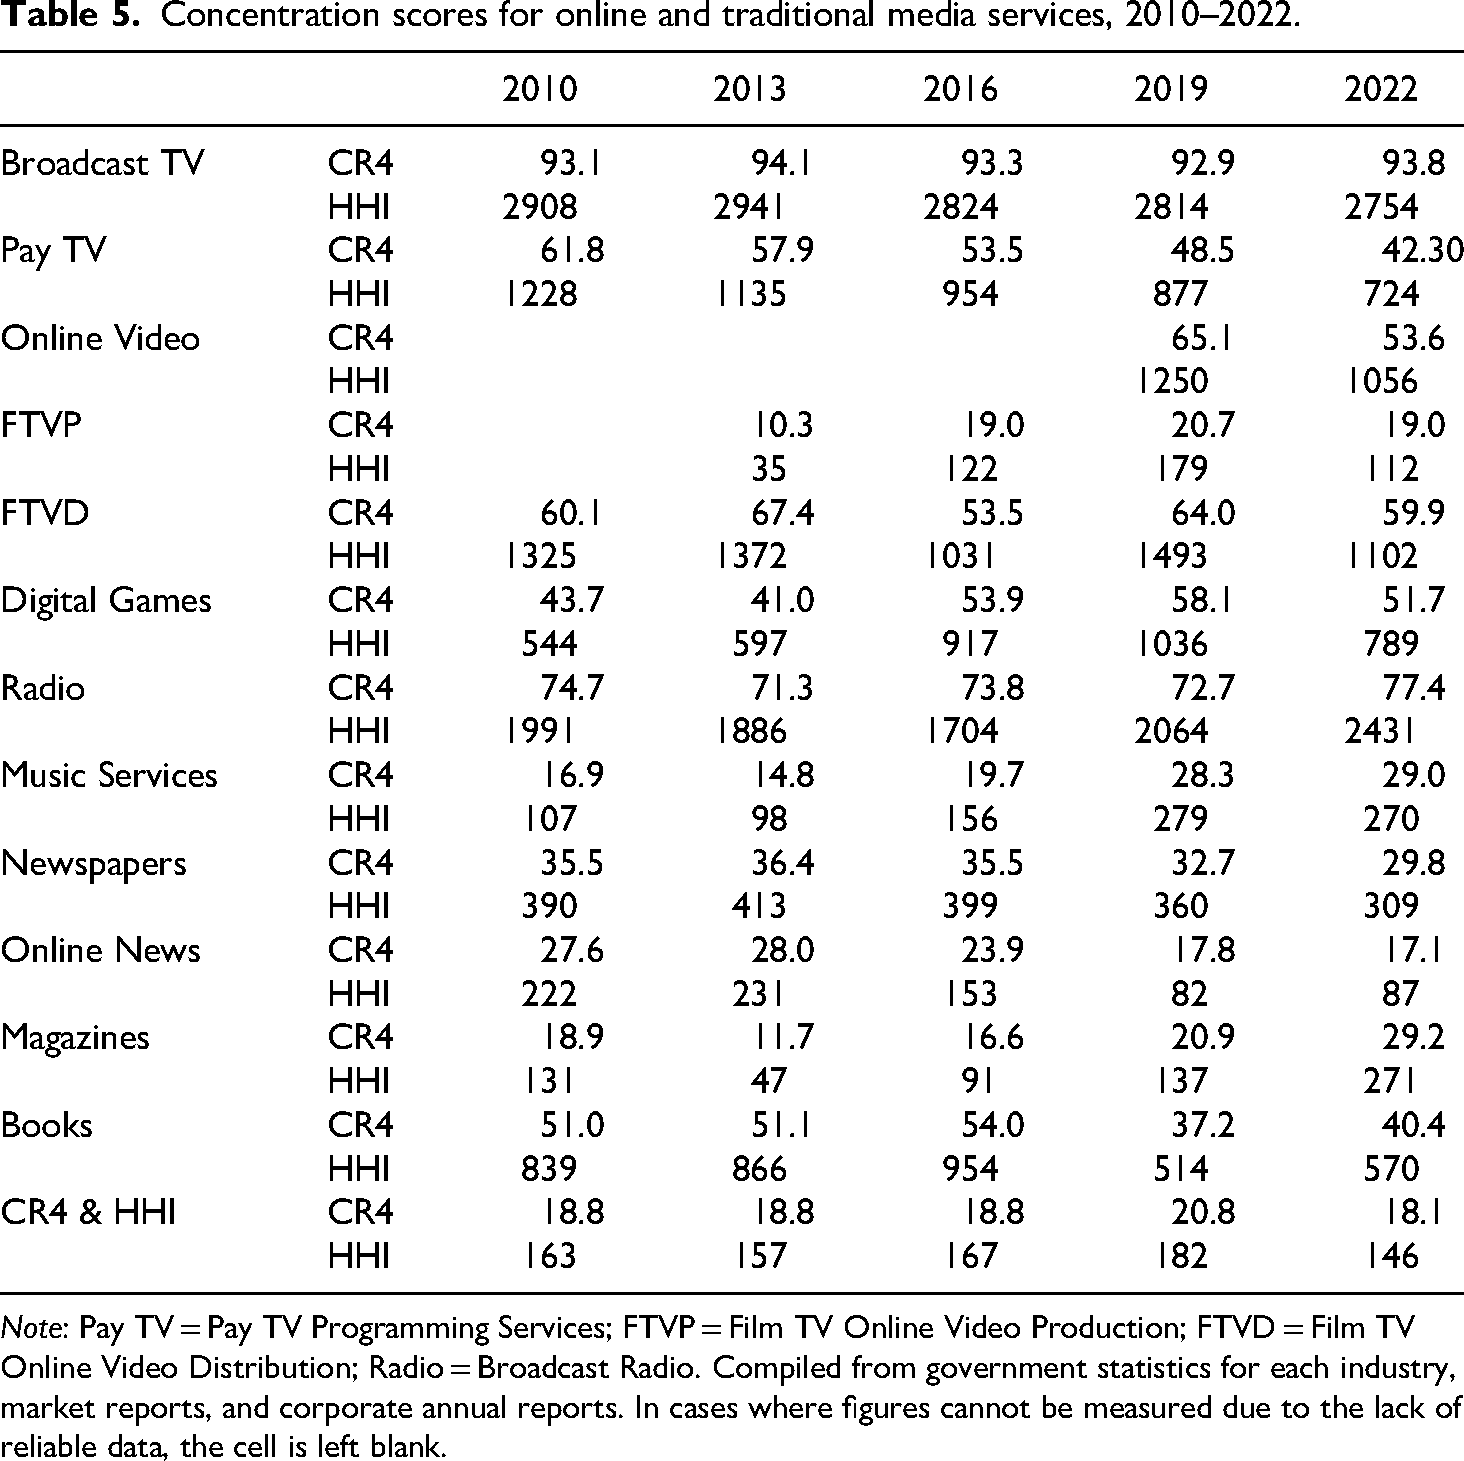
Note: Pay TV = Pay TV Programming Services; FTVP = Film TV Online Video Production; FTVD = Film TV Online Video Distribution; Radio = Broadcast Radio. Compiled from government statistics for each industry, market reports, and corporate annual reports. In cases where figures cannot be measured due to the lack of reliable data, the cell is left blank.
In contrast, there are potential concerns that market concentration in online media service sectors, such as video production, digital games, music, and online video services, could increase. As of 2022, the market concentration in these industries remained relatively low, with the CR4 and HHI scores for the video production sector at 19 and 112, and for the music sector at 29 and 270. The market concentration in the online video service and digital games industries is higher, with CR4 scores of 53.6 and 51.7 and HHI scores of 1056 and 789, respectively.
Market concentration in the music, games, and video production industries has increased since 2010. The cultural industries remain markets where small companies and cultural producers can enter with relatively low capital (Hesmondhalgh, 2019). However, as cultural products requiring substantial investment generate significant revenues, the share of large companies capable of managing high-risk, high-return businesses has grown (Fuchs, 2023). Moreover, the expansion of media platform services has blurred the boundaries between media service industries, and the synergy effects between the cultural products of these industries could potentially lead to higher market concentration (Jin, 2023).
In fact, partnerships between cultural firms, such as CJ, and the platform giant Naver, as well as ownership integration in the digital media service sectors by domestic platform company Kakao, have expanded the market influence of these firms. In the gaming industry, the revenue gap between leading companies and their competitors has also become increasingly entrenched. These developments suggest that alliances and ownership integration among large companies in the media service industries may raise entry barriers for small and medium-sized enterprises, potentially fostering an oligopolistic market structure (Herman and McChesney, 1997).
Meanwhile, as shown in Table 5, market concentration in the online video service sector decreased alongside rapid revenue growth, as the paid subscription rate for these services rose from 21.7% in 2020 to 55.9% in 2022 (KCC, 2022). However, as mentioned above, mergers between domestic online video service providers could lead to an increase in market concentration. Particularly during phases of industrial expansion, the intense competition and mergers that lead to market concentration may reduce the diversity of media content production and limit consumer choices (Compaine and Gomery, 2000; Noam, 2009). Given the growing presence of global companies such as Netflix and Disney+, these mergers and the resulting market concentration—often justified under the pretext of competing with these global giants and protecting the domestic industry—could pose a threat to the domestic online video service and video production sectors (Jin and Park, 2025).
Core internet sectors
Core internet services have experienced substantial growth since the 2010s, driven by the increased penetration of mobile media and the expansion of media platform services and application markets. This category encompasses two key revenue-generating sectors: the internet advertising sector and the app distribution sector. The internet advertising sector encompasses companies that derive revenue from advertising on the internet. The app distribution sector comprises major app markets, including Google Play, Apple's App Store, and the Korean domestic app market, ONE Store.
Revenue in the internet advertising market, which amounted to only 1.5 trillion KRW in 2010, rose dramatically to 8.7 trillion KRW in 2022. Similarly, revenue in the app distribution sector is estimated to have increased from 1.3 trillion KRW in 2019 to 2.4 trillion KRW in 2022. The most dominant player in this field is Naver, which recorded revenue of 1.4 trillion KRW in the internet advertising sector in 2010, soaring to an impressive 4.6 trillion KRW by 2022 (Naver, 2011; 2023). Another domestic platform giant, Kakao, saw significant growth from the mid-2010s onward as it expanded into the online media service sector. In 2016, the company's advertising revenue was 533 billion KRW, which increased to 2.3 trillion KRW by 2022 (Kakao, 2017; 2023). Meanwhile, Google maintained a monopolistic position in the app distribution sector. Google's estimated revenue from the commission fees in this sector in 2019 was 800 billion KRW, accounting for about 63% of the total sector revenue (Korea Mobile Internet Business Association, 2021). In 2022, it recorded 1.64 trillion KRW, which constituted 68% of the entire market, significantly surpassing Apple's estimated revenue of 570 billion KRW (Table 6).
Revenues for the core internet sectors, 2010–2022 (Unit: trillion Korean won, %, current prices).
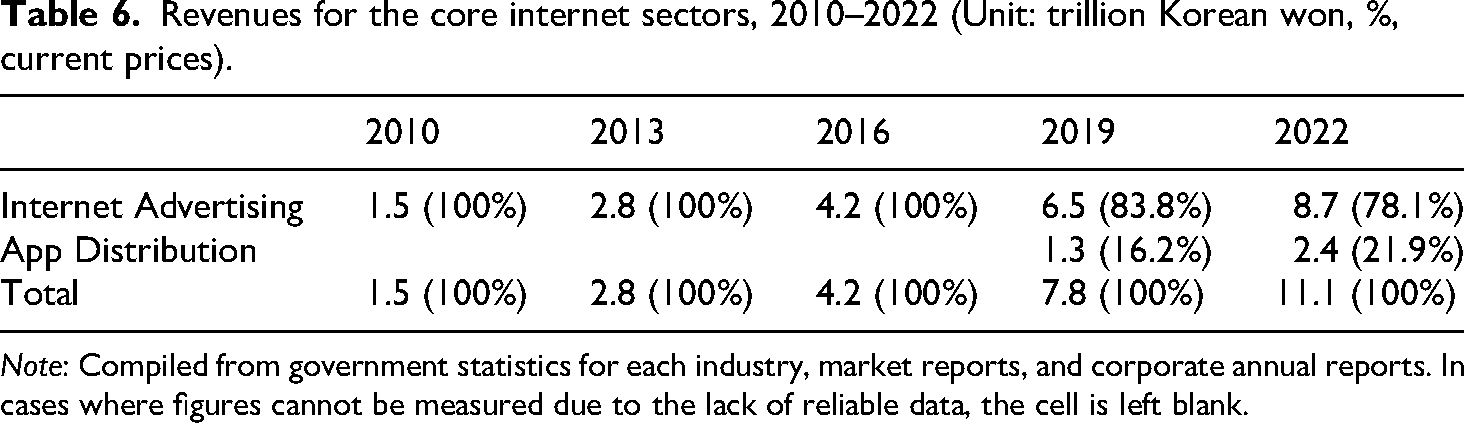
Note: Compiled from government statistics for each industry, market reports, and corporate annual reports. In cases where figures cannot be measured due to the lack of reliable data, the cell is left blank.
However, the lack of reliable data on global platform companies’ revenues and significant discrepancies in figures depending on the estimation methods make it difficult to estimate the revenue data for these sectors accurately (Kang and Jeon, 2023; Korea Mobile Internet Business Association, 2021). Since the Korean subsidiaries of Google and Facebook are limited liability companies that are not required to disclose their management affairs, they have avoided disclosing their actual revenue data, leading to issues such as underreporting revenue and tax avoidance (Kang and Jeon, 2023; Keum, 2024). In response, Korea enacted legislation requiring global companies such as Google and Apple to open their app stores to alternative payment systems and has proposed amendments to the Fair-Trade Act to strengthen regulations against anticompetitive practices by both domestic and international platform giants (Kwon et al., 2024; Sohn, 2021). Despite regulatory efforts, ongoing concerns persist regarding the effectiveness of these measures in clarifying financial activities and dismantling monopolies within these industries. Moreover, recent accusations by a nominee for the U.S. Trade Representative against Korea, alleging biased regulations against American tech companies, highlight the intricate interplay between market control, regulations, and U.S. geopolitical influences (The Korea Times, 2025). This underscores the importance of meticulously monitoring how U.S. protectionist policies impact the operations and regulations of global platform giants at both national and international levels.
The core internet sectors show higher market concentration than other areas within the network media economy. Although market concentration slightly decreased with the inclusion of 2019 app distribution revenue data, it increased again in 2022, reaching a CR4 score of 83.7 and an HHI score of 2462. From 2019 to 2022, Naver and Kakao accounted for about 60% of the total sector revenue. However, given the lack of advertising revenue data from Google, Facebook, and Apple in Korea, actual market concentration might be lower than indicated, as including these companies’ revenues would likely decrease the domestic giants’ market share (Table 7).
Concentration scores for the core internet sectors, 2010–2022.
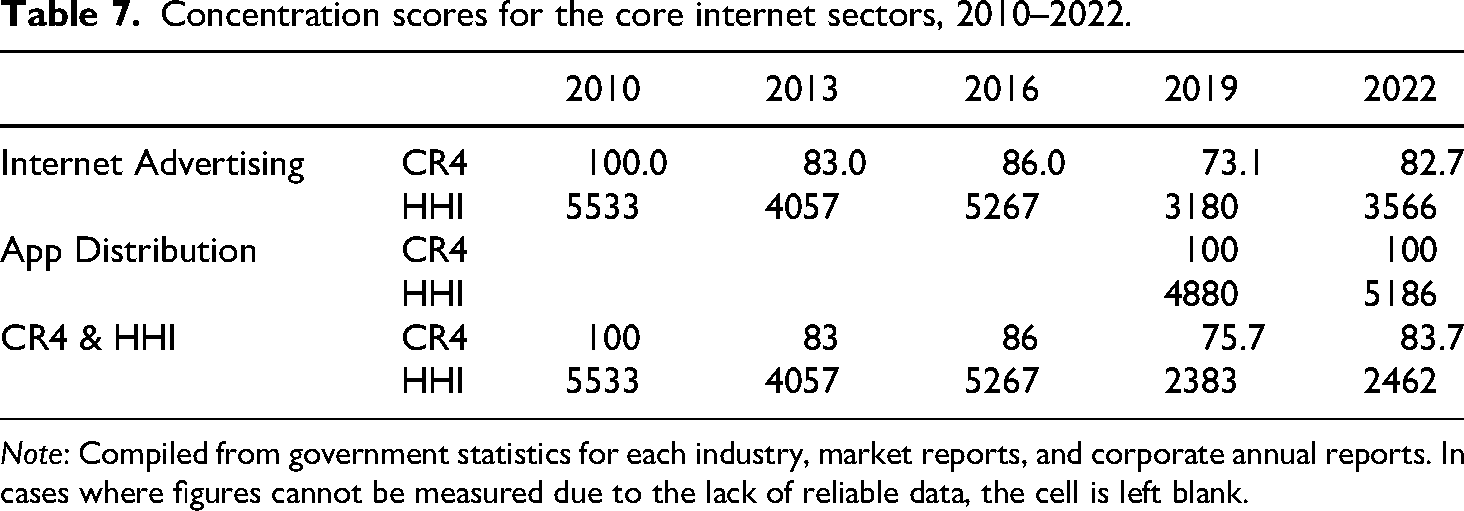
Note: Compiled from government statistics for each industry, market reports, and corporate annual reports. In cases where figures cannot be measured due to the lack of reliable data, the cell is left blank.
Development and concentration trends across the Korean network media economy
Korea's network and media economy had continued to grow from 2010 to 2022. This growth is attributed to the balanced expansion of subindustries within the telecommunications, media services, and core internet sectors. In particular, the rapid growth of online media services has brought changes to the Korean media economy, which had previously been centered around the three major telecommunications companies—though these companies still remain the most dominant players in the Korean media economy.
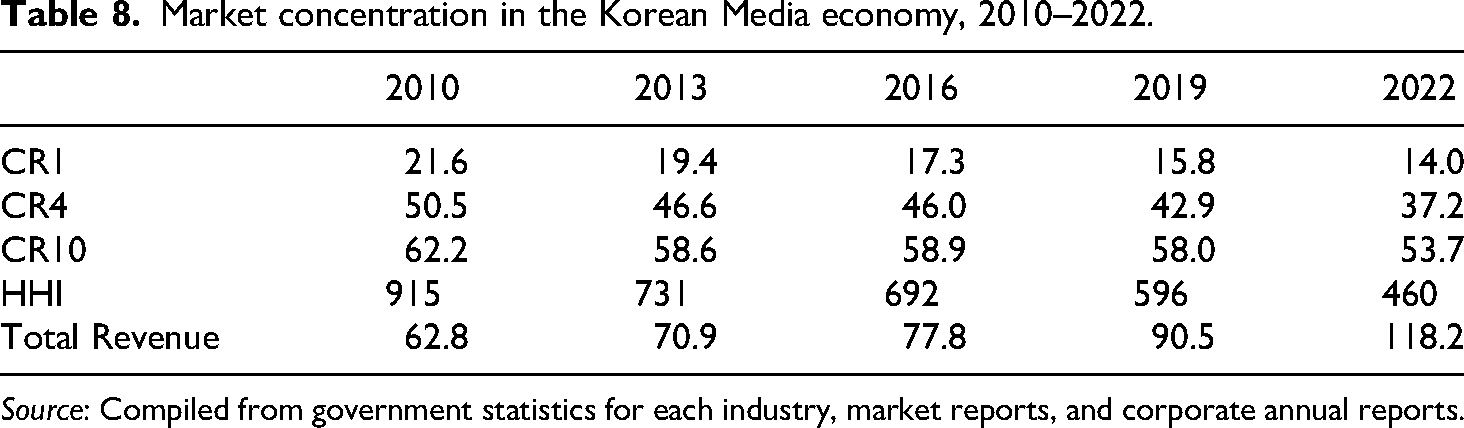
The market concentration scores of Korea's media economy, measured in three-year intervals, decreased significantly. Throughout this period, SK Telecom, the largest revenue-generating company in the Korean network media economy, saw its revenue from the surveyed business sectors increase from 13.6 trillion KRW in 2010 to 16.6 trillion KRW in 2022. However, its share of the total media economy declined from 21.6% to 14%. Similarly, the CR4 and CR10 scores continued to decrease. These scores, which were 50.5 and 62.2 in 2010, declined to 37.2 and 53.7 in 2022. The HHI score also decreased significantly, from 915 in 2010 to 460 in 2022 (Table 8).
Market concentration in the Korean Media economy, 2010–2022.
Source: Compiled from government statistics for each industry, market reports, and corporate annual reports.
Despite the rapid growth of the network media economy, the continued decline in market concentration suggests that midsized companies, as measured by revenue, have experienced significant expansion. Whereas the CR4 and CR10 scores fell throughout the 2010s, the combined share of the middle 80% of firms—excluding the top and bottom deciles—increased from 17% in 2010 to 20% in 2022. This growth has been driven mainly by domestic companies in the gaming and music sectors, as well as by new digital media services such as online video platforms and app distribution. In other words, despite the intensified oligopoly in the telecoms sector and the growing influence of global platforms, the digitalization of cultural industries and the emergence of new media services have contributed to a decline in overall market concentration. This trend raises questions about the common assumption that the digital media sector is unilaterally dominated by a handful of global players (McChesney, 2013). Instead, Korea's media economy increasingly reveals a dual structure: a few large domestic and global firms continue to control telecoms and platform infrastructure, while a diverse range of domestic actors operate across the digital media services sector (Winseck, 2024). As a result, the foundation of Korea's media economy has gradually shifted from the dominance of a few large conglomerates toward a more diversified structure led by midsized companies.
The restructuring of the Korean media economy is also reflected in the changes in the share of the three major telecom companies. While the Korean media economy grew from 62.8 trillion KRW in 2010 to 118.1 trillion KRW in 2022, the combined revenue of SK, KT, and LG increased from 30 trillion KRW in 2010 to 38.6 trillion KRW in 2022. However, the share of these companies’ revenue within the total media economy declined sharply, from 47.7% in 2010 to 42.2% in 2016 and further to 32.7% in 2022. Although they remain the highest-revenue companies in Korea's network media economy, the decline in their share has been attributed not only to the rise of midsized companies mentioned earlier but also to the revenue growth of other large corporations. Indeed, the number of companies generating revenue exceeding 1 trillion KRW from the surveyed sectors increased from 8 in 2010, including the three telecom companies, to 15 in 2022. However, beyond revenue growth, further analysis that considers operating profits and expenses of market participants, M&As, and pricing trends in the media services industries is essential to assess the sustainability and diversity of the media industry. This suggests that instead of a liberal perspective criticizing concentration and monopolization for the market's smooth operation, a critical perspective is required to understand the power dynamics and their impacts within the evolving media industry (Garnham, 2004).
Since the 2010s, the restructuring of Korea's media economy, driven by the expansion of digital and mobile media services, has also been reflected in the changing composition of leading companies in the overall network media industry. Table 9 presents the top 10 companies by revenue and their primary business sectors at three-year intervals from 2010 to 2022. During the period, the three major telecommunications companies consistently held the top three positions. Significant changes, however, occurred in the rankings of other companies. In 2010, aside from CJ, the top 10 list included traditional media service companies such as terrestrial broadcasters, along with a book publisher like Kyowon. The only companies from the IT and online media service sectors on the list were Naver, in fifth place, and Nexon, in last place.
Top 10 companies by revenue in the Korean Media economy, 2010–2022.
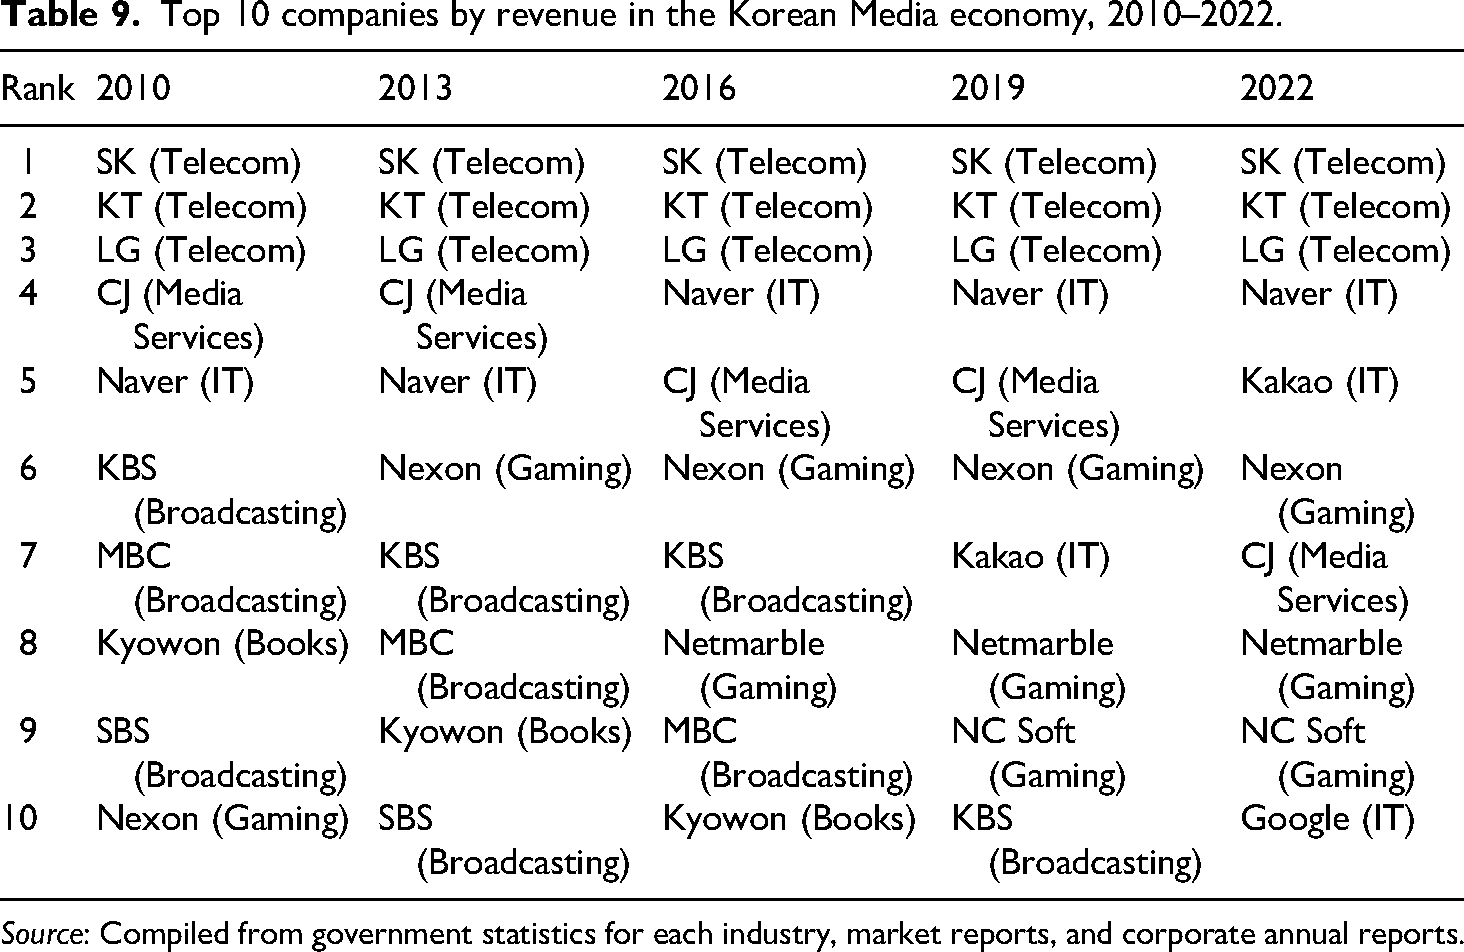
Source: Compiled from government statistics for each industry, market reports, and corporate annual reports.
By the late 2010s, companies involved in platform and cultural industries began to outpace major players in the traditional media service sectors. Naver has consistently ranked in the top four since 2016, and in 2022, Kakao joined Naver and the three major telecom companies in the top five. Additionally, in 2022, Google entered the list at the 10th spot, and gaming companies occupied three spots, replacing terrestrial broadcasters and book publishers, which had been on the list until 2016. These changes in revenue rankings reflect not only shifts in media usage patterns but also a broader shift in the industry's core focus—from traditional media to digital media, particularly to the sectors closely tied to the cultural industries.
Conclusion
This article has analyzed the rapid growth of the Korean network and media economy from 2010 to 2022. The continuous expansion across telecommunications, media services, and core internet sectors suggests that the Korean media economy is still in a phase of expansion. Meanwhile, market concentration has declined due to increased revenue from companies in the online media service sector, aside from the three major telecom companies. The stagnation of revenue in traditional media services and the decreasing share of the telecommunications sector, along with changes in the top revenue-generating companies, indicate a gradual restructuring of the media network economy around online and digital media, particularly platform industries and cultural industries. These shifts, coupled with changes in media consumption patterns, raise questions about the potential contraction of traditional media industries and a decrease in their socioeconomic influence. Moreover, it is essential to recognize that the expansion of industry size and the increase in revenues of individual companies do not necessarily imply sustainability or decentralization. As observed with online video services, market expansion and intense competition have led to rising costs and worsening financial soundness, which could potentially increase market concentration in the future.
In this context, research on industry growth and concentration should aim to comprehensively address the shifts in the media landscape, the weakening influence of specific media sectors, and changes in dynamics among industry players. The performance and market dominance of media companies are closely linked to the distribution and potential abuses of power among industry participants and stakeholders (Baker, 2007; Hesmondhalgh, 2019). Thus, the significance of analyzing the growth and shifts in concentration within the media industries will be enhanced by examining how these changes impact power relations across the entire media network economy and identifying who benefits from these dynamics.
Footnotes
Funding
The authors disclosed receipt of the following financial support for the research, authorship, and/or publication of this article: The authors received financial support for the research, authorship, and/or publication of this article through their participation in the Social Sciences and Humanities Research Council of Canada-funded Global Media and Internet Concentration Project.
Declaration of conflicting interests
The authors declared no potential conflicts of interest with respect to the research, authorship, and/or publication of this article.
Data availability statement
All data generated or analyzed during this study are included in this published article and supplementary information files, while the data sets for it and all contributors to the GMICP can be found on Dataverse, which is a public archive dedicated to preserving scholarly publications and data sets that is operated by a consortum of Canadian universities https://borealisdata.ca/dataverse/GMICP.