
Abstract
Accident prevention depends on accident analysis. In order to improve the reliability of accident analysis and find the common problems related to reliability in accident analysis, two groups of four papers of master’s and doctor’s theses which applied 24Model to analysis coal mine gas explosion accident were selected as samples. The unsafe act results obtained from the analysis are compared. The results show a low consistency level, which reflects that the reliability of the output needs to be improved. Through analysis, the inconsistency of details in causes description, the difficulty in the cause description and the omission of unsafe acts are the main reasons leading to the above situation. In order to standardize the description of cause items, the components of unsafe acts were defined as “premise + action”, and seven types of premises were summarized to judge unsafe acts. In order to improve the efficiency and reliability of accident analysis, it is suggested that the current data should be taken as reference, and the taxonomy based on consequences should be established to unify unsafe act detail description level, and the corresponding computer software should be developed to assist accident analysis.
Introduction
Retrospective analysis of accidents and learning lessons from the past are effective means to prevent accidents from happening again.1–3 Since Heinrich’s time and even earlier, the study of accident analysis has been on the rise. 4 In these studies, some scholars studied and analyzed typical accidents with significant impacts in order to dig out the deep-seated causes of accidents.5–9 Some other scholars analyzed specific fields or specific types of accidents in a period of time to obtain common causes of accidents by statistical induction.10–13 With the help of these studies, specific causes and key nodes of accidents can be obtained, so that knowledge training and hazard identification can be targeted, so as to formulate more targeted measures to prevent accidents.
However, accident analysis is different from experimental analysis in other research fields, and its analysis process is often difficult to be replicated by others. What is presented to readers is usually the results that have been classified and processed. 14 Therefore, when applying the results of accident analysis, it also raises the question: whether different analyst will get the same results when analyzing the same case.15,16 Further thinking, the final recommendations of accident analysis research are often related to the frequency of accident causes obtained by analysis. If the accident causes obtained by multiple analysts are different, and the frequency of accident causes is inconsistent, the reliability of the suggestions obtained will be greatly compromised. 17
The above thinking can be summarized as thinking about the reliability of accident analysis results. Reliability refers to the similarity of the results obtained by using the same working method under similar conditions in a given time. 18 At present, most of the research on the reliability of accident analysis results focus on the reliability of accident analysis methods, which refers to the consistency or repeatability of the results obtained by using a method. 19 Jacinto and Aspinwall 20 argue that the ability to learn the right lessons from accidents and use them confidently depends on effective and reliable methods. Conclusions can be made if various investigators reach the same conclusions (the method is reliable) and if the method demonstrates that the findings will be present in future accident scenarios (the method is valid).21,22 Johnson and de Almeida 23 used AcciMap and STAMP to analyze the same accident to illustrate the application of the two different technologies and put forward considerations on validity and reliability, that is, if other analysts were to apply STAMP and AcciMap to the same accident, whether they would come to the same conclusion. Salmon et al. 24 used AcciMap, HFACS, and STAMP to conduct a comparative analysis of Mangatepopo Canyon events, revealing the differences in reliability between the three methods. Underwood and Waterson 25 evaluated ATSB, AcciMap and STAMP from two aspects of system thinking application and usage characteristics, and believed that the qualitative nature, classification, and usage guidelines used in the method affected the reliability of the method.
In addition to the above comparative studies among various methods, there are also some studies conducted experiments to evaluate the reliability of a single method. Olsen and Shorrock 16 used three studies to evaluate the reliability of HFACS-ADF in specific ADF air traffic control (ATC) units, and the results showed that the reliability of HFACS-ADF needs to be improved. The reasons leading to the lack of reliability are related to the underlying HFACS model and categories, the HFACS-ADF adaptations, the context of use, and the conduct of the studies. Chen and Wang 26 reviewed 14 references reporting HFACS reliability data from 2001 to 2014, and summarized the factors affecting HFACS reliability, such as training, sample size, and deviation from the original framework. Ergai et al. 27 conducted the incident analysis process on its own, using a large number of trained coders and multiple real-world accident causal factors from a variety of industries to evaluate the reliability of HFACS. The latest study is led by Hulme et al., 28 who organized a large number of participants to analyze the same accident using three methods of AcciMap, STAMP-CAST and AcciNet, and evaluated the validity and reliability of the above three methods based on Signal Detection Theory (SDT).
The previously mentioned studies on the reliability of accident analysis results mostly focus on consistency among different analysts or within analysts and the degree to which different analysts analyze the same case, or the same analyst analyzes the same case, at different times and produces similar results is taken as the evaluation index of reliability.29–31 However, accident analysis is a complex and dynamic process, the results of which are not only affected by accident analysis methods, but also by data, analysts, and other factors (as shown in Figure 1). 32 The European Safety Reliability and Data Association (ESReDA) also mentions the complexity of accident investigation. For one thing, accident analysis is a nonlinear and iterative process, in which the analyst may redefine the information of the previous stage based on the currently collected data. For another thing, each analyst has his background knowledge and expertise, which affects his initial representations and the way he collects data and conducts analysis. Therefore, the consistency of accident analysis results essentially reflects the reliability of the entire accident analysis process. Previous studies have focused on the methods, regardless of the common problems in the process of accident analysis, which are unrelated to the method. To this end, this study collected some samples of accident analysis and conducted a systematic review of the results to find the common problems affecting the consistency of accident analysis results. This contributes toward presenting relevant suggestions for improving the reliability of accident analysis results.
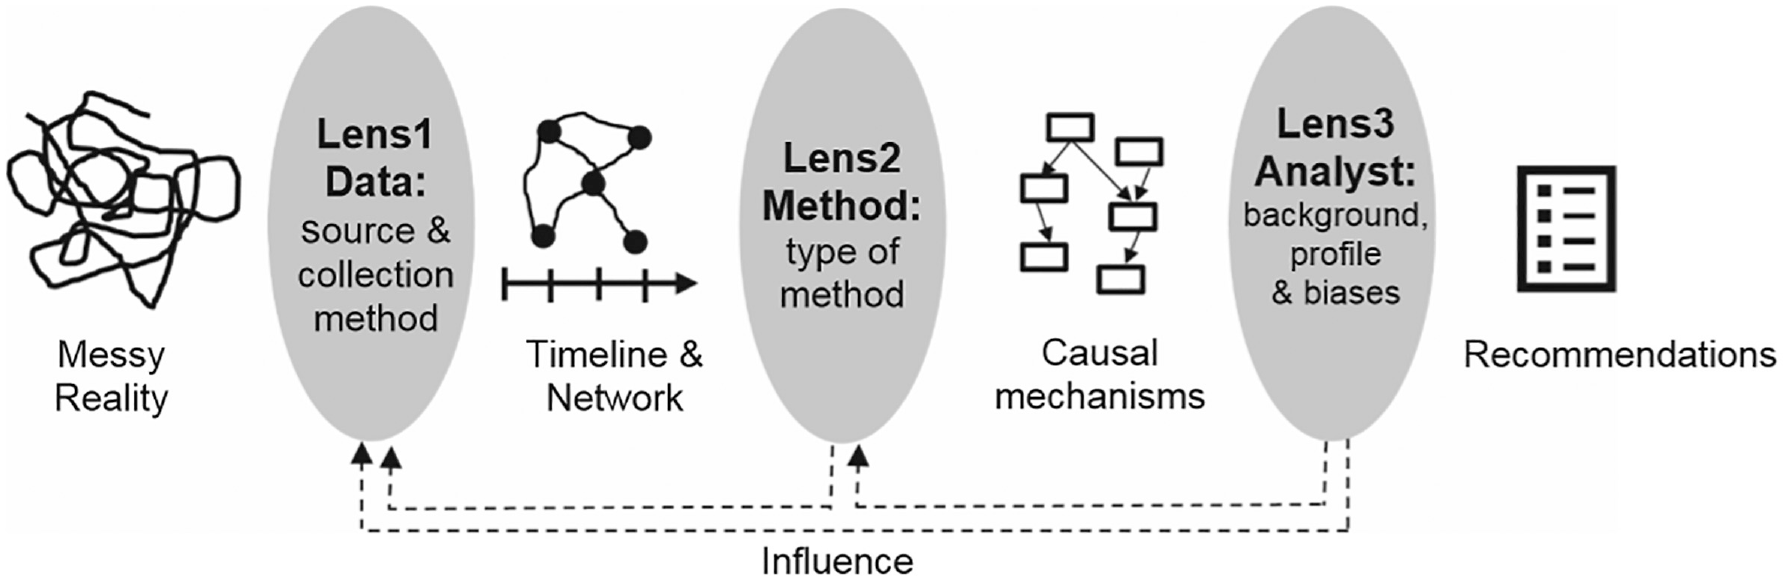
Three “lenses” which influence accident analysis. 31
The samples and methods used to evaluate the consistency of the accident analysis results are first determined in Section 2. Section 3 presents the qualitative and quantitative comparative analysis results. Section 4 discusses the problems reflected in the comparative analysis results, along with factors affecting the reliability; furthermore, the corresponding suggestions are discussed. Finally, Section 5 presents the conclusions and a vision for future work.
Method
In this study, the consistency among different analysts, as described in Section 1, was adopted as an indicator to evaluate reliability, that is, to evaluate the reliability by comparing the consistency of the results obtained by different analysts analyzing the same accident data.
Sample selection
The samples were obtained in two ways. First, several analysts were organized to conduct accident analysis and the analysis results were compared, allowing for a certain amount of manpower and time loss. Second, existing references were collected as samples and the results were analyzed. However, most of the references are presented as a “black box,” which typically presents highly concise results, lacking details of the results of accident analysis.16,33 However, the graduation thesis samples used by Goncalves Filho et al. 31 provide inspiration for this study: the graduation thesis is peer reviewed and the quality is guaranteed. In addition, the length of the graduation thesis is relatively small, which allows the author to list some “raw meat” data in the attached table to provide more details of the sample.
24Model is an accident causation model proposed by Fu et al. 34 The model divides the accident causes into two behavioral levels: organization and individual. At the organizational level, accident causes can be divided into two stages: safety culture and safety management systems. While at the individual level, accidents can be divided into two stages: habitual behaviors, which include knowledge awareness habits, and one-time behaviors, which include unsafe acts and material states. 35 The logic of the accident is that the lack of the safety culture leads to problems in the safety management system, which in turn leads to insufficient personal safety knowledge, low safety awareness, and poor safety habits. Insufficient personal safety ability leads to unsafe acts and unsafe condition which ultimately leads to the accident (see Figure 2). The above logic, in turn, is the path of accident analysis (for the definition of the latest version, please refer to the literature of Fu et al., 36 and for the display of specific accident analysis, please refer to the literature of Jia et al. 33 )
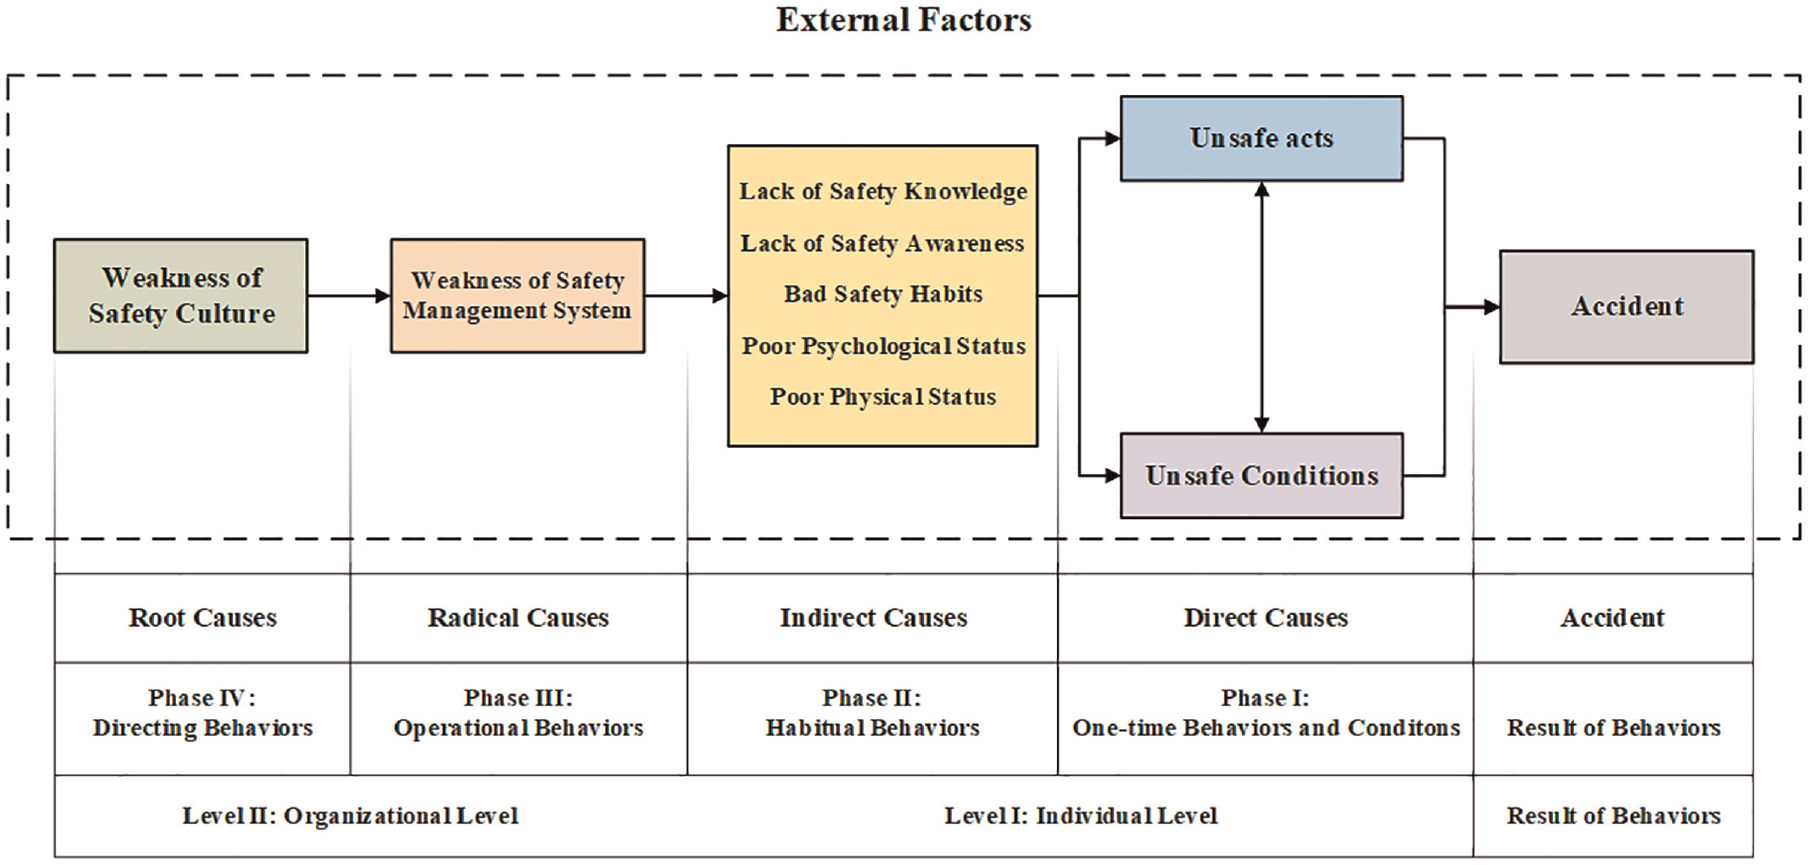
The fourth edition of the 24Model. 35
Since it was first proposed in 2005, 24Model has been applied in coal mines,37–39 general aviation,40,41 food, 42 chemical43,44 and other fields, with certain results in accident analysis and accident prevention, especially in coal mines. 45 Consequently, a large amount of statistical data on unsafe acts in coal mine accidents has been retained. So far, nine master’s and doctor’s theses have used 24Model to conduct statistical analysis of coal mine gas explosion accidents and the unsafe acts obtained were one of the main contents of these theses. Combined with the previous discussion on sample acquisition, these theses were initially selected as samples to measure the consistency of accident analysis results.
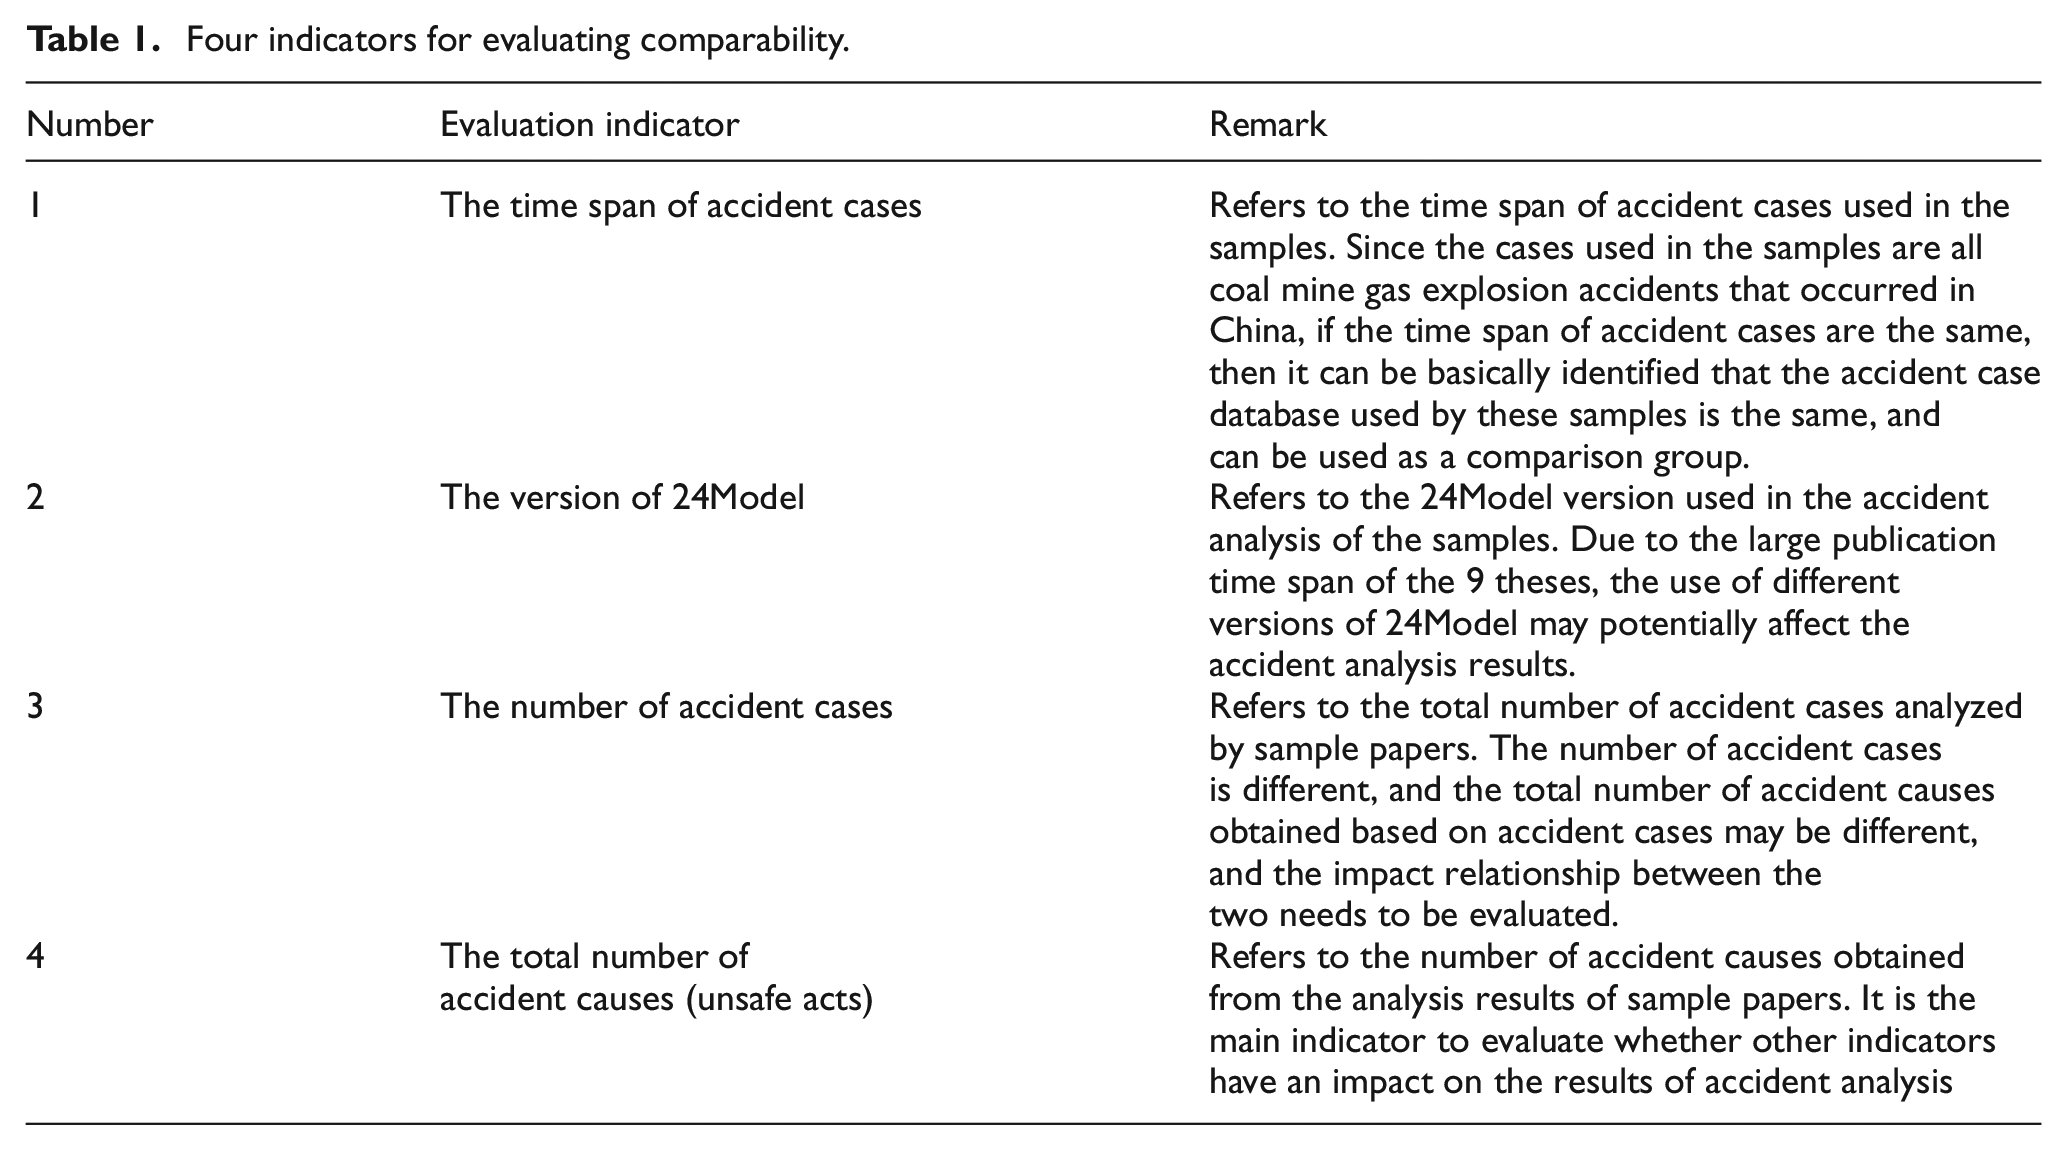
Comparability between samples is the prerequisite for the consistency assessment of accident analysis results. However, since the version of 24Model has undergone four changes, the samples use different versions of 24Model, and the time span of the accident analysis cases is also different. Therefore, it is necessary to evaluate the comparability between samples first. The evaluation indicators and their meanings are shown in Table 1. See Table 2 for the specific information of the nine preliminarily established samples corresponding to the four evaluation indicators.
Four indicators for evaluating comparability.
The information of the nine preliminarily established samples corresponding to the four evaluation indicators (references are sorted by publication time).

It can be found from Table 2 that there are three groups of literatures with the same case time span, the numbers are 1 and 2; 3, and 4; 8 and 9, and the model versions used in these three groups intra are the same. Therefore, each comparison group can eliminate the potential interference of the model version on the accident analysis results, it is proposed to use the three groups of literatures as the comparison group.
Theoretically, there is a clear quantitative relationship between the number of accident cases and the total number of accident causes: assuming that the accident causes are all unique to the accident database, and the volume of information contained in each accident case is similar, then with the increase in the number of accident cases, the number of accident causes obtained by analysis must show an obvious positive linear growth. However, the difference between reality and hypothesis is that most of the causes of gas explosion accidents are similar. Taçgın and Sağır 55 adopted a knowledge generalization approach to obtain “domain-free” accident causes that are free from accident scenarios. The results show that when the “domain-free” accident causes based on eight accidents are applied to the other two accident samples, and the coverage rate is as high as 89.47% and 73.01%; Yin et al. 56 analyzed the major gas explosion accidents in China from 2000 to 2014, and found that 23% of gas explosion accidents involved the participation of unsafe behaviors of “Illegal blasting.”“Failed to detect the gas concentration timely,”“Not or illegal installing fan,”“Maintain electrical equipment illegally” accounted for 8.9%, 6.5%, and 6.1% of the accidents respectively. Therefore, the total number of causes and the number of accident cases should obey the following relationship: when the number of accident cases is small, the total number of causes and the number of accident cases show a positive linear relationship; After the accident causes are analyzed and counted one by one, the growth rate of the total number of causes will gradually slow down and a marginal effect will appear.
In order to further verify the correctness of the hypothesis, a set of statistical data of gas explosion accident analysis analyzed by the research group was visualized. The sample of the accident analysis is a total of 194 heavy and extremely large gas explosion accidents that occurred in China from 2000 to 2009. The accident analysis did not use any accident cause theory, nor did it use classification methods for hierarchical division, so the cause relationship obtained by the analysis is flat. The causes of each accident are recorded separately. The data has undergone two corrections. The correction work has verified the reliability of the analysis, and in order to streamline the accident causes, similar causes have been merged. The number of accident causes obtained from the three sets of accident analysis (including two sets of corrections) are 379, 317, and 192 respectively. These data have been uploaded to the Mendeley Data database for peer review. 57
The data used for visualization are the number of accident cases (horizontal axis) and the total number of accident causes obtained by cumulative analysis (vertical axis). Every time an accident is read, the reasons obtained from the accident analysis are added to the accident causes database. The total number of accidents causes in the current database is calculated and returned after a deduplication operation. Considering the small number of samples, referring to the idea of k-fold cross-validation, random sampling is performed when reading accidents. Each set of data is repeatedly sampled three times randomly, so a total of 3 × 3 = 9 curves are obtained as shown in the Figure 3 (The visualization is done by python, and the algorithm has been uploaded to the Mendeley Data 57 ). The result is basically in line with the hypothesis. Due to the interference of the analyst’s subjective factors and the difference in the accident case span, the curve will change in shape, but the overall trend will not change.
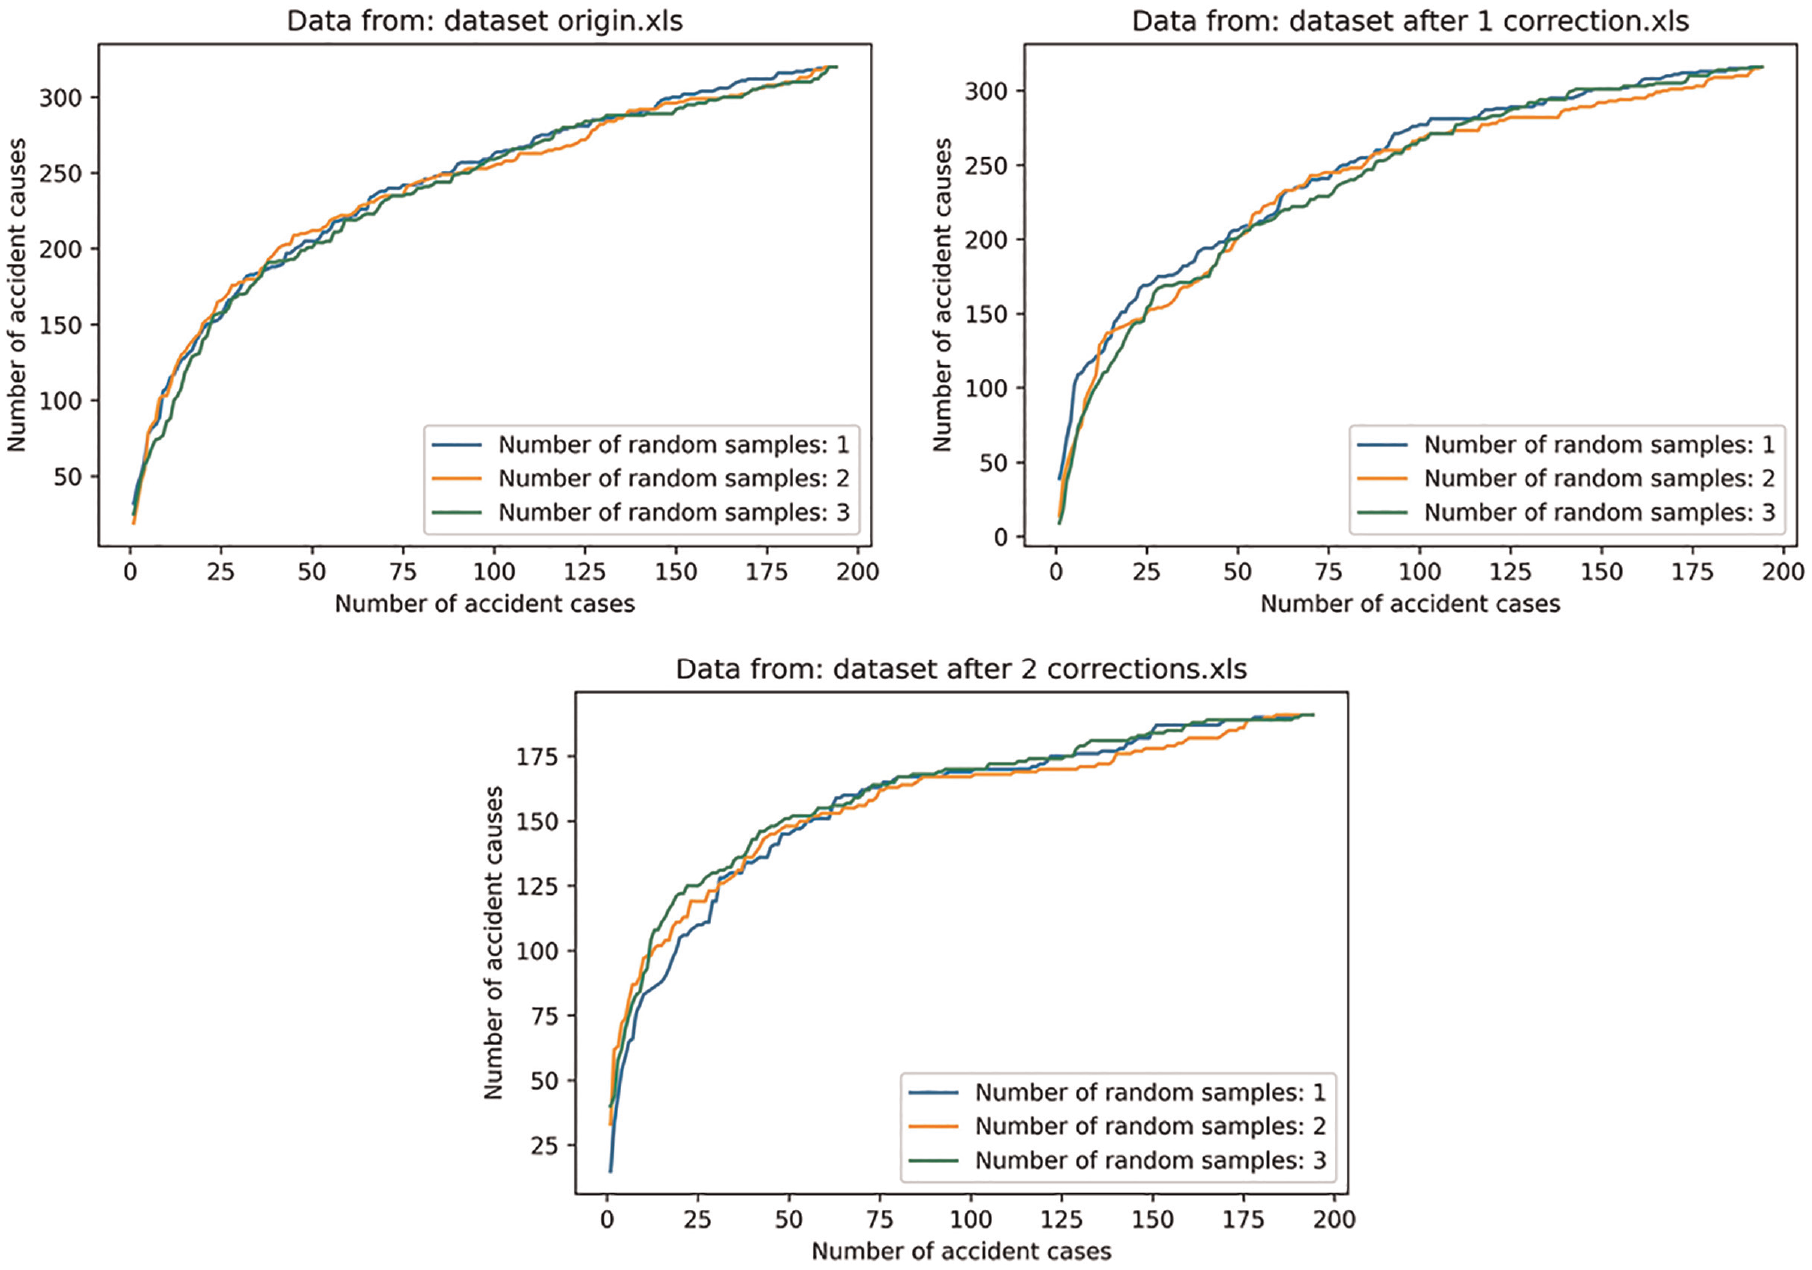
The quantitative relationship between the number of accident cases and the total number of accident causes based on three sets of data.
Returning to the original purpose, if the number of accident cases used by the two samples in the comparison group is located in the area with a higher slope of the Figure 3, the total number of accident causes obtained by the two samples will be too large due to the difference in the number of accident cases, which is not suitable for comparison; otherwise, it can be used as a comparison group.
In the comparative group composed of References 1 and 2, the number of cases of the former is twice that of the latter, and the total number of identified accident causes differs by 53, which is a huge gap. The influence of the number of accident cases on the analysis results cannot be excluded, so it is not suitable as a comparison group; In the comparative group composed of References 3 and 4, the numbers of the two cases are 93 and 105 respectively. According to the Figure 3, when the number of cases is less than 25, the number of cases will have a significant impact on the number of accident causes analyzed; References 3 and 4 have a relatively large base in the number of cases, and the difference is small (Reference 4 has 12 more accident cases than Reference 3). Although the total number of accidents causes of the two references is different (152 − 58 = 64), It can be concluded that the number of accident cases is not the main reason for this result, so it can be used as a comparison group; References 8 and 9 have the same number of accident cases, and the total number of identified accident causes differs by one, which is very suitable as a comparison group.
In summary, the comparison group was finally determined to be two groups, namely Reference 3 and 4 and Reference 8 and 9, numbered as A and B.
Criteria and procedures for consistency evaluating
The subsequent consistency evaluating (i.e., comparative analysis) was jointly conducted by three authors who have been engaged in accident analysis research for more than 5 years, with extensive experience in the field.
There are two indicators for comparison: 1) The description of the specific cause in the analysis results. If cause descriptions with the same meaning exist in the results obtained by the analyst, the two analysts are judged to be in agreement on the cause. This is the key indicator of consistency of results between analysts; 2) The frequency corresponding to specific cause. Since Reference 8 and 9 are based on the same case in control group B, the statistics of frequency were specially introduced in control group B. If two analysts agree on the description of the same cause, but the statistical frequency is different, it indicates that there are omissions or errors in analysis.
The first author of this paper led the carding and comparative analysis of the causes of the accident, and the results were verified by other authors. In the verification, it was found that different analysts may use different languages when referring to the same causal factors or recommendations. Thus, it is necessary to judge whether there is consistency between different wording and formats of cause items, which is mentioned in the article by Goncalves Filho et al. 31 Contrarily, it is difficult to trace the results obtained from the samples of a large number of statistical analyzes of accidents, and it is impossible to judge whether the suspected corresponding unsafe acts in the two studies are consistent in combination with specific accident investigation reports or other information sources. Therefore, four indicators in Table 3 are used to deal with different corresponding situations. In addition, we identified two types of cause characteristic affecting the reliability of accident analysis results. These reasons and characteristics exist within the analyst and are independent of the comparative analysis, as shown in Table 4.
Descriptions and examples of four types of correspondence.
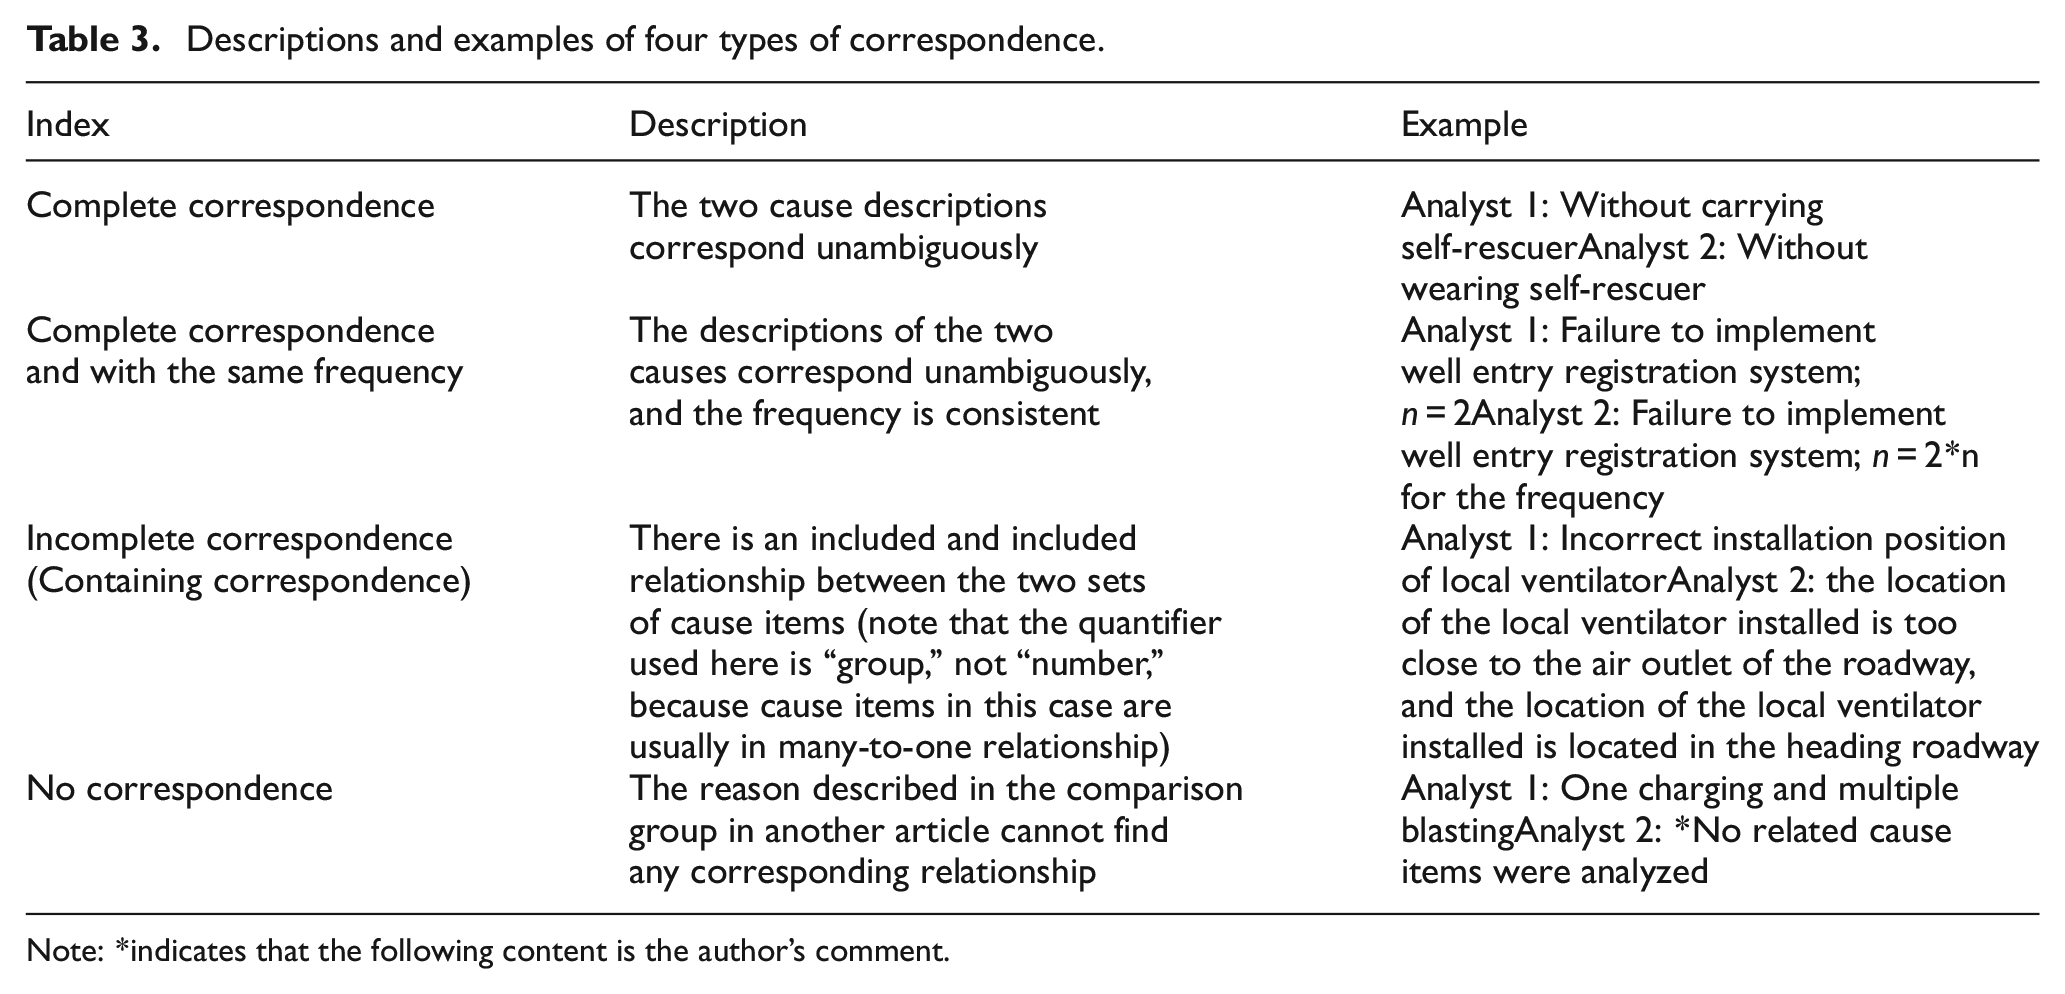
Note: *indicates that the following content is the author’s comment.
Description and examples of the two types of causes characteristics.
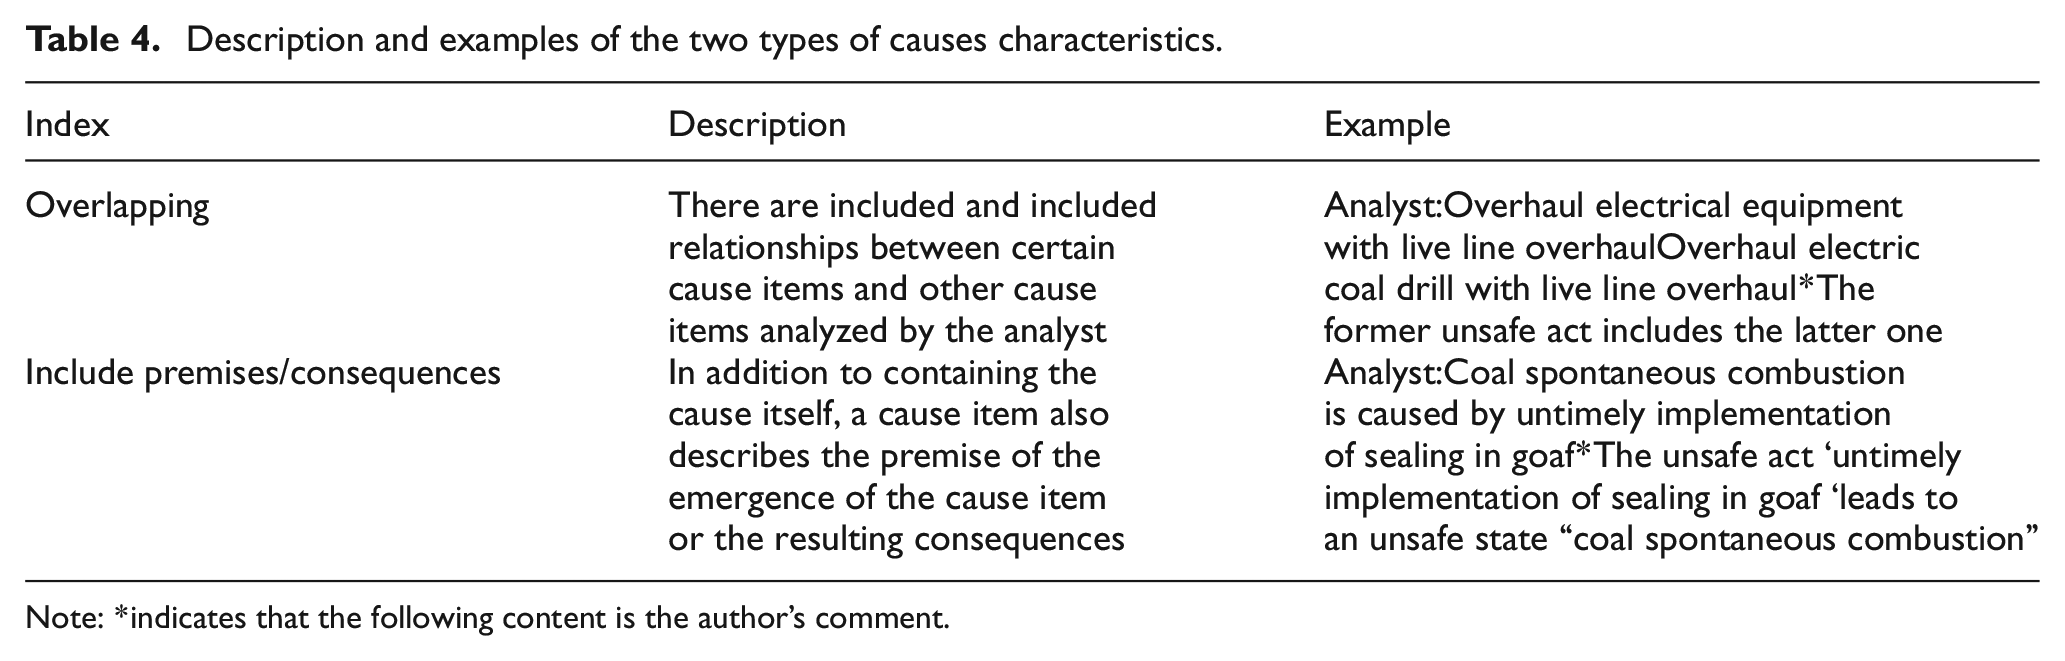
Note: *indicates that the following content is the author’s comment.
The relationship among the two comparison indicators, the four corresponding relationship indicators and the two types of cause characteristic is shown in the Figure 4.
The relationship among the two comparison indicators, the four corresponding relationship indicators and the two types of cause characteristic.
Comparative analysis results
The feature of “cross repetition” of causes makes it difficult to count the items of accident causes. There are cases in which an analyst can find an exact corresponding item in another analyst’s analysis, but cross-duplications exist in its analysis results of unsafe acts. In this case, the items obtained by the other analyst have both perfect and incomplete correspondence. To avoid this situation and consider the possible impact of this situation on the application of accident analysis results, the corresponding relationship of accident causes with cross-repetition relationship is uniformly classified as an incomplete correspondence in this paper.
The proportions of different correspondence relationships in each comparison group are shown in Figure 5, and a summary of the comparative analysis results is shown in Table 5. As mentioned above, the reason for an imperfect correspondence is usually a many-to-one relationship, counted as a group. In addition, the total number of unsafe act items involved is recorded. Similarly, the causative trait “cross repetition” uses these two counting indicators to show quantitative relationships. The complete consistency rate is the ratio of the number of unsafe acts with a completely corresponding relationship to the total number of unsafe acts combined with deduplication in the contrast group. Due to the lack of frequency for some causes in Reference 9 in the comparison group B, an inequality is used to show the quantitative relationship.
The summary of comparative analysis results.
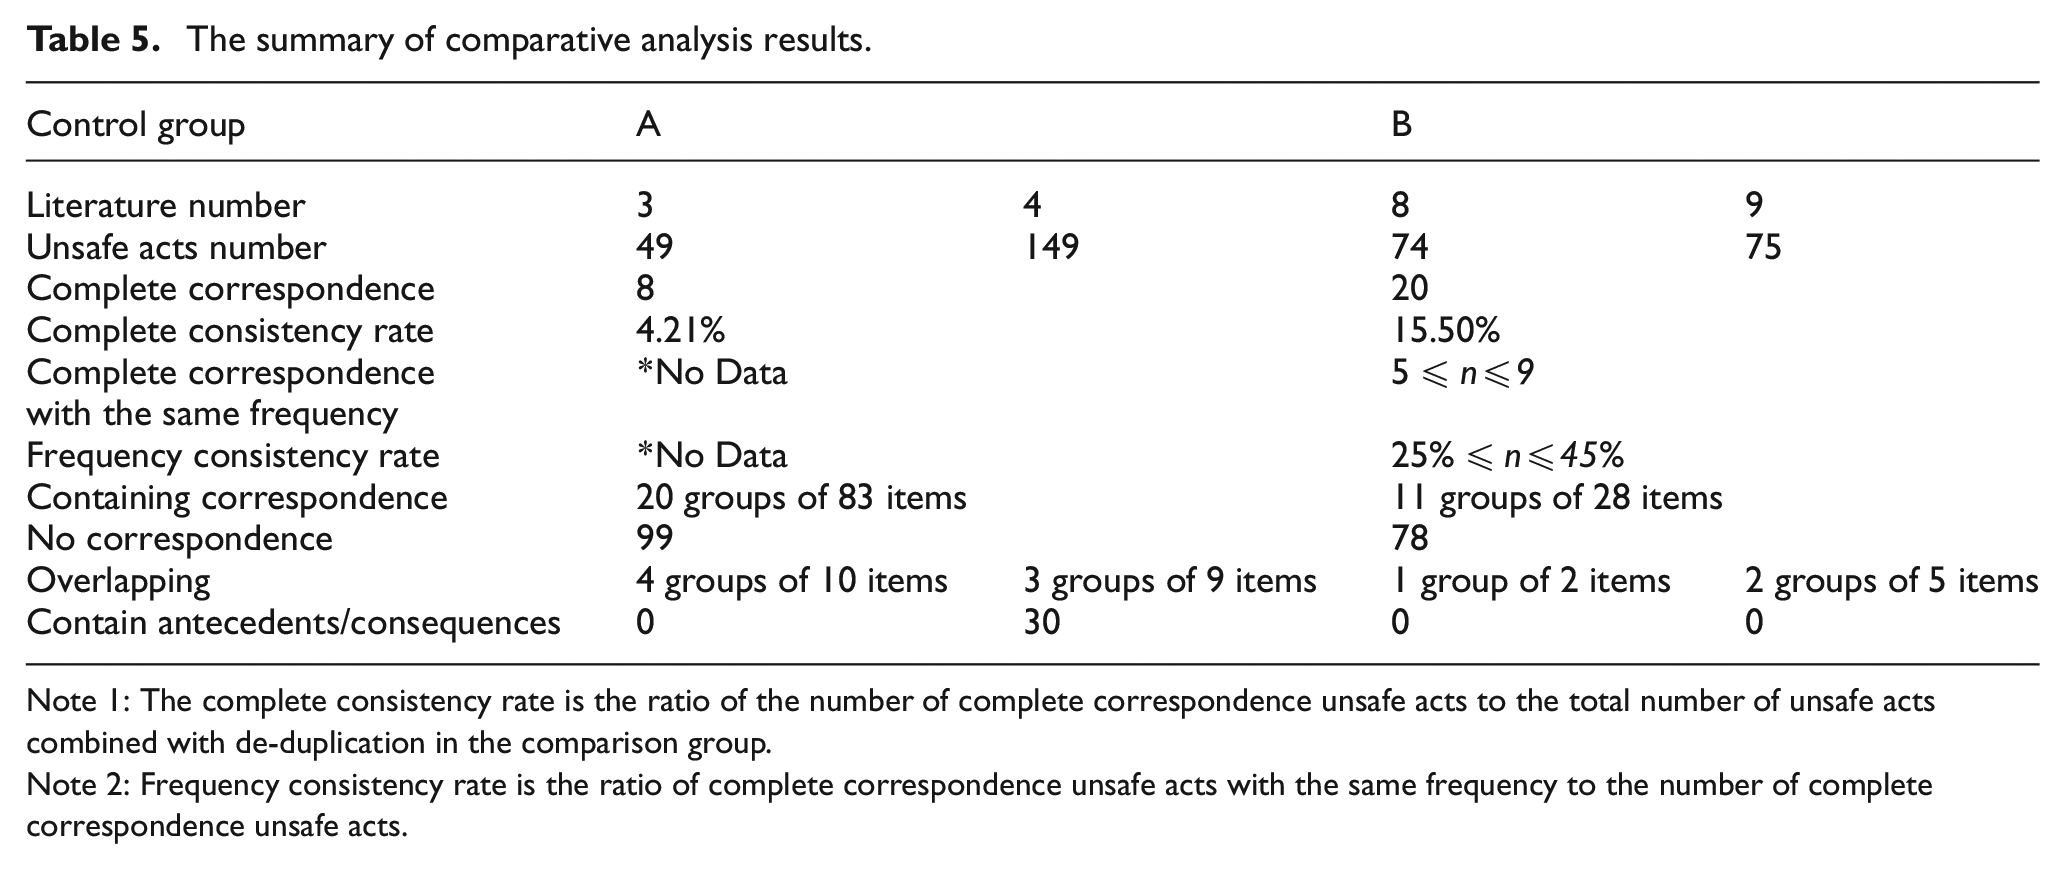
Note 1: The complete consistency rate is the ratio of the number of complete correspondence unsafe acts to the total number of unsafe acts combined with de-duplication in the comparison group.
Note 2: Frequency consistency rate is the ratio of complete correspondence unsafe acts with the same frequency to the number of complete correspondence unsafe acts.
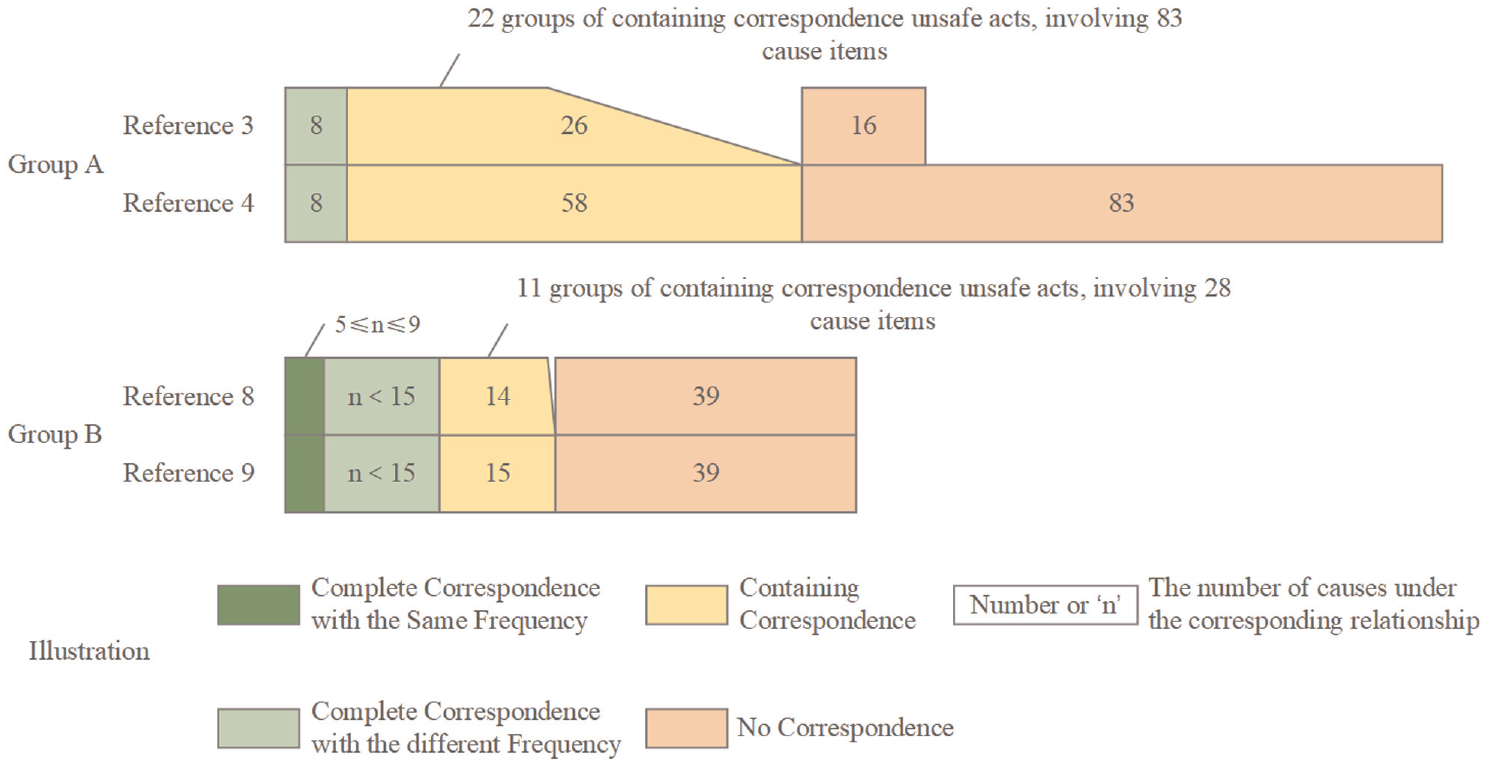
The proportions of different correspondence relationships in each comparison group.
Discussion and suggestions
The results of the previous chapter showed that the consistency of the samples on the statistics of unsafe acts is at a low level, with the complete consistency rate only reaching 4.21% and 15.50%. In the complete correspondence cause items of group B, the frequency consistency rate is 25%–45%. The low consistency is manifested in three corresponding relationships: incomplete correspondence, complete no correspondence, and complete correspondence with description but inconsistent frequency, as well as two characteristics of cross repetition and separable cause, which indicates that the reliability of accident analysis results needs to be improved. Further analysis revealed that the problems presented in the above results intersect, and the corresponding solutions or suggestions recur. Therefore, this section classifies and discusses the problems presented above.
The inconsistency of details in causes description
The inconsistency of details in causes description is the key problem presented by cross repetition and incomplete correspondence, which is further aggravated by cross repetition.
For example, in comparison group A: Reference 3 obtains the cause items: 1) Improper emergency disposal of gas overrun; 2) People were not evacuated in time; 3) The power is not cut off in time. Among them, 1) essentially includes the latter two, which is a cross-duplication.
Reference 4 analyzed the following reason items, and there are also cross-duplication among them: 1) The detected gas exceeded the limit, and the tile inspector commanded the power failure and withdrawal, but the employees did not listen to the production; 2) The gas was detected to be over the limit, but the production continued without power failure or withdrawal; 3) The gas was detected to exceed the limit, but continued to direct production, without power outage, and evacuation; 4) Failing to evacuate all personnel to a safe position; 5) After the gas outburst, the power supply in the area affected by the outburst was not cut off in time, and people were evacuated;
Although Reference 3 and 4 describe the content of these reason items similarly, the detailed description has never reached agreement. In addition to the internal overlap of Reference 3 and 4, it is difficult to determine the correspondence between the reasons, so they are unified into a set of incomplete correspondences.
Due to the different details displayed, when discussing the cause of the accident, unsafe acts with less details and a more general description will naturally include unsafe acts with relatively rich details. The nature of the incomplete correspondence mode and cross repetition are the same, both of which belong to the inclusion relationship between reasons. The difference lies in that the difference in the description details of unsafe acts reflected by the former exists among the inter-analysts, while the difference reflected by cross repetition exists among the intra-analysts.
The source of the data—that is, the accident investigation report—is the objective reason for the inconsistencies in the detailed description of the cause. Official accident databases do not always provide all the information needed, 58 and descriptions of accident details vary. Consider the following two paragraphs from the accident investigation report as examples to show the differences in the description of accident causes in detail (both reports are extracted from the main data sources of four papers).
“……2.1 Immediate accident causes (1) chaotic local ventilation management. On 8 January the wind duct was disconnected at the door when the new pointcuts were tunnelled in the morning. As a result, the roadway above the new pointcuts was windless for 5m. The drivage face of the pointcuts was only 3m away from the upper mining area. Due to the influence of dynamic pressure, the cracks in the coal pillar increase, and the accumulated gas in the original upper goaf escapes from the crack, resulting in an increase in the gas concentration in the new pointcuts. In addition, the poor sealing quality of the old pointcuts resulted in gas accumulation and escape, which resulted in a high gas accumulation area near the new pointcuts in the No.1908 transportation lane. (2) The ‘One blasting three times inspection’ system was not implemented before blasting. (3) The blaster explosion-proof failed and detonated the gas with explosive concentration (there was no other electrical equipment near the explosion site observed on the spot)…….” 59
“……3.1 Immediate accident causes: Due to the lack of wind on the back-mining working face of the +8m level roadway on the 11th floor, gas accumulated, and the blasting flame ignited the gas, resulting in a gas explosion.” 59
The first accident investigation report clearly highlights the specific action causes and physical state causes of the gas explosion. In contrast, the second accident investigation report only provides a broad description of the action, without the same level of detail for unsafe acts such as the shooting operation.
Building modular structures is a common method used in accident analysis to improve reliability.24,27,60 Wills et al. 61 developed the “Chicago Children’s Supervision Taxonomy” which operationally defines supervision based on the age of an injured child and the ages, familiarity, and proximity of that child’s companions and providing a basis for making precise intervention recommendations.
Shorrock and Kirwan 62 constructed an interrelated taxonomy in TRACEr, arguing that this structure allows analysts to describe errors at the level supported by existing evidence and allows users to select the classifications related to the accident background, thus improving the efficiency of resource use. Goode et al. 63 believed that, compared with the non-classification method, providing classification scheme guidance could obtain more reliable results. Therefore, establishing a more detailed classification system and unifying the detail description level of unsafe acts are key to solving the above problems.
The difficulty in the cause description
Among the four sample references, 30 cause items in Reference 4 contained antecedents/consequences, leading to the description of the cause items being inadequately standard, which makes it difficult to evaluate the consistency of unsafe acts, and also leads to the occurrence of partial incomplete correspondence relations. For example, Reference 3 analyzes the unsafe act “Over boundary/stratum mining” and Reference 4 analyzes the unsafe act “Over stratum mining leads to insufficient ventilation capacity,” the latter increases the description of the consequences compared with the former. However, over stratum mining will not only lead to insufficient ventilation capacity of the mine, but also lead to other consequences such as connection with neighboring mines or mined-out areas, turbulence in the ventilation system, etc. In addition, because over boundary mining is an act of stealing national resources, the mining roadways with super-layer layout will be very simple and lack sufficient safe exits. Once an accident occurs, the loss is usually large. Therefore, it cannot completely correspond to the “Over boundary/stratum mining” obtained in Reference 3.
In the statistical analysis of multiple accidents, the analysis results are usually presented by the table that hides the logical relationship of the accident, and certain details will be lost in each classification and description of the cause of the accident. When the cause item contains only a single action, it is difficult to articulate it. Therefore, in the cause items of including antecedents and consequences, ancestral causes and consequences usually have a clear primary and secondary status, and analysts often use consequences to explain antecedents as subjects. In the cause item of including antecedents, premises are used to describe the context in which the action takes place, reinforcing the “unsafe” judgment. This also indicates that in large-scale accident statistical analysis, the readability of accident statistical analysis results will be greatly reduced if the readers do not know the overall situation of accident samples.
In order to solve the difficulty in cause description, it is suggested to use the framework based on consequence classification for cause items containing consequences. While keeping the single cause of accident in the items, it is also suggested to supplement it with classification. For example, “tree techniques” prioritize complex information about accidents that have occurred by constructing a causal tree structure. This consequence-based classification method corresponds to the three-elements classification method of gas explosion which is very frequently used in relevant studies in coal mine gas explosion accidents.
When analyzing the cause items of including antecedents and consequences, it is found that both the explanatory consequences and the supplementary antecedents show some common preferences of the analysts when describing the cause of the accident, which in turn can provide reference for setting up intermediate indexes in the analysis system or setting up cause nodes in the accident tree.
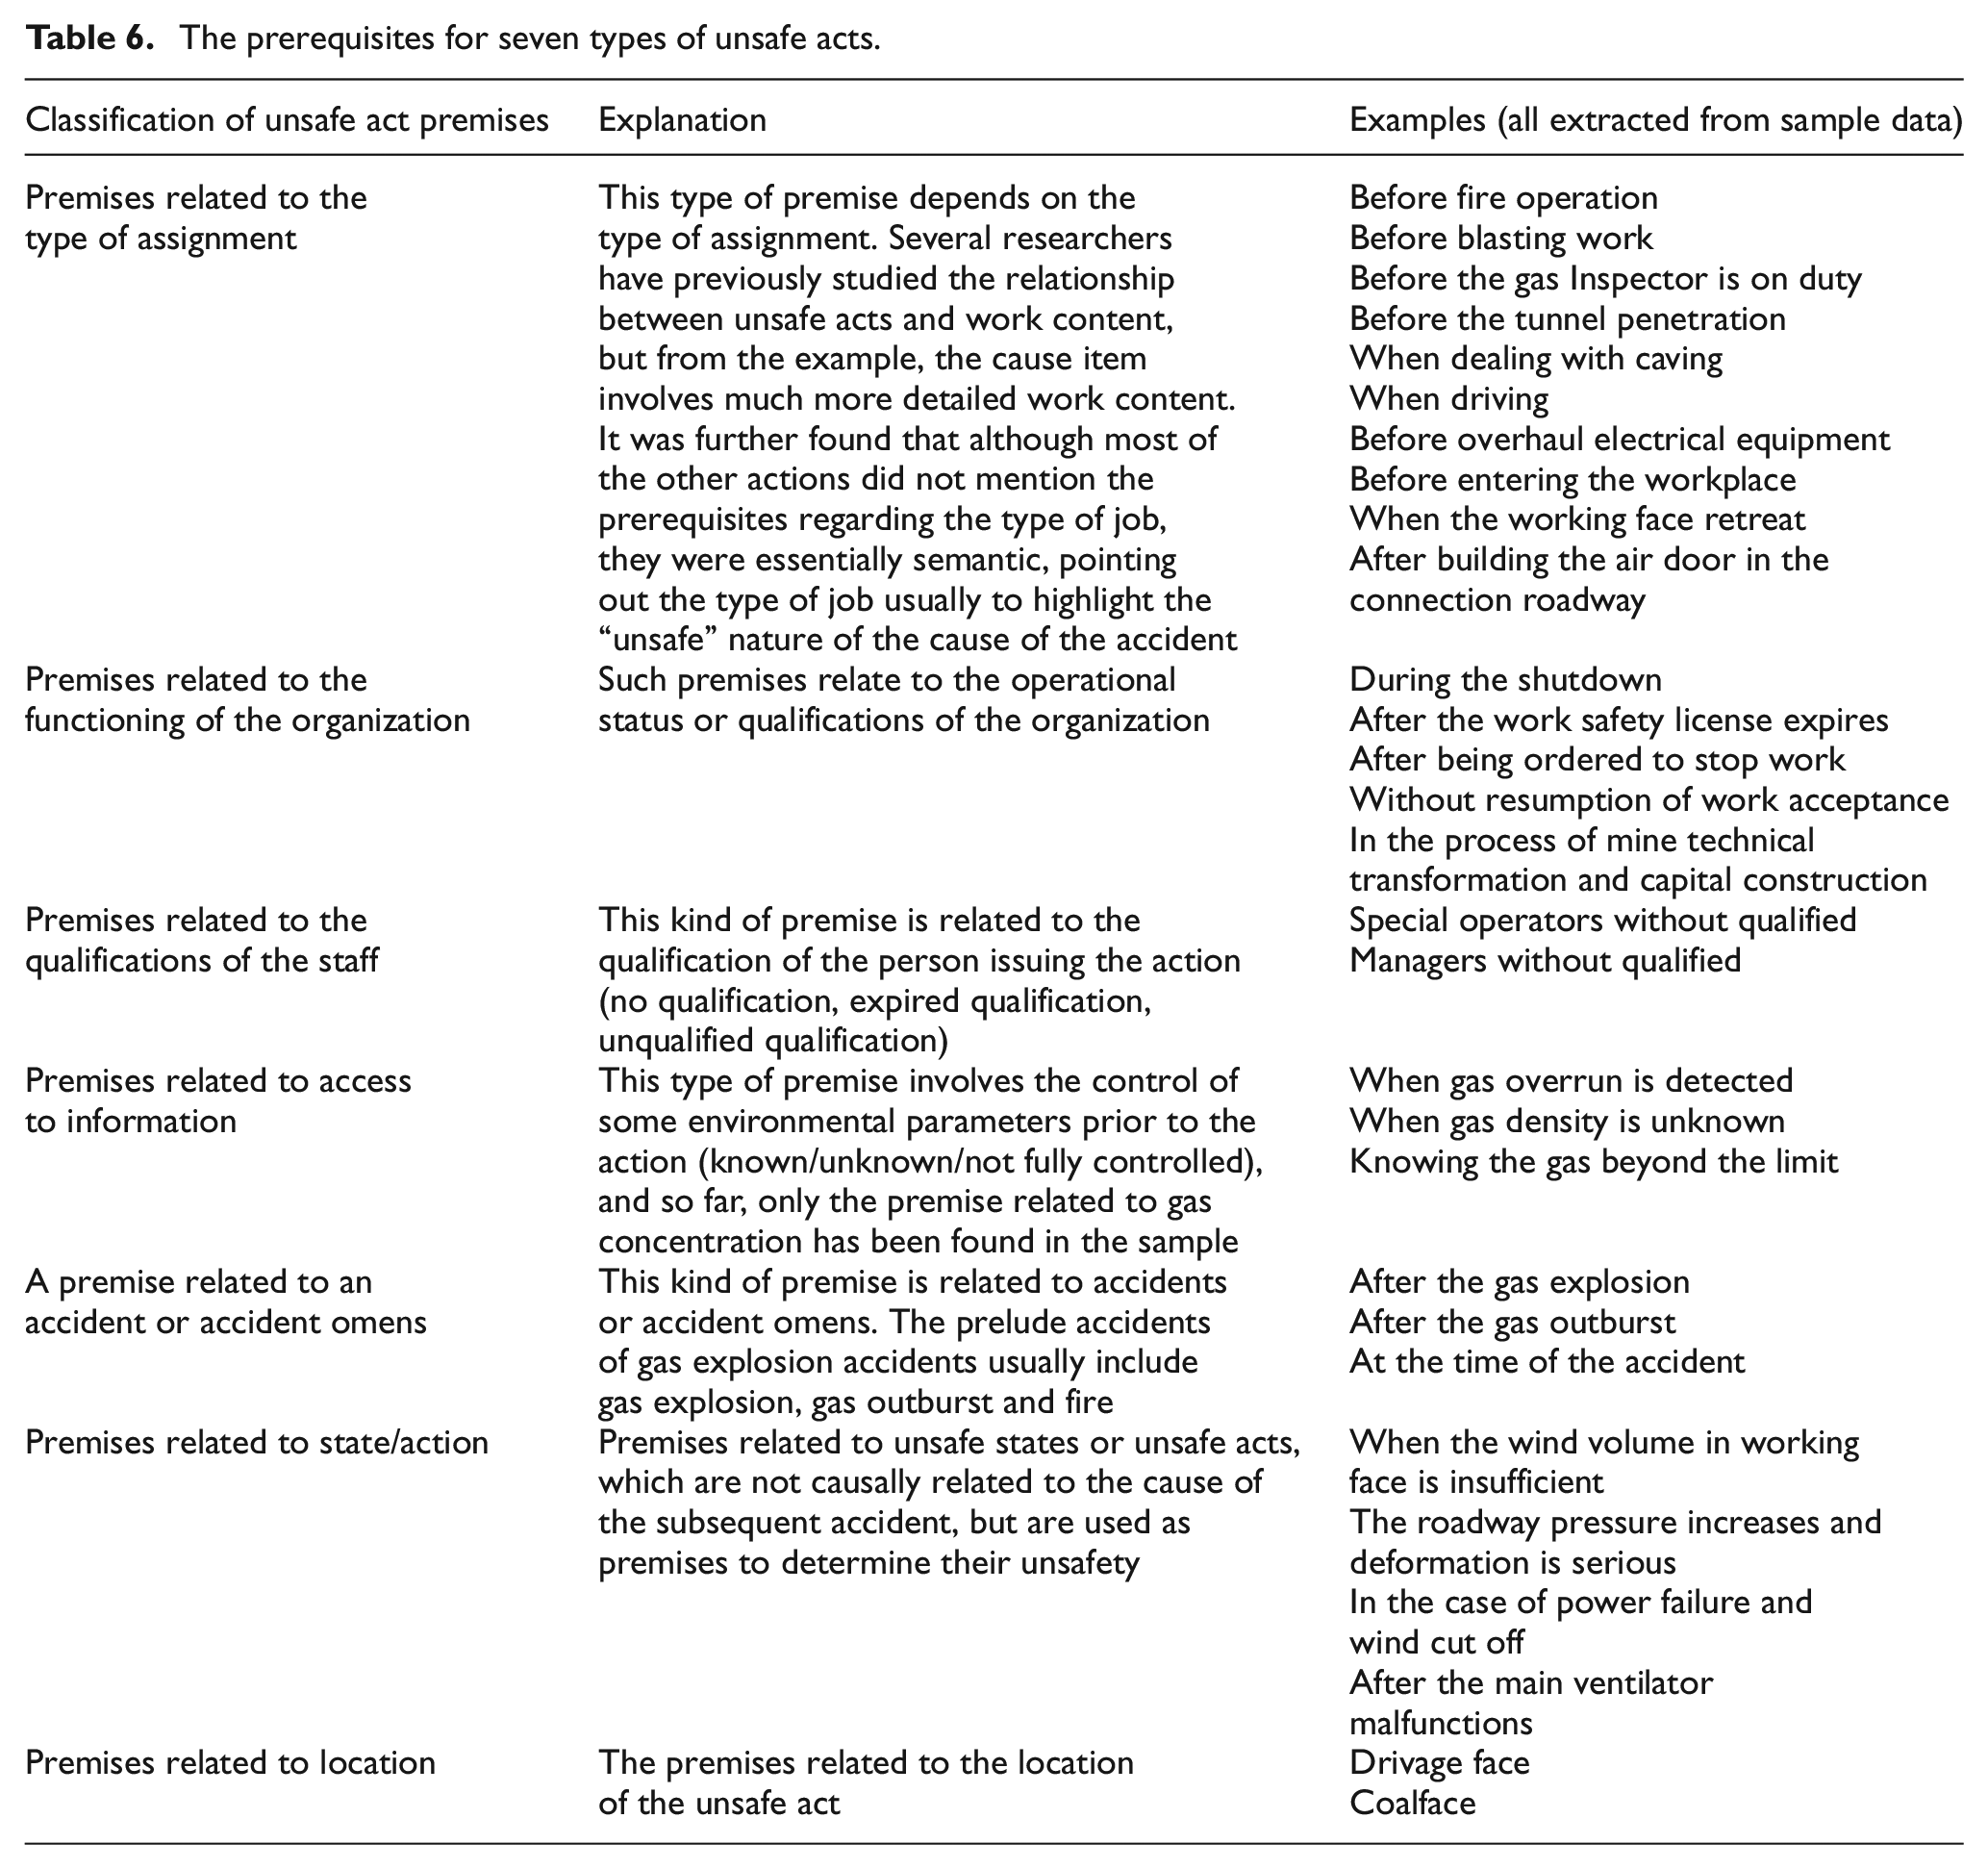
We recommend that the prerequisites included in the cause entry be retained. As Reason 64 said, ‘There is nothing inherently unsafe about not wearing a safety helmet or a life jacket. Such omissions only constitute unsafe acts when they occur in potentially hazardous situations (i.e., when heavy objects are likely to fall from above, or in close proximity to deep water) ‘. The judgment of whether an action is “safe” is not only related to the action itself, but also depends on the actual background of the action, which is a comprehensive judgment process, and the premise that frequently appears in the comparative data is an important basis for making judgments. In addition to the selected unsafe acts containing preconditions, some single unsafe act items in essence also implied preconditions. For example, “three-people-interlocking” and “one blasting three times inspection” naturally imply the premise “when performing blasting operations” (Reference 8); “blind rescue” naturally implies the premise “there has been an accident” (Reference 9), etc. These preconditions were automatically supplemented by the accident background or experience that the analyst or reader knew in advance, which further verified the universality of the preconditions. To sum up, this paper suggests that the use of preconditions should be retained, and the components of unsafe movements should be determined as the form of “premise + action”. For the sake of statistics, all the unsafe acts containing premise elements in the nine references were summarized, and they were divided into seven categories according to the type of premise and shown in Table 6.
The prerequisites for seven types of unsafe acts.
The omission of unsafe acts
The third problem found is the omission of unsafe acts, involving two correspondence relationships of perfect correspondence with inconsistent frequency and no correspondence at all. Perfect correspondence with inconsistent frequency of items indicates that at least one analyst has omitted problems for the same cause items. The omission problem has a serious impact on the reliability of the results, which directly affects the ranking of high-frequency unsafe acts in the reference. Therefore, the research results and prevention recommendations may be different. There are two cases where there is no correspondence at all. In the first case, the analyst omits some unsafe act, which is a personal error. The other situation is that the analysis results are different due to the different perspectives of the analysts in observing and understanding the accident, which belongs to individual difference.
Since there are omissions in both correspondence relations, the combination of the two is discussed first. According to theories related to cognitive psychology and human factor reliability analysis, omissions are generally regarded as a case of human factor error, involving memory failure. 65
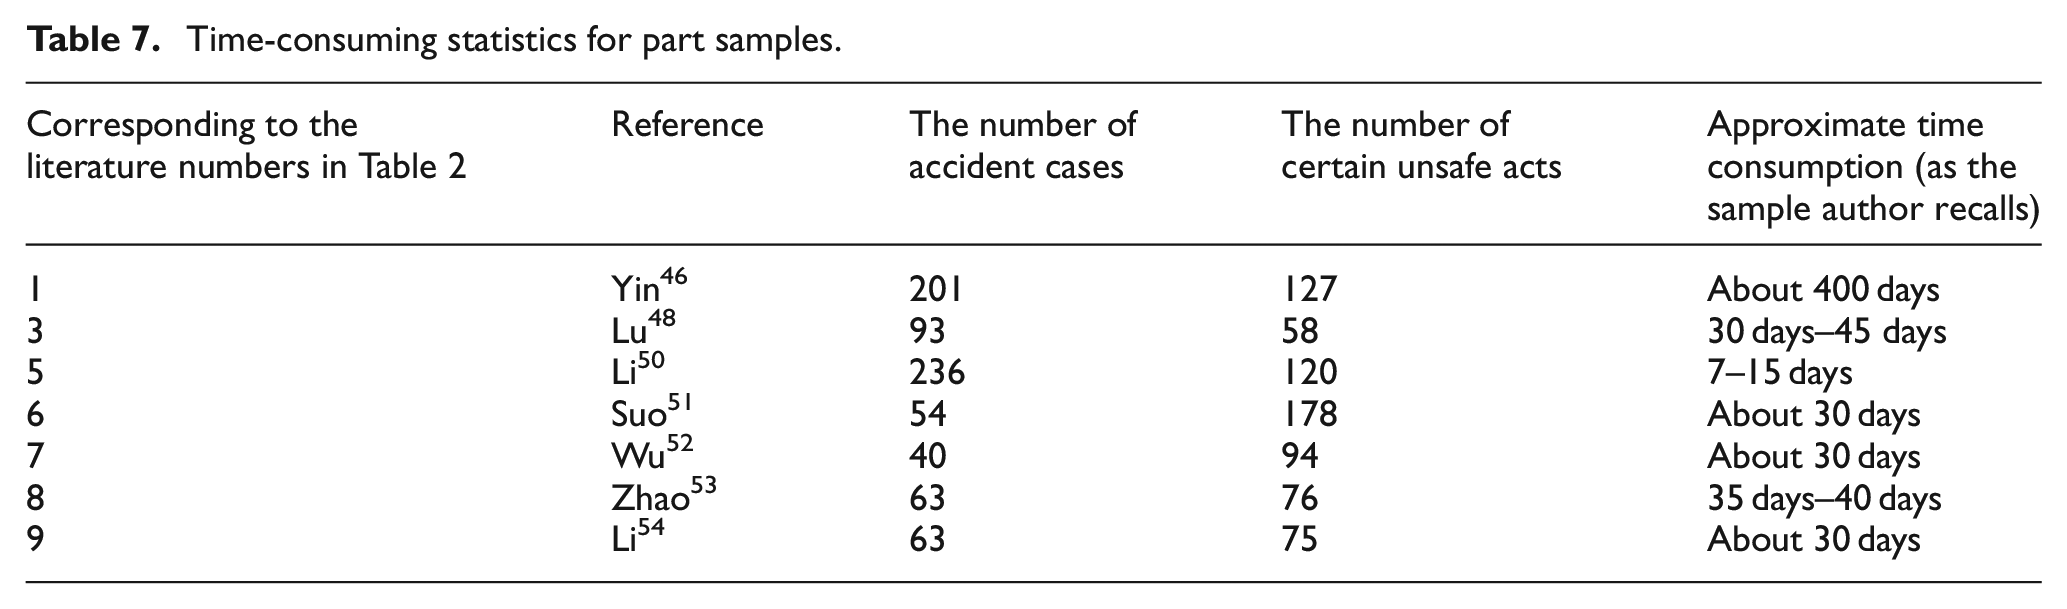
According to the feedback from some authors, this paper considers that time, and program support are the main influencing factors of missing unsafe acts. The statistical analysis of accidents in the paper usually takes up about 30 days of the analysts’ time, which is a heavy workload task (see Table 7 for details, only some sample authors can be contacted). However, in the sample references, few authors would set some instructive classification framework in advance before accident analysis (Among the authors who provided feedback, only the authors of Reference 1 and 6 set up a classification framework in advance), which makes the analysts easily at an unstable level in the statistical analysis of accidents. In addition, the huge workload and time occupation also increase the difficulty of data maintenance and modification after accident analysis.
Time-consuming statistics for part samples.
The author of Reference 9 pointed out in feedback: “With the development of accident analysis, some ideas arising in the process of accident analysis or changes in opinions about some reasons will lead to changes in subsequent accident analysis results. However, due to the time of accident analysis with a long span, it is difficult to re-cover this change in the results obtained from the previous analysis.” This problem of intra-coder consistency brought by time and program absence was also mentioned in the study of Olsen and Shorrock 16 and Fung et al. 66
For program support, further modularization of the model based on coal mine gas explosion accident mentioned above or a more detailed classification framework proposed in advance are still the most commonly used methods to solve the above problems. Classification framework HFACS has been applied by many scholars in specific industries and combined with the characteristics of their industries, and a classification method of “HFACS-” family has been developed 67–72; Li et al. 11 nested HFACs into STAMP system to strengthen the tracking and analysis of accident causes at the individual level. Salmon et al.10,24 suggested that more detailed classification should be developed based on AcciMap to improve the reliability of its accident analysis results. However, when the detailed classification guides the accident analysis, additional problems such as the mutual exclusion of classification and the possibility of confusion need to be considered. Meanwhile, the requirements for the experience and professional level of the analysts are increased, which further increases the complexity of accident analysis.16,73 Corresponding computer programs began to be developed, for example Hollnagel 74 suggested the use of computer programs to manage complex forms in the development of CREAM tool. Criticized for its complexity, FRAM developed a corresponding software (FRAM Model Visualizer) to assist in accident analysis and visual presentation. Based on AcciMap, Goode et al.75,76 developed Uploads (The Understanding and Averting LED Outdoor Accidents Data System) to collect and analyze Outdoor activities (LOA, Data on events occurring in LED outdoor activities). The development of such tools solves the complexity of program support, saves time, and achieves the dual purpose of improving analysis accuracy and efficiency.
Conclusion and future studies
Conclusion
In this paper, two groups of four reference are selected as samples from nine theses using 24Model for gas explosion accident analysis, and the reliability of accident analysis results is evaluated by comparing and analyzing the consistency of unsafe acts extracted from accident investigation reports by researchers. The results show that the reliability of the results needs to be improved, and there are three kinds of inconsistencies: complete correspondence but frequency inconsistencies, incomplete correspondence and no correspondence at all. After further study, it is found that these problems are not unique to the 24Model, but also exist in other accident analysis methods. More problems are independent of the method and exist in the accident analysis process. There are three main reasons for the above three situations: 1) The inconsistency of details in causes description; 2) The difficulty in the cause description and 3) The omission of unsafe acts.
In view of the above problems, this paper carries on the in-depth discussion, and gives the following solutions, or suggestions: 1) It is suggested to use the accident cause classification framework based on “consequence.” A more detailed classification system can be established by referring to the current accident analysis results, especially the cause items that contain both antecedents and consequences, and the nodes in the classification of the items that contain corresponding relations; 2) The elements of unsafe acts of “premise + action” are defined, and the “premise” is summarized into seven categories. They are the premises related to the operation, the operating state of the whole organization, the qualifications of the staff, the access to information, the accident, or accident omen, the state/action and the location of the action; 3) It is suggested to develop the corresponding computer program to improve the efficiency and precision of accident analysis.
The comparison of analysis results, causes of low reliability, solutions, or suggestions, and the relationship between them are summarized in the Figure 6.
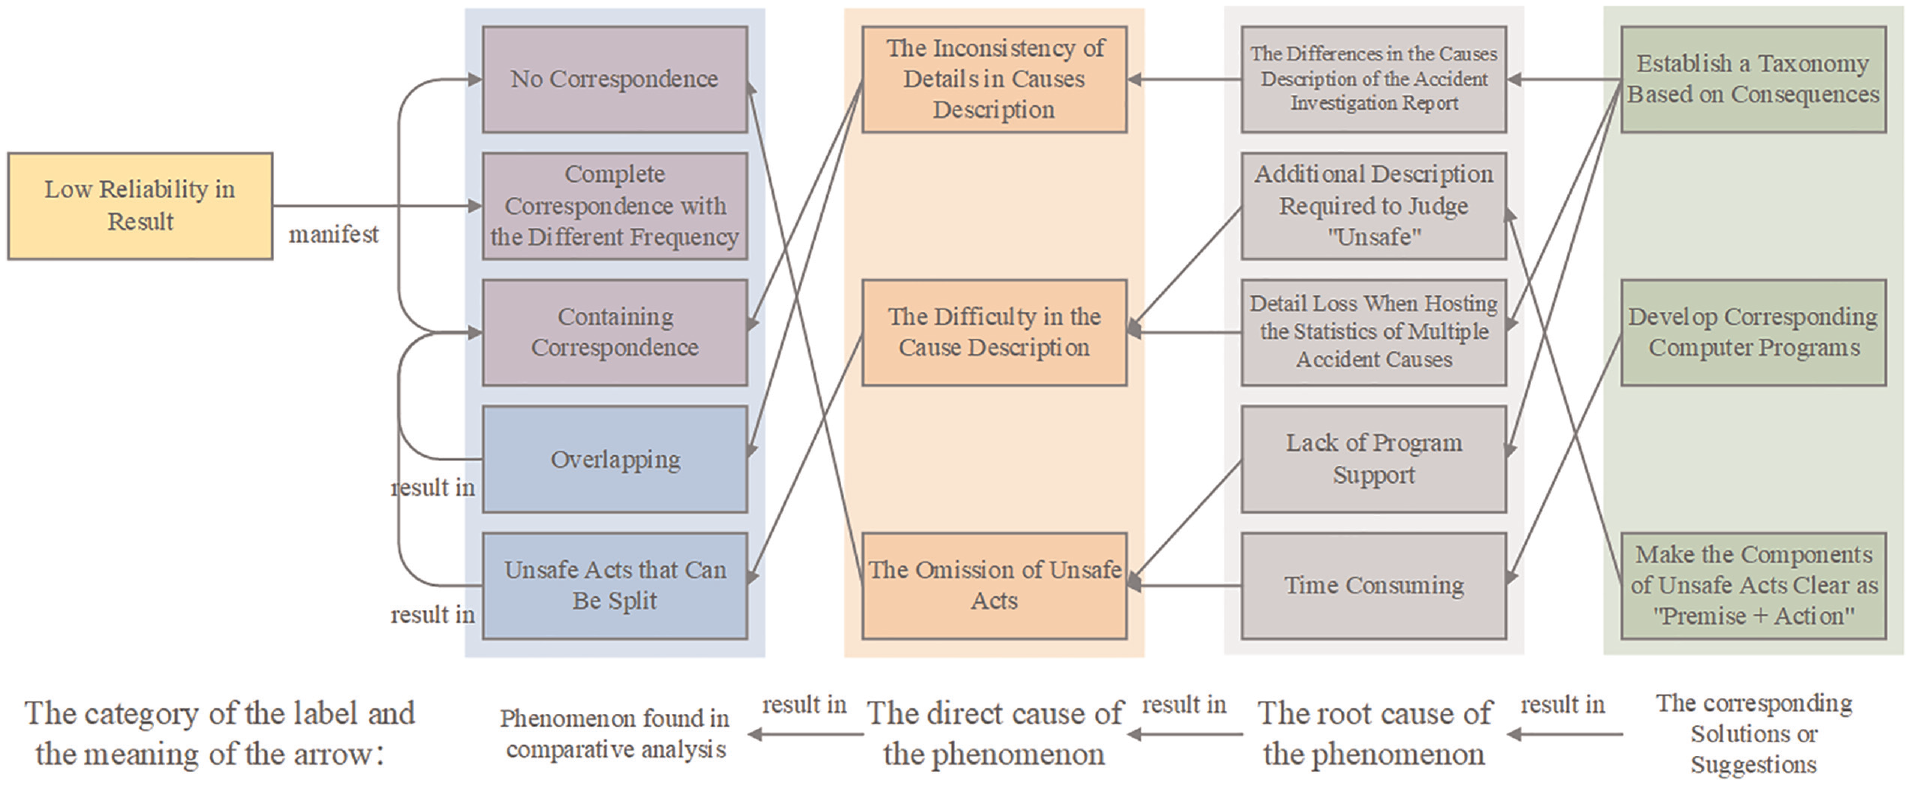
The relationship between the comparison of analysis results, causes of low reliability, solutions, or suggestions.
Future studies
Several proposals have been made to further modularize the model or to build a more detailed classification system in this paper. The problems to be solved are inconsistent level of description of cause details, cause items including both antecedents and consequences, and lack of program support. Thus, it can be seen, classification is very important to improve the reliability of model and even the reliability of accident analysis results. To establish a more detailed classification system will be one of the future works. Although the three suggestions aim at different problems, there is no conflict in the way of implementation, and the three have a continuous relationship with each other. For the cause items including both antecedent and consequence, the consequence-based classification framework will be the first choice to establish the classification system. At present, the results of statistical analysis of gas explosion accidents by many scholars are important references for the establishment of classification indexes. In particular, the distribution of “consequences” in the items of cause and effect and the description of unsafe acts in the items of corresponding relation represent the understanding and analysis habit of the analyst on the logic between causes and the detail level of cause description in practical application. The classification system can not only be used as a tool to standardize the accident analysis process at present, but also be integrated with computer programs to improve the efficiency and reliability of coal mine gas explosion accident analysis in the future.
In addition, in the non-correspondence mentioned in Section 4.3, there is also a kind of unsafe acts caused by the lack of correspondence due to personal characteristics. The purpose of accident analysis is to understand the causes of accidents so as to better prevent accidents. However, due to the complex relationship between humans, technology and the environment in the accident,77,78 it is difficult for a single analyst to describe the whole picture of an accident through accident analysis. The truth of the accident is like a puzzle (Figure 7). For the same accident, different analysts can only get part of the debris due to the intervention of various reasons. Due to the different perspectives of analysts, the debris obtained is also different. So, the more analysts there are, the more likely it is to piece together what caused the accident. Thus, compared with the non-correspondence caused by the omission of unsafe acts, the consistency difference shown by such unsafe acts is obviously benign, and it is also the key to maintain the vitality of accident analysis. Accident causation theory like a “puzzle” platform. After a considerable amount of accident analysis data is obtained, further consideration should be given to the utilization of inconsistent data. For example, Dien et al. 79 proposed to establish a “check & balance” investigation method, and the final analysis results are jointly constructed by several parallel organizational analyzes to obtain a “global view” of the accident. Corresponding to this study, after applying the suggestions or methods in this paper to “normalize” the accident causes, it will be the main work in the future to collect many “fragments” and search for more comprehensive accident causes.
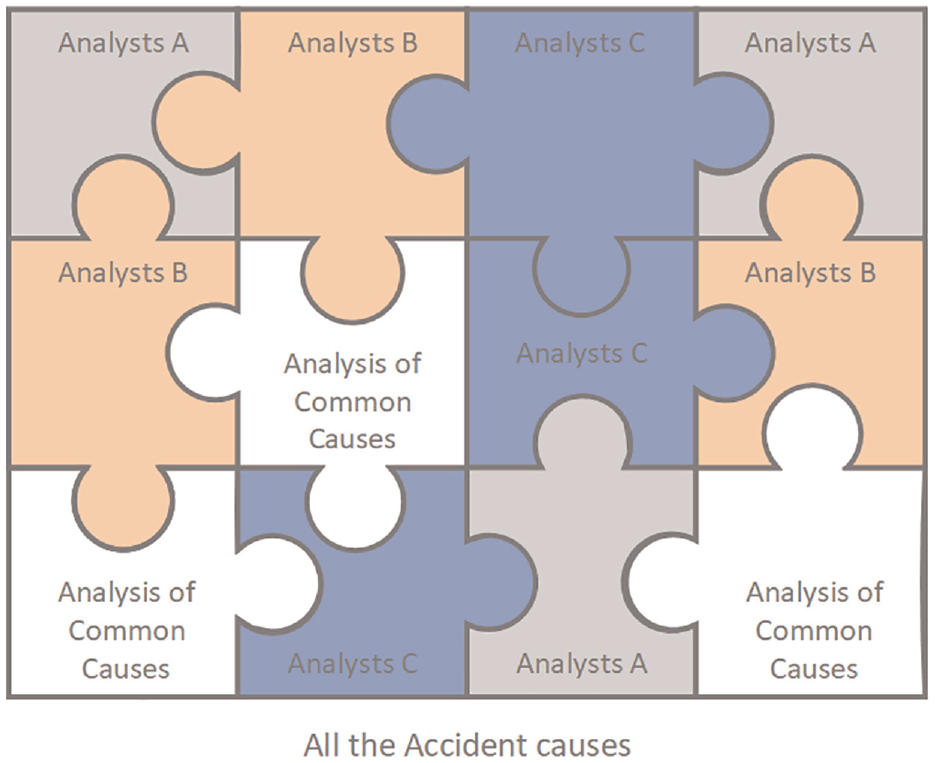
Different “fragments” of the accident causes obtained by different analysts through accident analysis.
It is worth noting that, as mentioned in the Introduction, the occupation, skills, bias and even some demographic variables of the accident analyst will inevitably affect the accident analysis results. However, it is limited to the samples used in this paper and cannot be considered enough. In addition, since the samples are the statistical data of a large number of accidents, a naive comparison method is adopted to evaluate the output consistency. More complex methods can be considered in future study, such as kappa consistency test, SDT, and various well-established indicators (like precision, recall, F1-score, etc.) used to evaluate classification performance in machine learning. Of course, these high-precision indicators will also place higher requirements on sample data.
Footnotes
Appendix
No correspondence and distribution of cause characteristics in Group B.
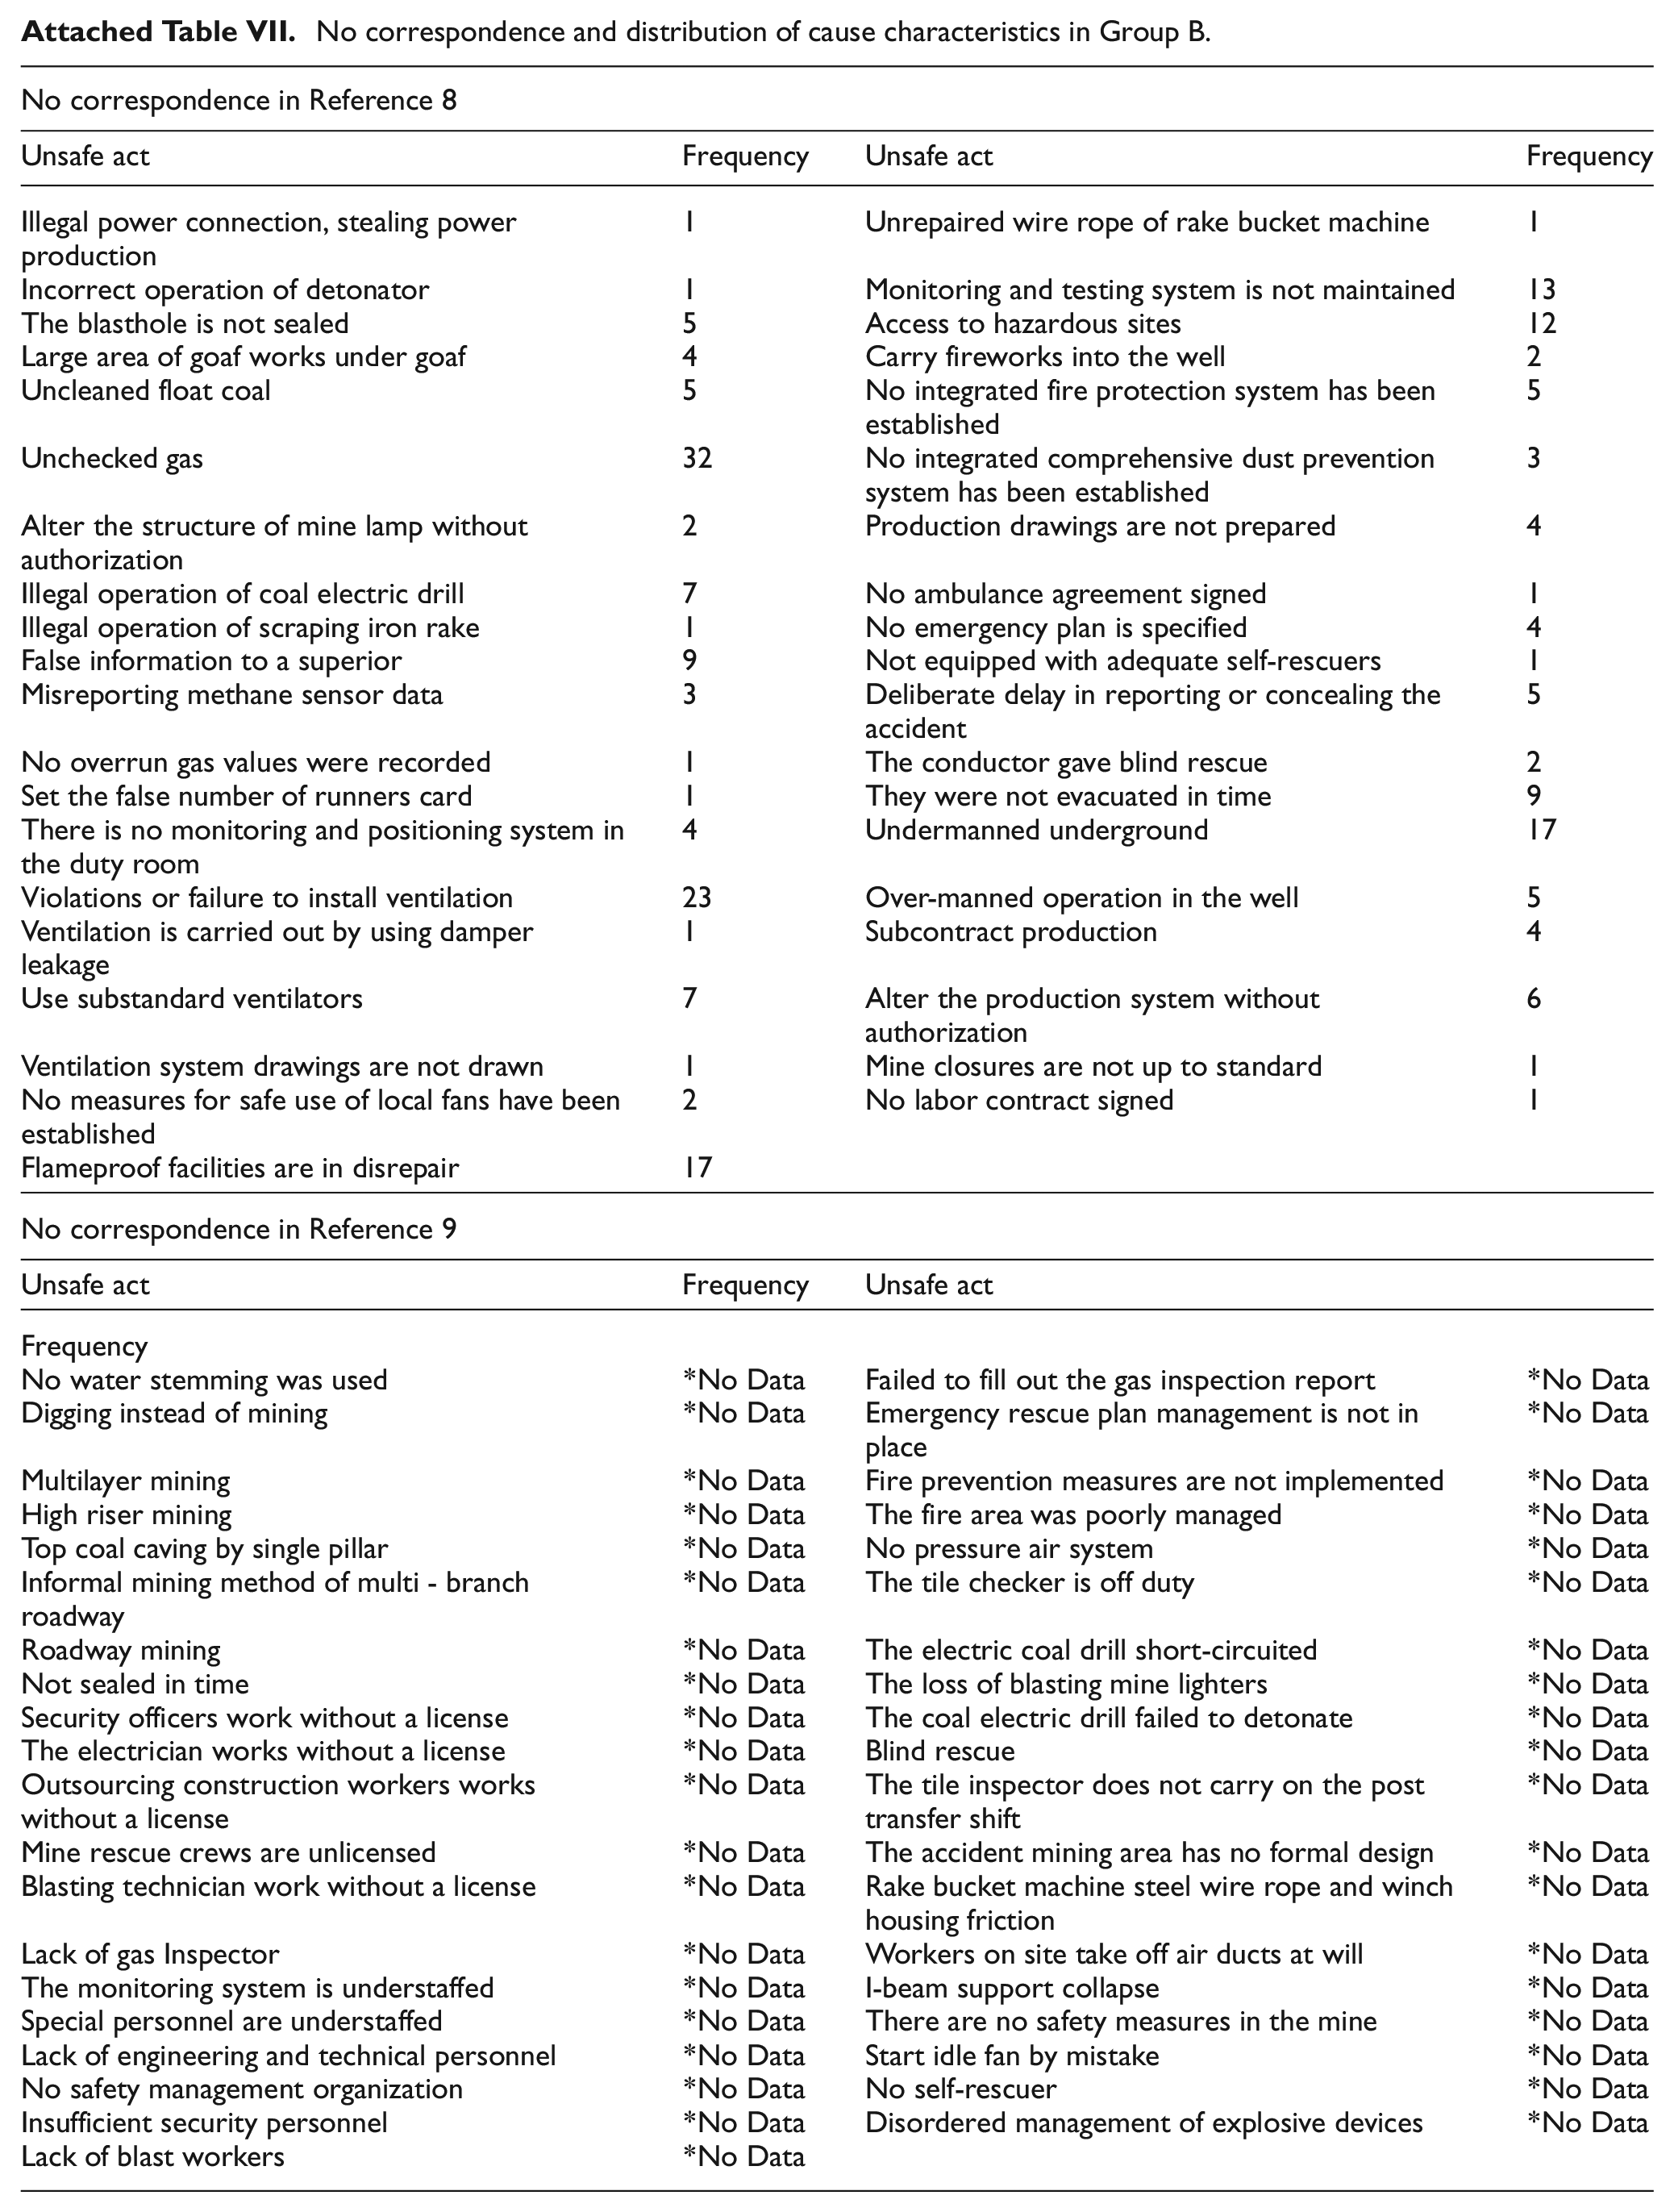
| No correspondence in Reference 8 | |||
|---|---|---|---|
| Unsafe act | Frequency | Unsafe act | Frequency |
| Illegal power connection, stealing power production | 1 | Unrepaired wire rope of rake bucket machine | 1 |
| Incorrect operation of detonator | 1 | Monitoring and testing system is not maintained | 13 |
| The blasthole is not sealed | 5 | Access to hazardous sites | 12 |
| Large area of goaf works under goaf | 4 | Carry fireworks into the well | 2 |
| Uncleaned float coal | 5 | No integrated fire protection system has been established | 5 |
| Unchecked gas | 32 | No integrated comprehensive dust prevention system has been established | 3 |
| Alter the structure of mine lamp without authorization | 2 | Production drawings are not prepared | 4 |
| Illegal operation of coal electric drill | 7 | No ambulance agreement signed | 1 |
| Illegal operation of scraping iron rake | 1 | No emergency plan is specified | 4 |
| False information to a superior | 9 | Not equipped with adequate self-rescuers | 1 |
| Misreporting methane sensor data | 3 | Deliberate delay in reporting or concealing the accident | 5 |
| No overrun gas values were recorded | 1 | The conductor gave blind rescue | 2 |
| Set the false number of runners card | 1 | They were not evacuated in time | 9 |
| There is no monitoring and positioning system in the duty room | 4 | Undermanned underground | 17 |
| Violations or failure to install ventilation | 23 | Over-manned operation in the well | 5 |
| Ventilation is carried out by using damper leakage | 1 | Subcontract production | 4 |
| Use substandard ventilators | 7 | Alter the production system without authorization | 6 |
| Ventilation system drawings are not drawn | 1 | Mine closures are not up to standard | 1 |
| No measures for safe use of local fans have been established | 2 | No labor contract signed | 1 |
| Flameproof facilities are in disrepair | 17 | ||
| No correspondence in Reference 9 | |||
| Unsafe act | Frequency | Unsafe act | Frequency |
| No water stemming was used | *No Data | Failed to fill out the gas inspection report | *No Data |
| Digging instead of mining | *No Data | Emergency rescue plan management is not in place | *No Data |
| Multilayer mining | *No Data | Fire prevention measures are not implemented | *No Data |
| High riser mining | *No Data | The fire area was poorly managed | *No Data |
| Top coal caving by single pillar | *No Data | No pressure air system | *No Data |
| Informal mining method of multi - branch roadway | *No Data | The tile checker is off duty | *No Data |
| Roadway mining | *No Data | The electric coal drill short-circuited | *No Data |
| Not sealed in time | *No Data | The loss of blasting mine lighters | *No Data |
| Security officers work without a license | *No Data | The coal electric drill failed to detonate | *No Data |
| The electrician works without a license | *No Data | Blind rescue | *No Data |
| Outsourcing construction workers works without a license | *No Data | The tile inspector does not carry on the post transfer shift | *No Data |
| Mine rescue crews are unlicensed | *No Data | The accident mining area has no formal design | *No Data |
| Blasting technician work without a license | *No Data | Rake bucket machine steel wire rope and winch housing friction | *No Data |
| Lack of gas Inspector | *No Data | Workers on site take off air ducts at will | *No Data |
| The monitoring system is understaffed | *No Data | I-beam support collapse | *No Data |
| Special personnel are understaffed | *No Data | There are no safety measures in the mine | *No Data |
| Lack of engineering and technical personnel | *No Data | Start idle fan by mistake | *No Data |
| No safety management organization | *No Data | No self-rescuer | *No Data |
| Insufficient security personnel | *No Data | Disordered management of explosive devices | *No Data |
| Lack of blast workers | *No Data | ||
Acknowledgements
The authors are grateful to the editors and anonymous reviewers for their suggestions in improving the quality of the safety.
Credit author statement
Declaration of conflicting interests
The author(s) declared no potential conflicts of interest with respect to the research, authorship, and/or publication of this article.
Funding
The author(s) disclosed receipt of the following financial support for the research, authorship, and/or publication of this article: This work was supported by the National Natural Science Foundation of China (Grant No. 51534008), the Fundamental Research Funds for the Central Universities (No. 2021YJSAQ26) and the Curriculum Construction project of “Introduction to Safety Science and Engineering” (No. J20ZD03).