



Abstract
Performance analysis in cricket has traditionally focused on bowling and batting, with limited emphasis on fielding performance in both research and practice. Currently, there is no evaluation of fielding tactics using fielder location data. To address this gap, the primary aim of the study was to identify and describe typical placement of fielders (field-settings) in T20 international cricket. The secondary aim was to determine the association between field-settings and measures of team performance. Fielder location data (x-y coordinates) were processed by calculating the angle and distance of each fielder to the centre of the cricket pitch. To address the primary aim, Hierarchical Density-Based Spatial Clustering of Applications with Noise (HDBSCAN) was applied to identify a set of discrete field-settings. For the secondary aim, regression analysis was conducted to evaluate the relationship between field-settings and measures of team performance. The study identified 21 commonly employed field-settings, some of which were significantly associated with varying rates of dot balls, boundaries and runs conceded. No significant association was found between any field-setting and wickets taken. This is the first study to analyse fielder location data to quantify cricket fielding performance. The identified field-settings support more informed strategic decision-making processes, including pre-match planning, on-field tactical adjustments, and opposition analysis. These insights may also contribute to improved team performance and enhance broadcast coverage through data-driven storytelling of fielding tactics.
Introduction
Cricket is a bat-and-ball sport, that at the international level, is played across three formats. These are Test, One Day International (ODI), and Twenty20 (T20). 1 Cricket has three key disciplines of fielding, bowling, and batting. 2 Researchers and practitioners have predominantly emphasised the tactical analysis of bowling and batting performance (e.g., the impact of bowling lines and lengths on boundary hitting 3 ), despite the pivotal role that fielding plays in influencing team performance. 2 Excluding the wicket-keeper and the bowler, there are nine fielders in each team. In limited-overs cricket (i.e., ODI and T20), only certain numbers of fielders are allowed to field outside the restriction area, depending on the phase of an innings (e.g., a maximum of two fielders during the powerplay; first six overs in T20 international cricket).2,4 Effective fielding tactics depend on the optimal placement of fielders to dismiss opposition batters and/or minimise their runs-scoring by performing fielding actions such as catching the ball, affecting run-outs, and intercepting the ball to save runs. 4 Notably, higher-performing fielders have been shown to save an average of 1.2 runs per match in T20 cricket, 5 which could prove to be decisive in closely contested matches. Despite its potential significance in enhancing teams’ performance, tactical fielding performance remains one of the least explored aspects of cricket in both research and practice.
The limited existing literature investigating the importance of fielding on team performance and match outcome has primarily assessed technical performance variables such as catches, run-outs, and ground fielding efforts (to minimise runs conceded).6,7 Many studies have identified number of catches taken as a significant predictor of winning a match.7,8 Studies have also evaluated fielding performance by employing subjective measures and developing complex mathematical methodology.9,10 One study proposed a points-based system, where scores were assigned via subjective judgement (range: −5 to 20) as a measure to assess fielding actions based on their difficulty and outcomes. 9 Another study proposed a metric to evaluate fielding performance; however, the calculation of this measure was partially influenced by the number of specialist fielders within a team. 10 While fielding actions are primarily individual in nature; their effectiveness should not be assumed to depend on the count of other (“specialist”) fielders within the team. Additionally, another study aimed to quantify the difficulty of fielding performance by considering the relative importance of catches based on the batting position of dismissed batters. 11 While dismissing a top-order batter is crucial, completing their catch does not capture the difficulty of the fielding action. Therefore, many such approaches developed in previous research do not truly represent a fielder's ability or provide a complete understanding of tactical fielding performance.
While the above-mentioned studies investigated the impact of technical fielding performance on team success, there has been limited exploration of field-setting strategies, i.e., configuration of fielder positioning, which can also influence team performance.2,12 Two studies reported insights into fielding contacts, i.e., locations where the ball was fielded.13,14 Excluding the wicket-keeper and the bowler, ‘cover’ was the most frequent location where the ball was fielded in both studies. However, it was unclear whether the fielders acted from their specific positions or moved across locations, making it challenging to accurately assess these fielding positions. Recently, one study reported field-setting recommendations for various delivery types (combination of different bowling lines and lengths). 15 However, the study did not address the limitations of previous research as the results were derived from where the player fielded the ball, without considering for the fielders’ original position at the moment of ball release by bowlers. More recently, another study reported that fielders within the inner circle were less likely to perform unsuccessful fielding actions, such as misfields and drop catches compared to outfielders. 16 While these findings help understand the frequency and quality of fielding actions across different areas of the ground, they offer limited insights into field-setting tactics. This gap in literature highlights the need to investigate not only where fielding actions occur but also how initial fielder positioning influences these actions, shot selection, run-scoring, and team performance.
In elite sport, where performance margins between competing teams are extremely narrow, there is an increasing need to capitalise on opportunities that provide a competitive advantage. 17 Therefore, to address the limitations of traditional notational methods and move beyond understanding which fielding performance variables to optimise, further investigation is required to explore how tactical nuances, such as field-setting, can influence team success. Recent advancement in computer vision technology has enabled the collection of player location information for all athletes, allowing the analysis of spatiotemporal variables.18,19 Unlike wearable technology, computer vision systems can capture tracking data for opposing teams without requiring players to wear devices such as GPS trackers. 19 Beyond employing player tracking technology to examine athletes’ physical performance, recent research in soccer and baseball suggests that optimising player positioning may improve team's tactical performance.18,20–22 This indicates the potential benefits of similar analytical approaches to gain competitive advantage in cricket. Furthermore, identifying and assessing field-setting could offer opportunities in contributing to team success by enabling deeper analysis, such as pre-match planning, in-game tactical adjustments, and exploring strengths and weaknesses of opposition batters against different field-settings. Therefore, the purpose of this study was to address these gaps by developing a method to classify and analyse various field-settings, along with discovering novel tactics to optimise team's fielding performance. To achieve this, the primary aim of the study was to identify and describe the typical placement of fielders (field-settings) in T20 international cricket. The secondary aim was to determine the association between field-settings and measures of team performance.
Materials and methods
Study design and setting
This research adopted an exploratory secondary data analysis study design. Pre-collected ball-by-ball data were obtained by a sports data collection company, StatsPerfom. The dataset include detailed information on team technical characteristics of fielding, bowling, and batting performance. The dataset comprised of 52 matches from the ICC Men's T20 Cricket World Cup 2024, including 11,443 deliveries (observations) and 70 variables (e.g., bowler type, runs breakdown). The method used to collect this type of data has previously been reported in the literature as highly reliable. 23 The fielder position tracking data for the same tournament was sourced from a sports broadcasting and technology company, Quidich Innovation Labs. This dataset provided static location information of all fielders for each delivery (n = 115,370), captured between the moment when bowlers start their run-up to the point of ball release. The tracking data were extracted using computer vision technology applied to high-resolution video recordings of the entire field, captured at 25 Hz. Fielder positions were represented using x-y coordinate system that was normalised to the actual ground dimensions. The validity and reliability of this data source has been reported in previous research. 24 For each delivery, both datasets included match ID, innings, over and ball number information, allowing them to be combined. The study received an ethics exemption approval from the Deakin University Human Ethics Advisory Group (2025/HE000204). The exemption was granted on the basis that the authors were provided with fully de-identified data and made no attempt to identify any individuals associated with the dataset.
Data processing
The fielder tracking data were exported from the Quidich Tracker system as JSON files and transformed into a spreadsheet format. To account for alternating bowling ends, fielder locations were transposed to reflect one consistent bowling end. Boundary distances were scaled to a range of −1 to 1 along both x-y axes to control for varying field dimensions across venues. As the tournament was played across nine venues, boundary sizes could differ between grounds, and within the same venue due to varying pitch location. Furthermore, fielders’ position were standardised according to batters’ handedness, i.e., field-settings for left-handed batters were transposed to ensure consistency in spatial orientation of field-settings. A small number of observations were removed due to mislabelled ball number information, and only complete instances comprising of all 11 fielders per delivery were retained for the analysis (n = 112,013).
For each delivery, angle (measured anti-clockwise from the positive x-axis) and Euclidean distance of each fielder was calculated to the centre of the cricket pitch. The data were then ordered in ascending order of angle, with corresponding distances. This structure produced 10,183 observations with 22 variables (both angle and distance for 11 fielders per delivery). Feature scaling was applied to standardise these variables due to their different units of measurement.
Analytical methods
Unsupervised clustering algorithm
To identify most commonly used field-settings, Hierarchical Density-Based Spatial Clustering of Applications with Noise (HDBSCAN)25,26 was applied to the processed data comprising 22 variables, representing the angle and distance of each of the 11 fielders per delivery. The minPts (minimum points) hyperparameter value was set to 44, as it is recommended that the optimal value is typically twice the number of dimensions for DBSCAN (of which HDBSCAN is an extension).27,28 This hyperparameter defined the minimum number of instances required for a field-setting to form a cluster. Field-settings employed on fewer than 44 deliveries were not assigned to any cluster and were placed in the ‘noise’ cluster by the algorithm. Noteworthily, this study treated noise and outliers distinctly. Noise was defined as data with no meaningful information (too unique to be allocated to any cluster), whereas an outlier was an instance deviating extremely from well-defined dataset. 29 HDBSCAN has an in-built outlier detection method, Global-Local Outlier Scores from Hierarchies (GLOSH), which assigns an outlier score (range: 0–1) to each data point, based on a point's local density and its distance to the closest core cluster. 25 The data provider reported that technical issues affected five to six matches, where fielder location was occasionally captured at ball's end-moment (once the ball became “dead”) instead of the intended moment prior to or at ball release. While this error impacted some instances (noise), other observations still contained valuable information from these matches. Given HDBSCAN's robustness to handle noisy data, these matches were retained for analysis. A threshold of 0.83, corresponding 97.5th percentile of the outlier score distribution was used to remove field-setting instances in the noise cluster. While this threshold might not be the most appropriate separation between noise and meaningful data, it does not affect the asymptotic complexity, in terms of running time and memory usage, 25 thereby providing a time-efficient method for removing erroneous data while retaining valid observations. The remaining unassigned instances, i.e., less frequently used field-settings (including outliers), were referred to as ‘non-standard field-settings’.
Given angle is a circular variable, where 0˚ and 360˚ represent the same direction, fielder movement across the 0˚ /360˚ boundary was interpreted as a 350° change (instead of 10°). This led to the erroneous splitting of a field-setting cluster. To address this, the two clusters were manually merged.
Statistical analysis
Binomial Logistic Regression (for binary variables; dot ball, boundary and wicket) and Poisson Regression (for count variable; runs) were used to determine associations with field-settings. Significance was accepted at p < 0.05. Descriptive statistics as set of heatmaps were generated to illustrate the spatial distribution of fielders for each field-setting. The data processing, statistical analysis, and application of machine learning was performed using RStudio (version, 2023.12.1.402; R version, 4.4.1), 30 an open-source software (Table 1).
List of team technical performance variables with their definitions.

Post hoc sensitivity analysis
As this was an exploratory study, a prospective sample size estimation could not be conducted. 31 Instead, a post hoc sensitivity analysis was performed to calculate the minimum detectable difference in proportions between groups of unequal sizes (n1 = 112, n2 = 2586). Three pairs of sample sizes were randomly selected, and the least sensitivity (i.e., most conservative) result was reported. The analysis was conducted using pwr package in R (function: pwr.2p2n.test), with a significance level (α) of 0.05 and desired statistical power of 0.80. A two-sided alternative hypothesis was specified for all tests. Using Cohen's h, the alternative proportion was derived based on a conservative control proportion of 0.5. The study achieved 80% statistical power to detect a minimum absolute difference in proportions of 0.1335 (i.e., 13.35%).
Alternative approaches conducted
Several additional methods were explored to identify field-settings and address the angular linearity limitation of the proposed method; however, they were not retained as they did not produce satisfactory results:
Applying alternative clustering algorithms, such as K-means, hierarchical clustering, Gaussian Mixture Models, and DBSCAN to the angle-distance processed dataset. None of the algorithm yielded meaningful (non-overlapping) and interpretable field-settings. Addressing the angular linearity by adjusting angles ≥ 345˚ by subtracting 360, testing multiple cut-off values, and reordering data by adjusted angles with corresponding distances for subsequent cluster analysis. This resulted in absence of fielders that were present at angles ≥ 345˚. Wasserstein distance was calculated between unassigned observations and the mean fielder location (x–y values) for each identified field-setting cluster. The maximum intra-cluster Wasserstein distance was used as the cut-off, alongside varying thresholds, to assign these observations to the closest clusters. The approach altered with the true definitions of an identified field-setting, making it challenging to visualise and interpret them.
Results
The analysis identified 21 distinct field-settings (Figure 1), 7898 deliveries (i.e., observations of field-settings) assigned to them. A total of 2285 deliveries remained unassigned, of which 274 were identified as invalid (noise), leaving 2011 deliveries (20.29%) representing non-standard field-settings. Among the identified field-settings, 11 were used during powerplay overs, and 10 during non-powerplay overs. Furthermore, 14 field-settings were used exclusively by pace bowlers, while seven were shared between pace and spin bowlers.
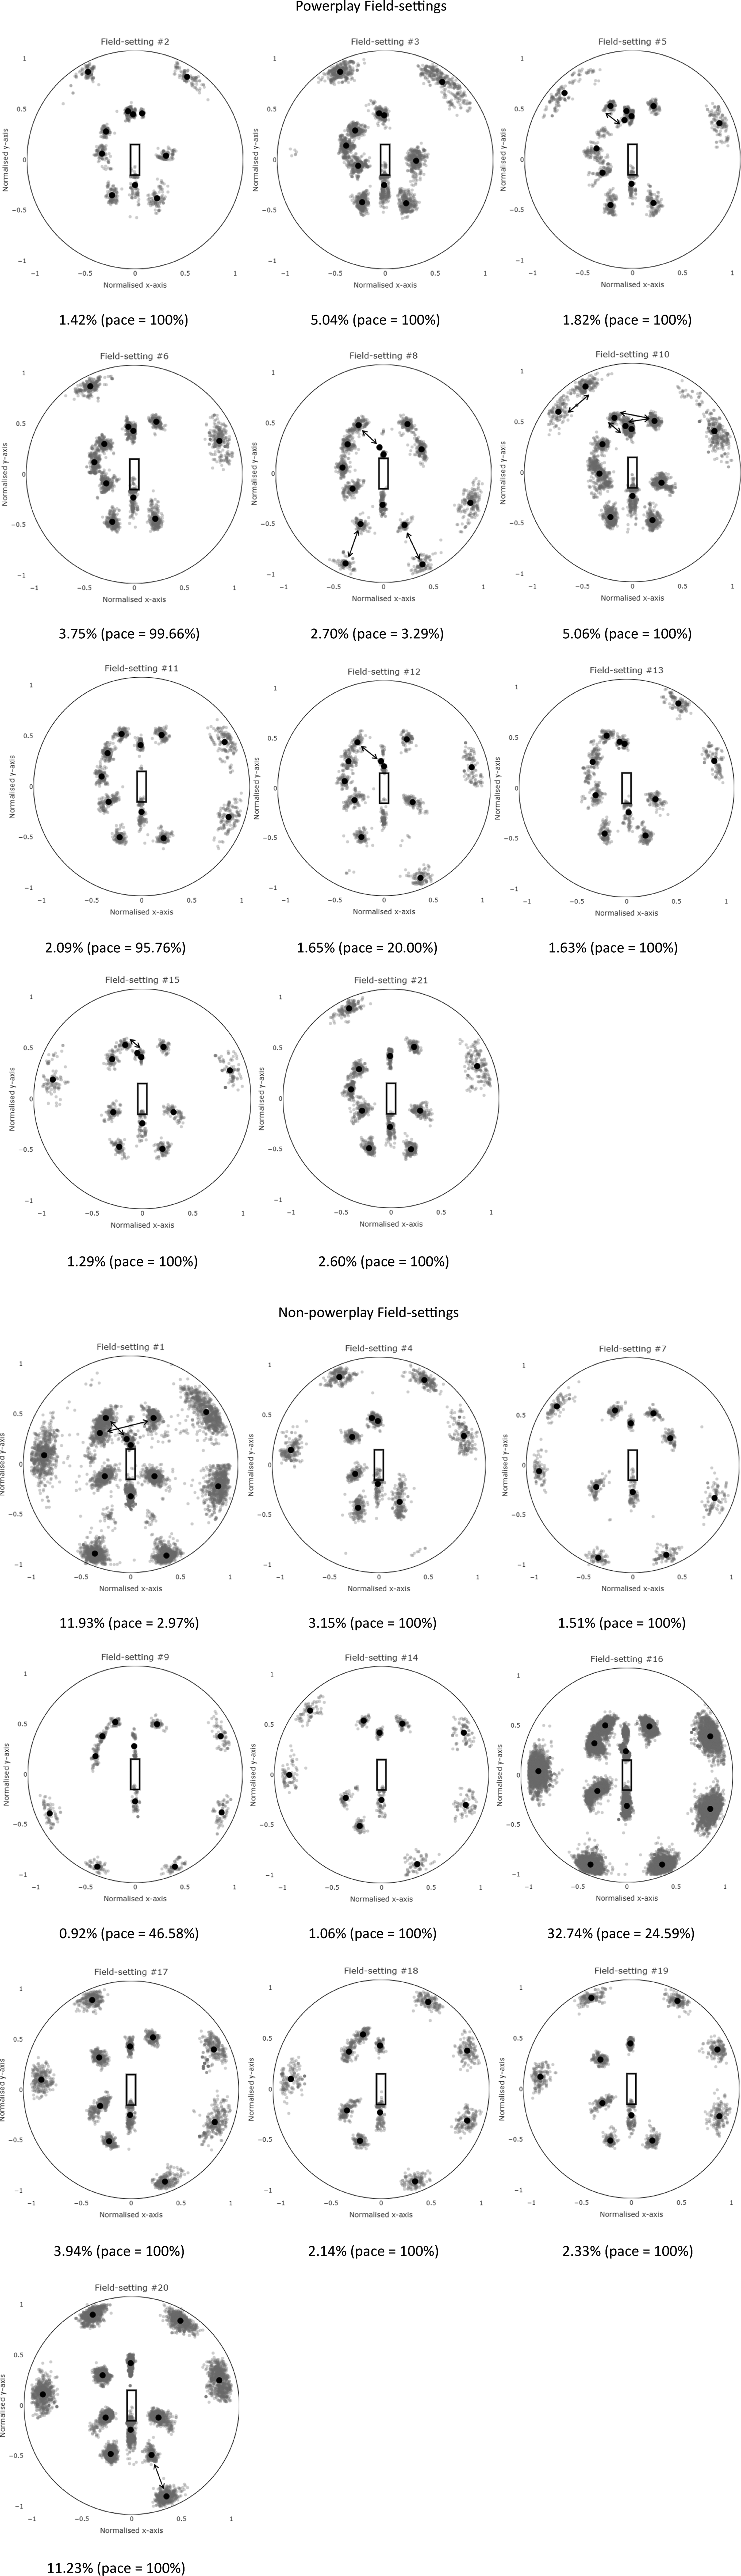
Identified field-settings. The percentages represent the overall frequency with which each field-setting occurred in the dataset. These were calculated from the total number of instances assigned during cluster analysis. The percentages in the parentheses show the proportion of those instances associated to pace bowlers. Boundary dimensions are normalised. The rectangle in the middle illustrates a cricket pitch. Bowlers are at the bottom, with right-handed batters positioned at the top end of the pitch. The black dot represents the centroid location of a fielding position, with the grey clouds representing the variance of that particular fielding position. Arrows illustrate variation in fielder positions within a field-setting.
Regression analyses revealed statistically significant associations between field-settings and measures of team performance during both powerplay (Table 2) and non-powerplay overs (Table 3). Certain field-settings were linked with varying rates of dot balls, boundaries, and runs conceded. However, no field-settings demonstrated a statistically significant relationship with wickets taken. Among the identified field-settings, #2, #3, #6 (powerplay) and #1, #4, #20 (non-powerplay) emerged as the most desirable strategies for fielding teams.
Association between powerplay field-settings and team technical performance variables. Results for binary variables are presented as Odds Ratios (OR) and for count variable as Incidence Rate Ratio (IRR). Values greater than 1 indicates a higher likelihood (OR) or rate (IRR) relative to the reference field-setting #10 (most frequently employed in powerplay). Bold values represent desirable outcomes for the fielding team. * p ≤ 0.05; ** p ≤ 0.01; *** p ≤ 0.001

Association between non-powerplay field-settings and team technical performance variables. Results for binary variables are presented as Odds Ratios (OR) and for count variable as Incidence Rate Ratio (IRR). Values greater than 1 indicates a higher likelihood (OR) or rate (IRR) relative to the reference field-setting #16 (most frequently employed in non-powerplay). Bold values represent desirable outcomes for the fielding team. * p ≤ 0.05; ** p ≤ 0.01; *** p ≤ 0.001.

Discussion
This study seeks to address the limited understanding of tactical fielding performance in cricket research and practice, by analysing fielder location data. The primary aim of the study was to identify and describe typical placement of fielders and secondarily examine their association with measures of team performance in T20 international cricket. The analysis identified 21 distinct field-settings, some of which were statistically associated with team technical performance variables; dot balls, boundaries, and runs, highlighting the relevance of strategic fielding to improve team performance. To our knowledge, this is the first study to introduce a method to evaluate tactical fielding performance using fielder location data, offering a novel framework that advances the current understanding and supports more informed strategic decision-making in any format of cricket, especially T20 cricket.
A key strength of this study lies in its ability to enable quantitative comparisons between field-settings and their potential influence on team performance. For instance, pace bowlers bowling during the non-powerplay overs employed field-settings #14 and #17, which appeared largely similar but differed primarily in the positioning of two fielders. The results indicated that field-setting #17 was associated with a significantly lower likelihood of conceding runs. Such findings allow the fielding teams to make more informed decisions, such as whether to retain a “deep-third” fielder (field-setting #17) or employ a “short-third” with the “point’ fielder positioned at the boundary (field-setting #14). These tactical decisions can be further guided by team technical performance variables for specific bowlers and batters’ characteristic, thereby exploiting opposition strengths and weaknesses. For instance, field-setting #4 and #20 (with most outfielders positioned on or behind “square leg”) were identified as the most desirable strategies for the fielding team. As these strategies were primarily employed by pace bowlers, fielding teams may have tried forcing batters into playing back-foot shots; a tactic previously shown to produce greater-than-expected dot balls in limited-overs cricket. 32 Regression analyses further demonstrated significant associations between certain powerplay field-settings (i.e., #2, #3 and #6) and team technical performance variables, such as dot balls, boundaries and runs, highlighting the tactical relevance of fielding-settings on team performance. Surprisingly, it was found that none of the identified field-settings were significantly associated with wickets in either the powerplay or non-powerplay. While further investigation is required to better understand this finding, it is likely explained by a combination of factors. Previous research suggests that batting performance characteristics may have a stronger influence on match outcome than bowling performance in T20 cricket, particularly given the importance of maintaining higher scoring rates.2,33 As a result, captains may prioritise minimising run-scoring opportunities as compared to wicket-taking strategies in T20 cricket. While certain combinations of delivery type and field-setting can influence the type of shot played and potentially induce batting error, it is also important to recognise that not all dismissals are directly influenced by field-settings (e.g., bowled or LBW). Finally, the relatively smaller sample size of wickets taken compared with other performance outcomes such as dot balls, boundaries and runs may have limited the statistical power to detect significant association.
The identified field-settings revealed a predominant 5:4 distribution of fielders (excluding the bowler and the wicket-keeper) between the off-side and on-side (Figure 1). While this trend was generally consistent throughout the innings, powerplay overs occasionally exhibited a 6:3 distribution. The absence of related research limits the ability to draw definitive conclusions. Nonetheless, the increased prevalence of 6:3 configurations during powerplay overs may reflect tactical adaptations, such as the inclusion of an additional catching fielder (i.e., slip), as observed in several field-settings (e.g., #3, #5, #6). Additionally, it was observed that certain field-settings employing a slip fielder were more common during the initial powerplay overs (e.g., #3, #5, #6, #10, #13), whereas field-settings without a slip fielder were more frequent during the latter half of the powerplay (e.g., #11, #21) (Appendix A). The findings align with the characteristics of the new ball, which is more conducive to swing bowling and may increase the likelihood of dismissing batters, 34 thereby justifying the use of an additional catching fielder. Among the non-powerplay field-settings, #4 was utilised by pace bowlers during the middle overs (Appendix A), which was characterised by only four outfielders (compared with the maximum five permitted) while retaining a slip fielder. While this represents a relatively uncommon tactic for pace bowlers during non-powerplay, it may have been influenced by contextual factors such as the opposition score, quality of the batter or pitch and weather conditions. To better understand such nuances, future studies may consider classifying field-settings (e.g., aggressive vs defensive) based on the inclusion of catching fielders, such as slip, to enhance the tactical interpretation of positional patterns and their influence on team performance.
As well as identifying frequently used field-settings, the purpose of this study was to describe appropriate analytical methods that can be used for the same in other formats of cricket (e.g., Test and ODI). Unsupervised machine learning techniques, such as clustering, can identify underlying patterns in sport performance data, 35 e.g., fielder location data. K-means remains a widely used algorithm due to its computational efficiency and simplicity; however, it assumes clusters to be of relatively equal size and requires pre-specification on the number of clusters. 36 These assumptions limit its applicability in identifying field-settings as they may vary in size (e.g., field-setting #16, n = 2586 vs field-setting #9, n = 73), and where no prior knowledge exits regarding optimal number of field-settings (clusters). Hierarchical clustering avoids this requirement by constructing nested structures, yet its computational inefficiency with larger datasets and the challenge of selecting an appropriate cut height (to define number of cluster) reduces its practicality.37,38
Given the absence of research analysing fielder location data in cricket, direct comparisons with the current findings are challenging. In contrast, other sports such as soccer benefit from well-established knowledge of positional patterns (formations), their sub-types, and their relative frequencies. 39 Research in soccer has applied clustering techniques to analyse team structure and evaluate tactics. For example, one study identified 20 team formations using agglomerative hierarchical clustering, employing Wasserstein distance to quantify dissimilarity between formations. 21 While effective for smaller datasets (less than 40% of the size of the current study), the pairwise computation of Wasserstein distance becomes computationally expensive and inefficient when extended to larger datasets. Furthermore, both K-means and hierarchical clustering rely on parametric assumptions about cluster shape (i.e., Gaussian ball), 37 are sensitive to outliers, and enforce hard membership allocation to all data points.36,38 Consequently, rare field-settings were often absorbed into larger clusters, leading to dispersion and inaccurate representation of actual field-settings. Gaussian Mixture Models (GMMs) partially address these limitations by permitting elliptical clusters and soft membership allocation. Nonetheless, they remain constrained to Gaussian distributional assumption and perform poorly in highly noisy dataset. 40 In contrast, density-based clustering algorithms are non-parametric, identify clusters as high-density regions (i.e., more frequently employed field-settings), and separate them from sparse areas, offering a more robust framework to identify meaningful field-settings.
Given that real-world data are often noisy, incomplete, and inconsistent, 41 one of the most adopted density-based algorithms demonstrating robustness under such conditions is DBSCAN. The algorithm can identify clusters of arbitrary shape and size without requiring a predefined number of clusters.36,40 However, its performance is highly sensitive to parameter selection and perform poorly when cluster densities vary. 40 To address these limitations, this study employed HDBSCAN, which extends the DBSCAN framework by constructing a hierarchical representation of the data and runs DBSCAN across a range of epsilon (radius) values. 37 This differs from traditional hierarchical clustering, where clusters are typically selected from a single cut of the dendrogram, whereas HDBSCAN identifies clusters across multiple levels of the hierarchy. 42 This allowed the identification of field-settings that varied in both size and density. Additionally, HDBSCAN is computationally fast, inherently robust to noise, and requires minimal hyperparameter tuning (primarily minPts parameter).43,44 The algorithm permits data points (i.e., field-setting) to remain unassigned when insufficient confidence exists in their cluster membership. 37 Consequently, these characteristics of HDBSCAN enabled the identification of interpretable field-settings with minimal within-cluster dispersion.
While this study provides novel insights by introducing a data-driven methodology to identify, define, and analyse distinct field-setting strategies in men's T20 international cricket, certain limitations must be acknowledged. The analysis was restricted to a single format, hence future research should extend this framework to other formats, particularly Test cricket, where fielders are typically positioned in closer proximity. Applying the methodology to women's cricket may also yield novel insights, given the distinct rules (e.g., a maximum of four fielders outside the restriction area during non-powerplay overs) that can influence fielder positioning. From a methodological standpoint, using the Wasserstein distance metric to reassign data points introduced within-cluster dispersion, potentially altering the true definition of identified field-settings. Future analyses could consider alternative similarity measures, such as the linear optimal transport method, 45 to assess whether such an approach would yield different results in identifying or reassigning field-settings. Additionally, while tracking data may be prone to projection inaccuracies, 46 this research analysed secondary data that were not originally collected for scientific analysis, resulting in 20.29% of deliveries remaining unassigned. These unassigned instances (non-standard field-settings) may still hold analytical value for subsequent analyses, rather than representing meaningless data. Future research could explore how adjustments to the minPts hyperparameter influence the identification and granularity of field-settings.
Moreover, validating the robustness of these findings using datasets collected under varying contextual conditions (e.g., pitch type, venue, or weather) would strengthen the generalisability of the clustering approach. Future research could draw insights from a recent soccer study that used player-tracking to develop a framework to reconstruct team's initial tactics to enhance corner kicks outcome. 17 Similar to the soccer study, the current study's findings could support the development of predictive or generative models capable of reconstructing initial field-settings and suggesting optimal positional adjustments to improve the likelihood of success. Additionally, the present study's findings can assist in building a field-setting retrieval system, allowing practitioners to evaluate the effectiveness of previously deployed field-settings, develop new tactics and counter-strategies, and minimise reliance on time-consuming video analyses. Also, future analyses could integrate the present study's findings with other data sources (e.g., ball-tracking) to inform match strategies on optimal field positioning relative to delivery type. It would be valuable to investigate how such analyses influence fielding actions, shot selections, and match outcome. Additionally, future analyses could evaluate the relative importance of individual fielding positions within a field-setting to inform strategic placement of higher-performing fielders in key locations. Such advancements could not only improve a team's performance but also enrich narrative storytelling for broadcast audiences.47,48 Future research should also consider qualitative validation of the identified field-settings, e.g., through interviews with elite coaches to understand how the current study's findings could be implemented at the international level. Such research may provide insight into the challenges associated with applying these recommendations and assist determine whether these findings can act as a practical decision support system tool for live tactical decision-making in cricket.
Conclusion
This study represents the first comprehensive analysis of fielder location data to address the limited attention on tactical fielding performance in cricket research and practice. The study applied unsupervised machine learning algorithm to identify 21 distinct field-settings (powerplay: 11; non-powerplay: 10) in T20 international cricket. There were significant associations identified between certain field-settings, i.e., #2, #3, #6 (powerplay) and #1, #4, #20 (non-powerplay), and team technical performance variables such as dot balls, boundaries, and runs. None of the field-settings were found to be statistically significant with wickets taken. These findings provide a data-driven approach to optimise fielder positioning strategies for pre-match planning, in-game tactical adjustments, and opposition analysis that can assist in improving team performance and enhance the storytelling experience for broadcast audience. Future research should expand on these findings by analysing data in different formats (e.g., Test or women's international cricket) and under varying contextual conditions to identify variations in fielding strategies and validate the robustness of the proposed clustering approach. Combining such analyses with other data sources (e.g., ball tracking) could further advance the tactical decision-making processes and understanding of cricket performance.
Footnotes
Acknowledgements
The authors would like to thank Quidich Innovation Labs for their support to share the data for research purposes. The authors also thank Gavin Abbott (Statistician and Data Manager, Institute of Physical Activity and Nutrition, Deakin University) for his advice regarding the selection of appropriate statistical tests for the analysis.

Ethical considerations
The study received an ethics exemption approval from the Deakin University Human Ethics Advisory Group (2025/HE000204).
Funding
The authors received no financial support for the research, authorship, and/or publication of this article.
Declaration of conflicting interests
The authors declared no potential conflicts of interest with respect to the research, authorship, and/or publication of this article.
Data availability
The author(s) cannot make the data publicly available as it would violate the licensing agreement between the author(s) and the data provider.