
Abstract
Field-based assessment of spatiotemporal kinematics including contact time (CT), flight time (FT), step time (ST), step length (SL), step frequency (SF), and step velocity (SV) is essential for evaluating sprint performance, yet existing methods are often inaccessible for coaches. The aim of this study was to examine the agreement between a markerless motion capture (MMC) system (VueMotion) and a field-based system (OptoJump™) for measuring spatiotemporal kinematics. Seventeen participants performed a total of 75 flying 20 m sprints in which spatiotemporal parameters were simultaneously obtained using OptoJump™ and VueMotion via a consumer smartphone (4k, 60 fps). Individual step analysis (n = 748) showed minimal bias (≤0.3%) for ST (bias: 0.000 s; LoA: ± 0.015 s), SF (bias: −0.01 Hz; LoA: ± 0.27 Hz), SL (bias: 0.2 cm; LoA: ± 10.1 cm), and SV (bias: −0.03 m·s−1; LoA: ± 0.61 m·s−1). Although overall temporal measurement was accurate, sub-component metrics demonstrated that the MMC system overestimated CT (−2.9%; bias: −0.003 s; LoA: ± 0.015 s) and underestimated FT (3.4%; bias: 0.004 s; LoA: ± 0.015 s). While systematic bias remained consistent for trial-averaged (20 m) parameters (n = 75), limits of agreement narrowed substantially: avg-CT (LoA: ± 0.006 s), avg-FT (LoA: ± 0.006 s), avg-ST (LoA: ± 0.002 s), avg-SL (LoA: ± 1.5 cm), avg-SF (LoA: ± 0.04 Hz), and avg-SV (LoA: ± 0.11 m·s−1). Currently, assessments of single-step metrics should be interpreted with caution due to random error; however, our findings indicate that average metrics provide a viable approach for monocular MMC spatiotemporal analysis using consumer-grade hardware.
Introduction
Motion capture has advanced biomechanical analysis, providing deeper insight into sporting performance, injury mechanisms, and training optimisation.1,2 Spatiotemporal kinematics define the position (spatial) and timing (temporal) of key gait events and are essential for assessing sprinting performance. 3 Maximal sprint velocity, a critical factor for sprint performance,4–6 is determined by the product of spatiotemporal gait variables step length (SL) and step frequency (SF).3,7 These spatiotemporal kinematics, based on the interaction between ground contact time (CT) and flight time (FT), provide key insights into performance that may guide training and rehabilitation. 6 Given the high-velocity nature of sprinting, detecting subtle but meaningful changes in spatiotemporal kinematics requires measurement systems that can quantify these with both accuracy and precision. 6
To meet these demands, researchers and practitioners have traditionally relied on laboratory-based systems such as multi-camera, three-dimensional (3D) motion capture systems and/or force plates. These gold-standard systems provide accurate landmark tracking and precise measurements of ground reaction forces, enabling valid and reliable biomechanical assessment. 2 Despite these advantages, their ecological validity is constrained by significant practical limitations, including extensive setup time, the necessity for reflective markers, high equipment costs, and typical confinement to laboratory-based settings.1,2 To address these limitations, field-based systems have been increasingly adopted as a practical alternative for performance testing and research, though they often sacrifice accuracy and precision to enhance ecological validity. 8
Among field-based solutions, photoelectric systems like OptoJumpTM have become a standard in sprinting analysis due to their portability and capacity to provide real-time feedback on spatiotemporal kinematics. 9 By prioritising utility and practicality, this system has enhanced ecological validity, a key advantage over traditional gold-standard methods confined to laboratory settings.1,2 While enhancing ecological validity, the system's use of light diodes elevated 3 mm above the ground introduces a small but consistent overestimation of ground contact time (∼0.005 s ± 0.002 s) and underestimation of flight time (∼0.005 s ± 0.003 s).10,11 Although these systematic biases affect the contact-to-flight time ratio, the system maintains excellent overall temporal validity, with total time (flight plus ground contact time) aligning closely with force plate measurements.10,11 Beyond considerations of measurement accuracy, the system's modular 1 m units impose financial constraints, as the pay-per-interval setup necessitates multiple units for comprehensive analysis, potentially limiting data capture range. 12 Therefore, while OptoJump's capabilities have established it as the benchmark for field-based spatiotemporal analysis,10,12,13 its limitations necessitate exploring alternative technologies for more versatile and cost-effective solutions.
Wearable devices such as inertial measurement units (IMUs) have gained traction as a promising field-based solution for assessing spatiotemporal kinematics. These devices demonstrate moderate to excellent agreement with gold-standard measures; this accuracy is further enhanced when signals are integrated with velocity data from global positioning systems (GPS), 14 or laser measurement devices. 15 Whilst these systems can provide accurate measurements, they also require the athlete to wear a physical device (ankle, sacral or thoracic mounted), which may be invasive and influence performance. 16 Additionally, the need for signal post-processing can create a significant expertise barrier, limiting the usability for practitioners without specialised technical knowledge. 17 While wearables address some limitations of modular systems like OptoJump, they remain an incomplete solution for sprint-specific analysis, highlighting the need for accessible, non-invasive, and user-friendly alternatives tailored for high-speed assessment. 16
Video-based analysis, specifically two-dimensional (2D) digitisation, offers a valid and reliable framework for spatiotemporal assessment, eliminating the need for wearable sensors, costly equipment, or laboratory confinement. 18 Improvements in consumer-grade camera hardware (smartphones) and accessible analysis software (e.g., Kinovea) have made this approach highly accessible for quantitative sprint analysis. 19 Kinematic data are quantified from video via the time-consuming manual identification of discrete events or continuous frame-by-frame tracking of key anatomical landmarks. To simplify this workflow, user-focused smartphone applications have been developed to streamline analysis for specific metrics, such as low-speed treadmill temporal parameters (Runmatic) 20 in small capture volumes or overground sprint time/velocity profiling (MySprintApp). 21 Despite its accessibility and accuracy, manual digitisation demands significant time investment, limiting practical utility, particularly when spatial analysis, joint kinematics, or large-scale datasets are required. 1
Addressing these limitations, Markerless Motion Capture (MMC) has emerged as a solution, utilising advancements in computer vision and artificial intelligence (AI) to automate the digitisation process. These systems employ pose-estimation algorithms to automatically detect and track the coordinates of anatomical landmarks or gait events from video footage. 1 As MMC builds upon the established practice of video-based analysis, the technology is well-suited for integration into existing applied coaching workflows. 22 However, the accuracy and practical application of MMC can be influenced by choice of hardware (camera), software (pose-estimation algorithm), and the movement task complexity being assessed. 23 Consequently, a diverse range of MMC solutions has emerged, each tailored to specific applications ranging from complex biomechanical analysis to simplified tools optimised for field-based coaching. Given the rapid development of computer-vision methods, there is a pressing need to assess the accuracy and contextualise the utility of new MMC systems, ensuring coaches and researchers can make informed decisions. 24
VueMotion is an automated markerless motion capture system designed specifically for field-based sprint performance analysis using consumer-grade smartphone video. The MMC system uses a specialised pose estimation algorithm to track anatomical landmarks and identify key sprinting gait events, from which spatiotemporal kinematics are quantified. However, there has been no investigation examining the accuracy of this system. Therefore, the purpose of our investigation was to assess the concurrent agreement between VueMotion and OptoJump systems for measuring spatiotemporal kinematics including ground contact time, flight time, step time, step length, step frequency and step velocity.
Methods
Study design
A concurrent validation design was used to determine the agreement between a novel markerless motion capture system (VueMotion, Sydney, Australia) and an existing field-based reference system, OptoJumpTM Next (Microgate, Bolzano, Italy).
Participants
Seventeen participants (15 males and 2 females, 27.5 ± 7.4 years) ranging from recreational to national level volunteered to participate in the study. The participants had at least one year of sprint training experience and did not have any recent injuries or underlying medical conditions that could have hindered their ability to exert maximum effort during each sprint trial. The study was approved by the Australian Catholic University Human Research Ethics Committee (HRE 2021-201E). All participants provided written informed consent prior to participating in the study.
Procedures
Data were collected during a track and field training session. After completing a coach-led warm-up, participants performed an average of four sprints each, totalling 75 trials of flying 20 m sprints with a 30 to 40 m build-up prior to the 20 m capture zone. Flying sprints are a widely adopted protocol in sprint testing, involving maximal-effort sprints where participants accelerate over a self-selected distance (typically 30–40 m) to achieve near-peak velocity before entering a predefined measurement zone (typically 5–30 m). 25 Participants had between four and ten minutes of rest between repetitions. Testing was conducted on a regulation tartan track.
The OptoJump Next system consisted of twenty pairs of transmitting and receiving bars (100 cm x 10 cm x 4.5 cm), aligned in parallel and separated by 1.22 m covering the entire 20 m capture zone. Each bar contained 96 light-emitting diodes (LEDs) separated by 1.04 cm and positioned 3 mm above the running surface. The system detects interruptions in the light beams to calculate spatiotemporal kinematics including SL, SF, CT, FT, ST (CT + FT), and SV. The system was used as a field-based criterion because it has been shown to have a high agreement with videography for step length, and exhibits small temporal offsets versus force plates that can be bias-adjusted. 26 Spatiotemporal kinematics were automatically calculated and extracted by the OptoJump proprietary software (OptoJumpTM Next software, version 1.12.23.0). OptoJump contains a minimum threshold of 5 cm for contact detection, due to the variable nature of flying sprints, occasionally the system would fail to register a step length for the first or final step in zone (n = 23). These were removed prior to analysis. Additionally, the system occasionally missed steps entirely, producing erroneous data or blank cells (n = 6), these were manually identified and removed, along with the corresponding subsequent step.
Video data were captured using an iPhone 12 Pro Max (Apple Inc., Cupertino, CA, USA) recording at 4 K resolution (3840 × 2160) and 60 fps. The device was configured to a uniform frame rate and mounted on a 1.5 m tripod positioned 19 m away from the plane of motion. The optical axis was aligned perpendicular to the centre of the 20 m capture zone (Figure 1B). Spatial calibration was achieved using five reference cones: pairs of cones separated by the 1.22 m lane width were placed at the start (0 m) and finish (20 m), with a single cone at the midpoint (10 m) (Figure 1B).
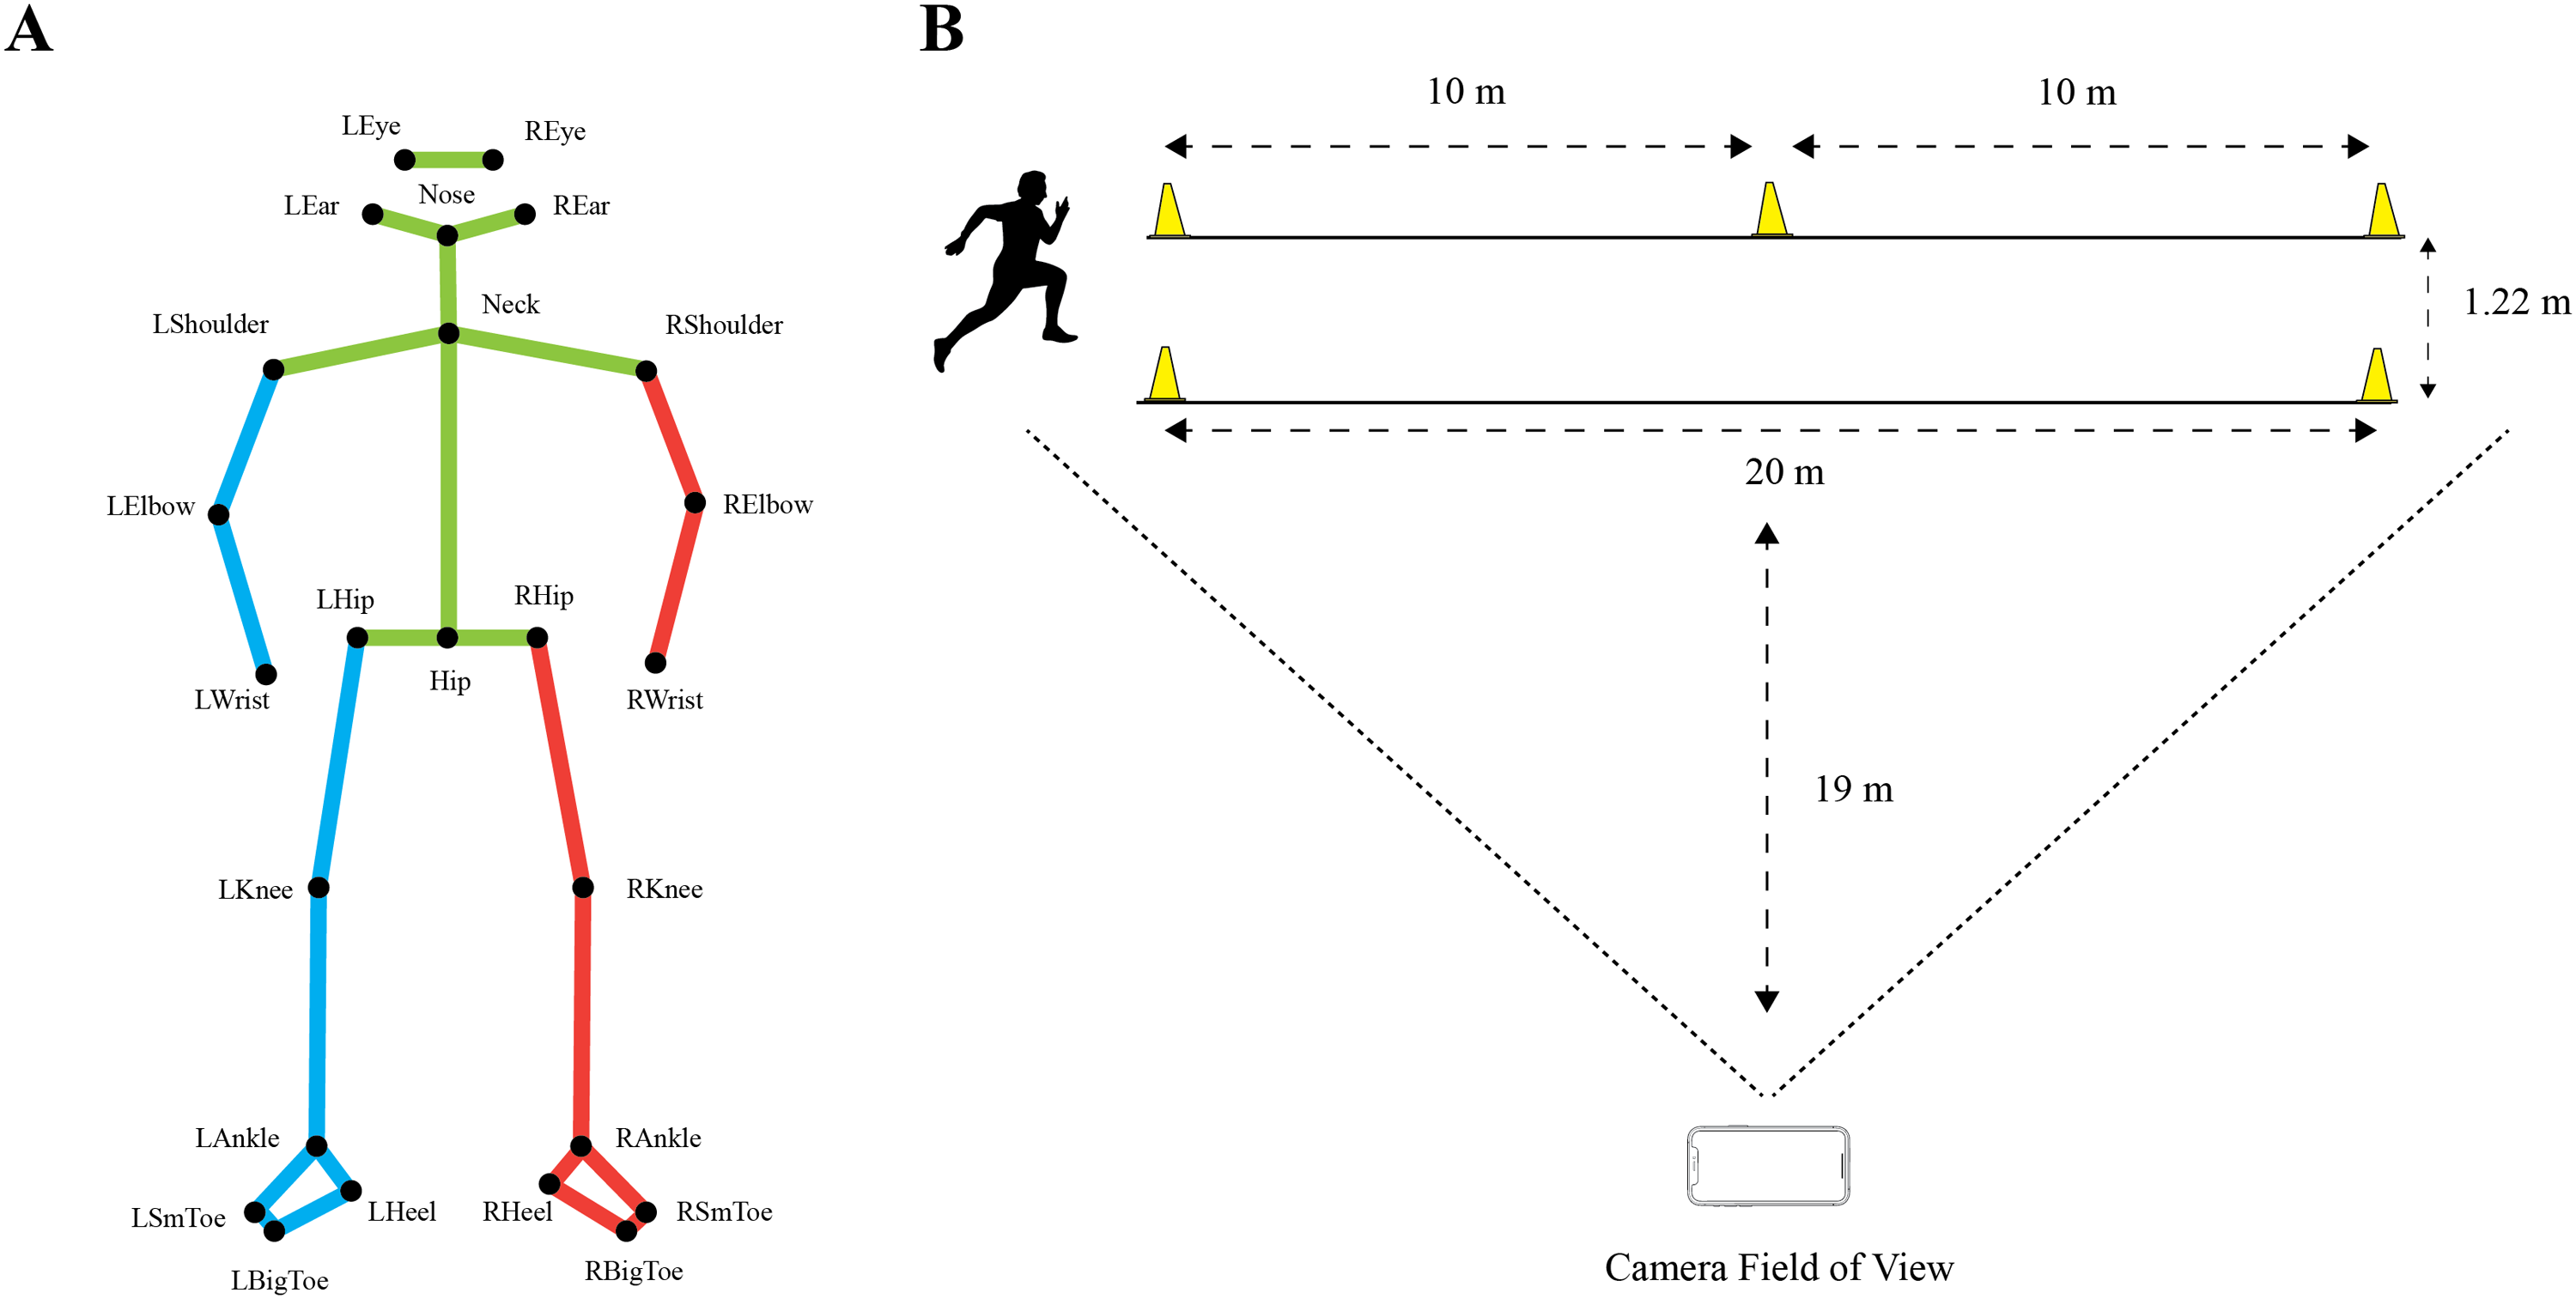
Markerless motion capture model and testing schematic. (A) Markerless motion capture pose model with 25 anatomical landmarks (L = Left; R = Right; Sm = Small). (B) Schematic diagram of the experimental setup and camera positioning.
Raw video files were uploaded to the VueMotion cloud-based service (version 0.0.768) and analysed using a multi-level processing pipeline. This process first detects all humans in the scene to track and isolate the specific athlete of interest. Once isolated, the algorithm estimates body pose using a 25-point anatomical model to enable kinematic assessment (Figure 1A). To calibrate the image coordinate system to the real world, the algorithm employs a computer vision-based homography technique. Within the image domain, each calibration cone is modelled geometrically as a triangle, with the midpoint of the triangle's base serving as the reference point. By correlating these five detected points with the known physical distances between the cones, the system establishes a homography matrix that maps the 2D image coordinates to the planar world coordinate system.
Following calibration, the pipeline utilises a specialised event detection algorithm designed to identify key gait events, specifically touchdown (first visible frame of ground contact) and toe-off (last visible frame of ground contact). Temporal parameters including CT, FT, and ST were calculated using the frame count multiplied by the frame interval (1/60 s). Step frequency was subsequently derived as the reciprocal of step time (1/ST). Step length was calculated based on the horizontal displacement of the big toe landmark between consecutive contacts. Step velocity was calculated as the product of SL and SF. Data extraction focused exclusively on full steps, excluding partial steps entering or exiting the capture zone. Finally, to verify the automated system's side detection (left vs. right), results were manually cross-referenced with the raw video footage.
Statistical analysis
To quantify the agreement between the VueMotion and OptoJump systems, the bias and corresponding 95% LoA were calculated using a linear mixed-effects model. 27 This model included each participant as a random effect to account for repeated measurements from the same participant.28,29 The direction of bias was defined as OptoJump minus VueMotion (OptoJump − VueMotion), such that negative values indicate higher measurements by VueMotion relative to OptoJump. Spatiotemporal kinematics were compared for individual steps (step-to-step) and trial-averages over the 20 m fly zone. Device agreement was graphically represented with Bland-Altman LoA plots.28,30 Statistical analyses were conducted in R statistical software (version 4.4.3) 31 using the ‘lme4’ 32 and ‘simplyagree’ 33 packages.
Results
Table 1 contains the individual step inter-device agreement. Table 2 contains the trial-averaged step inter-device agreement. Figure 2 presents the Bland-Altman 95% LoA plots for temporal measurements, illustrating both step-to-step and trial-average data. Similarly, Figure 3 presents the Bland-Altman 95% LoA plots for SL, SF, and SV, illustrating step-to-step and trial-average data. The automated system correctly identified the contact side for all 748 verified steps.
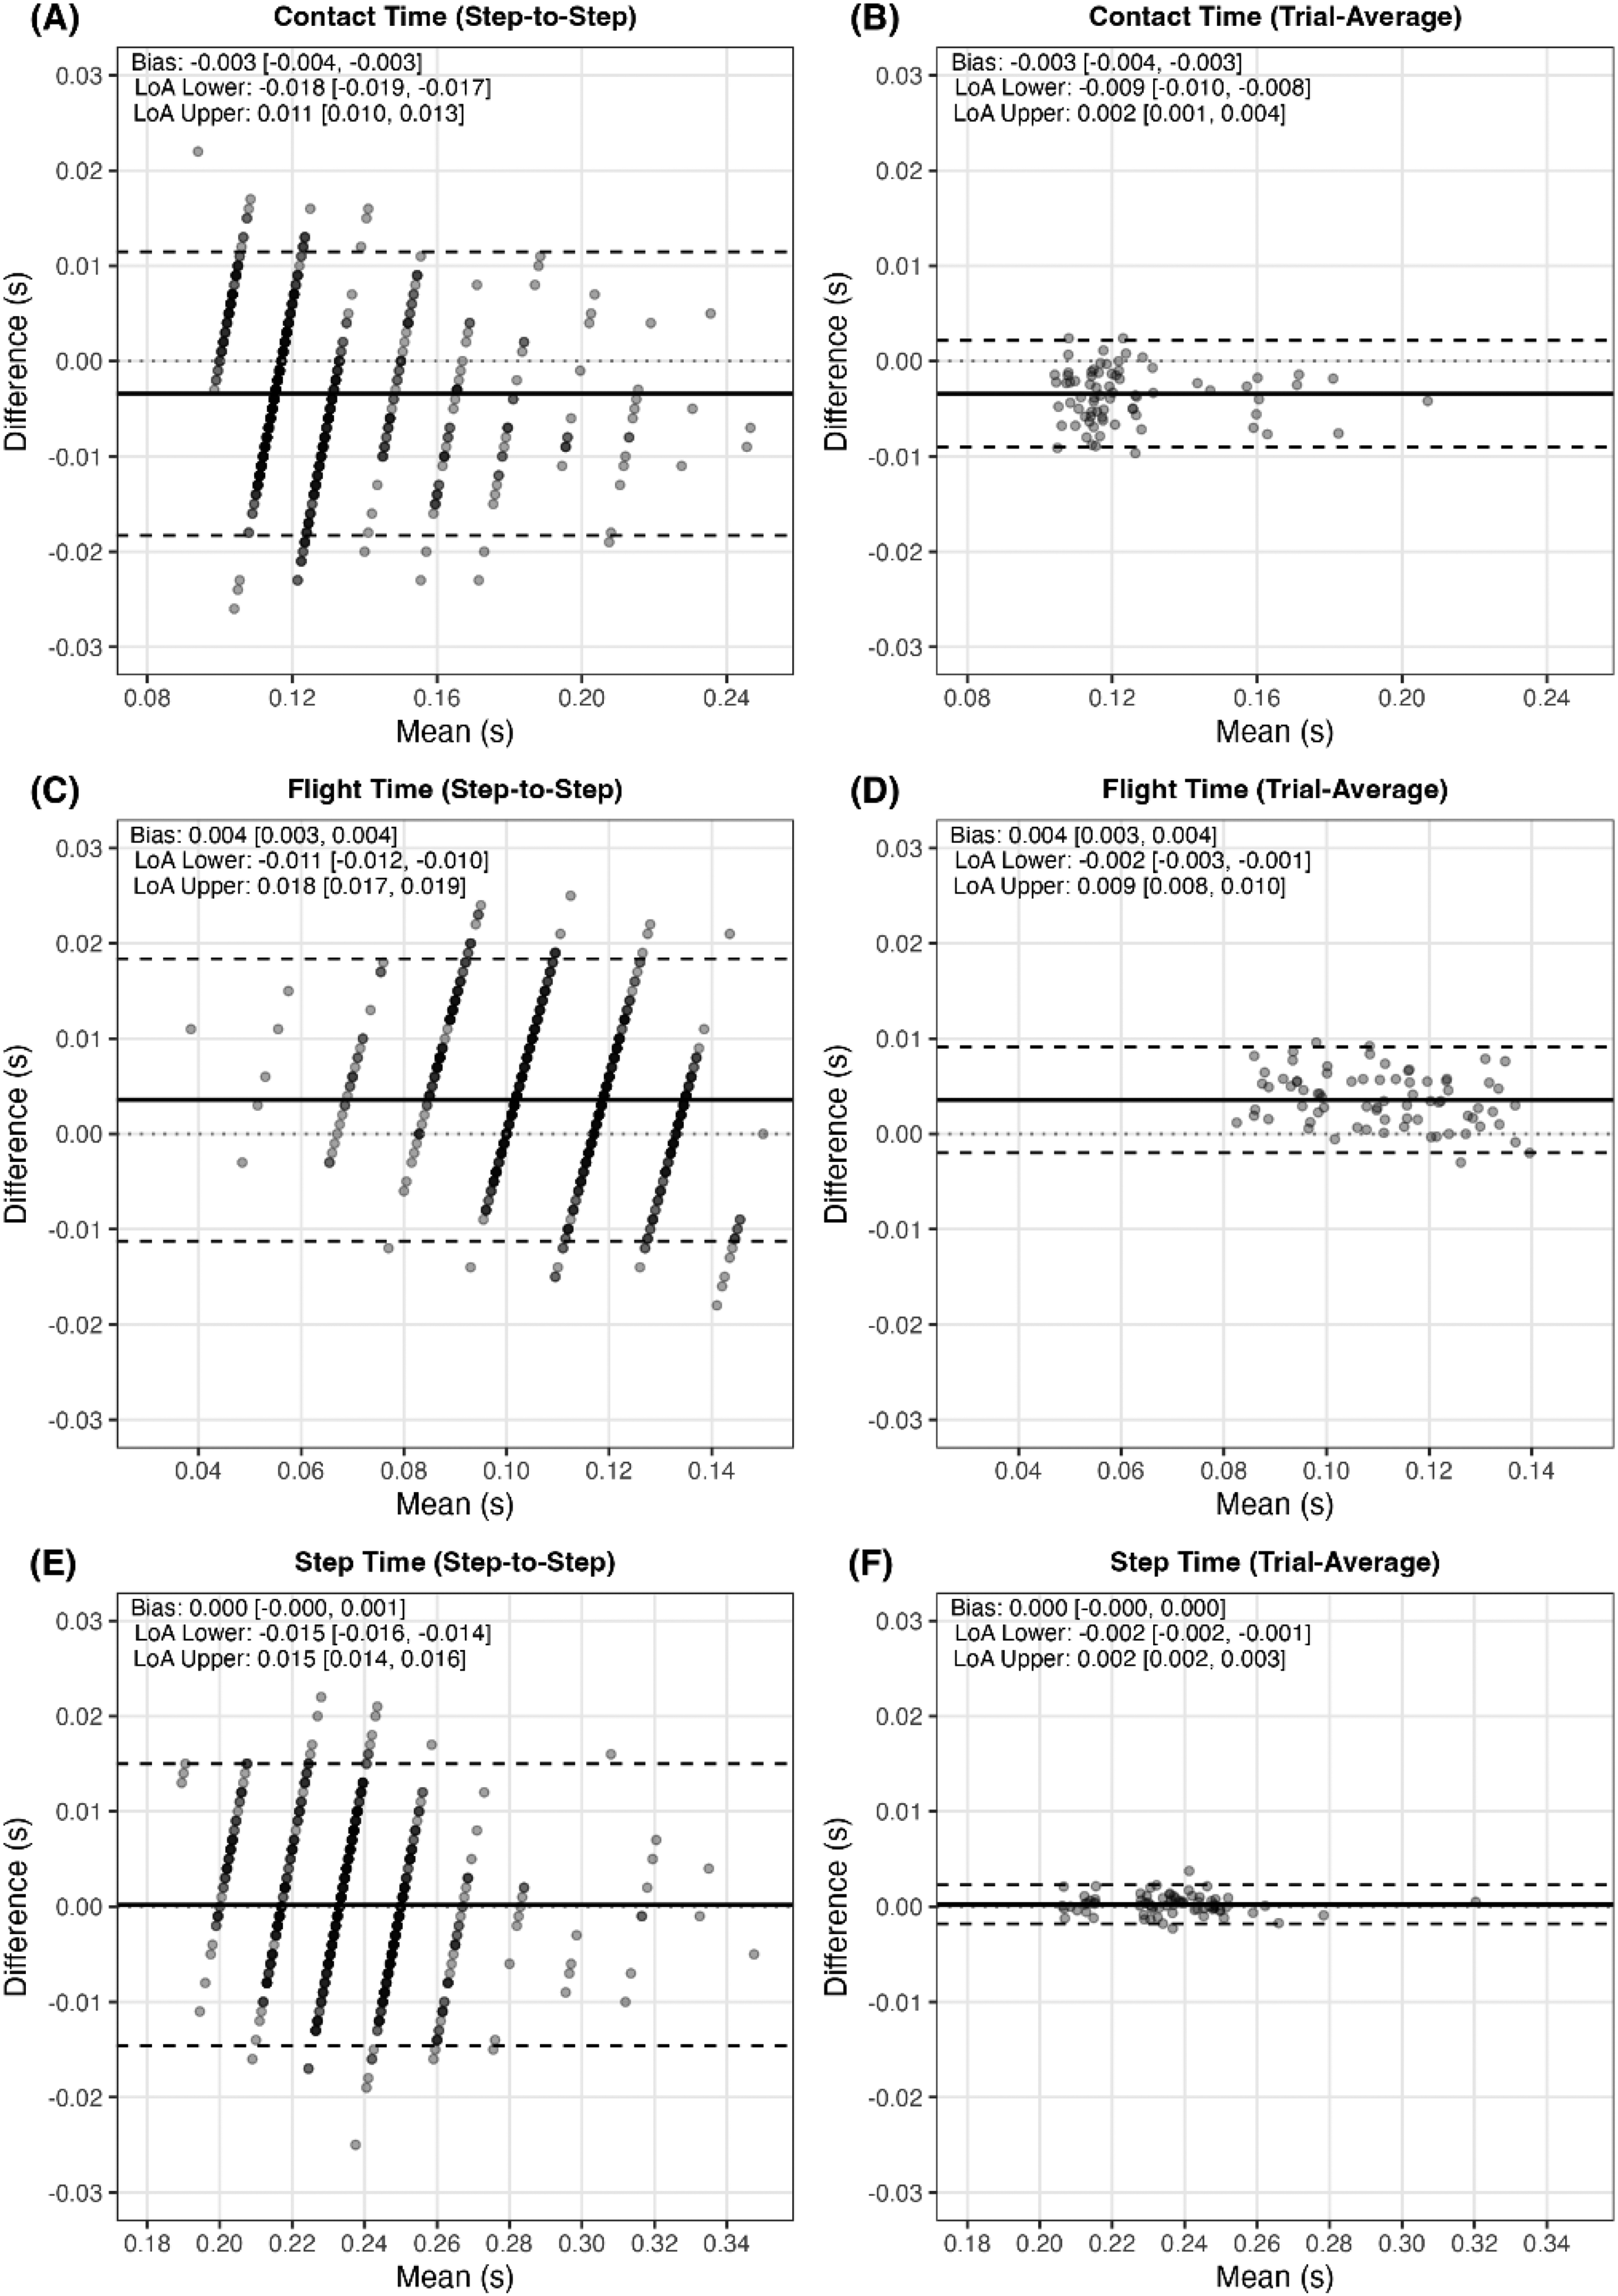
Bland-Altman 95% limits of agreement plots for temporal variables. Contact Time (A, B), Flight Time (C, D), and Step Time (E, F). The left column represents step-to-step comparisons, while the right column represents trial-averaged comparisons. The y-axis shows the difference between methods (OptoJump – VueMotion), and the x-axis shows the mean of the two methods. The solid black horizontal line indicates the mean bias, while the dashed black horizontal lines represent the 95% Limits of Agreement (LoA). Dotted grey line is a zero bias reference line. Bias and upper and lower LoA are displayed with 95% confidence intervals in the upper-left of each plot.
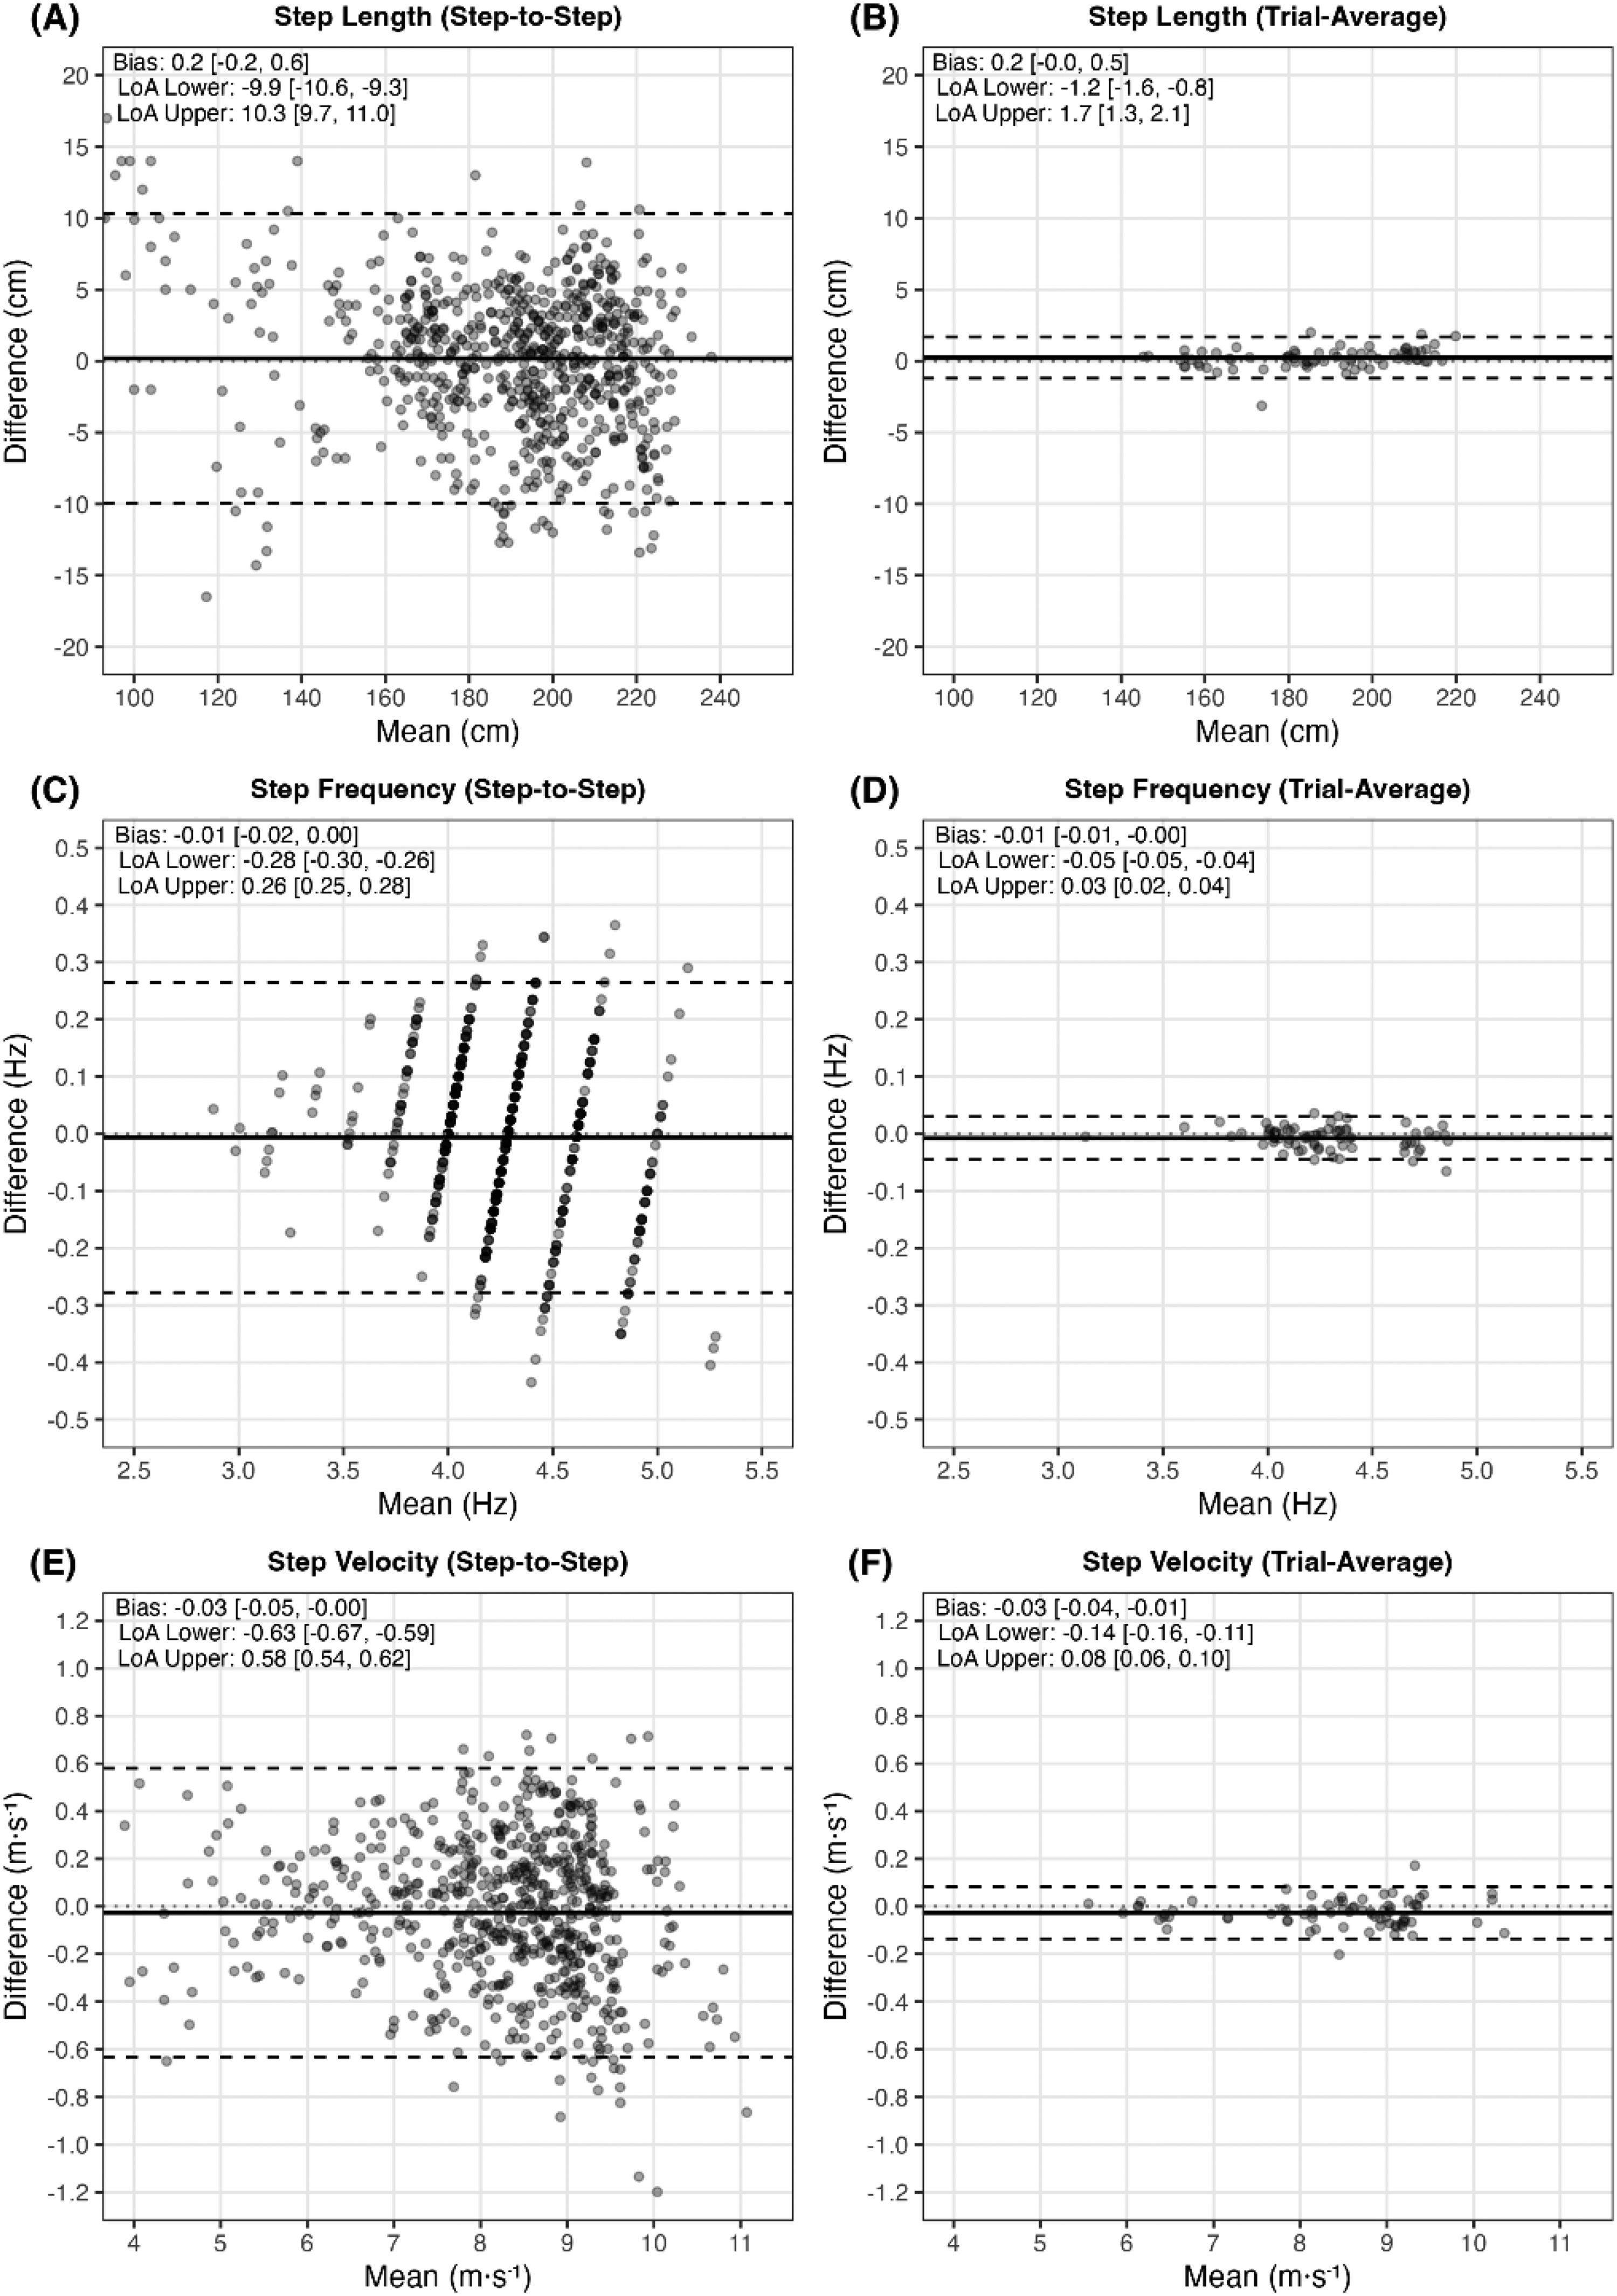
Bland-Altman 95% limits of agreement plots for step length, step frequency, and step velocity. Step Length (A, B), Step Frequency (C, D), and Step Velocity (E, F). The left column represents step-to-step comparisons, while the right column represents trial-averaged comparisons. The y-axis shows the difference between methods (OptoJump – VueMotion), and the x-axis shows the mean of the two methods. The solid black horizontal line indicates the mean bias, while the dashed black horizontal lines represent the 95% Limits of Agreement (LoA). Dotted grey line is a zero bias reference line. Bias and upper and lower LoA are displayed with 95% confidence intervals in the upper-left of each plot.
Inter-device agreement for contact time, flight time, and step time.
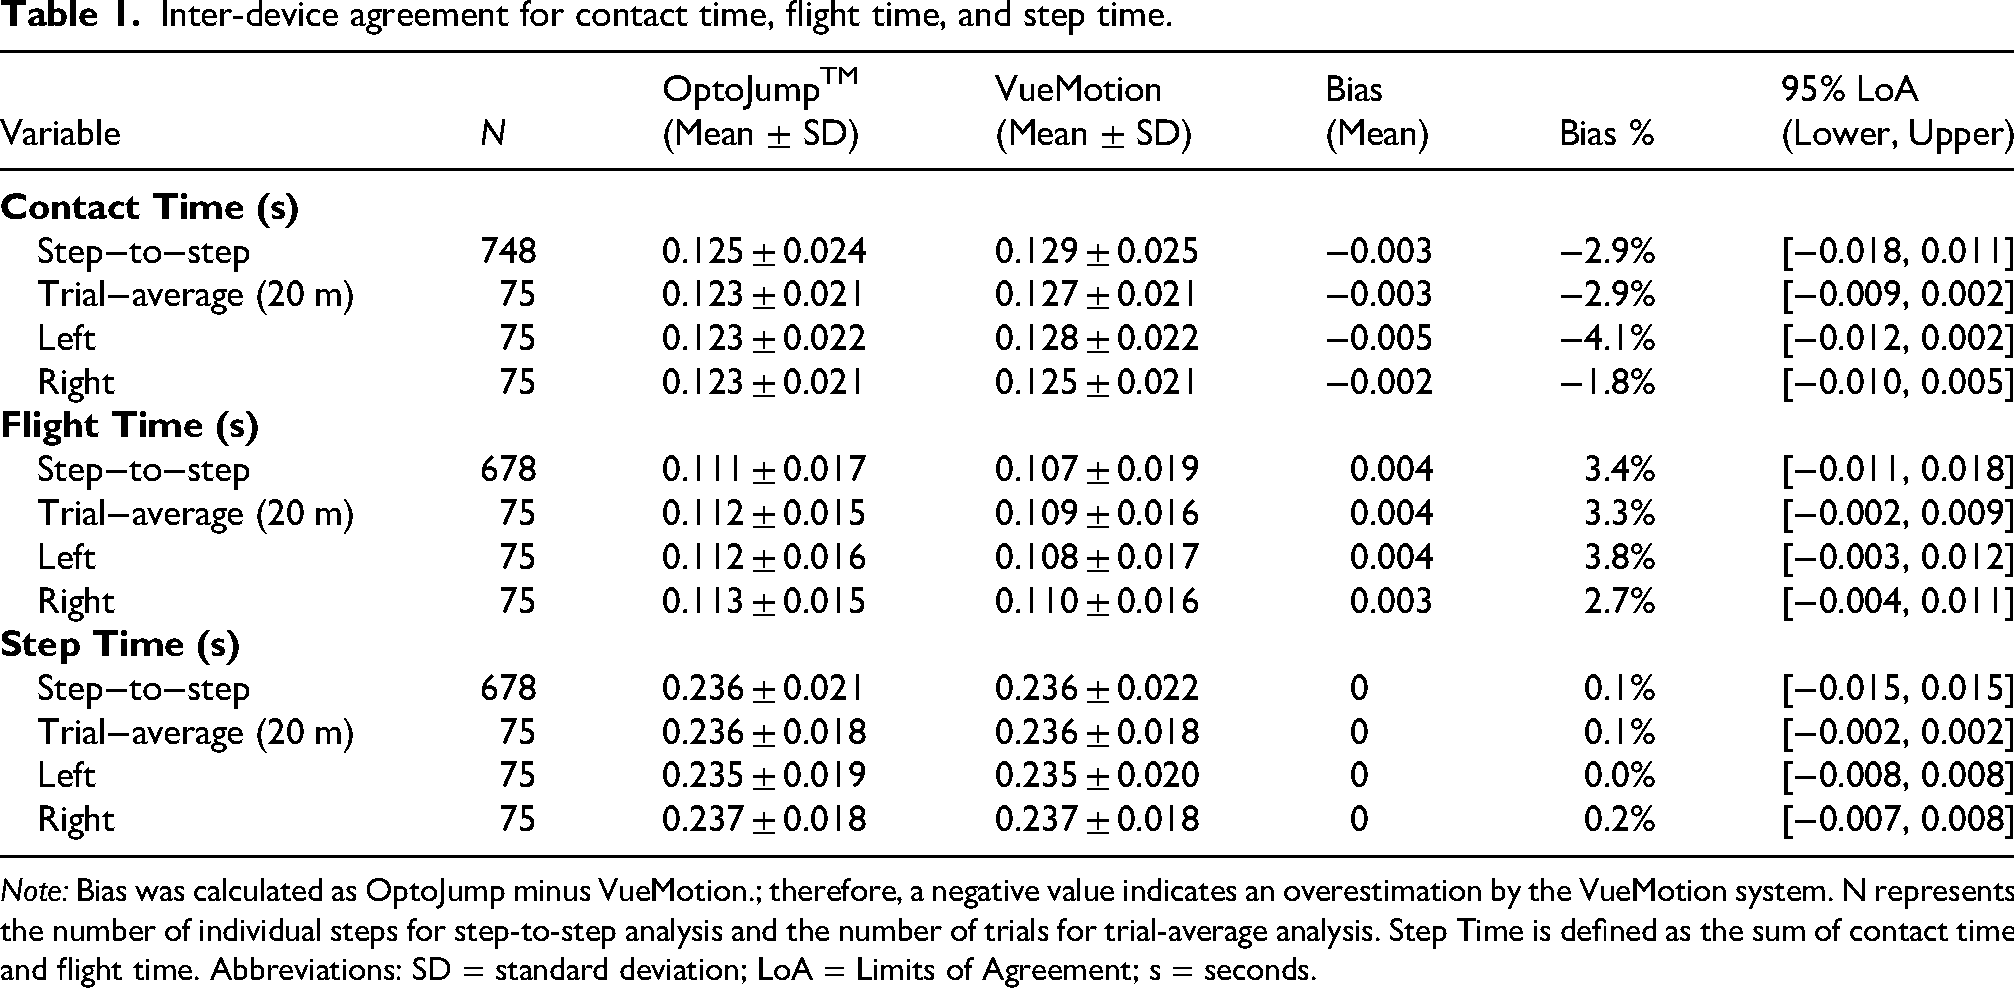
Note: Bias was calculated as OptoJump minus VueMotion.; therefore, a negative value indicates an overestimation by the VueMotion system. N represents the number of individual steps for step-to-step analysis and the number of trials for trial-average analysis. Step Time is defined as the sum of contact time and flight time. Abbreviations: SD = standard deviation; LoA = Limits of Agreement; s = seconds.
Inter-device agreement for step length, step frequency, and step velocity.
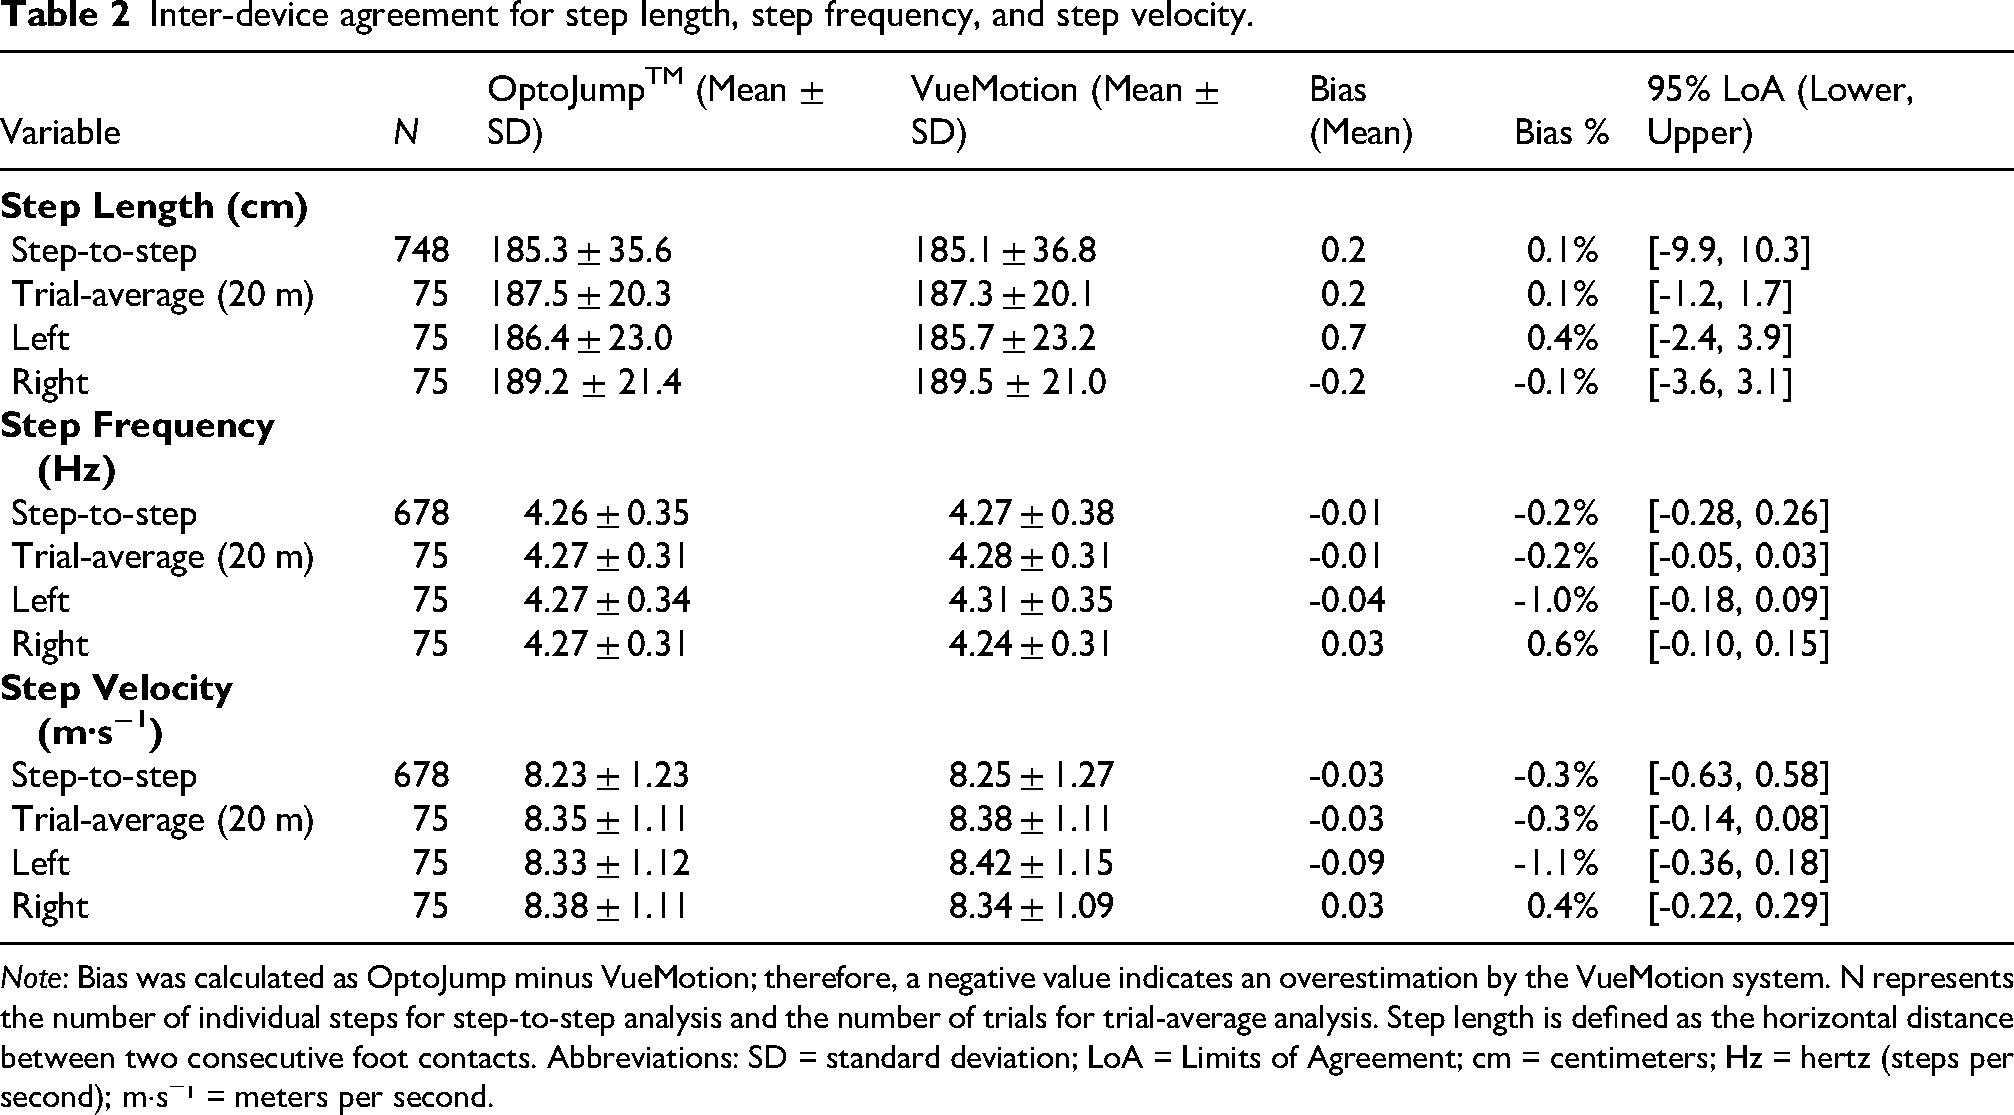
Note: Bias was calculated as OptoJump minus VueMotion; therefore, a negative value indicates an overestimation by the VueMotion system. N represents the number of individual steps for step-to-step analysis and the number of trials for trial-average analysis. Step length is defined as the horizontal distance between two consecutive foot contacts. Abbreviations: SD = standard deviation; LoA = Limits of Agreement; cm = centimeters; Hz = hertz (steps per second); m·s−¹ = meters per second.
Discussion
The primary aim of this study was to assess the agreement between a single-camera 2-D markerless system (VueMotion) and a photoelectric system (OptoJump) for measuring spatiotemporal kinematics. Our results demonstrate minimal bias (<0.3%) for ST, SF, SL, and SV, indicating a high degree of accuracy. However, despite the strong agreement for overall temporal measurements (ST [0.1%]), sub-component metrics revealed systematic differences in CT (−2.9%) and FT (3.4%), likely reflecting differences in event detection methodology between systems. While accuracy remained high, precision (random error) for individual steps was variable, potentially constrained by the temporal resolution of 60 Hz video. When steps are averaged across the trial (combined or per side) over the 20 m fly zone, accuracy was maintained with enhanced precision, evidenced by narrower LoA across all variables (Figures 2 and 3).
In our evaluation of spatial measurements, SL demonstrated high agreement, with a sub-centimetre bias for both individual (0.2 cm) and averaged steps (0.2 cm). These results are consistent with the bias reported in previous manual video-based validations against OptoJump (bias: 0 cm; LoA: ± 6 cm) 26 and force plates (bias: 0 cm; LoA: ± 5 cm), 34 suggesting that automation has not compromised spatial accuracy. Although our precision (random error) for individual steps was wider (LoA: ± 10.1 cm) than previously reported, this random error was substantially reduced when assessing average SL per side (LoA: ± 3–4 cm) or combined (LoA: ± 1.5 cm) (Figure 3). Consequently, practitioners are advised to exercise caution when making performance or rehabilitation decisions based on single step SL and should instead prioritise average SL to optimise precision. Notably, the system correctly identified the contact limb (i.e., left or right) for all 748 steps. This enables inter-limb comparison of averaged metrics, such as left versus right SL, which could support asymmetry detection in rehabilitation and return-to-sport monitoring. These findings indicate that MMC offers spatial accuracy on par with established field-based systems, although average metrics are required to achieve comparable precision.
Temporal measurements revealed high accuracy, with no detectable bias for ST. This finding aligns with the bias reported in previous manual video-based validations against OptoJump (bias: 0.00 s; LoA: ± 0.012 s). 26 Despite this accuracy, precision was constrained by hardware limitations; the observed LoA (± 0.015 s) corresponded closely to the ∼0.017 s frame interval of 60 Hz video, suggesting the error is largely attributable to the temporal resolution limit. While this random error limits single-step precision, it can be effectively attenuated by averaging metrics across multiple steps (LoA: ± 0.002–0.008 s). Theoretically, increasing the frame rate could improve this temporal precision; however, due to the inherent resolution-framerate trade-off in consumer cameras, this often necessitates a significant reduction in image resolution (e.g., reducing 4 K at 60 fps to 720p at 240 fps). For monocular analysis over large capture volumes (∼20 m), reduced horizontal pixel density may compromise landmark definition and spatial accuracy, potentially negating any temporal precision gained from higher frame rates. Therefore, future research should assess the impact of varying frame rates and resolutions to determine the optimal capture settings specific to monocular automated MMC systems in field-based contexts.
As anticipated, systematic biases in CT and FT were observed, with the MMC system overestimating CT and concurrently underestimating FT relative to OptoJump. Since overall ST remained accurate, these biases in the contact-to-flight ratio likely stem from fundamental differences in event detection methodologies between systems. OptoJump utilises light diodes elevated 3 mm above the ground surface, a design known to overestimate CT relative to force plates through earlier detection of initial contact and later detection of toe-off. 35 In contrast, video-based systems rely on visual detection, quantifying contact from the first to the last frame where the foot is visibly interacting with the ground. 26 These systematic biases reflect inherent methodological differences; consequently, measurements between these systems should not be used interchangeably. Practitioners should utilise a single system consistently for longitudinal monitoring of contact and flight times. When capturing at 60 fps, averaged variables should be prioritised to mitigate precision errors in these sub-component metrics.
Contextualising our findings within the broader MMC literature is complicated by the heterogeneity of existing solutions, which differ in hardware, software, and analytical complexity, and whose accuracy is influenced by the task, plane of motion, and joints analysed.23,36 Existing MMC validation research, predominantly using multi-camera 3D systems, has demonstrated mixed accuracy for joint kinematics, with errors increasing at greater movement velocities,37,38 while showing strong agreement for spatiotemporal gait parameters at lower movement velocities (e.g., walking). 39 Our findings extend this spatiotemporal agreement to sprint speeds up to 10.5 m·s−1, indicating that accurate spatiotemporal event detection is achievable at velocities where joint kinematic tracking has shown reduced accuracy. These findings align with the broader view that MMC systems exist on a complexity spectrum, from single-camera 2D configurations to multi-camera 3D reconstruction, and that the appropriate solution depends on the task demands. 40 As a primarily linear, single-plane movement requiring only gait event detection, sprinting spatiotemporal analysis works directly within the strengths of current monocular 2D systems. Given that manual 2D digitisation is already an established approach for sprint spatiotemporal analysis, the combination of a simplified movement task and reduced analytical demands means that MMC can viably automate this process, facilitating more accessible and scalable field-based assessment.
These findings suggest that automated MMC can enhance how coaches assess maximal velocity sprinting. Traditional maximal velocity testing is limited to time or instantaneous velocity over flying distances (e.g., 10 to 30 m), 41 whereas spatiotemporal kinematics provide insight into the underlying determinants of velocity (SL and SF), enabling coaches to individualise training based on each athlete's strategy (i.e., SL or SF dominant).6,19 While spatiotemporal analysis has been achievable through manual video digitisation, the time-consuming nature of this process has limited its routine use in applied settings. By automating this process using only consumer-grade hardware (smartphone and calibration cones), the system eliminates the need for manual digitisation and specialist post-processing expertise, offering a practical pathway for integrating spatiotemporal analysis into regular training cycles.
A limitation of this study was the absence of a laboratory gold-standard criterion, such as 3D motion capture or force plates, to validate the field-based results; however, this design was chosen to reflect the practical conditions under which the system would be used. Low lighting conditions (floodlights) during data collection may have introduced motion blur, potentially affecting the software's capacity to identify key gait events. 42 While capture settings were chosen to balance the resolution/framerate trade-off, the limited 60 fps temporal resolution may have hindered our ability to distinguish between hardware (camera) and software (MMC) errors. Additionally, although homography calibration is commonly employed to map large capture volumes to a planar coordinate system, parallax effects may have been greater for steps captured at the extremes of the 20 m zone, potentially contributing to spatial variability for individual steps. Measurements were restricted to the 20 m capture zone, focusing solely on the flying sprint phase where spatiotemporal parameters have typically stabilised. As such, our findings may not be generalisable to acceleration phases where step-to-step kinematic changes may limit the efficacy of the trial-averaging. As this study assessed only inter-device agreement, the within-system measurement error was not examined, and thus conclusions cannot be drawn on the reliability of the MMC system. Despite these limitations, this research represents an initial step towards integrating automated MMC workflows into sprint training and performance assessment.
VueMotion demonstrated high accuracy for measuring spatiotemporal kinematics during maximal velocity sprinting, with minimal bias observed for ST, SL, SF, and SV. However, systematic overestimation of CT and underestimation of FT reflect fundamental methodological differences between video-based and photoelectric systems, and these sub-component metrics should not be used interchangeably between systems. While single-step precision was limited by the temporal resolution of 60 Hz video, trial-averaged measurements substantially improved precision, offering a viable approach for field-based maximal velocity assessment. By automating spatiotemporal analysis using only a consumer smartphone and simple calibration equipment, this system provides practitioners with an accessible, field-ready tool for data-driven sprint performance assessment.
Footnotes
Ethical considerations
The study received ethical approval from the Australian Catholic University Human Research Ethics Committee (HRE 2021-201E).
Participant consent
All participants provided written informed consent prior to participating in the study.
Declaration of conflicting interests
The authors declared the following potential conflicts of interest with respect to the research, authorship, and/or publication of this article: VueMotion co-funded the National Industry PhD Program under which this research was conducted. The authors declare that this constitutes the full extent of their financial relationship with the vendor and that no additional commercial or financial relationships exist that could be construed as a potential conflict of interest.
Funding
The authors disclosed receipt of the following financial support for the research, authorship, and/or publication of this article: This work was supported in part by the Australian Government Department of Education's National Industry PhD Program (project 36385) and by VueMotion. The funders had no role in the study design, analysis, interpretation of results, manuscript writing, or the decision to submit. The views expressed are those of the authors and do not necessarily reflect those of the Australian Government or the Department of Education.
Declaration of conflicting interests
The authors declared no potential conflicts of interest with respect to the research, authorship, and/or publication of this article.