
Abstract
Following PRISMA 2020 guidelines and registered in PROSPERO (CRD42025638986), the review included a comprehensive search of three databases, along with citation tracking and manual reference checks conducted in February 2025. Sixty-five peer-reviewed studies were included, encompassing a total of 3020 participants aged 18–65. The review focused on objective measures of plantar flexor capacity, such as force, torque, and repetition maximum, and considered studies that reported psychometric properties. Endurance was mostly assessed using heel raise tests. These showed high intra-session reliability (intraclass correlation coefficient (ICC) ranging from 0.77 to 0.97), but results varied significantly between individuals. Isometric and isokinetic tests also demonstrated good-to-excellent reliability (ICC 0.74–0.99), although the protocols used were highly variable across studies. Isotonic testing was the least frequently employed method. In conclusion, while isokinetic and isometric tests offer reliable assessments, their use is limited by accessibility and inconsistent protocols. The heel raise test remains a popular method for evaluating endurance but suffers from a lack of standardization. Isotonic testing is underutilized and presents an opportunity for further methodological development.
Introduction
The calf muscles act as plantar flexors of the foot and ankle complex. 1 These muscles are essential for a broad spectrum of locomotor and performance activities, ranging from walking and running to high-demand athletic tasks including sprinting, jumping, rebounding, and rapid changes of direction.2–5 Three-dimensional sagittal gait analysis has shown that at the onset of the late stance phase of the gait cycle, the soleus (SOL) and gastrocnemius (GAS) muscles contribute approximately 60% and 25%, to forward trunk acceleration, respectively. 6 As running speed increases, from 2 m/s to 5 m/s, the ankle plantar flexors become the primary contributors to forward mass acceleration, with the SOL muscle alone accounting for 77% of the total peak upward acceleration. This substantial contribution enables longer flight times and greater stride lengths. 4 In the acceleration phase of sprinting, the GAS accounts for approximately 37% of the total propulsive impulse, whereas the SOL contributes for approximately 44%, primarily generating the vertical force needed to counteract gravity and support body weight. 3 Both the SOL and GAS contribute to storage and reutilization of mechanical strain energy, through the Achilles tendon, by generating peak muscle fascicle power ranging from 15 to 28.8 W/kg for the SOL and 11.2 to 12.8 W/kg for the GAS, during both sprinting and steady-state running. 7 Moreover, peak concentric ankle power alone explains 59% of the variability in cutting maneuver performance time among elite Gaelic hurling players. 5 Altogether, during the running cycle, these muscles play a crucial role in generating forward propulsion and providing vertical support.8,9 In addition, during the propulsive phase of horizontal hopping, the ankle joint demonstrates the greatest peak power output compared to the hip and knee joints, contributing approximately 43% of the total mechanical work generated by the lower extremity. 2 Additionally, GAS activation patterns, significantly affect plyometric performance across drop jumps, hurdle jumps, and long jumps, altering key parameters such as contact time, rate of force development, and vertical ground reaction force. 10
Beyond their role in performance and propulsion, the GAS and SOL are also important for lower limb stability and injury prevention. It is assumed that these muscles may contribute by preventing anterior tibial translation, thereby helping to reduce the risk of anterior cruciate ligament injuries.11–13 Calf injuries are also prevalent in multidirectional field sports such as soccer, where they account for approximately 13% of all reported injuries. 14 Additionally, reduced capacity of the plantar flexors is a risk factor in Achilles tendinopathy and plantar heel pain.15,16
Given their functional importance, reliable and valid measurements of calf (both GAS and SOL) capacity are critical for establishing normative benchmarks for both optimizing athletic performance and monitoring rehabilitation progresses.
17
Although the American College of Sports Medicine guidelines recognize the 1–5 repetition maximum (RM) testing as the ‘gold standard’ for dynamic strength assessment
Given these reasons, a systematic review is warranted to collect, summarize and critically evaluate the current modes and scores used to assess calf capacity in healthy populations. Hence, this review aimed to: first, identify and categorize the types of assessment modes used and second, evaluate their psychometric properties (i.e., reliability scores).
Methods
Protocols
This review was prepared, conducted, and reported in accordance with the PRISMA 2020 (Preferred Reporting Items for Systematic Reviews and Meta-Analyses) guidelines,30,31 and it was registered in PROSPERO (International prospective register of systematic reviews) with the registration number: CRD42025638986.
Eligibility criteria
The studies were selected based on the PICC framework, which includes Participants, Intervention, Comparator, Context. 32 The PICC was constructed based on the following research question: “How is calf capacity assessed in healthy adult populations?”. The Boolean operator “AND” was used to compose the search string to connect PICC categories, ensuring that retrieved articles met all specified criteria. The operator “OR” was used within each category to link synonymous or related terms, allowing the retrieval of any article that included one or more of those terms. In addition, the operator “NOT” was used to complete the string to exclude reviews from the search. Studies investigating capacity, strength or endurance of the ankle plantarflexors were considered. They had to be published in peer-reviewed journals and written in English, with no restrictions on the publication year. The examined population was healthy subjects between 18 and 65 years old. Any mode of calf assessment expressing results in either Kg, Newtons or RM (e.g., force plates, hand-held dynamometer, isokinetic dynamometry, etc.) was considered. Studies that did not meet these specified requirements, as well as those investigating populations who sustained an injury within the previous six months, underwent surgery in the lower quadrant, presented with neurological or rheumatological disorders, or reported pain during testing, were excluded.
Searches
A comprehensive literature search of three electronic databases (MEDLINE, SPORTDiscus and CINAHL) was conducted between the 2nd and 27th of February 2025.
The search string formulated based on the PICC framework was as follows:
AB (calf OR plantarflexor* OR soleus OR gastrocnemius) AND AB (strength OR torque OR force OR capacit* OR endurance OR test* OR assessment) AND AB (kg OR kilogram* OR newton* OR repetition* OR rep* OR RM) NOT (systematic review OR review). The operator AB has been introduced through the provider used (EBSCO Host) to limit the search to terms appearing in the abstract of articles. To ensure comprehensive coverage, forward citation tracking of included studies and manual searches within Google Scholar were additionally performed. Duplicates were removed.
Study selection
Titles and abstracts were screened to identify relevant studies by two independent reviewers (XX and YY). Selected results were arranged chronologically from oldest to most recent. Any uncertainty regarding the inclusion or exclusion of selected studies was discussed and resolved by consensus with the other authors. To enhance organization, a traffic light color-coding system was applied, where green indicated inclusion, yellow signified studies requiring further discussion, and red denoted exclusion. This review was conducted in alignment with the principles of equity, diversity, and inclusion. The authors ensured that the selection of studies was not influenced by the geographic origin, gender, or institutional affiliation of the authors.
Data extraction
Data were extracted from the included studies. Demographic details, including population size, gender, age, height, mass, and BMI (when available), were recorded for each study. Additionally, detailed testing protocols, measurement tools, objective results and psychometrics related to tests outcomes were documented. Given that differences in knee and ankle joint positions in the sagittal plane across reported tests affect both the mechanical contribution of the GAS muscle24,33 and the length-tension relationship of the calf muscle fibres,25,34,35 a labelling system has been adopted: K90 denotes a knee flexion angle of 90°, in which the femur and tibia form an angle of 90°. In contrast, K0 refers to full knee extension, where the angle between the femur and tibia is 0°. Similarly, A0 indicates a neutral ankle position, where the tibia and the foot form an angle of 90°. Ankle dorsiflexion and plantarflexion are described relative to this neutral position, with, for example, 20° of dorsiflexion labelled as A-20 and 20° of plantarflexion as A20. Representation of the described labelling system was presented in Figure 1.
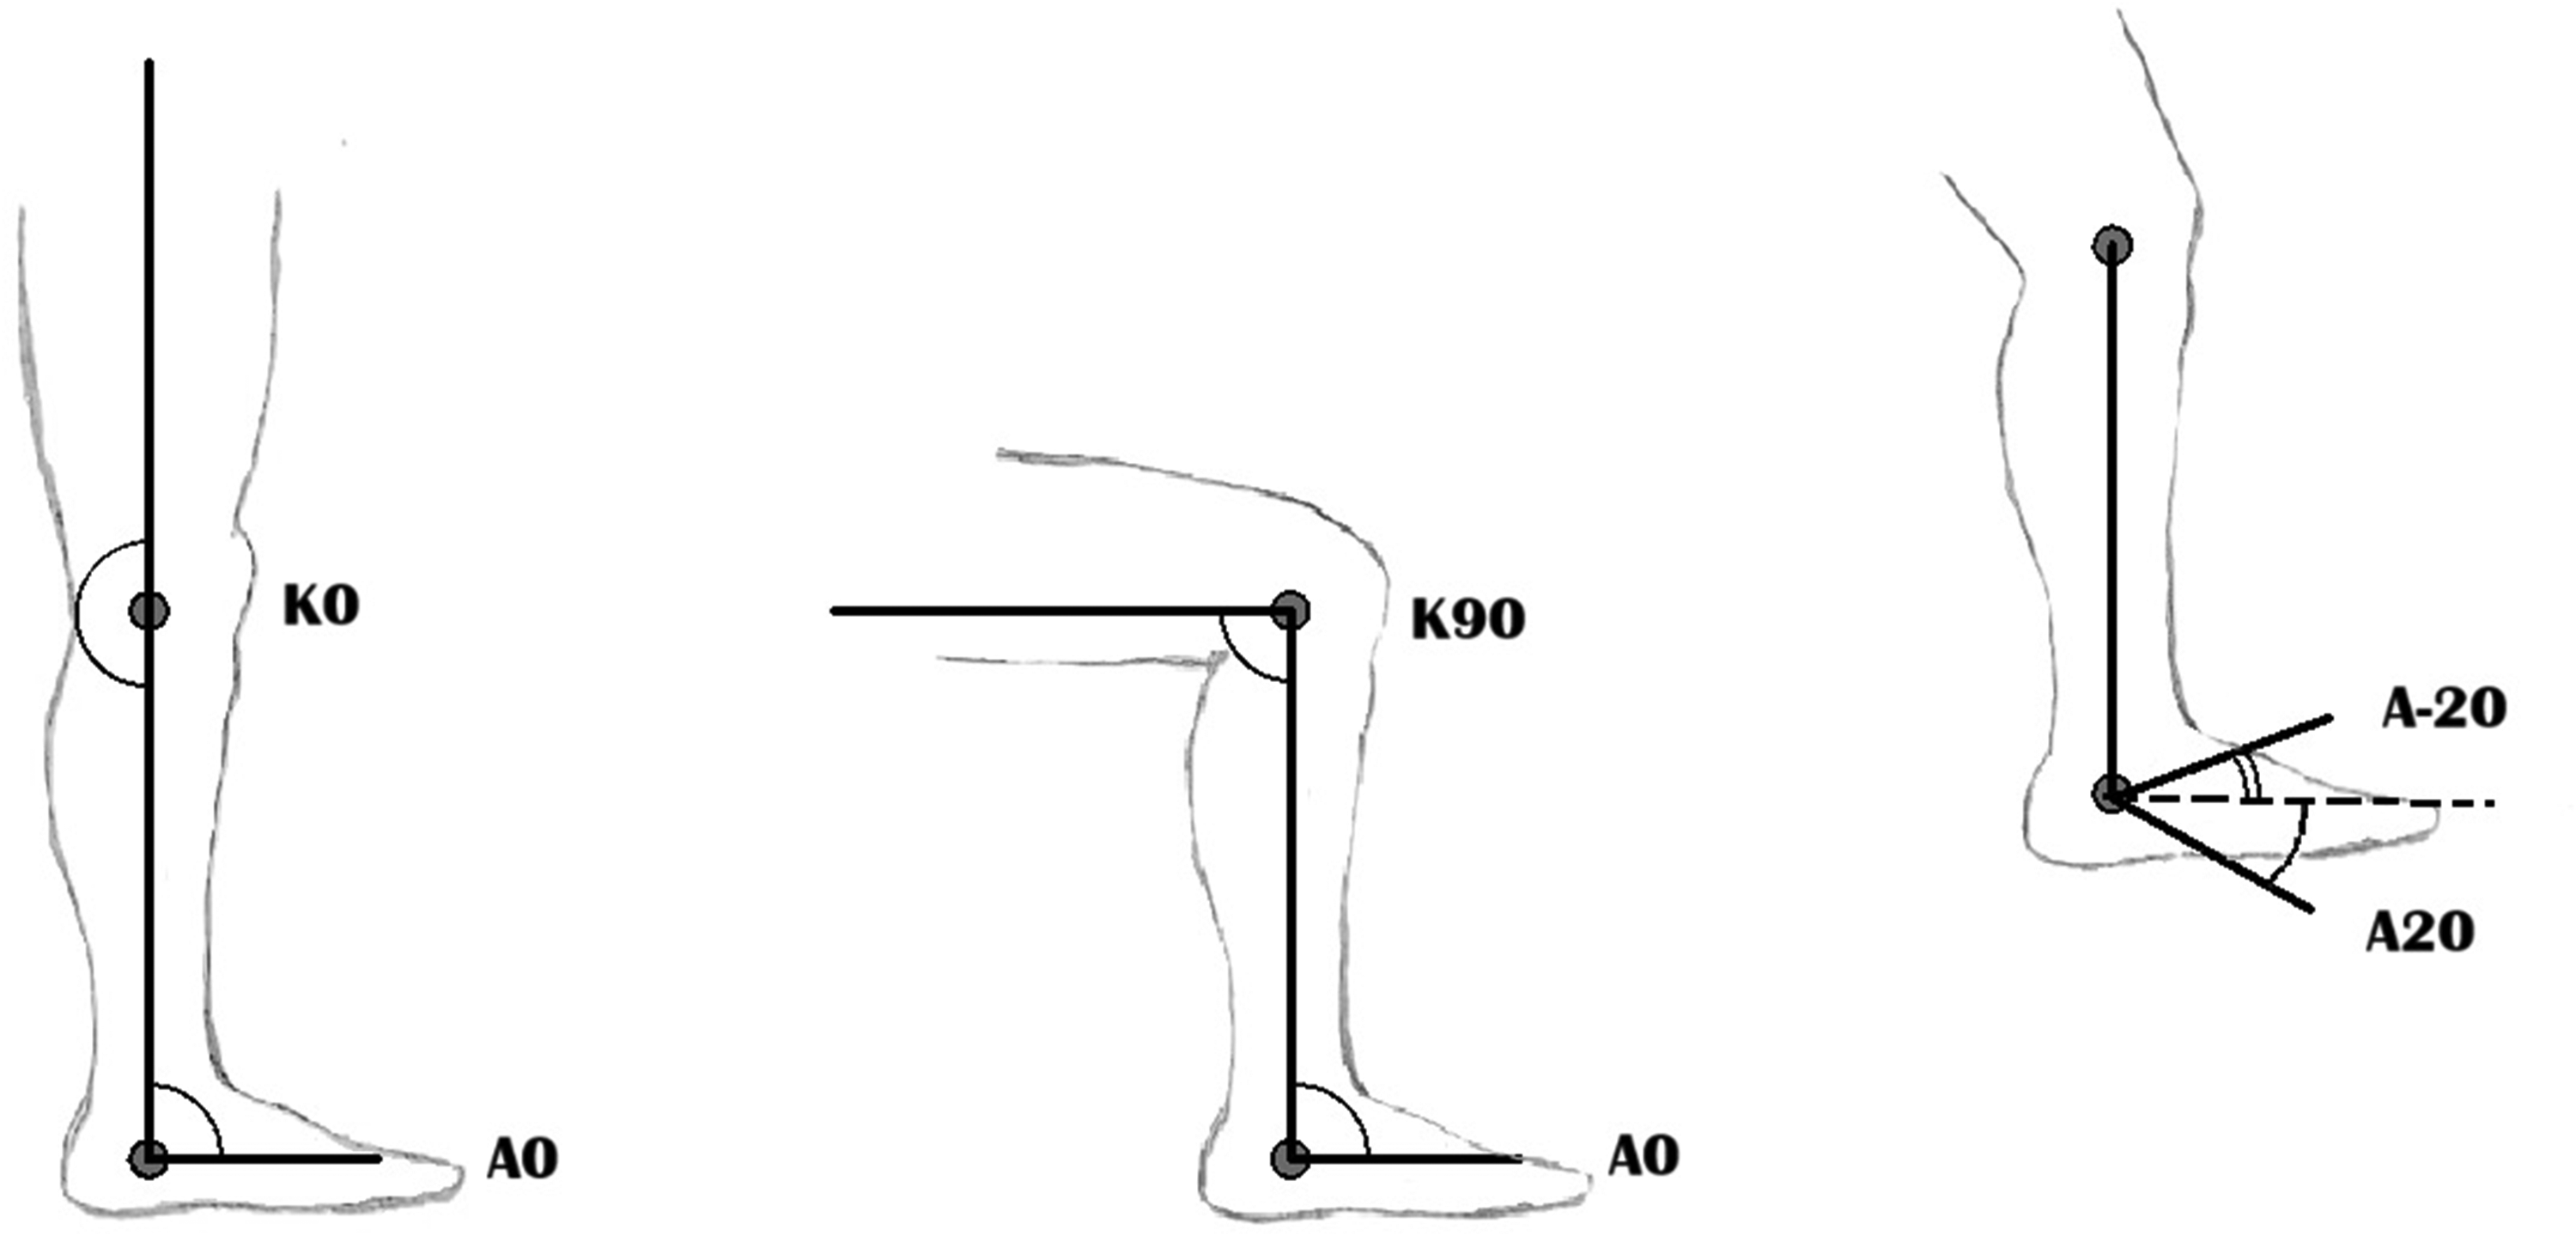
Graphical representation of the labelling system adopted.
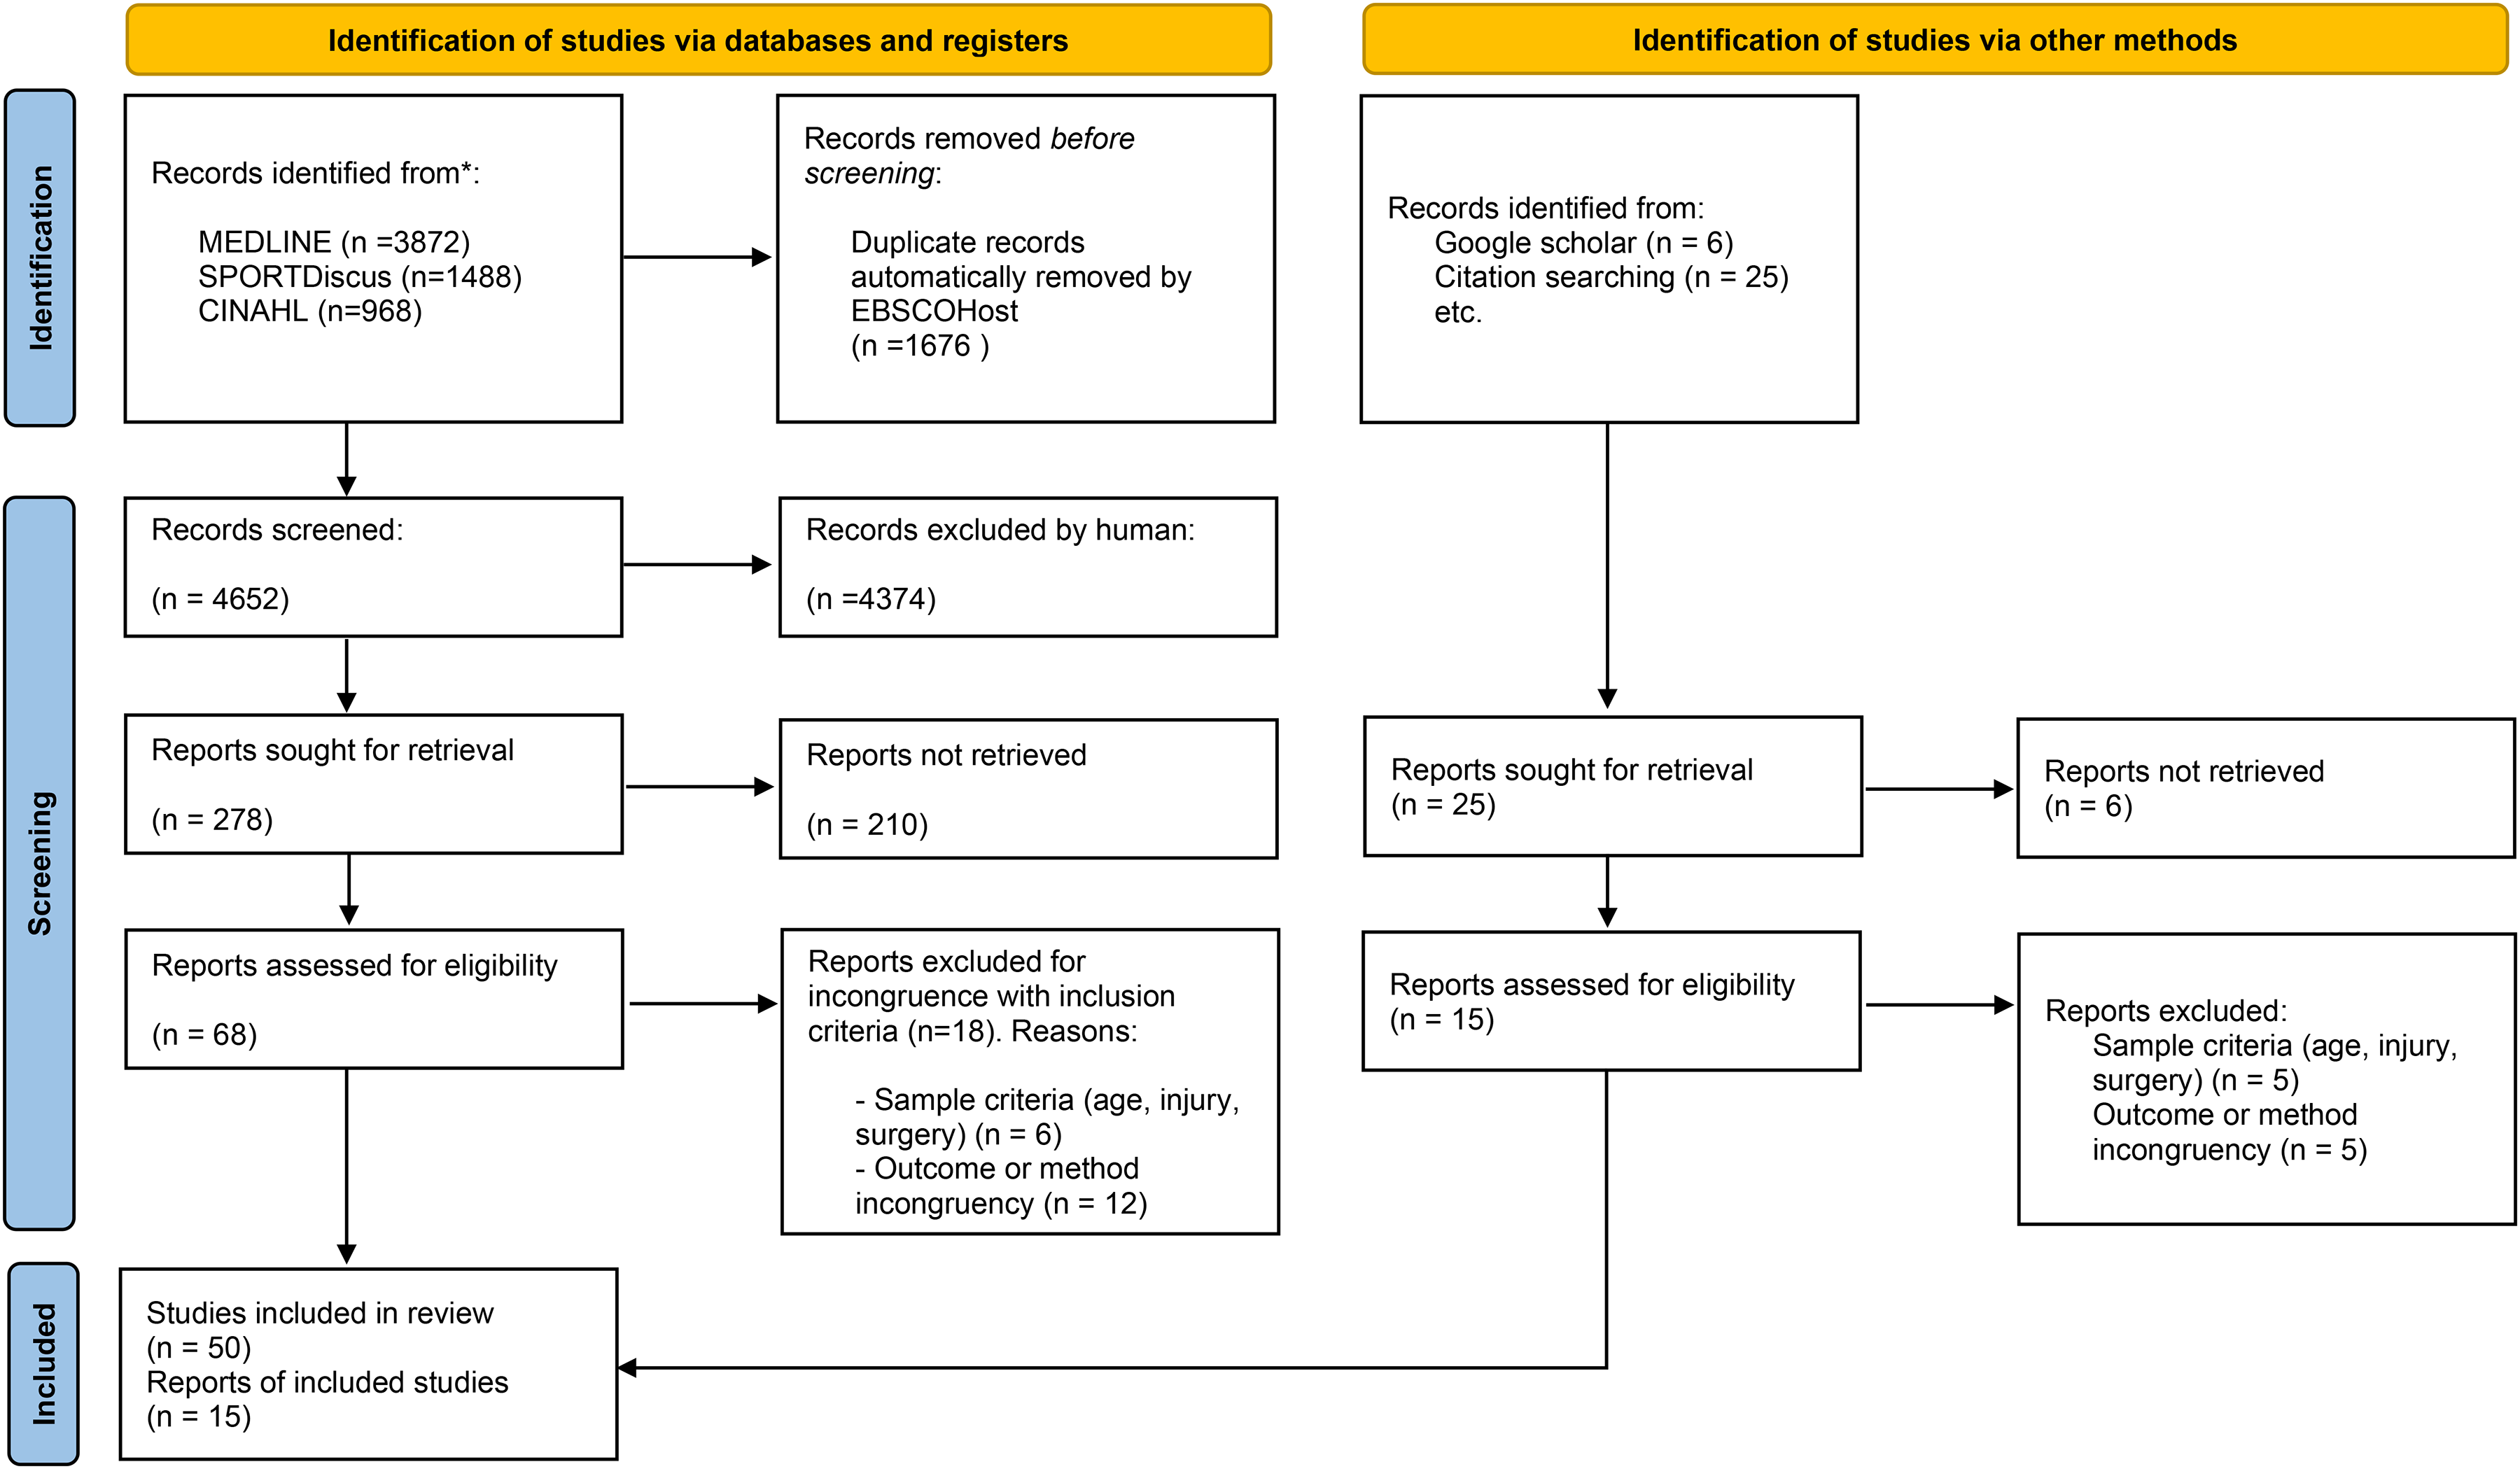
PRISMA flow diagram.
Assessment of quality and risk of bias
Methodological quality and risk of bias of each individual study were independently assessed. The modified Downs and Black scale was used to assess the methodological quality of the included studies. It is a reliable tool for appraising the quality of both randomized controlled trials and non-randomized studies. 36 Methodological quality and risk of bias in the included studies were assessed using a modified version of the Downs and Black checklist. This adapted scale comprised 27 items, yielding a maximum total score of 28 points. While item 5 (reporting) could receive up to 2 points and all other items a maximum of 1 point. Item 27 (power of the study) was simplified to a dichotomous rating: 1 point was awarded if a power calculation had been conducted, and 0 points if it had not. Consequently, the highest possible score was 28 points. Studies were then categorized into quality levels based on their total scores: excellent (26–28 points), good (20–25 points), fair (15–19 points), and poor (≤14 points).37,38
The risk of bias of the selected studies was assessed using the PEDro Scale. 39 It consists of 11 items that consider sequence generation, allocation concealment, blinding processes, outcome data completeness, and selective outcome reporting. Scores of <4 are considered “poor”, 4–5 are considered “fair”, 6–8 are considered “good” and 9–10 are considered “excellent”.
Data synthesis
Test modalities were categorized according to the characteristics of muscle performance they assessed. Specifically, the results were intended to be interpreted based on the nature of the test, either as endurance assessments or strength measurements. The strength measurement category was further divided into three subgroups: (1) isometric, (2) isokinetic, and (3) isotonic tests. The main characteristic of each study: authors, date, population, test type within details about results and reliability scores, have been extracted and collected. Reliability scores were reported and categorized according to the guidelines proposed by Koo et al. 40 Studies were considered eligible for pooled mean calculation if two or more of them assessed plantar flexor capacity using the same measurement mode and included comparable study populations.
Results
The electronic search identified 6328 articles across the selected databases. The distribution of results across databases was as follows: 3872 from Medline, 1488 from SPORTDiscus, and 968 from CINAHL. After removing duplicates, 4652 unique records remained and following title and abstract screening, 4374 records were excluded. The remaining 278 saved studies were retained for further abstract screening, and 211 of them were not retrieved. The full-text versions of the remaining 68 studies were retrieved, of which 18 were subsequently excluded. Ultimately, 50 studies met the eligibility criteria and were included in this systematic review. 15 relevant studies, which were not initially identified by the search strategy, were subsequently added through citation tracking and by Google Scholar. The final included studies for data extraction were 65. The PRISMA flow diagram was illustrated in Figure 2. The PRISMA checklist has been completed and is available as Supplementary Material.
Study characteristics
Sample sizes, assessment modes and capacity results for plantar flexors are summarized in Supplementary Table 1. Eleven studies analysed endurance capacities via heel raise test variations.22,41–50 Twelve studies measured the isometric strength using load cell devices.21,35,51–60 Seventeen studies assessed isometric strength using an isokinetic dynamometer.24,34,61–75 Twelve studies assessed isokinetic capacities of plantar flexors with an isokinetic dynamometer.25,33,76–85 Seven studies reported both isometric and isokinetic parameters obtained using an isokinetic dynamometer.86–92 Two study29,93 compared endurance capacity and isometric strength measured via isokinetic dynamometer. Three studies assessed plantar flexors isotonic capacity using RM27,94,95 alone, while two studies86,96 reported isotonic capacities together with other different tests.
Methodological quality within studies
Downs and Black scores for the included studies ranged from 8 to 21. The studies rated as “poor” (≤14 points) were 35, while 28 scored “fair” (15–19 points). Two studies were rated as “good” quality (20–25 points). Results of methodological assessment were presented in Table 1.
Modified downs and black checklist.
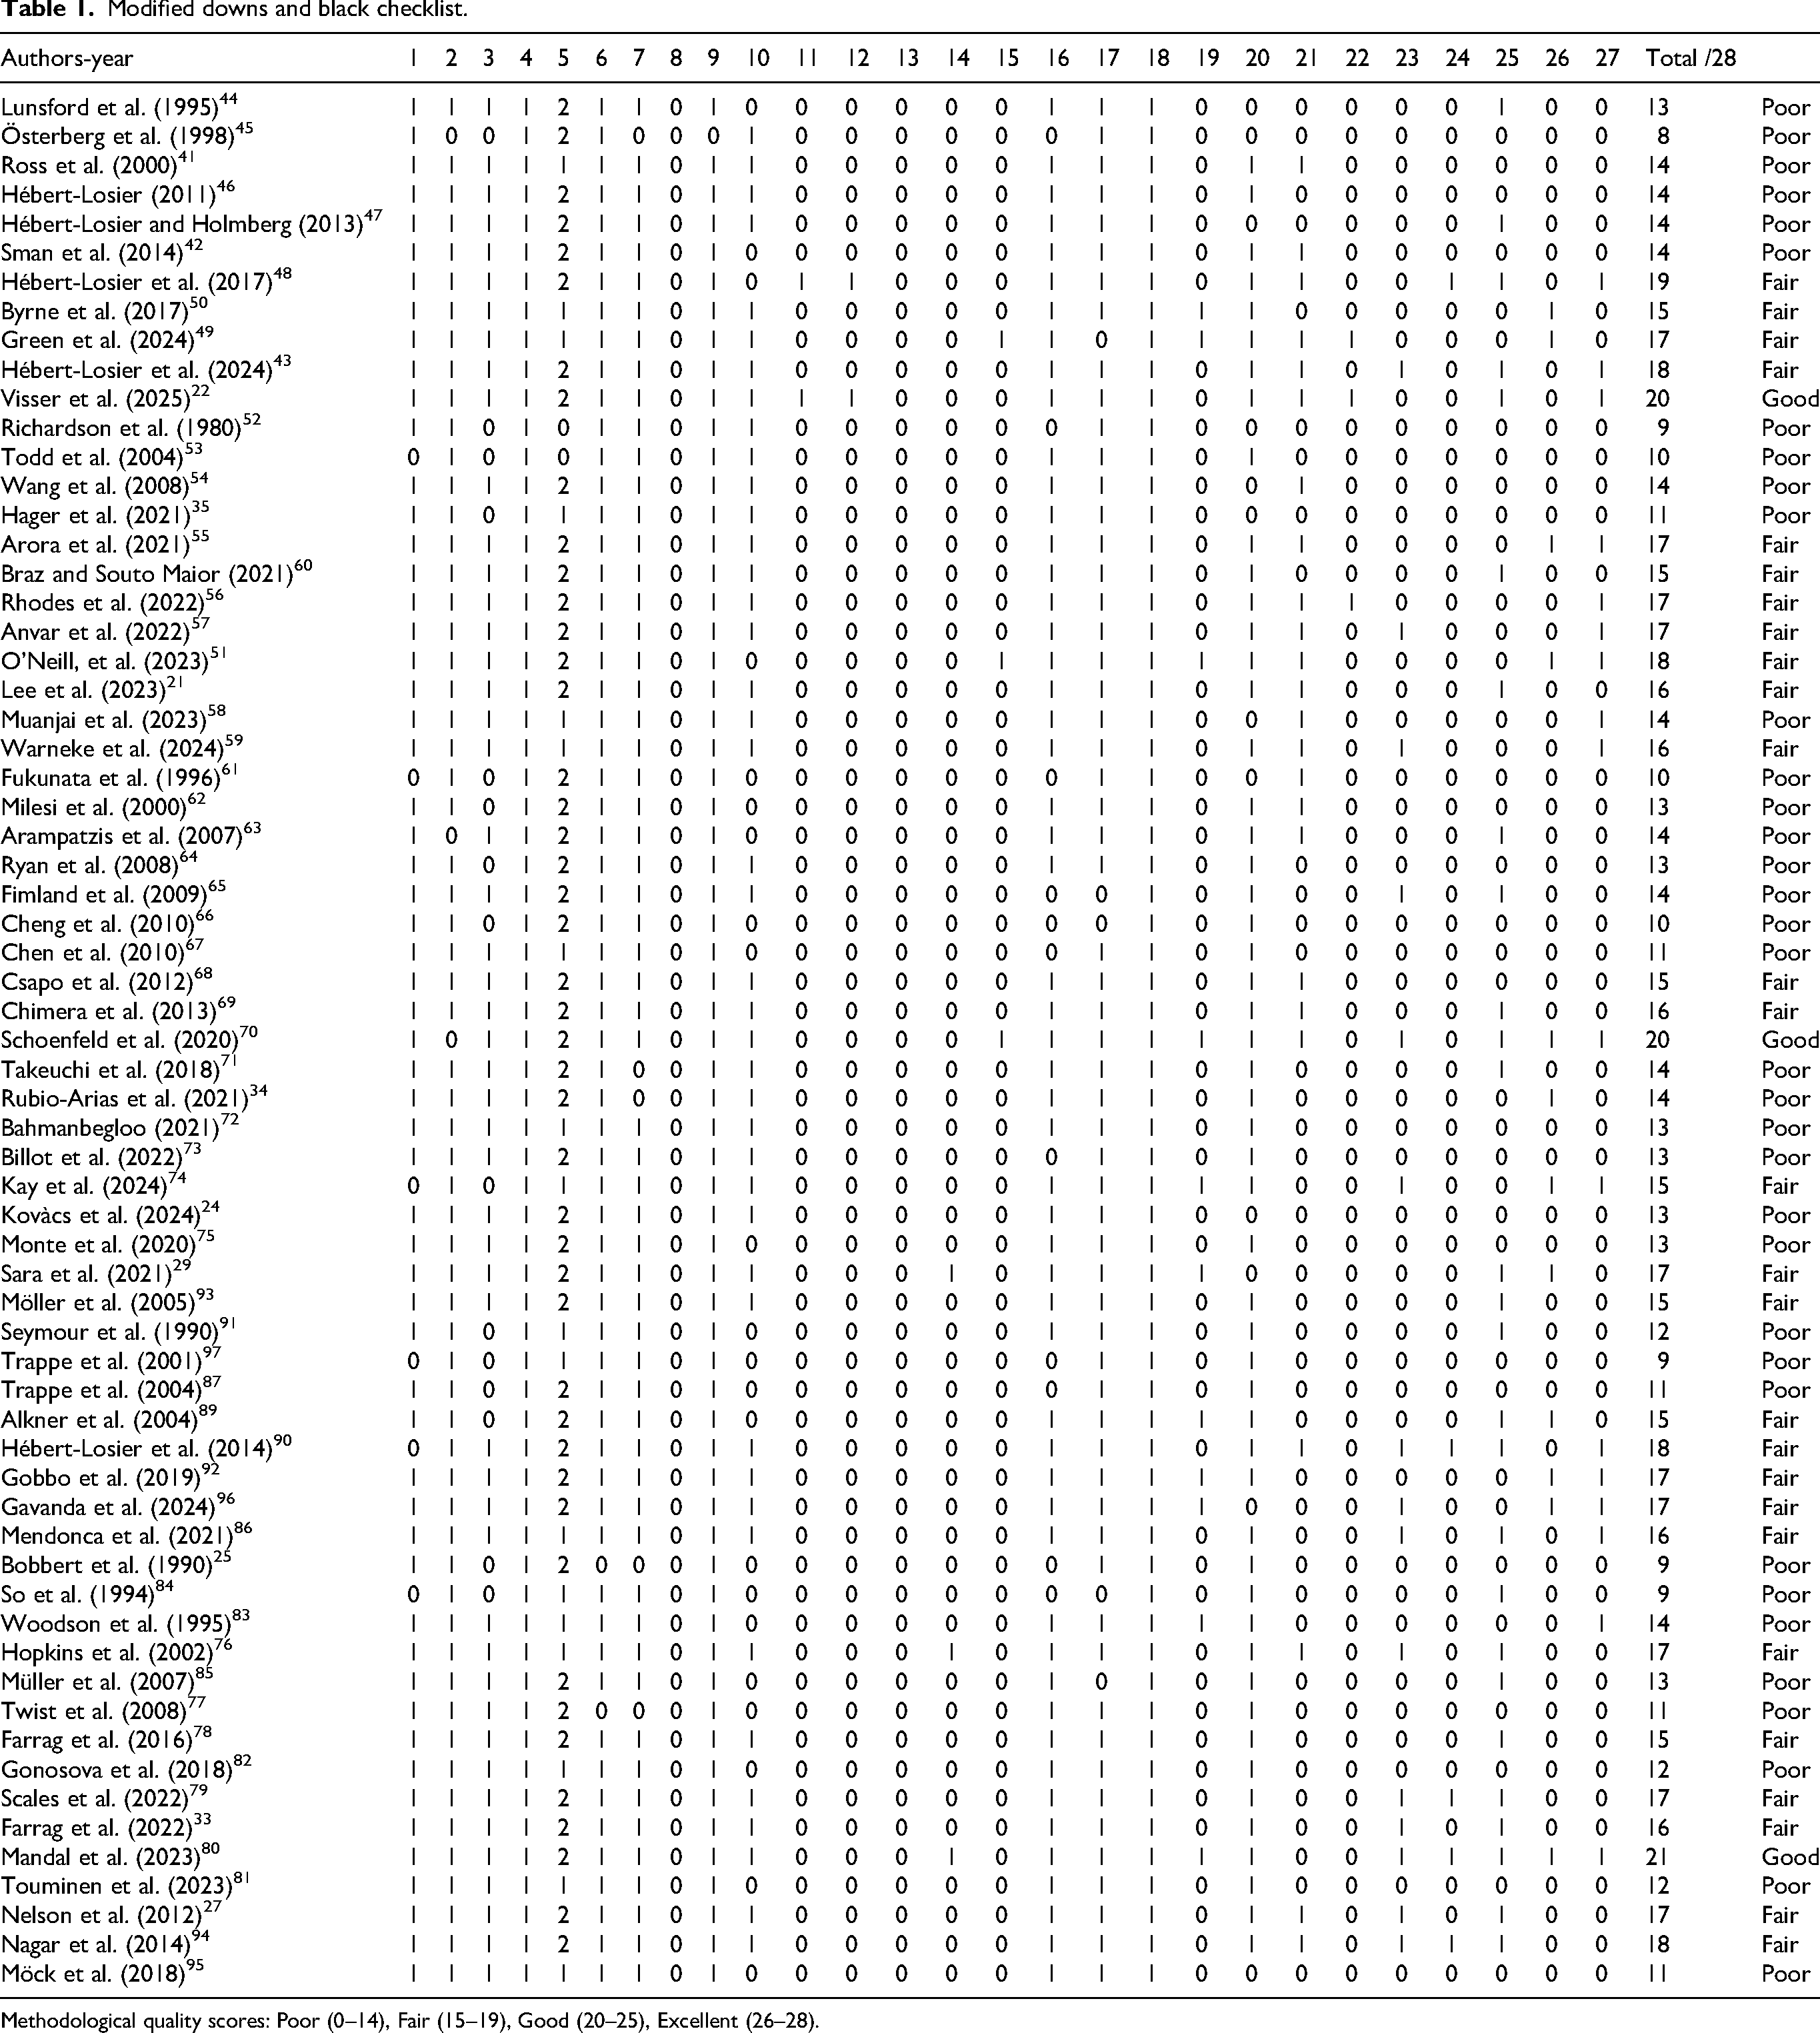
Methodological quality scores: Poor (0–14), Fair (15–19), Good (20–25), Excellent (26–28).
Risk of bias across studies
All 65 studies exhibited PEDro scores falling within the “fair” to “good” range. Specifically, 24 studies were classified as “fair” (scores of 4–5), while the other 41 studies received a “good” rating (scores of 6–8). This showed that all studies clearly reported eligibility criteria, presented complete outcome data, and conducted appropriate statistical analyses for at least one primary outcome. Ratings were examined by the authors independently. Results of risks of bias assessment were presented in Table 2.
PEDro scale.
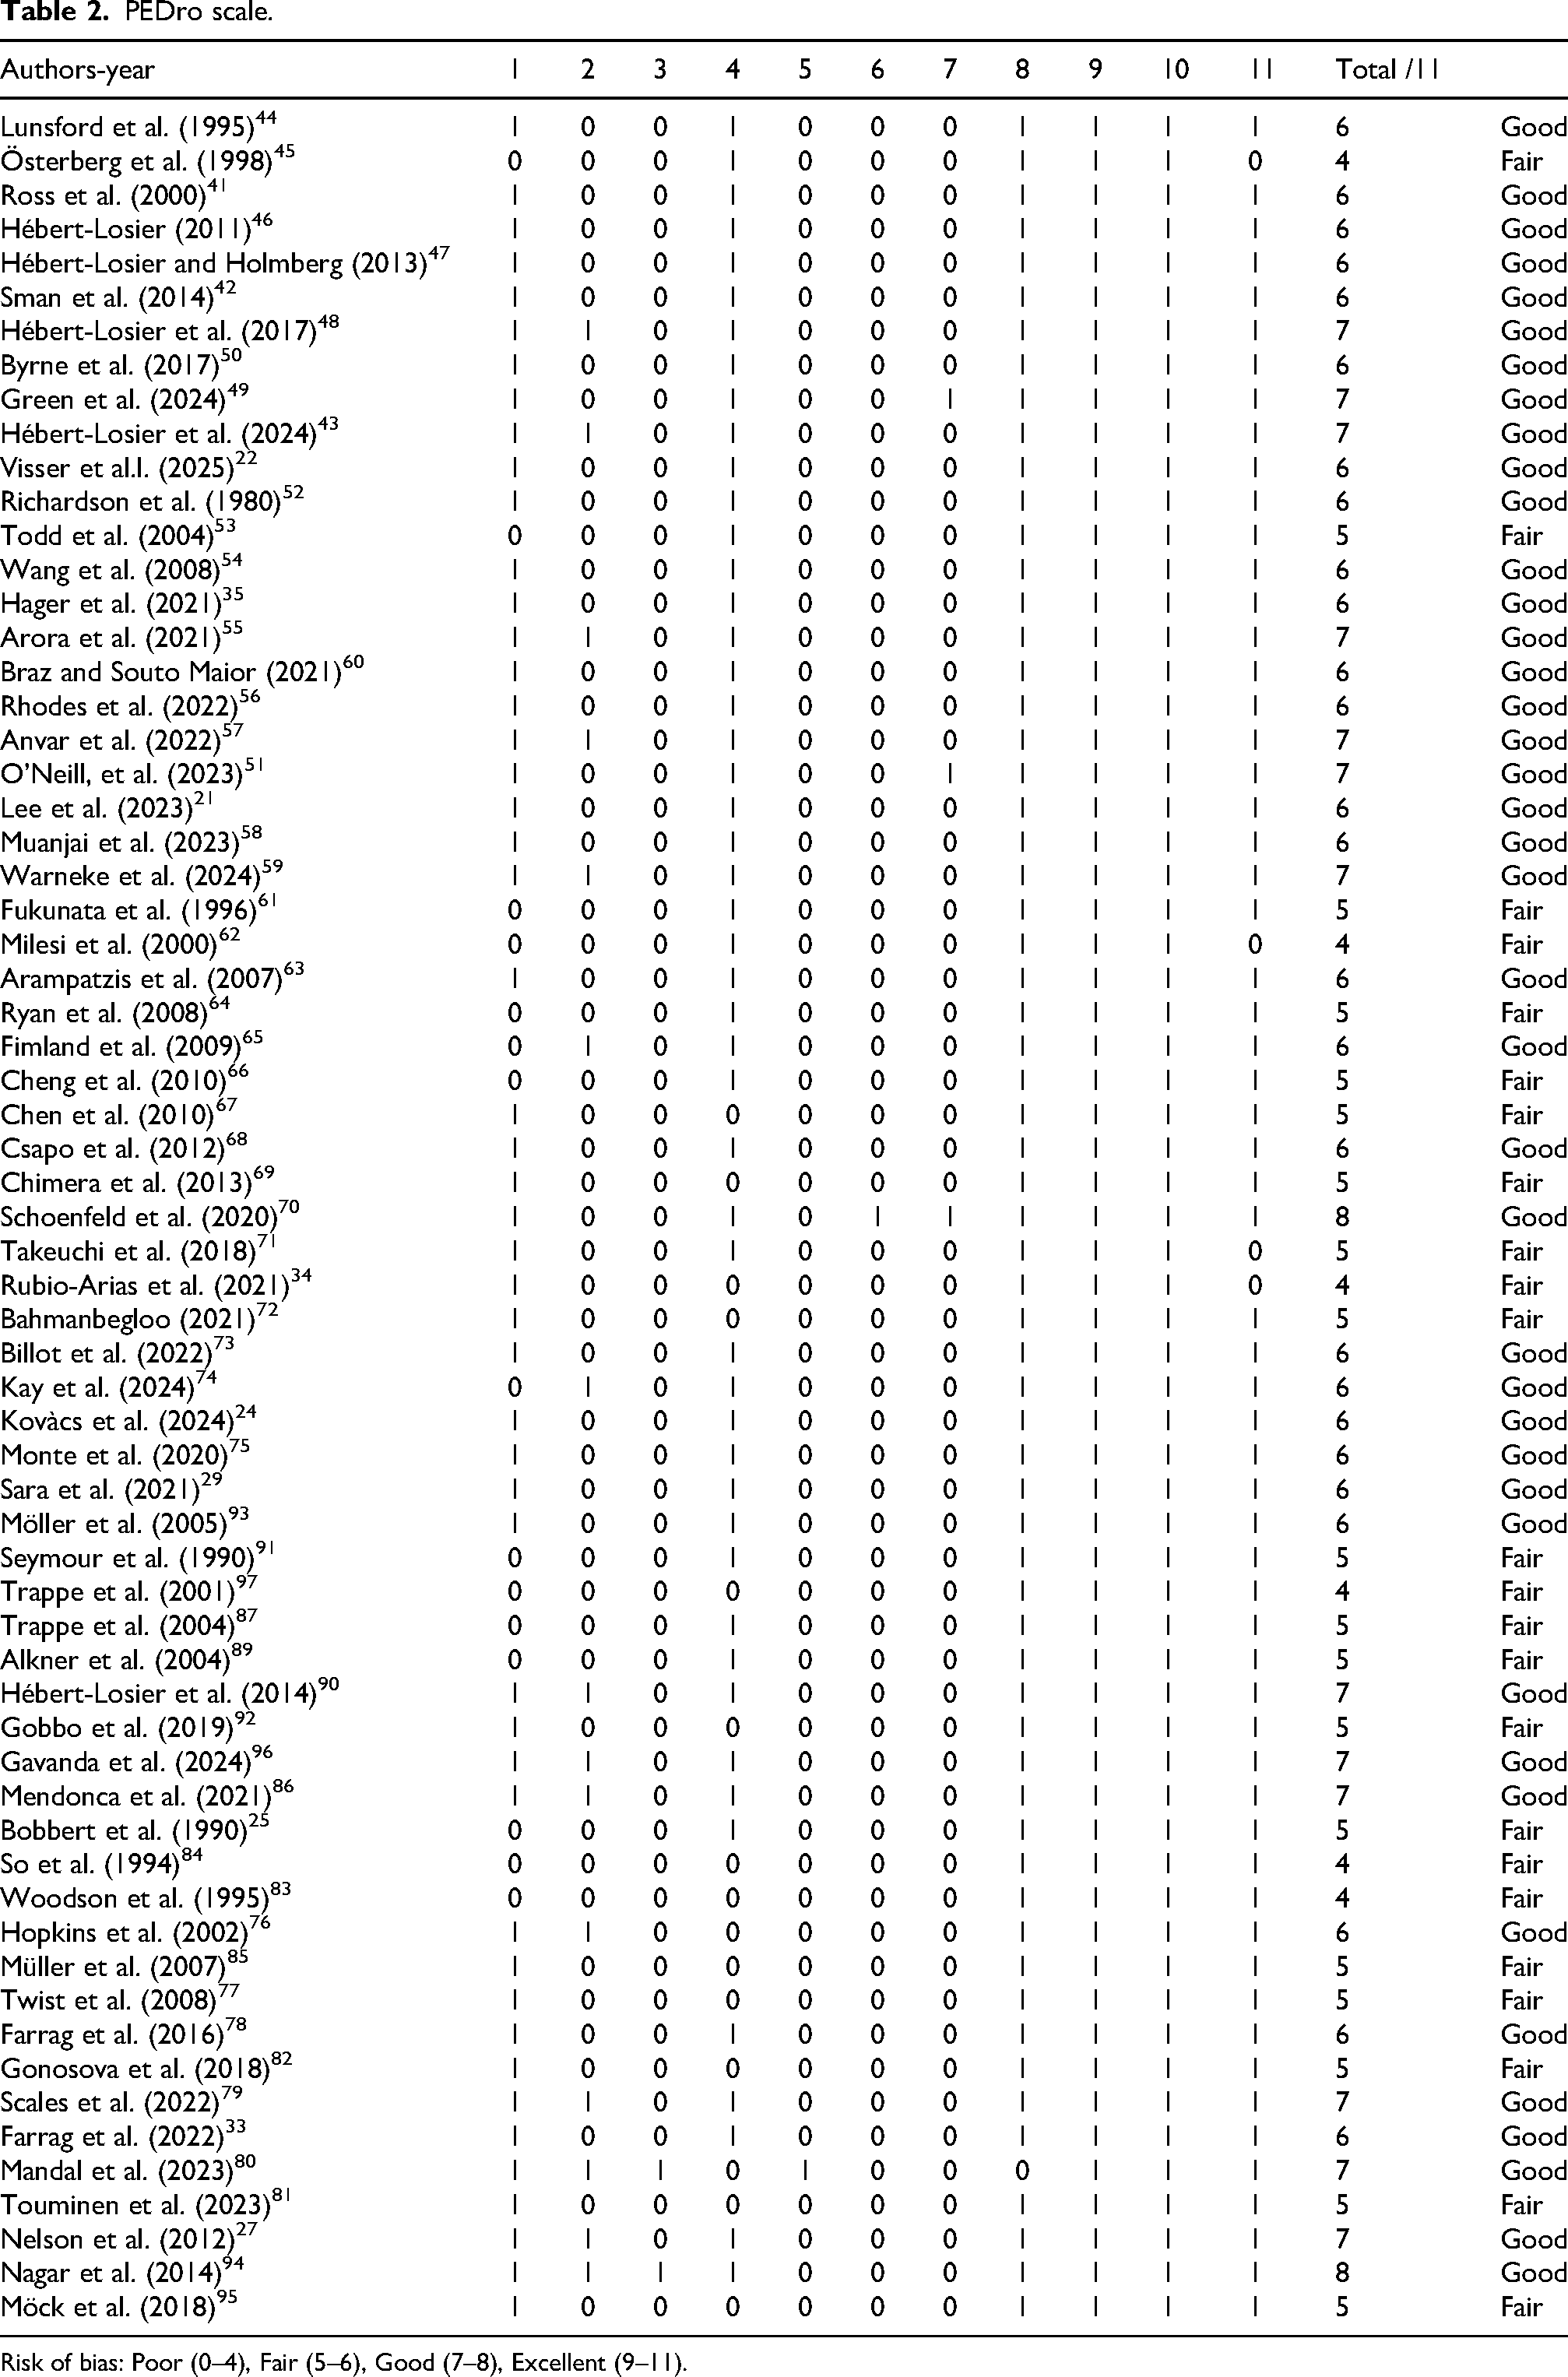
Risk of bias: Poor (0–4), Fair (5–6), Good (7–8), Excellent (9–11).
Endurance assessment
Within this review, endurance assessments were consistently found to be measured solely through variations of the ‘heel raise test’. This test uses the number of repetitions performed as a measure of endurance capacity, while maintaining the knee at a fixed angle. From the ankle starting position flat on floor (A0): Lunsford et al. 44 tested a big mixed sample of healthy subjects (n = 203), and reported values from of 27.8 ± 11.5 repetitions for males and 28.4 ± 9.8 repetitions for females. Ross et al. 41 found, in healthy Air Force Academy cadets (n = 17), between 12 and 59 repetitions in the standing heel-rise test, with a mean value of 32 ± 10 repetitions. The test demonstrated excellent reliability, with an intraclass correlation coefficient (ICC) of 0.96 and a standard error of measurement (SEM) of 2.07. Sman et al. 42 used a custom-made device, founding a mean of 23 ± 13.3 repetitions in a sample of 40 participants (ICC = 0.97; SEM = 2.4).
Again from A0, Sara et al. 29 reported a median of 34 repetitions in young adults (n = 28), with no significant gender differences in the number of single-leg heel raises performed to task failure. Möller et al., 93 in a group of 10 males, reported values of 29.8 ± 4.6 and 28.0 ± 4.4 repetitions for the right and left leg respectively. Tests were executed with a cadence of 40 bpm. Additionally, psychometric values founded ranged between 19.1 and 13.1 of CV% and from 0.84 and 0.78 of ICC. Hèbert-Losier et al. 46 examined differences in performance at A0 while keeping a different angle at the knee (K0 and K30) in a mixed sample of 17 subjects. Mean values reported for the two different tests were the same (40 repetitions). The same test, but with K0 and K45 from a starting position of maximal ankle dorsiflexion (A -max) was described by Hèbert-Losier et al., 47 with a cadence of 60 bpm, reporting values of were 37 ± 13 repetitions at K0 and 40 ± 17 repetitions at K45.
Instead, other authors reported values from a negative ankle starting position of 10° (A-10): Österberg et al. 45 reported a mean of 36 repetitions in a sample of 10 males, tested with a cadence of 92 bpm, and a SEM of 2 repetitions. Byrne et al. 50 utilized a linear encoder to monitor ankle excursion in a mixed gender sample (n = 38), reporting 32.6 ± 11.4 reps for the left and 34.7 ± 12.1 reps for the right leg (ICC = 0.66–0.85, SEM = 5.8–7.9 and CV = 11.9%–16.8%). Hébert-Losier et al., 48 in a sample of 600 subjects, reported values of the heel raise test (at K0 and A-10), stratified by gender, age and leg (i.e., from 20 to 60 years old). Psychometrics values of ICC = 1 and SEM = 2.2 for both legs were calculated. Visser et al., 22 examined a large sample (n = 500), reporting a range of 13–53 repetitions, with a mean of 25. Again at K0 and from A-10, Green et al. 49 examined the influence of cueing (i.e., receiving a verbal reminder if a deviation in technique occurred during the heel raise test) on test performance in a mixed-gender sample (n = 51), reporting differences between cued (males: 22.3 ± 5.1 reps; females: 21.2 ± 5.6 reps) and non-cued (males: 36.8 ± 10.4 reps; females: 30.3 ± 9.2 reps) participants. Hèbert-Losier et al. 43 reported three different mean values: 28 ± 8 repetitions from a flat surface (A0); 22 ± 7 repetitions; and 18 ± 8 repetitions with the metatarsal heads on a step (from maximal available dorsal flexion: A-max). None of these studies reported statistically significant differences in performance based on leg dominance. Results of endurance assessment were presented in Table 3.
Studies including endurance assessment.
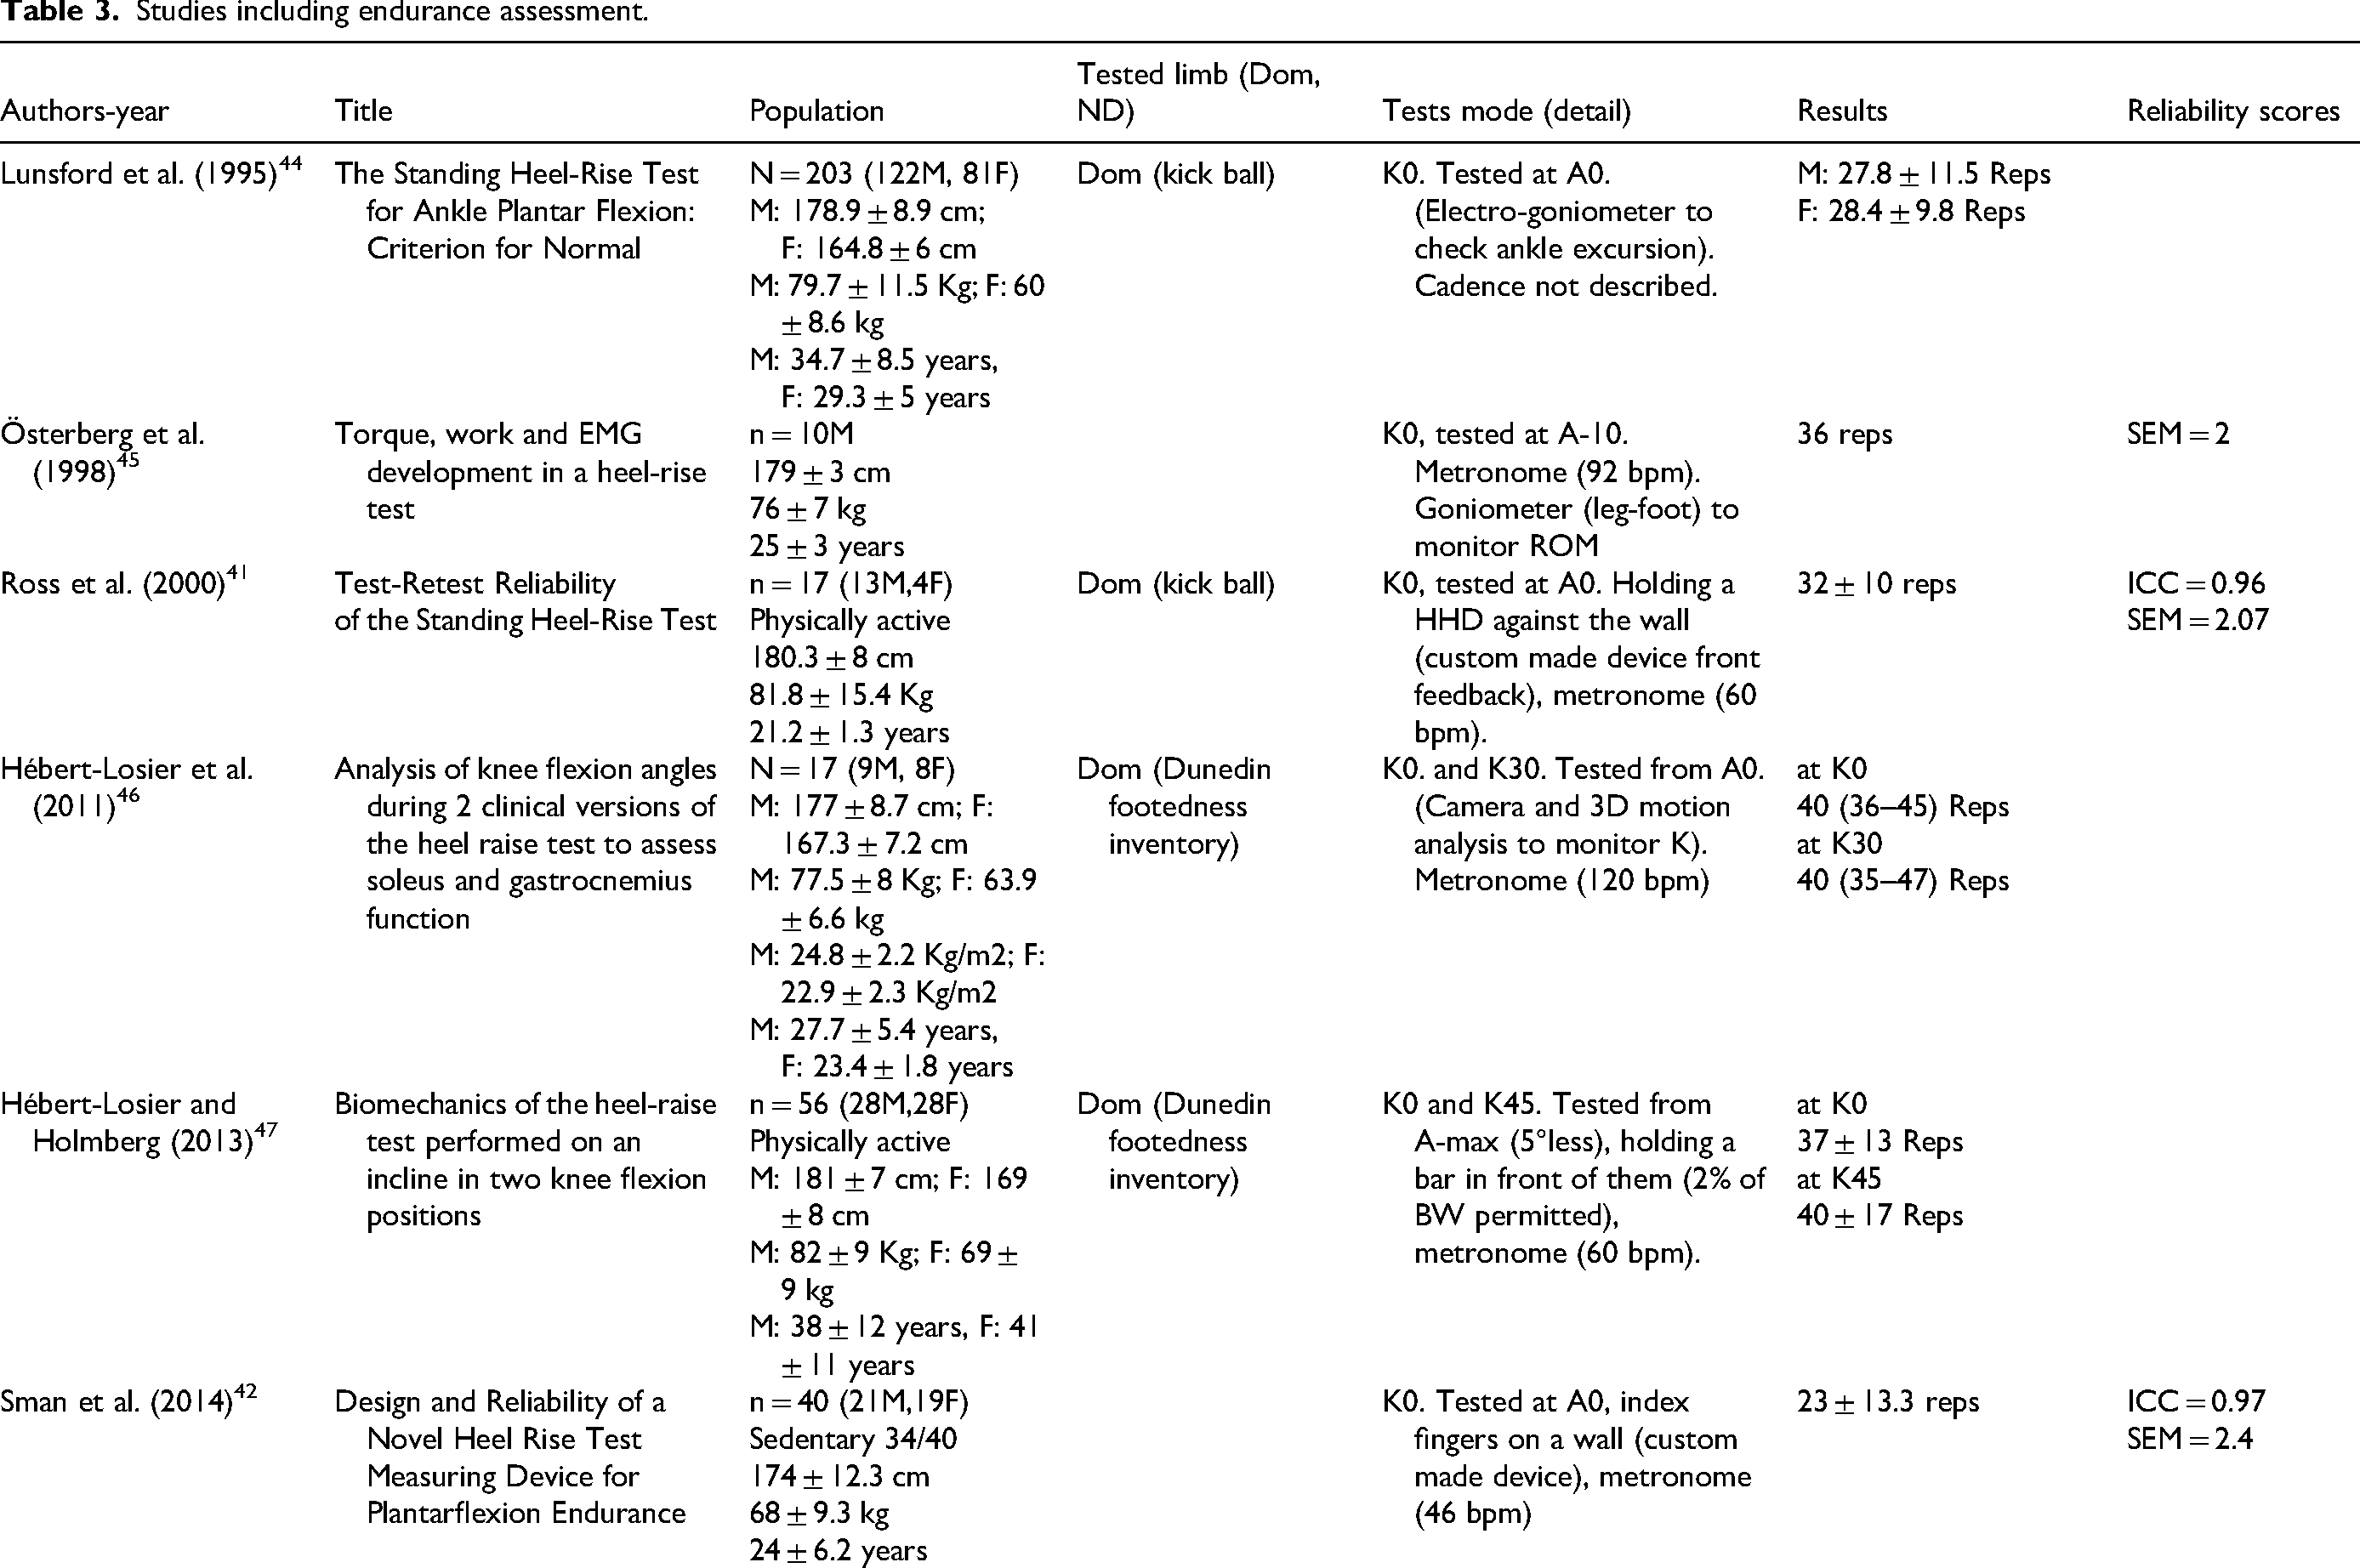
M = males; F = females; Dom = dominant; ND = non dominant; R = right; L = left; Kg = kilogram; cm = centimetre; m2 = square meter; bpm = beat per minute; ICC = intraclass correlation coefficient; SEM = standard error of measurement; CV = coefficient of variation; K = knee; A = ankle; C = cued; NC = not cued; HHD = hand-held dynamometer.
Isometric assessment using load cells and derivates
Seated (K70-K110)
Richardson et al. 52 reported a mean maximal voluntary isometric contraction (MVIC) value of 227 ± 20.4 kg in a sample of young male adults (n = 9), tested at A0 while sitting at K90. Similarly, Todd et al., 53 in a small sample of 3 women and 1 man, measured the plantar flexor peak torque at K90 and A0, yielding an acceptable coefficient of variation (CV) of 7.9 ± 5.7% and a mean ICC of 0.90. The mean values ranged from 75 Nm to 180 Nm, not distinguishing between right and left leg. Anvar et al. 57 reported right SOL peak torque values of 98.04 ± 7.8 Nm, in a group of 16 young recreative active individuals, using a modified “Boot” apparatus (K90, A0) (Memorial University of Newfoundland); Rhodes et al. 56 adopted the Isometric SOL Strength Test using force plates. Elite football players (n = 30) were instructed to exert plantarflexion MVIC with the shank perpendicular to the floor (K90 and A0). They reported mean scores of 1775.1 ± 486.7 N for the right limb and 1733.9 ± 471.9 N for the left limb, respectively. SEM of 161.41 N (right leg) and 216.24 N (left leg) was reported for the tests. A very similar testing mode was utilized by Muanjai et al. 58 albeit in a smaller and heterogeneous sample (n = 13) focusing only on the right leg. They obtained a mean result from 471.3 to 756.1 N. O’Neill et al. 51 and Lee et al. 21 assessed plantarflexion MVIC capacity, at between K90 and K110 for the knee and at between A-20 and A-30 for the ankle. They used a cost-effective balance board (Nintendo Wii Balance Board, WBB, Kyoto, Japan). In a mixed-gender sample (n = 65), mean peak torque ranged from 877.39 to 1951.59 N, with an ICC mean of 0.91. In a larger cohort of male professional rugby players (n = 355), results were normalized to body weight, yielding values of 1.88 ± 0.31 BW for the right leg and 1.84 ± 0.31 BW for the left.
Long seated or supine (K0-K20)
Arora et al. 55 assessed MVIC, of the plantar flexors, in a group of young recreational athletes (n = 23) using a hand-held dynamometer, at K0 and A0. Results ranged from 287.6 N to 425.2 N (356.4 ± 68.80). Similarly, Braz et al. 60 in comparison to other studies, reported somewhat abnormal absolute isometric (21.2–36 kg) and relative values (2.7–2.8 ± 0.4–0.5 Kg/kg), despite an ICC of 0.94. The sample (20 males, 20 females) was tested in supine position. Warneke et al. 59 evaluated plantar flexion MVIC on a force plate integrated into a leg press machine, in a sample of recreationally active participants (n = 16) at K0 and A0. This test reported a mean of reliability scores equal to 0.996 and a CV of 1.81%. The test produced mean force values of 1898.36 ± 409.32 N.
Prone (K0-K20)
Wang et al., 54 measured plantar flexor MVIC in male recreational college students (n = 17) at K0 and found that the right leg, secured in a straight prone position against a load cell, produced 546.23 ± 124.54 N at A0. Similar findings were reported by Hager et al., 35 who tested a comparable mixed-gender group (n = 16) and observed a peak force of 520 ± 114 N at A0. Additionally, they tested peak force at different ankle angles, reporting minor variations between A-20 (565 ± 129 N) and A0. Results of isometric assessment using a load cell system were presented in Table 4.
Studies including isometric assessment conducted with load cells.
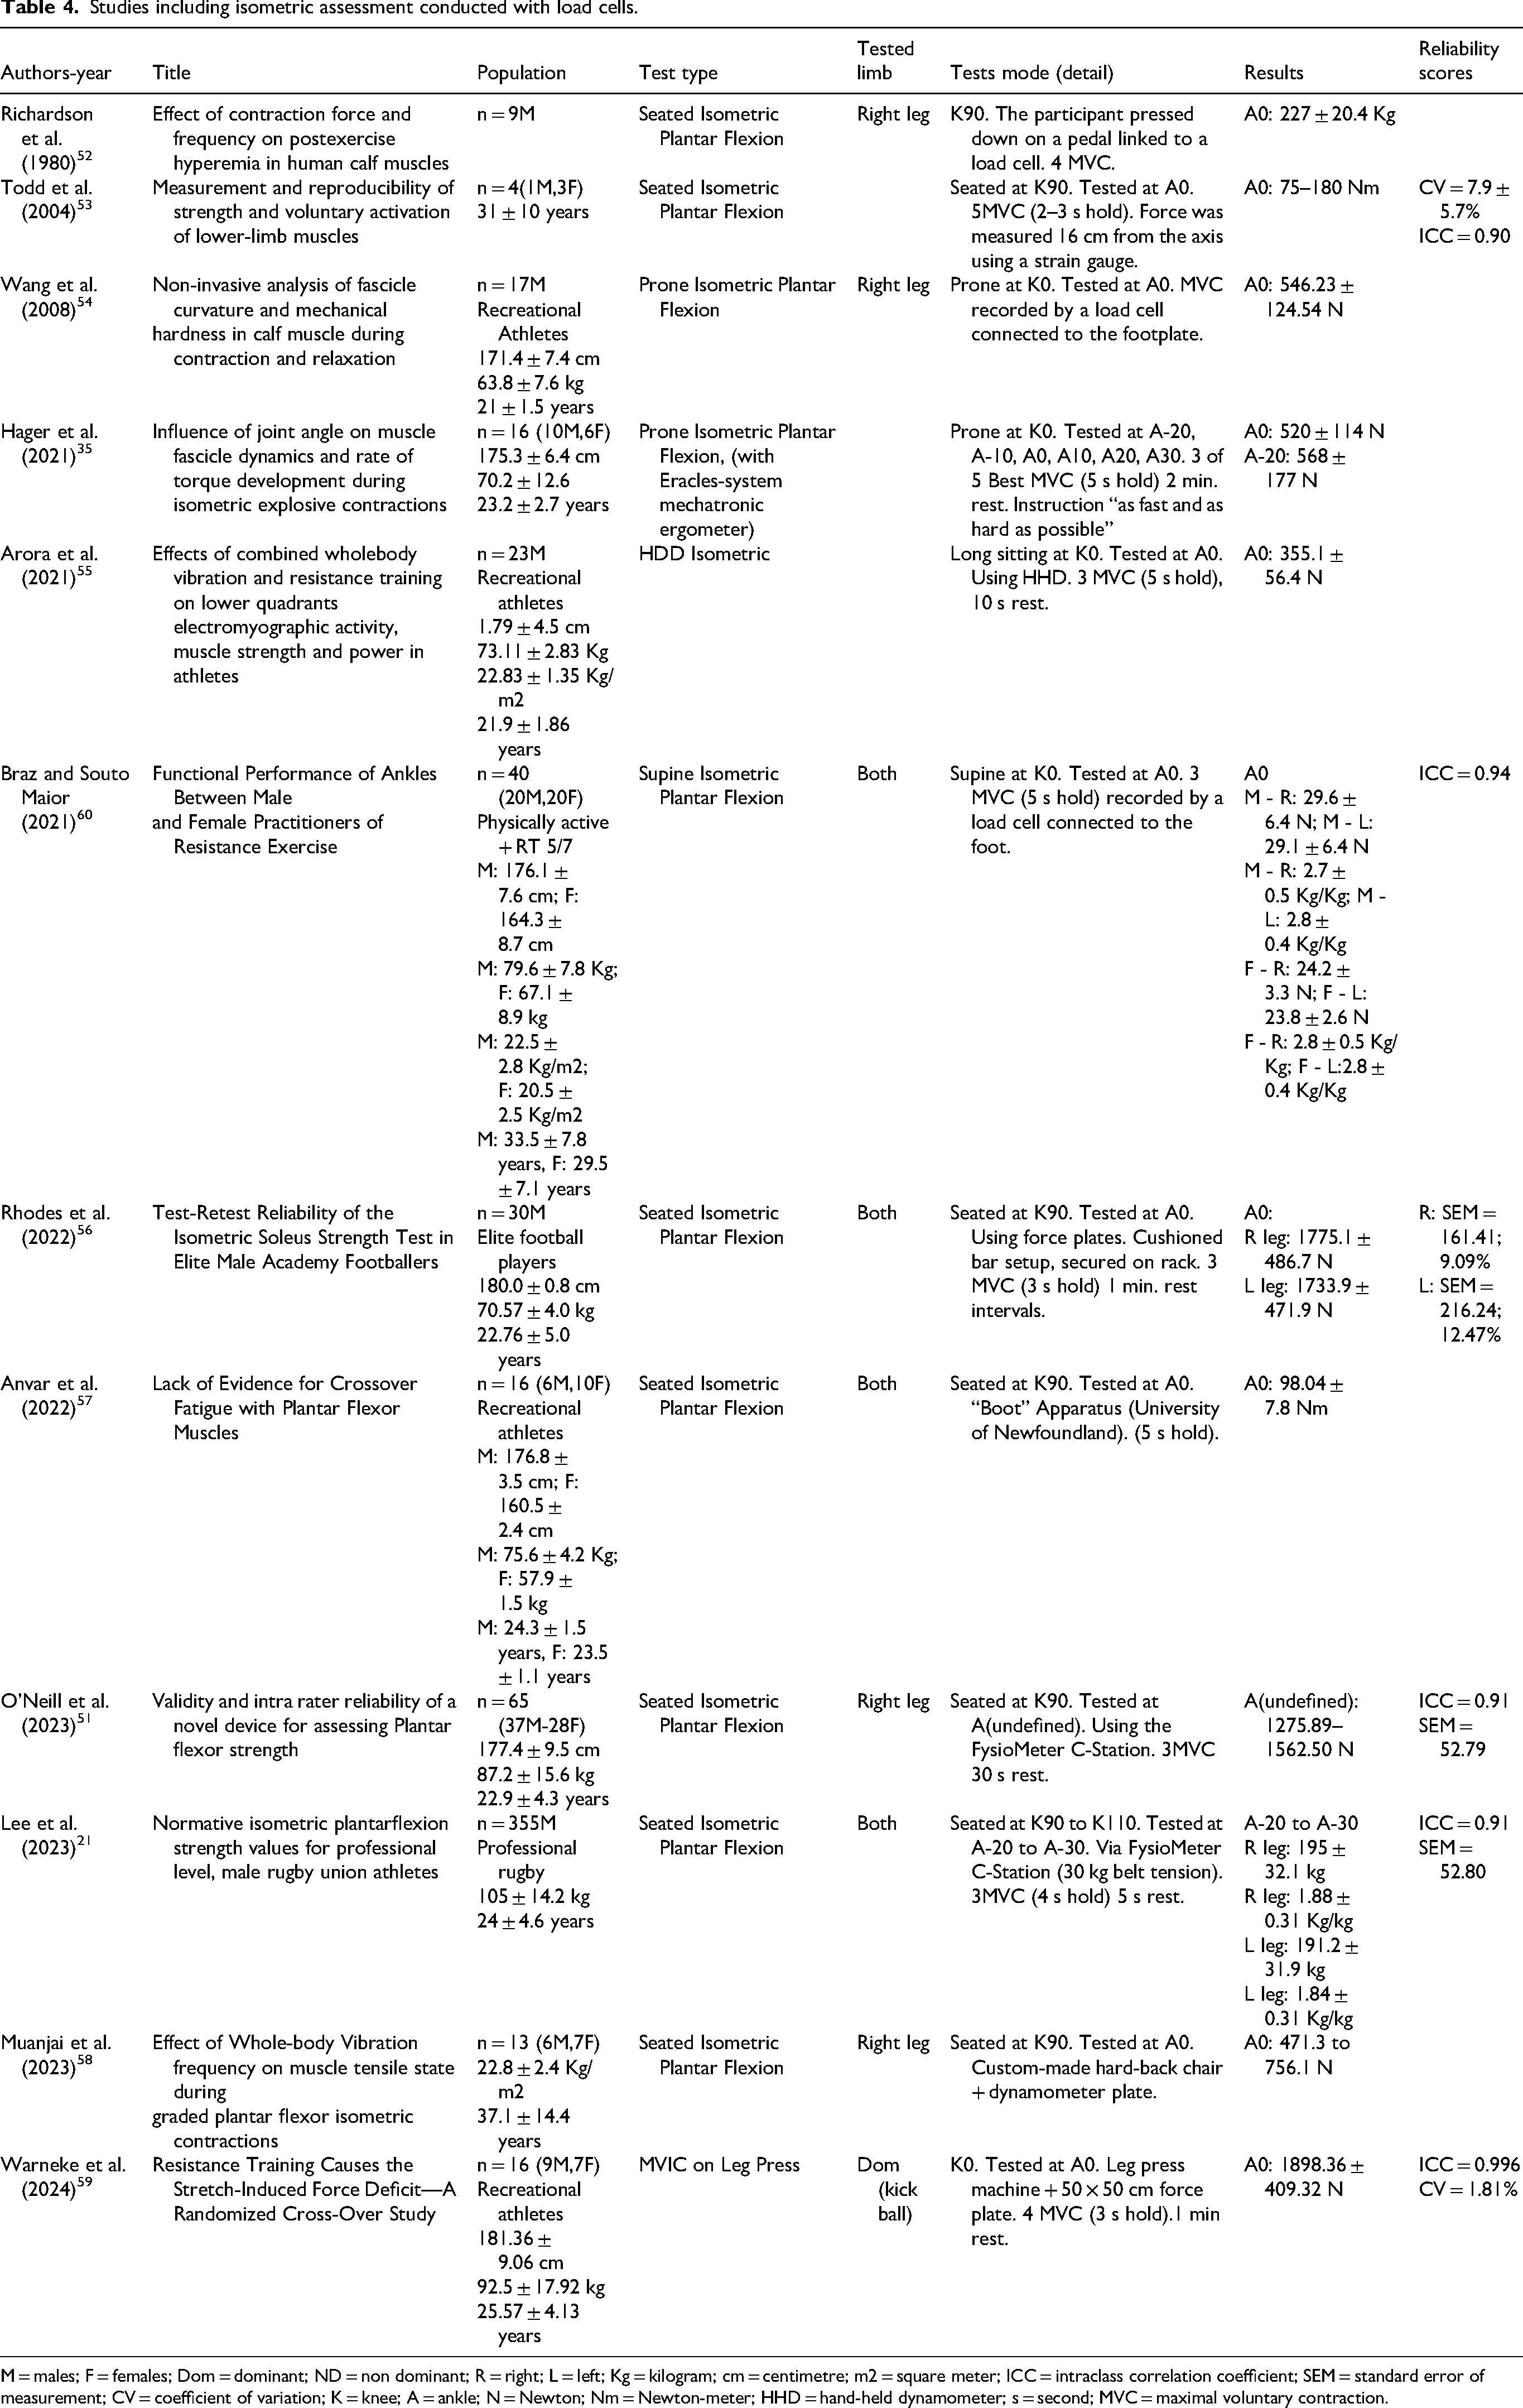
M = males; F = females; Dom = dominant; ND = non dominant; R = right; L = left; Kg = kilogram; cm = centimetre; m2 = square meter; ICC = intraclass correlation coefficient; SEM = standard error of measurement; CV = coefficient of variation; K = knee; A = ankle; N = Newton; Nm = Newton-meter; HHD = hand-held dynamometer; s = second; MVC = maximal voluntary contraction.
Isometric assessment using isokinetic dynamometers (IKD)
Seated or long seated or supine (K80-K90)
Milesi et al., 62 measured peak plantar flexion torque in sitting at K90 at different ankle angles in a group of sedentary adult males (n = 8). They reported progressive peak torque decrements as plantar flexion increased, from 161.7 ± 46.7 Nm at A-15 to 42.8 ± 24.8 Nm at A25. Fimland et al., 65 at A0, found plantar flexor torque values ranging from 115 to 180 Nm in healthy men (n = 19) in sitting at K80. Instead, at K90 and A0, Alkner et al. 89 reported a mean plantar flexion peak torque of 108 ± 22 Nm in a group of adult males (n = 17), in supine, while Cheng et al. 66 found values of 166.9 ± 36.1 Nm in a younger group of recreational athletes (n = 10), in long sitting. Kòvacs et al., 24 observed a mean plantar flexion peak torque of 93.1 ± 22.3 Nm in a group of physically active males (n = 9), while Chimera et al. 69 reported a mean peak torque value of 132 ± 37 Nm for healthy adult males (n = 12) (relative scores equal to 1.51 ± 0.43 Nm/Kg) and 68 ± 28 Nm for healthy adult females (n = 13) (relative scores equal to 1.04 ± 0.47 Nm/Kg). Similarly, Sara et al. 29 found a mean plantarflexors peak torque of 148.8 ± 36.3 Nm for males (n = 15) and 128.1 ± 34.1 Nm for females (n = 15).
Seated or long seated or supine or prone (K0-K60)
Fukunaga et al. 61 reported that at K0, isometric plantar flexion peak torque values ranged from 174 ± 6.1 Nm at A0 to 82.7 ± 8.7 Nm at A30 in a group of adult males (n = 8). Similarly, Bahmanbegloo et al. 72 reported a mean peak torque of 195.08 ± 55.73 Nm at A-10 in a comparable sample that also included females tested at K0. Arampatzis et al. 63 assessed plantar flexors peak torque at A0 and K0 in three groups of healthy adult male runners. They reported that the non-active group (n = 10) produced a mean peak torque of 109.9 ± 25.4 Nm (1.41 ± 0.29 Nm/Kg), the endurance running group (n = 28) 126.3 ± 40.4 Nm (1.63 ± 0.46 Nm/Kg), and the sprinter group (n = 28) 154.6 ± 34.4 Nm (1.97 ± 0.39 Nm/Kg). Comparable results under similar testing conditions (K0, A0) have been reported by several other studies,24,70,71,74 with mean peak torque values ranging between 100 and 130 Nm. In addition, Monte et al., 75 reported a mean peak torque value of 1019 ± 177 N in prone lying (K0, A0) in a group of male endurance runners (n = 15). Trappe et al. 97 reported mean peak torque scores ranging from 96 Nm at A10 to 242 Nm at A-10 using a Torque Velocity Dynamometer in a group of healthy adults male (n = 12) at K0. In a mixed gender group of recreational athletes (n = 13), Ryan et al. 64 reported a mean peak torque of 129.5 ± 12.8 Nm at K25 and A0. Similarly at K25, Csapo et al. 68 reported plantar flexors peak torque values ranging from 140.5 ± 51.5 Nm at A-20 to 80 ± 25 Nm at A20. Rubio-Arias et al. 34 reported plantar flexion peak torque at K30 that range from 160–210 Nm at A-15 to 25–45 Nm at A30. At K40 and K60, Chen et al. 67 and Billot et al. 73 obtained similar mean plantar flexion peak torque values (A0): 105.75 ± 42.5 Nm, and 149.6 ± 47.1 Nm respectively. Billot et al. 73 also reported good ICC values, ranging from 0.86 to 0.99. In contrast, Mendonca et al. 86 (K60), reported lower mean peak torque values ranging from 50 to 60 Nm in a sample of young adults (n = 30). Moreover, Hébert-Losier et al., 90 reported peak torque values (K0 and A0), ranging from 106 to 332 Nm (20–40 years old) and from 96 to 333 Nm (40–60 years old) in a mixed healthy gender group (n = 56). In the same group, at K0, the mean plantar flexors peak torque was 222 ± 54 Nm for males and 154 ± 36 Nm for females. Tested K45, the mean values reported were 50 Nm higher for males and 22 Nm for females. Gobbo et al., 92 in a group of 13 males and 17 females, reported values tested at A30 without specifying the K: 48.84 ± 15.80 Nm and 47.42 ± 16.84 Nm for right and left leg respectively (ICC 0.75–0.78). Results of isometric assessment using an isokinetic dynamometer were presented in Table 5.
Studies including isometric assessment conducted with isokinetic dynamometers.
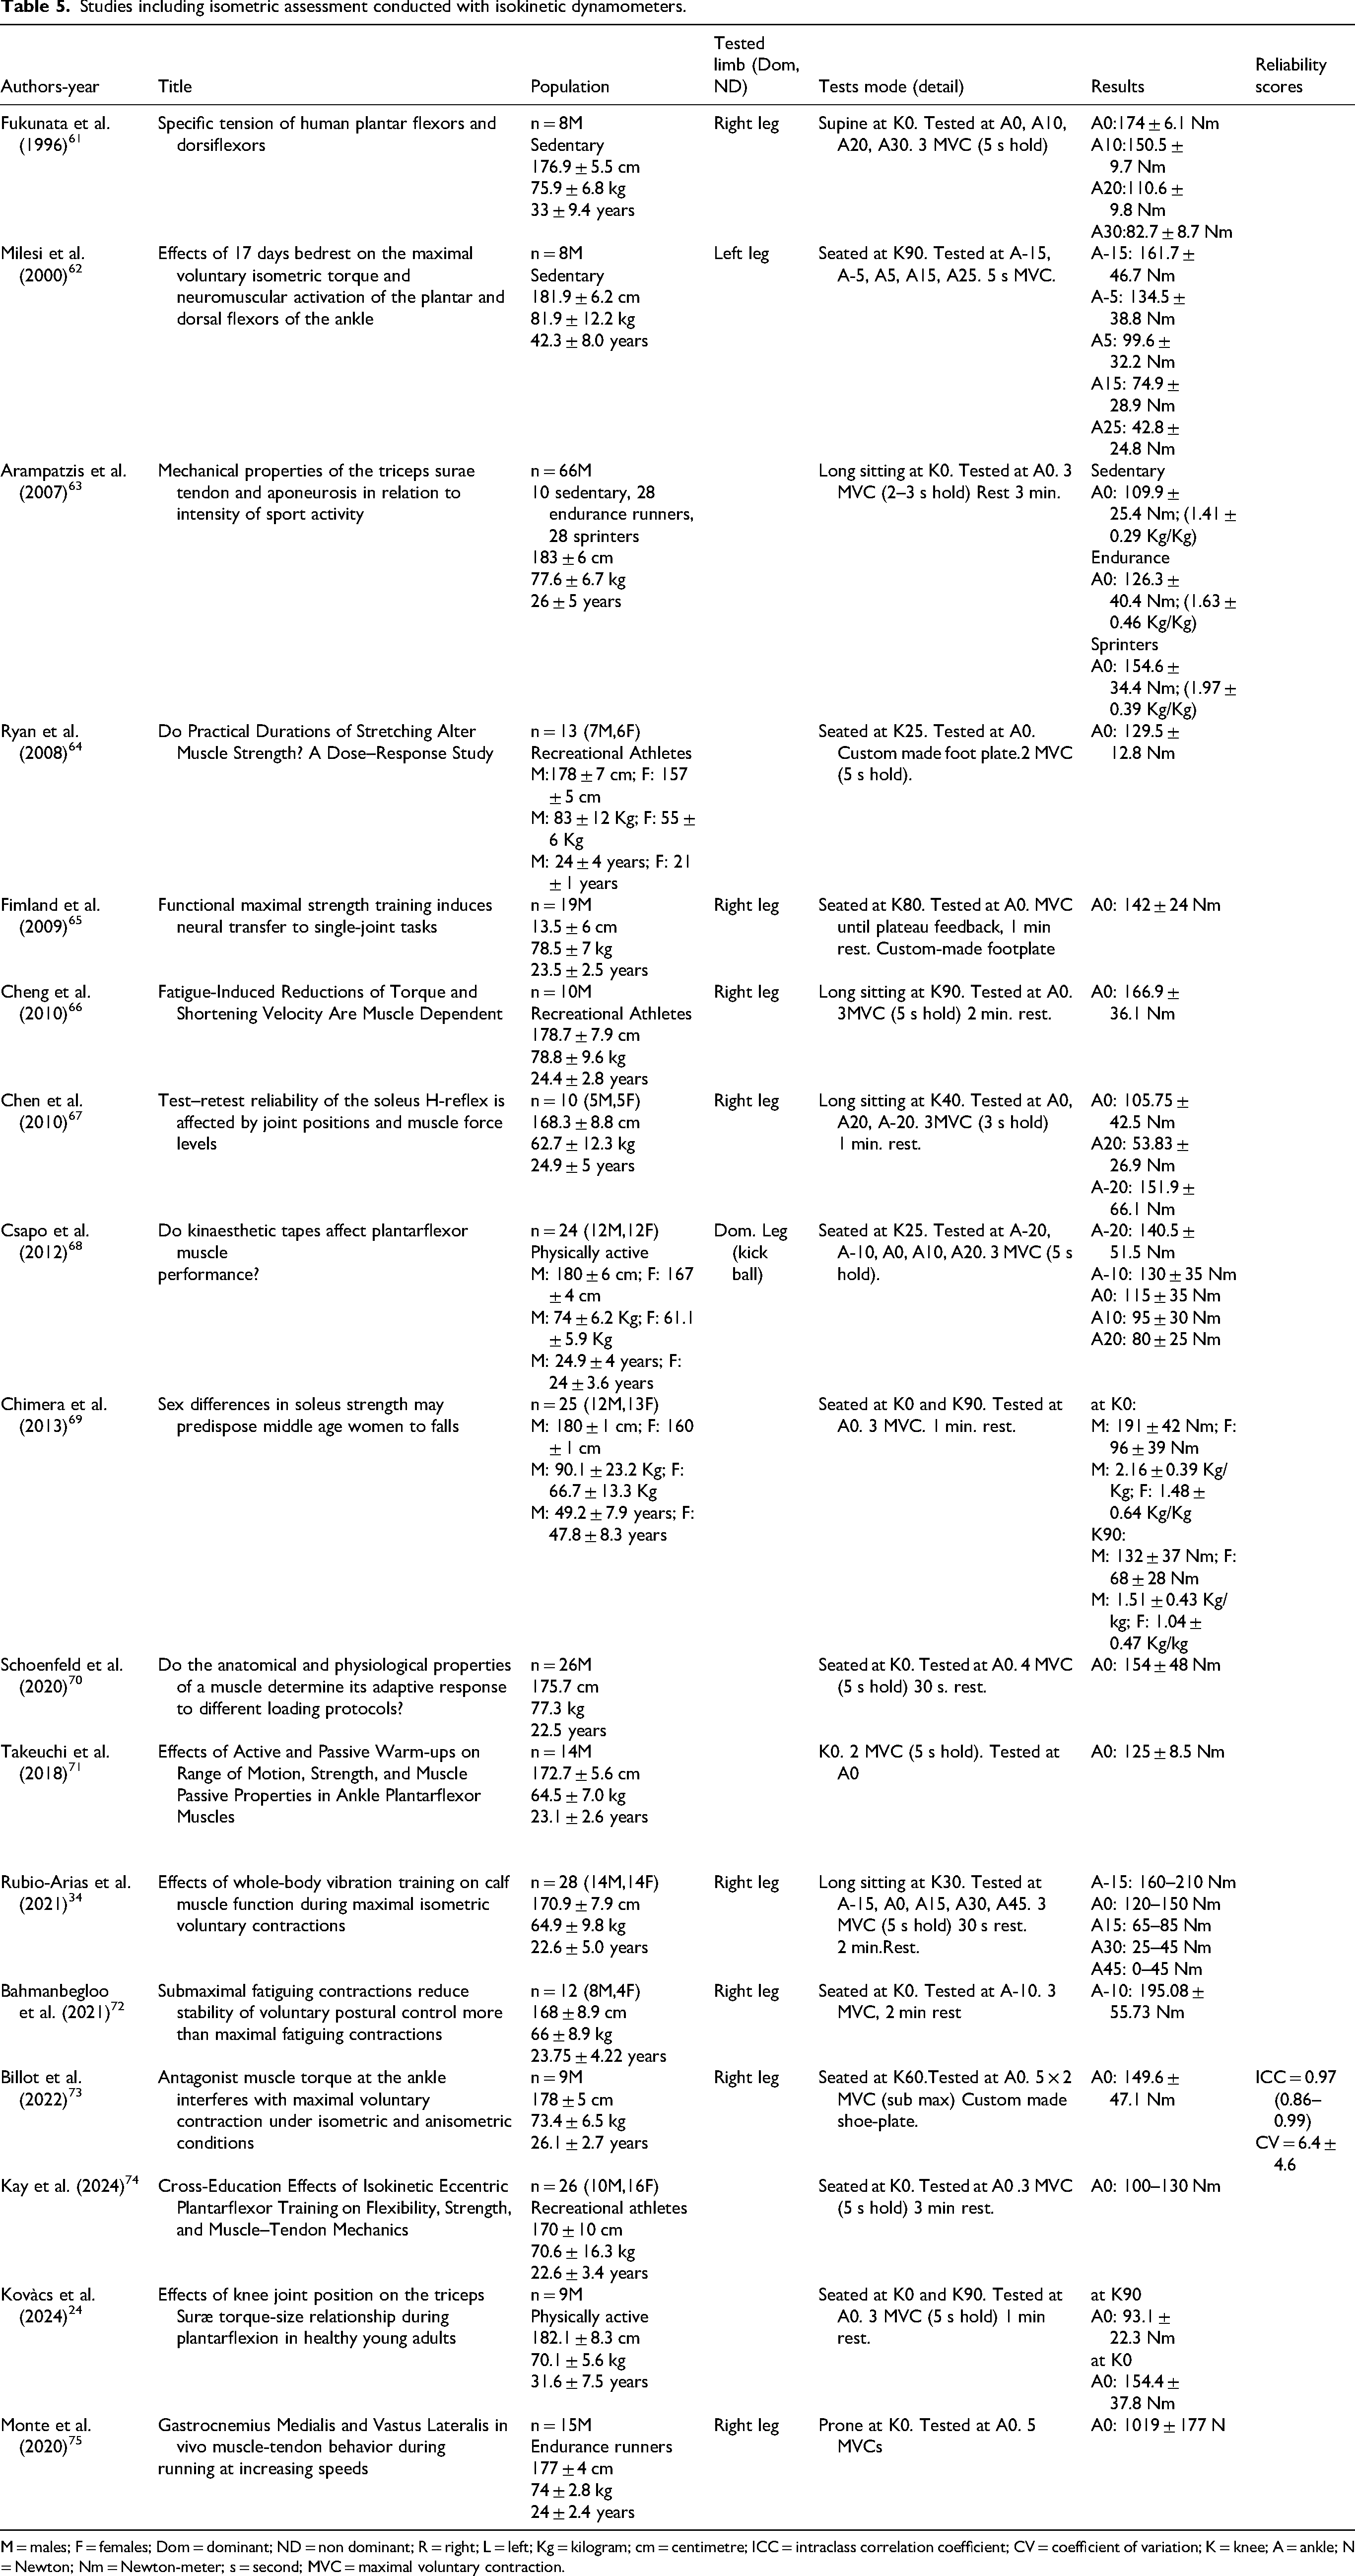
M = males; F = females; Dom = dominant; ND = non dominant; R = right; L = left; Kg = kilogram; cm = centimetre; ICC = intraclass correlation coefficient; CV = coefficient of variation; K = knee; A = ankle; N = Newton; Nm = Newton-meter; s = second; MVC = maximal voluntary contraction.
Isokinetic (IKD) assessment
So et al. 84 reported values of isokinetic assessment in a group of 25 sedentary and in 6 elite cyclist tested at K0 and at a speed of 60°/s and 180°/s. Cycling athletes had 112.3 ± 23.2 Nm and 1.78 ± 0.3 Kg/Kg for the dominant side at 60°/s vs sedentary with 89.9 ± 18.6 Nm and 1.51 ± 0.8 timed bodyweight. Farrag et al., 78 in a group of healthy females (n = 24) tested at K0, reported values of 142 ± 45.2 Nm while moving at an angular speed of 60°/s. At the same speed, but at K90, the plantar flexion peak torque was 100.1 ± 33.6 Nm. Moreover, the same research tema 33 published further isokinetic values at 60°/s, for the plantar flexors, in a mixed-gender sample (n = 33). For males, peak plantar flexion torques ranged from 74.8 to 95.4 Nm at K15, 78.5 to 102.8 Nm at K45, and 72.2 to 89.9 Nm at K90. For females, values ranged from 31.9 to 46.1 Nm at K15, 36.1 to 54.9 Nm at K45, and 31.8 to 43.1 Nm at K90. At the same angular speed, Scales et al. 79 reported a mean peak torque of 54.5 ± 17.3 Nm in males (n = 21) at K10, while Hopkins et al. 76 reported a mean peak torque of 44.5 ± 12.0 Nm in a mixed-gender sample (n = 30), not specifying the K testing angle. Gavanda et al. 96 omitted K details, reporting values of 111.8 ± 23.9 Nm at 60°/s and 82.5 ± 18.4 Nm at 210°/s for a group of 18. Gobbo et al. 92 also omitted to specify K while reporting values at 90°/s of a mixed gender group of 30: 28.92 ± 11.46 Nm and ICC of 0.88. Trappe et al. 88 reported isokinetic plantar flexion peak torque values using a Torque Velocity Dynamometer measured at K0, in a healthy sample (n = 18), predominantly composed of males (n = 14). The mean results decreased with increasing angular velocity: 114.1 ± 24.7 Nm at 30°/s, 88.5 ± 21.5 Nm at 60°/s, 58.5 ± 15.0 Nm at 120°/s, 41.7 ± 12.7 Nm at 180°/s, and 16.8 ± 6.5 Nm at 300°/s. This study also reported low CV, with values of ± 2.79% at 60°/s and ±2.28% at 120°/s. Bobbert et al. 25 in another group of physically active males (n = 10), at K0, found a mean peak torque of 162.5 Nm at 30°/s, 132.5 Nm at 60°/s, 82.5 Nm at 120°/s and 60 Nm at 180°/s. Seymour et al. 91 assessed isokinetic peak torque in a group of females (n = 19), comparing active and sedentary participants. When seated at K0, active individuals showed higher values than sedentary ones, with 74.87 ± 17.52 Nm vs. 61.69 ± 11.97 Nm at 30°/s, and 22.60 ± 12.61 Nm vs. 15.59 ± 12.76 Nm at 180°/s. At K90, active participants reached 57.54 ± 11.7 Nm at 30°/s and 18.53 ± 10.34 Nm at 180°/s, compared to 35.8 ± 15.3 Nm and 11.9 ± 12.45 Nm in sedentary peers. Similarly, Woodson et al. 83 reported peak torque values of 83.96 ± 15.65 Nm at 30°/s and 37.27 ± 12.64 Nm at 120°/s in a mixed-gender group (6 males, 9 females), with an associated ICC of 0.80. In prone position, active individuals again produced higher peak torques: 52.8 ± 12.6 Nm vs. 37.15 ± 18.98 Nm at 30°/s, and 9.64 ± 12.0 Nm vs. 1.22 ± 3.86 Nm at 180°/s. Twist et al. 77 reported mean peak torque values ranging from 118 to 127 Nm in healthy adults (n = 9) measured at K60 and at an angular velocity of 30°/s. Tuominen et al. 81 reported peak torque values of 98.7 ± 30.7 Nm for the dominant leg and 97.5 ± 38.9 Nm for the non-dominant leg in a group of 18 mixed-gender runners, tested at K45 and 30°/s. At the same speed but at K30, Mandal et al., 80 found values of 110.6 ± 29.7 Nm during the concentric phase and 131.4 ± 33.1 Nm in the eccentric phase. The ICC values ranged from 0.74 to 0.99. Müller et al. 85 reported, at 60°/s, concentric values of 165.59 ± 45.06 Nm and eccentric values of 106.96 ± 23.73 Nm in male athletes tested in long sitting at K60. Reliability scores for concentric were 0.42 and 0.71 for the eccentric phase. Likewise, Möller et al. 93 (n = 10 males) and Gonosova et al. 82 (n = 20 mixed-gender) provided concentric and eccentric data. The first study examined three testing positions (K90 and K0 at 30°/s and 180°/s, and a closed kinetic chain at 30°/s), reporting values of ICC between 0.72 and 0.95. The second reported at 30°/s and 120°/s, distinguishing dominant and non-dominant legs, reporting ICC ranging from 0.85 to 0.96. Results of isokinetic assessment were presented in Table 6.
Studies including isokinetic assessment.
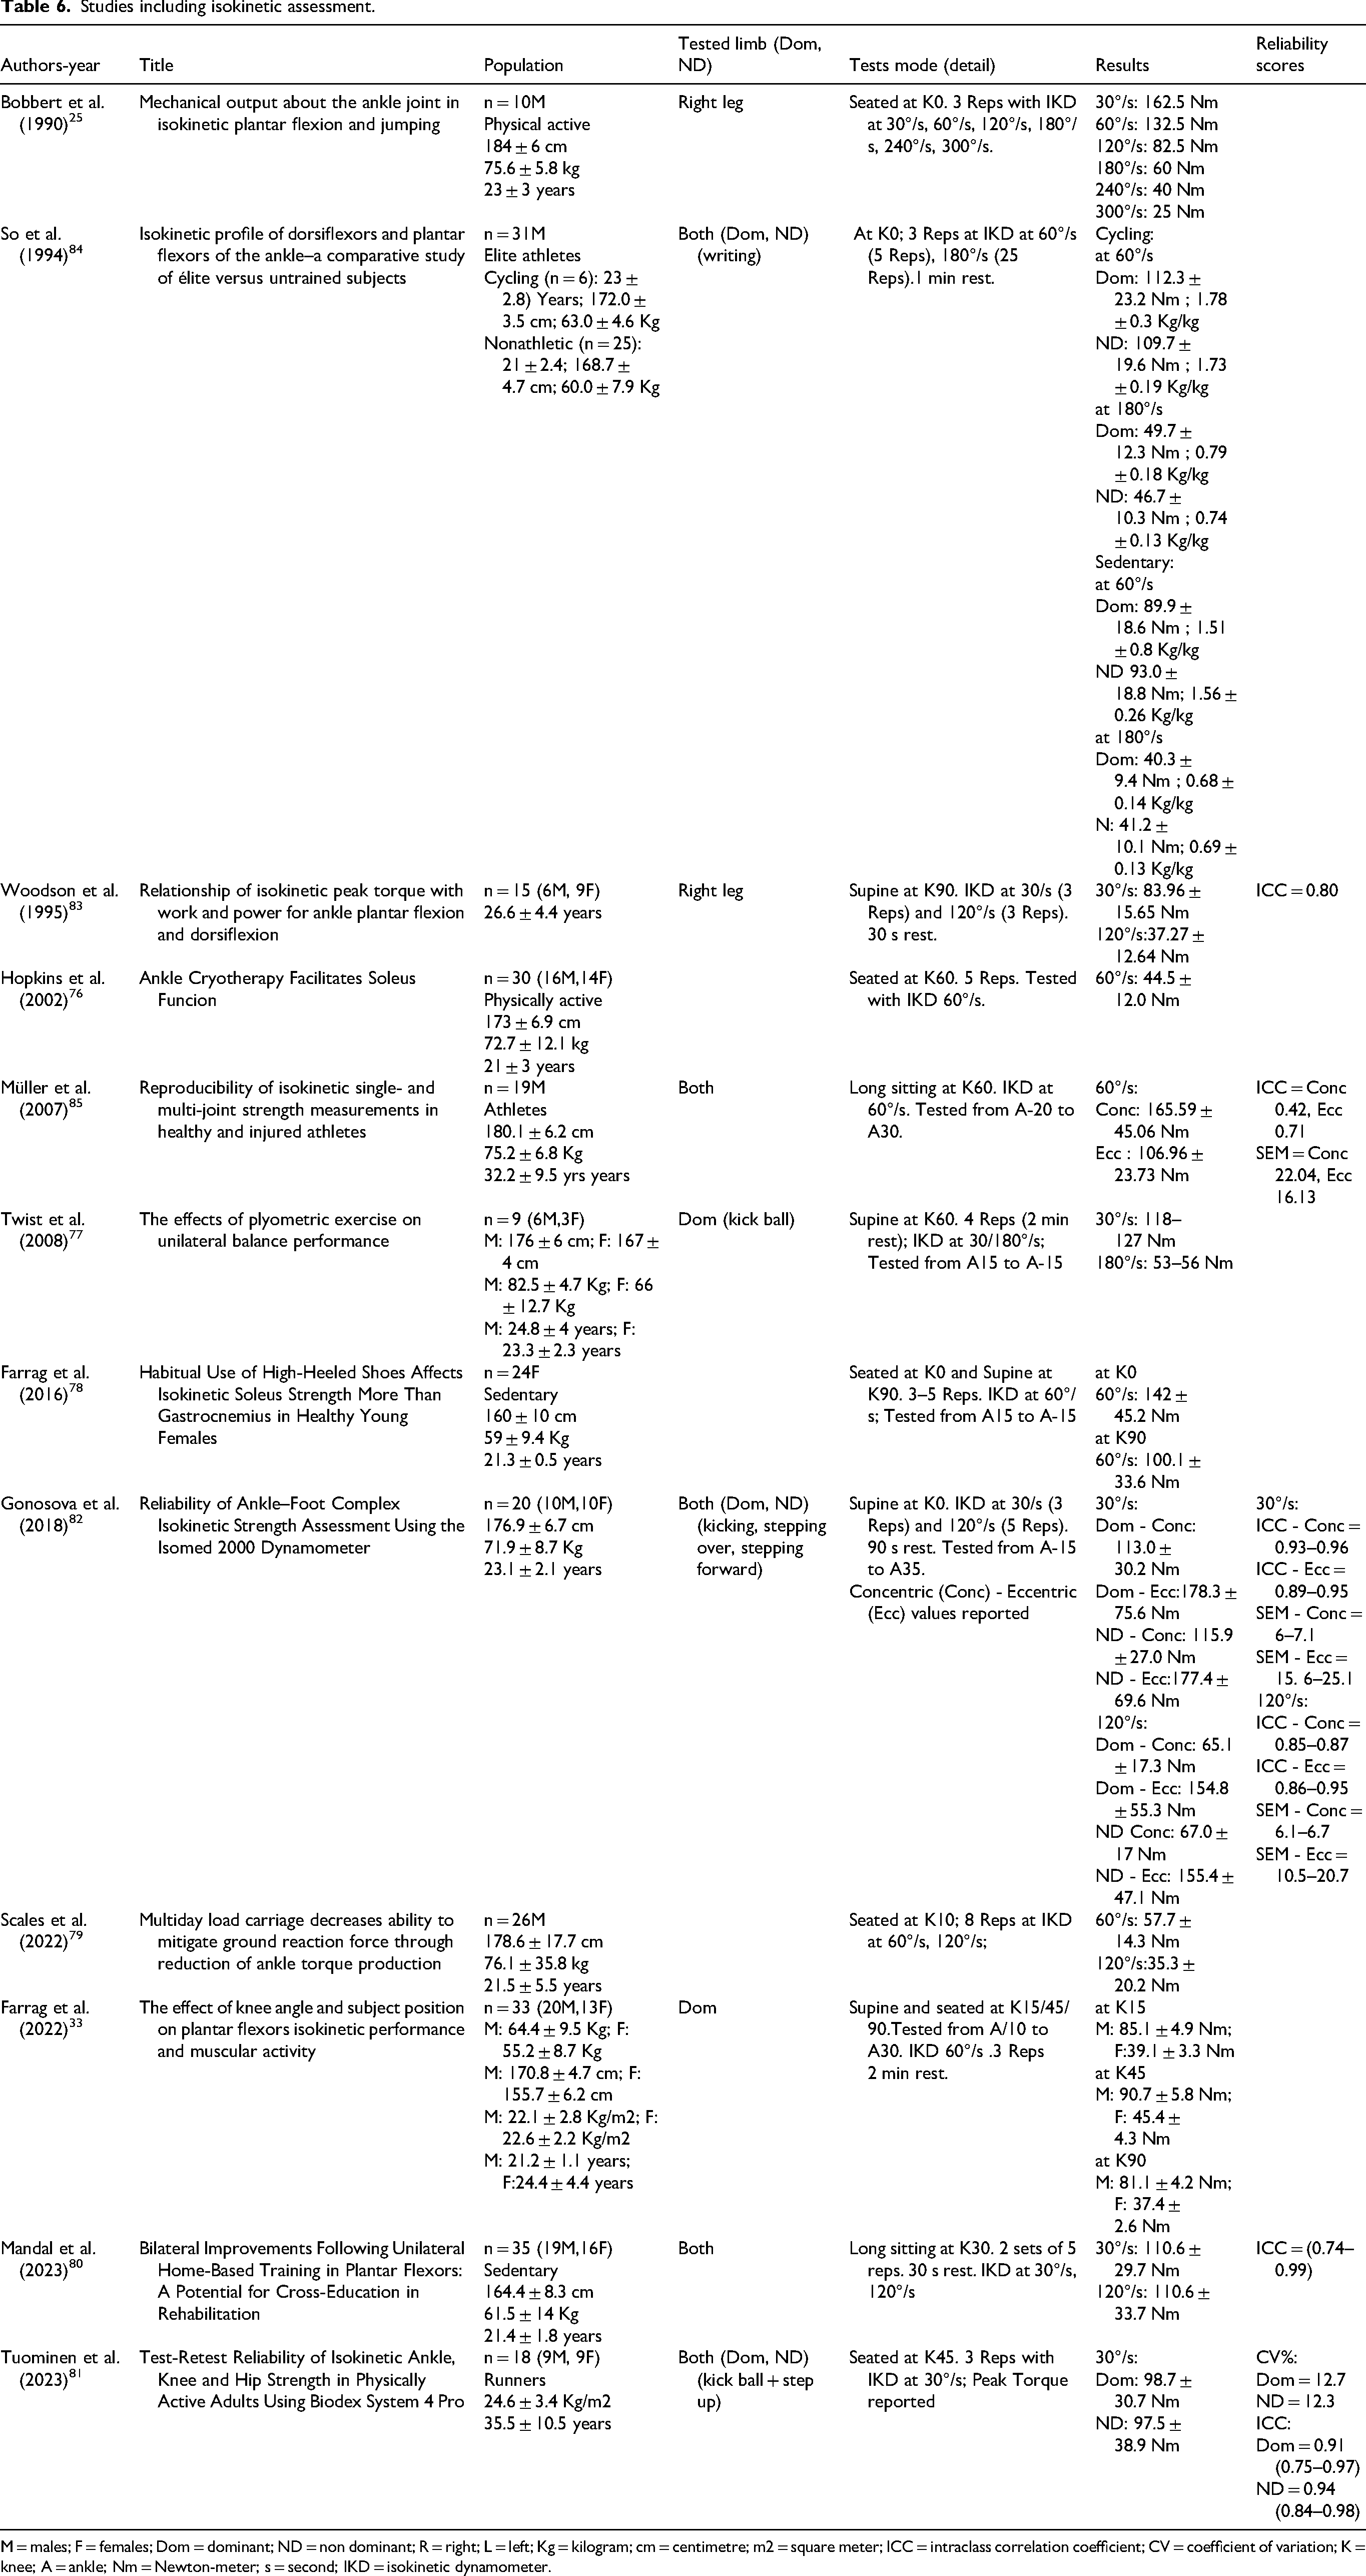
M = males; F = females; Dom = dominant; ND = non dominant; R = right; L = left; Kg = kilogram; cm = centimetre; m2 = square meter; ICC = intraclass correlation coefficient; CV = coefficient of variation; K = knee; A = ankle; Nm = Newton-meter; s = second; IKD = isokinetic dynamometer.
Isotonic assessment
Standing (K0)
Nelson et al. 27 measured the 1RM of unilateral standing heel raises (K0) using a Smith machine in a sample of healthy males (n = 12) and females (n = 13), reporting a mean ICC of 0.98. The maximum heel raise height achieved during the initial attempt was marked and subsequently used as the target for defining a successful repetition throughout the test. The mean load lifted by single leg stance was 349 (±30) N and 369 (±51) N for the left and right leg, respectively. Möck et al., 95 in a sample of physical education students (n = 56) tested the 1RM of the standing heel raise (K0), standardizing the ankle excursion with a default value of 12 cm (4 cm of eccentric and 8 cm of concentric movement), and using a laser system to monitor the correct test execution. Values ranged from 1.48 to 3.48 times body weight.
Seated (K70-K90)
Nagar et al. 94 calculated the theoretical 1RM using seated calf raises (K90) using a pulley machine, with a maximal loading capacity of 24 Kg, in a group of collegiate university basketball players (n = 30). The results ranged from 23.9 to 34.3 kg. Mendonca et al., 86 used a gym-based calf rotary machine (Technogym, Gambettola, Cesena, Italy) to measure 1RM in a seated position at K0. They reported mean values of 51.2 ± 10.2 kg in a mixed-gender sample (n = 30). Gavanda et al. 96 found values of 1RM equal to 163.2 ± 40.2 Kg in a group of 10 males and 8 females, who had a resistance training experience. The test was executed with a seated leg press machine. Results of isotonic assessment, together with multiple modes within the same study were presented in Table 7.
Studies including isotonic assessment and multiple tests.
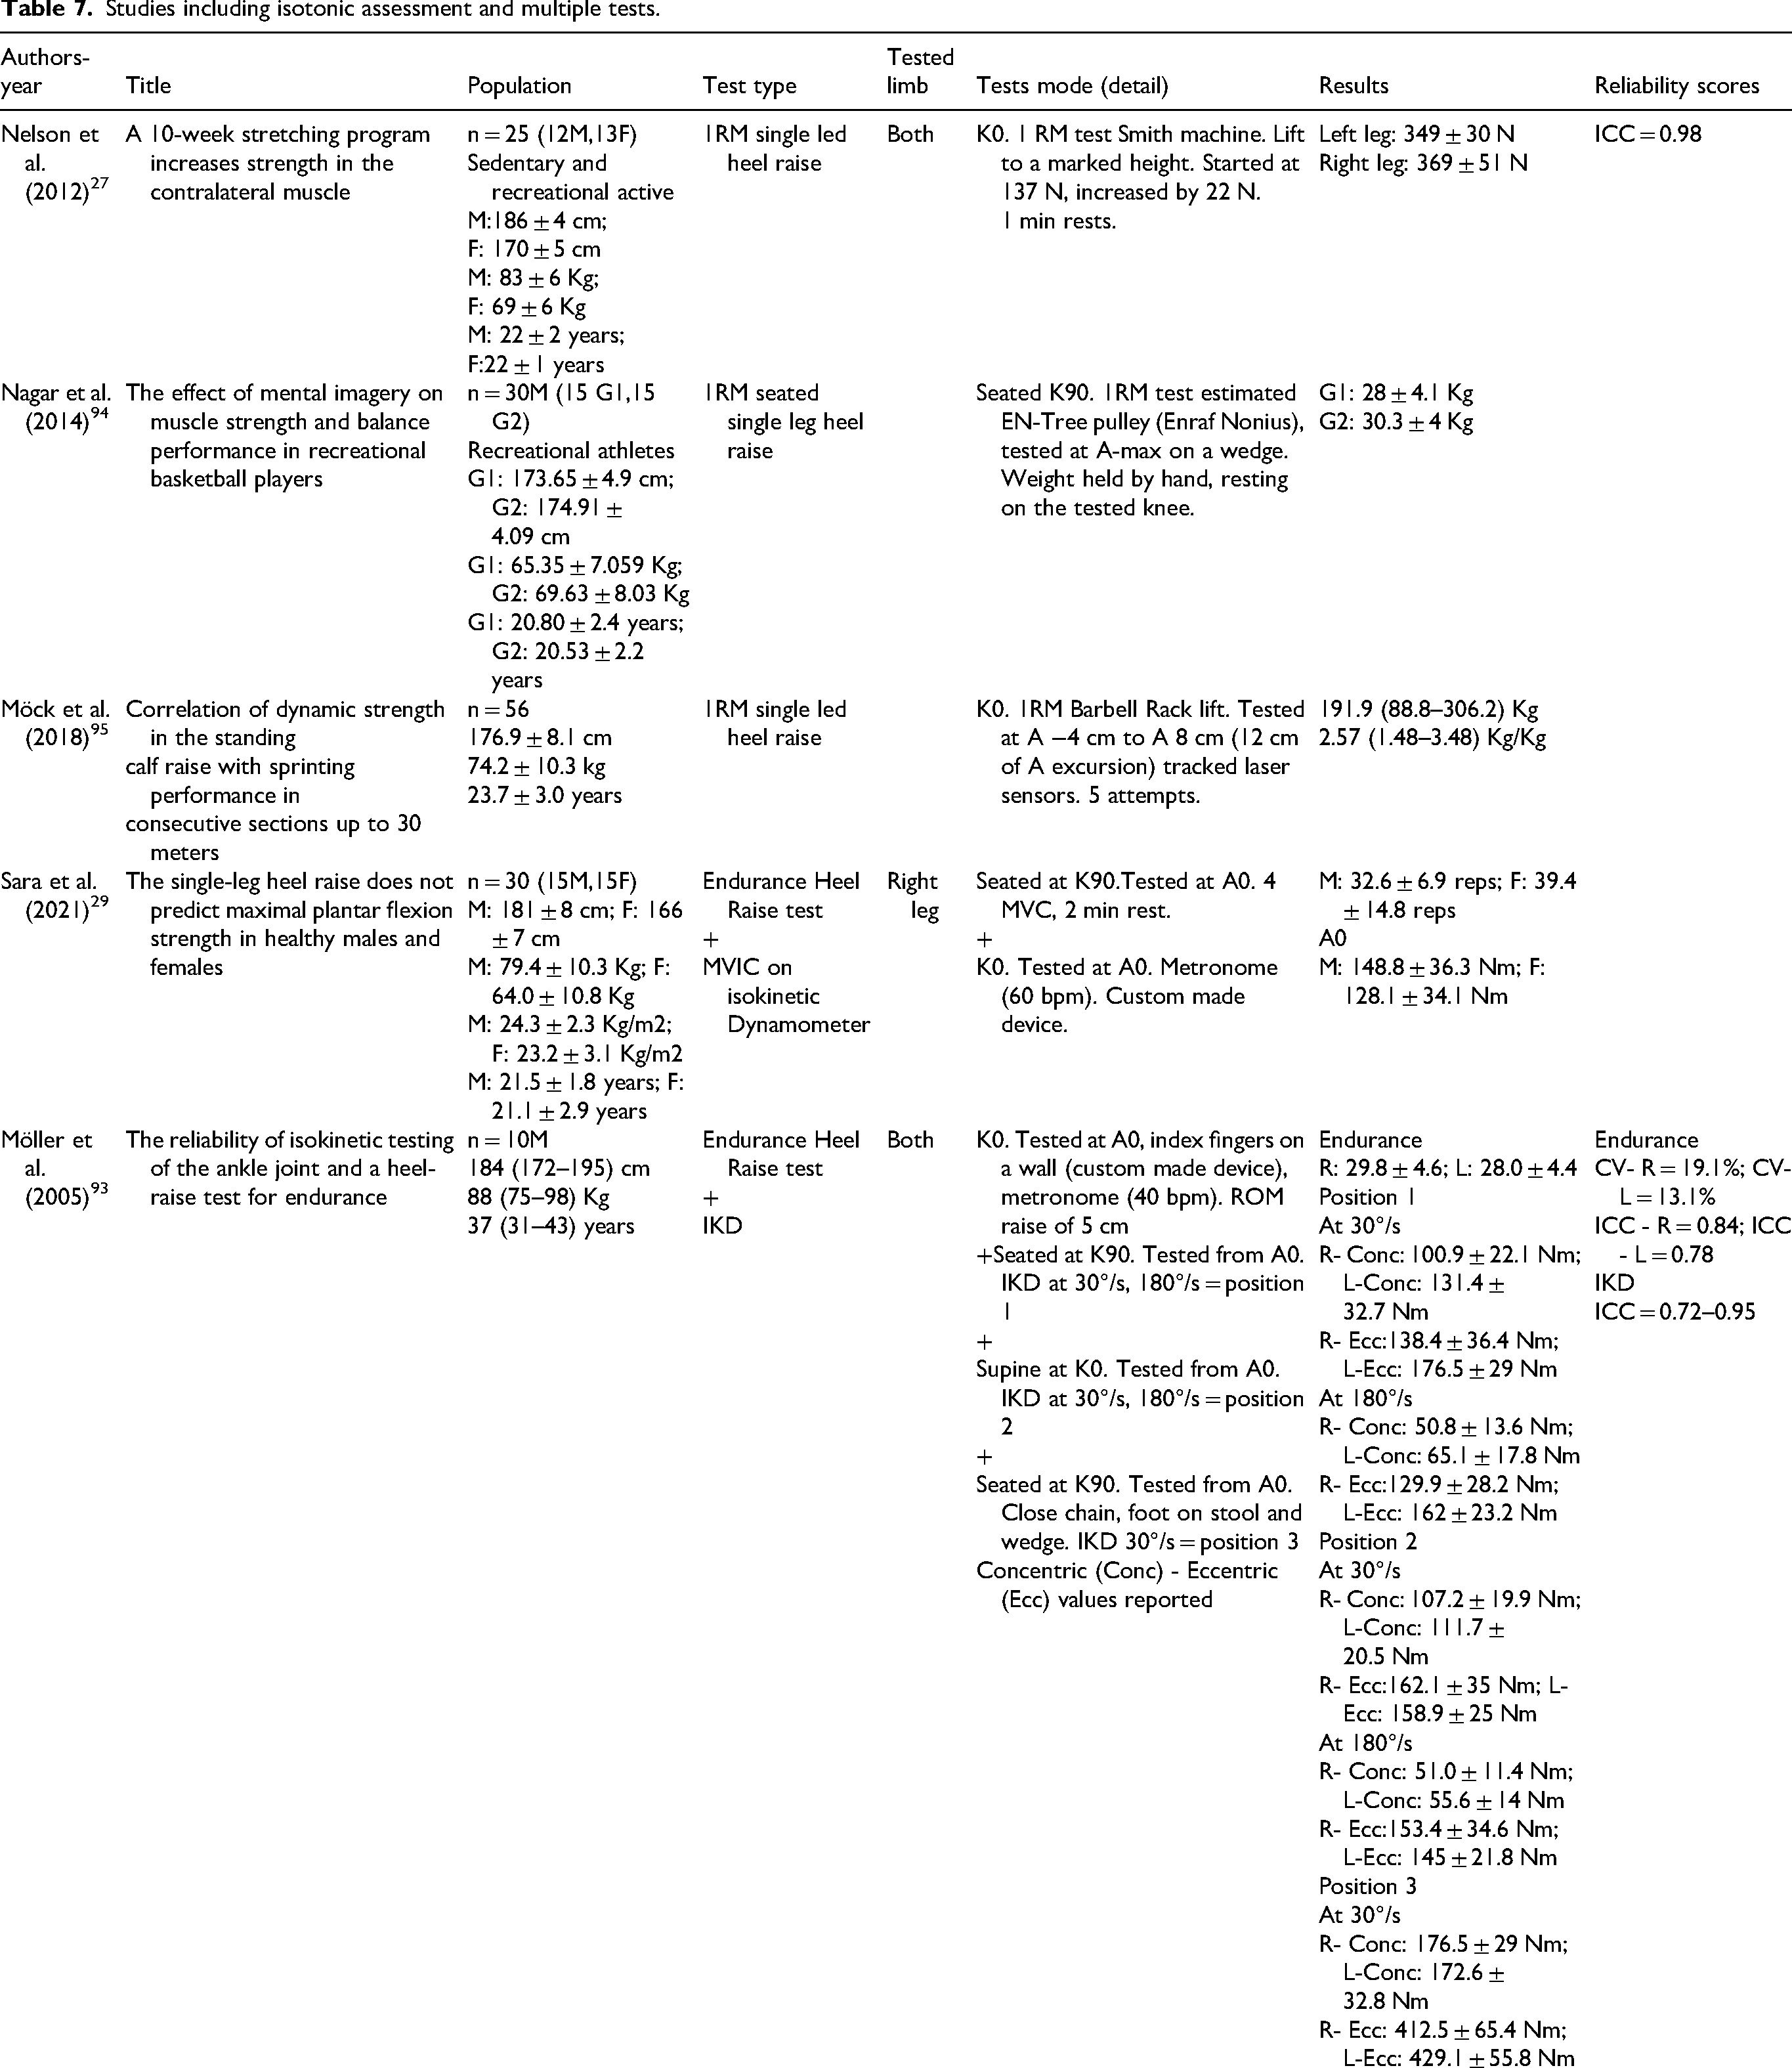
M = males; F = females; Dom = dominant; ND = non dominant; R = right; L = left; Kg = kilogram; cm = centimetre; m2 = square meter; bpm = beat per minute; ICC = intraclass correlation coefficient; SEM = standard error of measurement; CV = coefficient of variation; K = knee; A = ankle; N = Newton; Nm = Newton-meter; MVC = maximal voluntary contraction; RM = repetition maximum; ROM = range of motion; s = second.
Synthesis of results
Test's outcomes and reliability scores were extracted from 3020 healthy subjects. Due to significant heterogeneity in the study populations and testing protocols settings, calculating pooled means across studies was not feasible.
Discussion and implication
This review aimed to: first, identify and categorize the types of assessment modes used; second, evaluate their psychometric properties (reliability).
Different knee and ankle joint positions in the sagittal plane were found in our review. Tests labelled as K90 (with the knee flexed close to or beyond than 90°) primarily reflect the capacity of the SOL 98 and the other intrinsic and extrinsic foot muscles involved in ankle plantar flexion. Tests labelled as K0 (with the knee fully extended) include the contribution of the GAS muscles also. Measurements obtained at intermediate knee angles (i.e., K25, K45, K60) should be interpreted with consideration of the graded involvement of the GAS according to the specific knee angle used.
Endurance tests
The heel raise test (and variations) 99 is considered the elective test to measure and report calf endurance capacity. Most of the described variations were tested with the knee maintained at K0. The impact of knee angle on test outcomes appears minimal, as similar total repetitions were observed both at 30° 46 and at 45° 47 of knee flexion. This suggests that moderate differences in knee joint angles do not substantially affect performance during the heel raise test. Although intra-session reliability is generally “good” to “excellent”, ranging from 0.77 50 to 0.96–0.97,41,42,100 substantial inter-subjects variability has been noted. This is evident in studies with large sample sizes (n > 200), where the total number of repetitions ranged from 6 to 70, 44 and in a more recent cohort including approximately 600 individuals, between 13 and 50 repetitions among participants in their 30 s.22,48 Indeed, despite the explicit description and stratification of testing procedures by age, gender, and physical activity level, 48 the large inter-subject performance differences raise concerns about the challenges in its standardization. Different testing variables such as cadence, 101 ankle angle starting position, 43 distance from the wall 42 and the use of cueing during test execution, 49 can influence test performance, thus making the comparison between tests and individuals challenging. For all those reasons, establishing a universally accepted normative value that could serve as a reliable benchmark of calf endurance capacity for healthy individuals remains a significant challenge.
Isometric tests using load cells
Seven of the 12 studies that have used linear load cell systems to measure isometric strength, have tested plantar flexors at K90, and most of results reported were obtained at A0. Although not always described,52,57,58 reported ICCs varied between 0.90 and 0.99,51,53,59 with relatively low CV (7.9 ± 5.7%). 53 However, interpretation of reliability scores should be approached with caution due to small sample size (n = 4), 53 and ambiguously defined joint positions during testing. 51 Notably, a promising approach was observed in studies employing a combination of force plates and a leg press setup to assess isometric strength at K0 and A0, 59 yielding excellent reliability (ICC = 0.99, CV = 1.81%). In addition, data collected under unclear ankle positions (ranging between A-20 and A-max) in specific athletic populations may limit their generalizability. 21 Although isometric testing offers practical advantages such as tightly controlled force application, acceptable reliability scores, and involves relatively low-cost equipment, a main limitation should be acknowledged. A key peculiarity of isometric force production is its strong dependance on the joint angle at which it is measured. As a result, strength assessed at a single joint position may not accurately reflect force generating capacity across the ankle full range of motion. This may impair the applicability of such assessments, failing to reflect the dynamic force production required in most daily or athletic activities.102,103
Tests performed with isokinetic dynamometers
Isokinetic dynamometers enable accommodation of the resistance throughout the entire range of motion, 104 and allow to profile strength across multiple velocities. 105 Isokinetic dynamometers are commonly used in research to evaluate isolated muscle strength across multiple joints, due to their low CV 106 and excellent reliability scores.81,107 In fact, 49 of the 65 studies included in this review employed an isokinetic dynamometer to assess either isometric or dynamic strength. Several studies adopting isokinetic or customized dynamometry have reported good-excellent levels of reliability for plantar flexors testing. Across different setups and velocities, ICC values generally ranged between 0.74 80 and 0.99, 73 with CVs between 2.2 and 12.7%.81,97 Tests conducted at slower angular velocities (e.g., 30°/s) and under tight controlled positions (e.g., K45) produced the greatest ICC values. 81 These findings support the use of isokinetic dynamometry for reliably assessing plantarflexors strength, though variations in positioning, device configuration, and movement speed suggest that standardization is key to ensuring reproducibility across studies. However, isokinetic devices are not readily available owing to their relatively high cost. 108 Furthermore, from a pragmatic standpoint, time-consuming setup procedures are required. 92 Overall, the reported scores are specific to the particular procedures employed (A, K) of the targeted population assessed. 82 Finally, direct comparisons of absolute or relative scores across the different studies proved challenging during the analysis of our results, thereby impeding the development of meaningful benchmarks.
Isotonic strength assessments RM
The American College of Sports Medicine guidelines recognize the 1–5 repetition maximum (RM) testing as the ‘gold standard’ for dynamic strength assessment.18,19 This reflects muscular performance throughout the entire range of motion. In our review, reliability scores were not reported for either of the two isotonic K90 tests (SOL + plantar flexors). When assessing isotonic strength at K90, notable discrepancies in absolute values emerged depending on test protocols. For example, 1RM values in recreationally active individuals were surprisingly relatively modest (25.9–34.3 kg) when using a pulley machine. 94 Instead, isotonic assessments using a seated leg press 96 showed significantly greater absolute strength values (e.g., 163.2 ± 40.2 kg), thus reinforcing the need for standardized isotonic assessments at K90 to enable cross-study comparisons.
Isotonic tests conducted at K0 also demonstrated substantial variability. The adoption of a fixed displacement protocol, such as the 12 cm ankle excursion used in barbell heel raise testing, 95 may not accommodate individual anthropometric differences (height, foot size, and gender)60,109 which can affect the test score. In contrast, protocols employing individualized range marking using a Smith machine, allow a tailored assessment by adapting the excursion to each participant characteristics. 27
Accordingly, when evaluating plantarflexors strength using RM testing, it is essential to account for individual ankle excursion. Furthermore, test scores should be normalized to bodyweight to ensure meaningful interpretation.
Limitations and directions for future research
The outcomes reported were predominantly expressed in absolute values, with a limited number of studies providing relative strength measures, hence the interpretation of the results across individuals and populations are limited, as absolute values do not account for differences in body mass that significantly influence muscular performance. 110 While the restricted inclusion criteria (excluding participants younger than 18 and older than 65 years) may limit the generalizability of these findings to pediatric and older adult populations, this review nonetheless provides a comprehensive report of the most used assessment methods and their respective outcomes for ankle plantarflexors in diverse healthy samples. The significant heterogeneity observed across study samples and testing protocols, encompassing variations in range of motion, reliance on custom-made devices, diverse test positioning, and different contraction types hindered calculation of benchmarks which was one of the aims of this review. Future research should prioritize tests utilizing standardized protocols, commercially available devices or rigorously validated custom setups, (e.g., consistent joint angles and contraction types). The least reported category, “isotonic assessment”, represents a promising future direction for the development of plantar flexor testing.
Differences between PROSPERO protocol and the review
Due to the authors’ greater expertise with the tools described in this review (i.e., the Downs and Black checklist and the PEDro scale), these instruments were selected and applied by two independent reviewers for the assessment of methodological quality and risk of bias. This choice represents a deviation from the originally specified approach in the PROSPERO-registered protocol, which had indicated the use of the Cochrane Risk of Bias tool.
Conclusions
This review offers a comprehensive summary of endurance, isometric, isokinetic and isotonic assessments for calf capacity in healthy individuals. Performance scores of each included individual study and relative psychometrics values have been reported. Although the 1–5 repetition maximum testing is considered the ‘gold standard’ for dynamic strength assessment, isokinetic testing emerged as the most frequently employed mode, showing high reliability but limited accessibility. Isometric tests using load cells demonstrated good to excellent reliability in the included studies, though they used varied testing protocols and were often restricted to small samples or athletic populations. The “heel raise test” remains the most common mode for evaluating plantarflexors endurance capacity, but its performance is affected by ankle angle starting position, cadence and the use of cueing during test execution, thus limiting the establishment of normative data for clinical and research purpose. Given its direct reflection of dynamic strength, isotonic assessment represents a promising yet underutilized method that warrants further development and standardization.
Supplemental Material
sj-docx-1-spo-10.1177_17479541261427469 - Supplemental material for Calf capacity measurements in healthy populations: A systematic review
Supplemental material, sj-docx-1-spo-10.1177_17479541261427469 for Calf capacity measurements in healthy populations: A systematic review by Paolo Artina, Anthony Turner, Chris Bishop and Luca Maestroni in International Journal of Sports Science & Coaching
Supplemental Material
sj-docx-2-spo-10.1177_17479541261427469 - Supplemental material for Calf capacity measurements in healthy populations: A systematic review
Supplemental material, sj-docx-2-spo-10.1177_17479541261427469 for Calf capacity measurements in healthy populations: A systematic review by Paolo Artina, Anthony Turner, Chris Bishop and Luca Maestroni in International Journal of Sports Science & Coaching
Footnotes
Acknowledgments
Not applicable
Ethical approval information,institution(s) and number(s)
Not applicable.
Contributorship
Paolo Artina (PA) is the guarantor. PA conceived the study design, conducted the literature search, extracted data, analysed results, and drafted the manuscript; Luca Maestroni (LM) conceived the study design, elaborated results, and edited and revised the manuscript; Anthony Turner (AT) conceived the study design, edited and revised the manuscript; Chris Bishop (CB) conceived the study design, edited and revised the manuscript. All authors have read and approved the final version of the manuscript and agree with the order of presentation of the authors.
Funding
The authors received no financial support for the research, authorship, and/or publication of this article.
Declaration of conflicting interests
The authors declared no potential conflicts of interest with respect to the research, authorship, and/or publication of this article.
Data availability statement
No new data were generated for this study. All data analysed in this systematic review are from previously published studies, which are cited in the manuscript. Further information is available upon request.
Supplemental material
Supplemental material for this article is available online.