
Abstract
This study examined the effects of velocity-based training (VBT) on free-weight barbell back squat technique compared with traditional resistance training (TR). Ten experienced participants completed anthropometric assessments, one-repetition maximum (1RM) testing, and VBT familiarisation, followed by randomised squat sessions using both methods. During VBT, participants received real-time velocity feedback and lifted with maximal concentric intent; during TR, participants used their habitual technique without feedback. Statistical significance was set at p ≤ 0.05. No significant differences were found in peak joint angles or trunk inclination (p > 0.05), although small to moderate effects were observed (Hedges’ g). Mean resultant barbell velocity, the vector sum of horizontal and vertical velocity components, was higher during VBT (0.48 ± 0.05 m·s−1) than TR (0.43 ± 0.04 m·s−1; p < 0.001), with a large effect; however, the vertical velocity component was greater during TR (94.7 ± 2.1%) than VBT (92.3 ± 3.1%; p = 0.016). The 95% confidence ellipse area of center of pressure (CoP) was larger during VBT (106.7 ± 26.9 cm2) than TR (58.4 ± 16.1 cm2; p < 0.001), with a large effect. Coefficients of variation were comparable across all variables. Collectively, these results indicate that VBT did not significantly alter joint or trunk kinematics, and any observed differences were small and unlikely to be practically meaningful. However, whilst resultant velocity was greater during VBT, this was accompanied by larger CoP perturbations, suggesting greater instability. Practitioners should monitor technique and consider athlete experience, training objectives, and injury risk when implementing VBT.
Introduction
Resistance training is widely used in strength and conditioning programs to improve performance and reduce the risk of injury. 1 Designing an effective resistance training program requires careful consideration of variables including intensity, sets, and repetitions. Traditional resistance training (TR) methods typically prescribe intensity by using a percentage of an individual's one-repetition maximum (1RM). 2 However, this approach has potential limitations, as 1RM testing can be time-consuming, fatiguing, and carries a risk of injury if performed incorrectly.3,4 Moreover, an individual's 1RM may change throughout a program due to factors such as stress and fatigue5,6 or as strength improves over time. Similarly, TR methods typically prescribe repetitions based on generalised estimates of how many repetitions can be performed with a given 1RM percentage, 2 which also presents challenges. First, the number of repetitions achievable with a given intensity varies between individuals and depends on the specific exercise.7,8 Second, fatigue accumulates across sets, reducing the number of repetitions that can be performed before failure in subsequent sets. 9 As a result, two individuals with identical prescribed sets, repetitions, and relative intensities may experience different training stimuli.
Velocity-based training (VBT) has gained popularity in recent years and offers an alternative approach to several key elements of resistance training prescription and monitoring. VBT is based on the principle that concentric velocity is inversely related to percentage of 1RM. 10 This load-velocity relationship has been observed across various populations and exercises11–14 and remains relatively stable over time, even as an individual's strength changes. 10 Accordingly, in VBT, training intensity can be prescribed by adjusting load until concentric velocity corresponds to a target 1RM percentage. Concentric velocity is also sensitive to fatigue: as fatigue accumulates during a set, velocity declines linearly.15–17 This insight has led to the concept of velocity loss: using a reduction in mean concentric velocity from the first repetition in a set, as a cue for set termination. 18 Using velocity loss methods, rather than prescribing a fixed number of repetitions, sets are ended once mean concentric velocity drops by, for example, a predefined percentage. 18 Higher velocity loss thresholds are associated with greater fatigue markers, such as metabolite accumulation and closer proximity to failure, whereas lower thresholds result in less fatigue and preserve movement velocity and power output. 17 Accordingly, velocity loss thresholds can be used to target specific adaptations. Finally, VBT also serves as a real-time feedback and motivational tool. Velocity-tracking devices deliver immediate visual or auditory feedback on metrics such as mean or peak velocity. Research consistently shows that such feedback improves acute performance19,20 motivation, and competitiveness.21–23 These effects may also contribute to improved long-term adaptations across a training program.24,25
Despite the growing evidence supporting VBT, its influence on exercise technique has received limited attention. This issue is relevant for several reasons. First, a core component of VBT is performing the concentric phase of each repetition with maximal intent. 26 This contrasts with most general training guidelines which, outside of specific power-focused contexts, typically encourage controlled, deliberate movement. 27 Accordingly, it is possible that an overemphasis on maximal concentric intent could compromise technique. Indeed, this has been identified as an issue within the strength and conditioning field: coaches report that athletes often ‘chase’ velocity numbers at the expense of their technical execution. 28 Second, the feedback provided in VBT is a form of augmented ‘knowledge of results’ feedback, which focuses on a specific outcome – in this case, the velocity achieved during a set.29,30 In contrast, ‘knowledge of performance’ feedback focuses more on the factors underlying the outcome – for example, providing technical cueing after a set 30 – and may be more effective for learning and refining technique. 31 This raises questions about whether VBT's emphasis on velocity feedback during or after each set or repetition could detract from valuable qualitative feedback, potentially impacting motor learning or reinforcing suboptimal movement patterns. Finally, most VBT studies have used Smith machines, which constrain movement to a fixed path.18,32,33 This reduces movement variability, leaving the influence of VBT on technique during free-weight exercises, where stability demands are greater, relatively unexplored.
To date, minimal research has examined how VBT influences technique or movement quality in free-weight exercises, despite its growing use and an acknowledgement of the issue in strength and conditioning practice. 28 Understanding this relationship is critical, as deviations in technique may affect performance or increase injury risk. Therefore, the aim of this study was to compare technique between VBT and TR methods during free-weight barbell back squats. It was hypothesised that VBT would influence joint kinematics and stability and lead to greater movement variability compared with TR methods.
Methods
Experimental design
A randomised crossover design was used to assess the effects of VBT methods compared to TR methods on free-weight barbell back squat technique. Participants attended four preliminary sessions, which included anthropometric assessments, 1RM testing, and familiarisation sessions using VBT methods and technology. After the familiarisation sessions, participants attended two training sessions using free weight barbell back squats. One session used VBT methods, while the other used TR methods. The only differences between the training sessions were that during the VBT session, participants were instructed to perform the concentric phase of the squat with maximal concentric intent and were provided visual and auditory feedback of their velocity after each repetition. The order of the testing sessions was randomised and each session, including familiarisation sessions, was separated by at least 48 hours. All sessions were conducted at the University of New England's research laboratory, under the supervision of a qualified strength and conditioning coach.
Participants
Thirteen participants (9 males, 4 females) were initially recruited for the study. Two participants withdrew due to injury, and one due to illness – all unrelated to the study – resulting in a final sample size of 10 (6 males, 4 females). The participants’ ages ranged from 22 to 58 years, with a mean age of 31 ± 10.1 years. The mean body mass of participants was 82.7 ± 12.2 kg, and the mean height was 173.5 ± 7.82 cm. All participants were required to have a minimum of three months of recent resistance training experience, with a mean training frequency of four sessions per week (SD = 1.2; range = 2–5 sessions). Additionally, they were required to have regularly performed barbell back squats during the preceding three months and to be capable of performing a barbell squat to powerlifting depth standards. Mean squat 1RM was 117.1 kg (SD: 30.1 kg; range = 76–178 kg, corresponding to a mean relative squat 1RM of 1.4 × body mass (SD = 0.3; range = 0.8–2.0). None of the participants had prior experience with VBT methods. They were informed about the purpose, testing procedures, risks, and benefits associated with the study, and provided written consent prior to participation. This investigation was approved by the Research Ethics Committee of The University of New England (approval number: HE22-085).
Procedures
Equipment
All squats were performed on a commercial-grade power rack (manufacturer unknown), using a 20 kg Olympic barbell (Rogue Fitness, Ohio, USA) and Olympic weight plates (Iron Edge, NSW, Australia). The mean concentric velocity (MCV) of all repetitions was recorded using a linear position transducer (GymAware, Braddon, Australia), which has demonstrated reliability. 34 The linear position transducer was also used to create individualised load velocity profiles (LVP) and determine training intensities for both VBT and TR sessions. Finally, the linear position transducer was used to provide participants with velocity feedback during the squat training sessions. A set of 36 reflective markers were placed on each participant, as shown in Figure 1. Additionally, an extra marker was attached to the left end of the barbell to allow mean component and resultant barbell velocity to be calculated from the three-dimensional (3D) motion capture data. This approach was taken to prevent potential synchronisation and data handling errors that can arise when aligning signals from multiple independent sources. To conduct a 3D kinematic analysis of the squat, eight synchronised digital cameras (OQUS 300, Qualisys, Gothenburg, Sweden) were used, tracking markers at a frequency of 100 Hz. These cameras were oriented to capture the entire squat movement while minimising obstruction from other equipment. The 3D motion capture system was synchronised with a single 60 × 40 cm tri-axial force plate sampling at 1000 Hz (Kistler 9281E, Kistler Group, Winterthur, Switzerland) to quantify centre of pressure (CoP). All synchronised data were imported into Visual3D (Version 5) for analysis (C-Motion, Maryland, USA). While the use of weightlifting belts was prohibited, to prevent marker obstruction, participants were permitted to wear their regular training shoes, including weightlifting shoes, and were required to use the same shoes for the duration of the study.
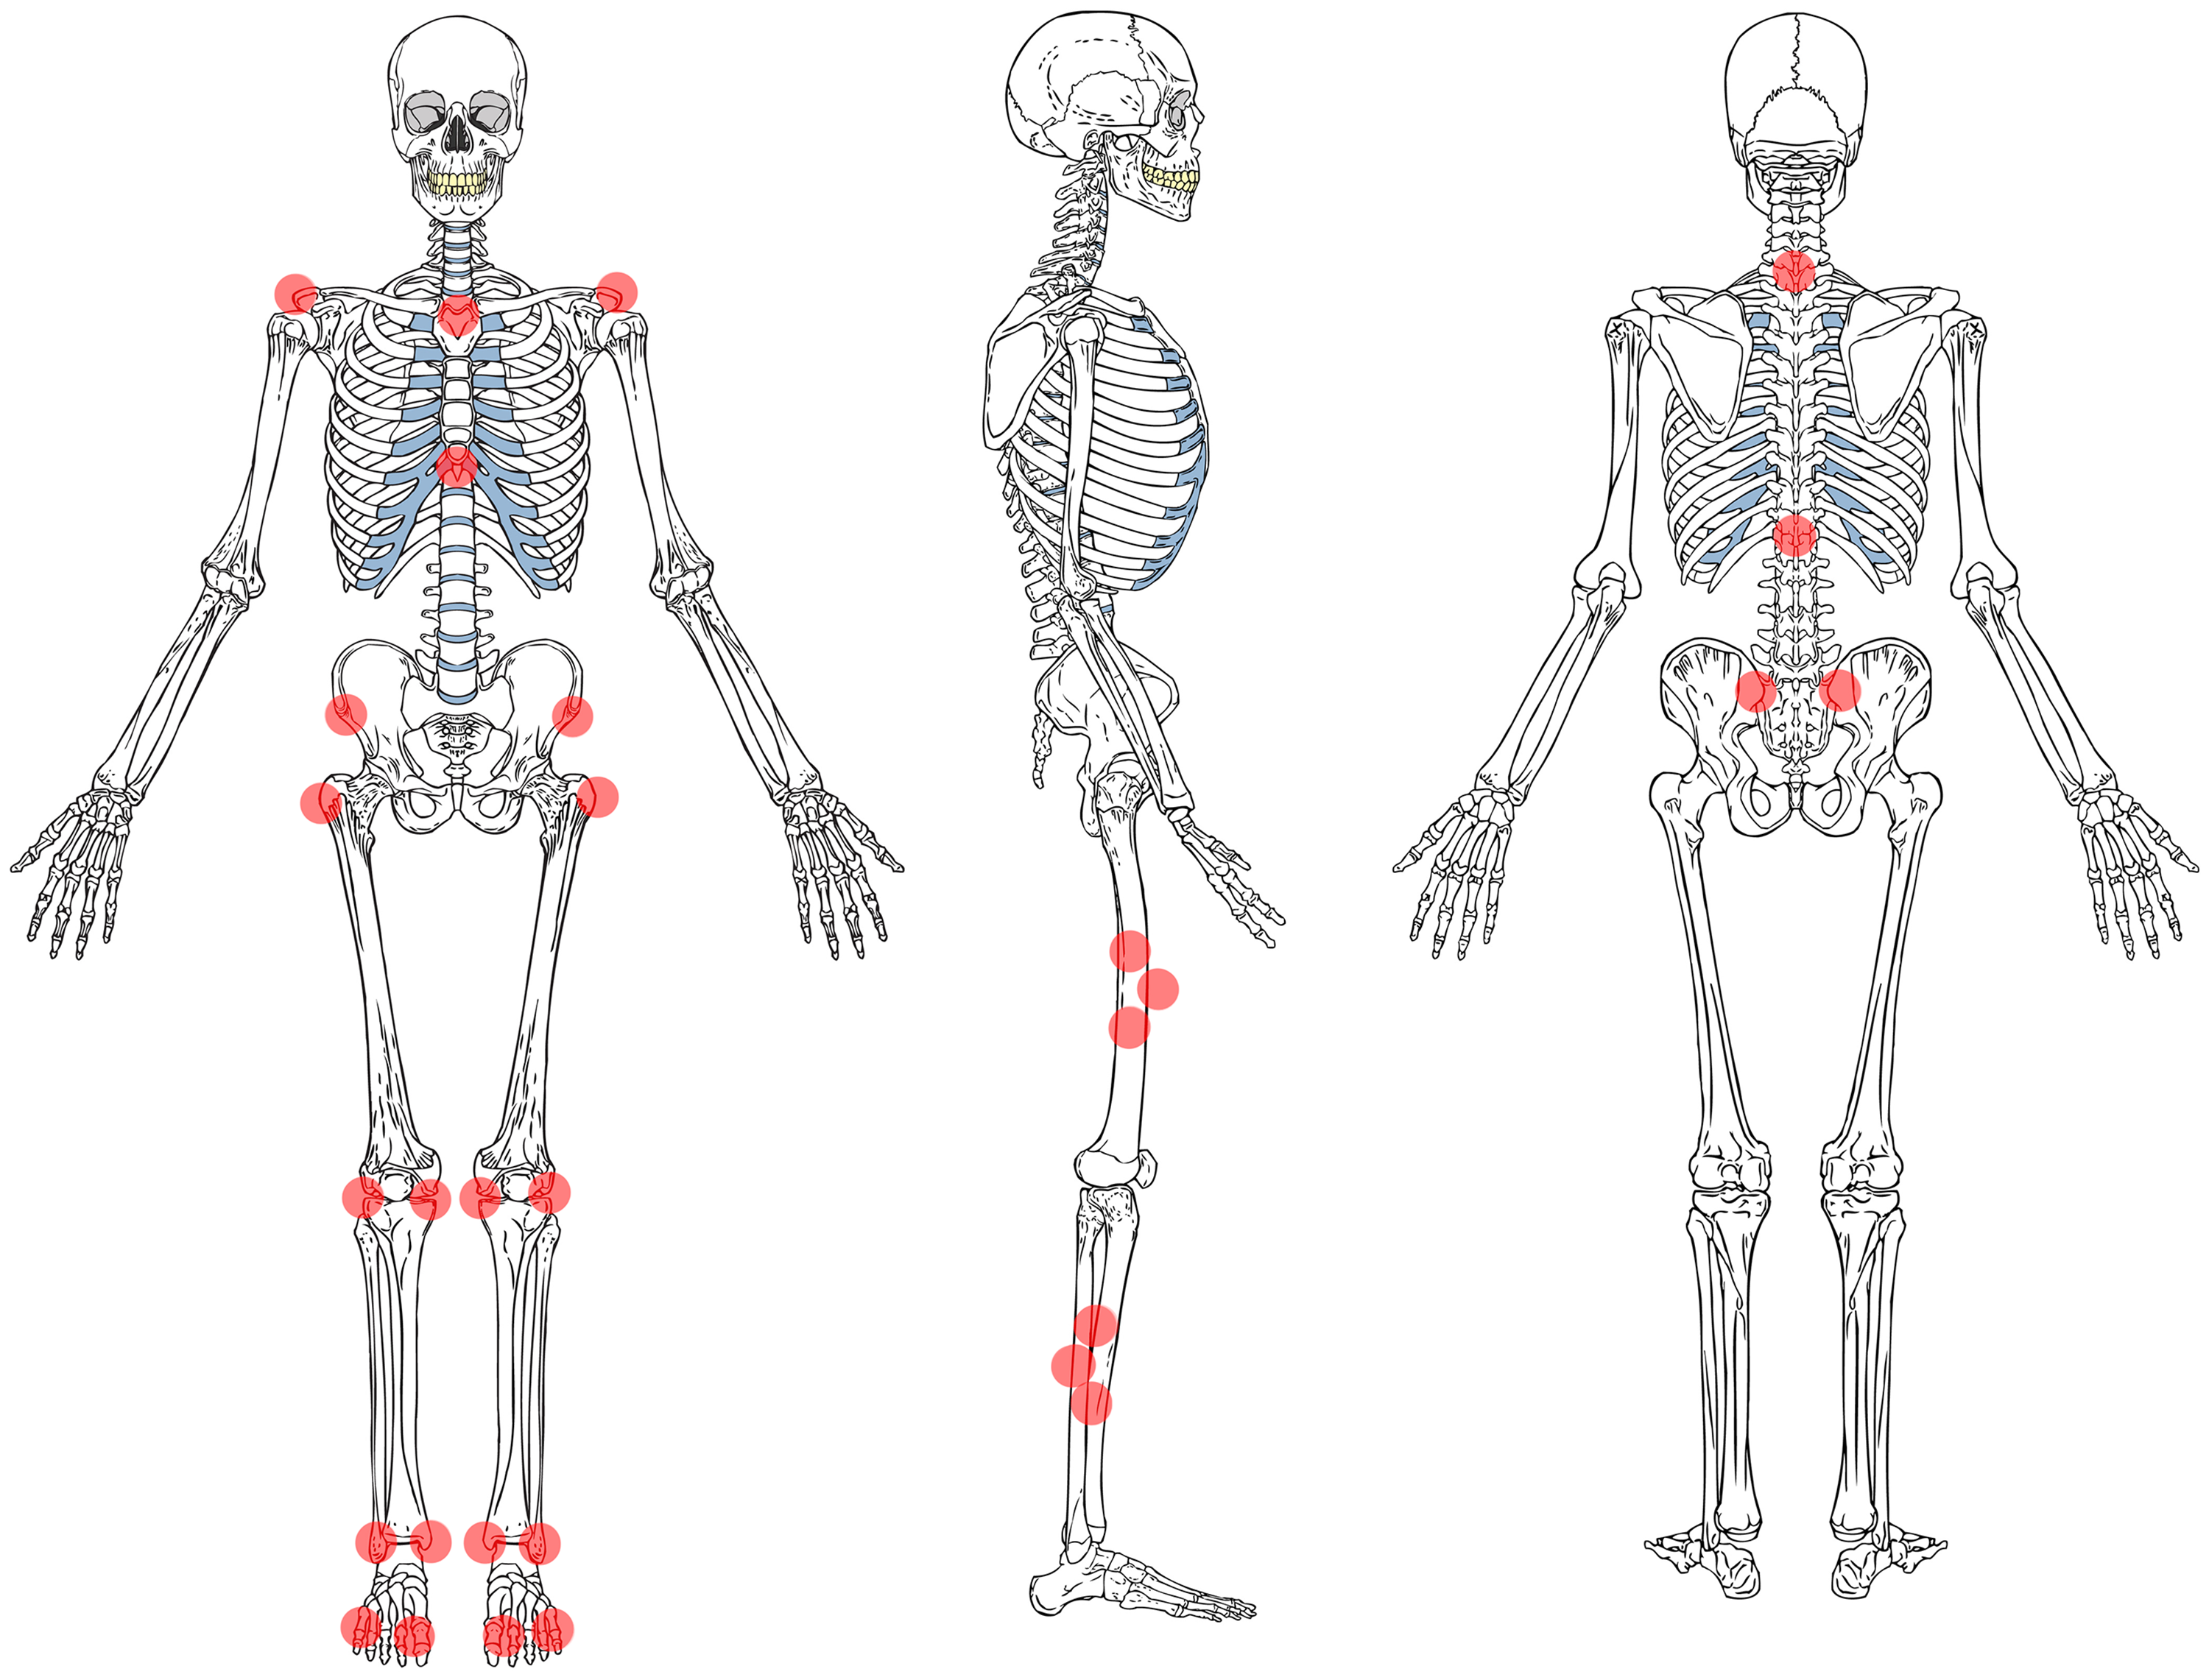
Reflective marker set. Note. Reflective marker placement used for 3D motion capture during the squat protocol. Image #60665269 from Vectorus adapted under Adobe Stock License.
Kinematic and kinetic data
A quintic spline filter was applied to all 3D kinematic data. Each repetition and its constituent phases were defined using the vertical velocity of a reflective marker placed on the left end of the barbell, derived from the 3D motion capture data following previously published methods. 35 The start of each repetition was defined as the final data point preceding the vertical barbell velocity becoming negative, corresponding to the onset of the descent. The start of the concentric phase was defined as the point at which vertical barbell velocity subsequently crossed zero and became positive. The end of the concentric phase was defined as the first data point following peak positive vertical barbell velocity at which velocity returned to, and stabilised around, zero. The minimum angles during each repetition were used to determine ankle, knee, and hip angles. Trunk inclination was calculated as the maximum angle of the trunk relative to a vertical line in the global reference frame. 36 Figure 2 presents a free body diagram of the barbell back squat and segmental angles.
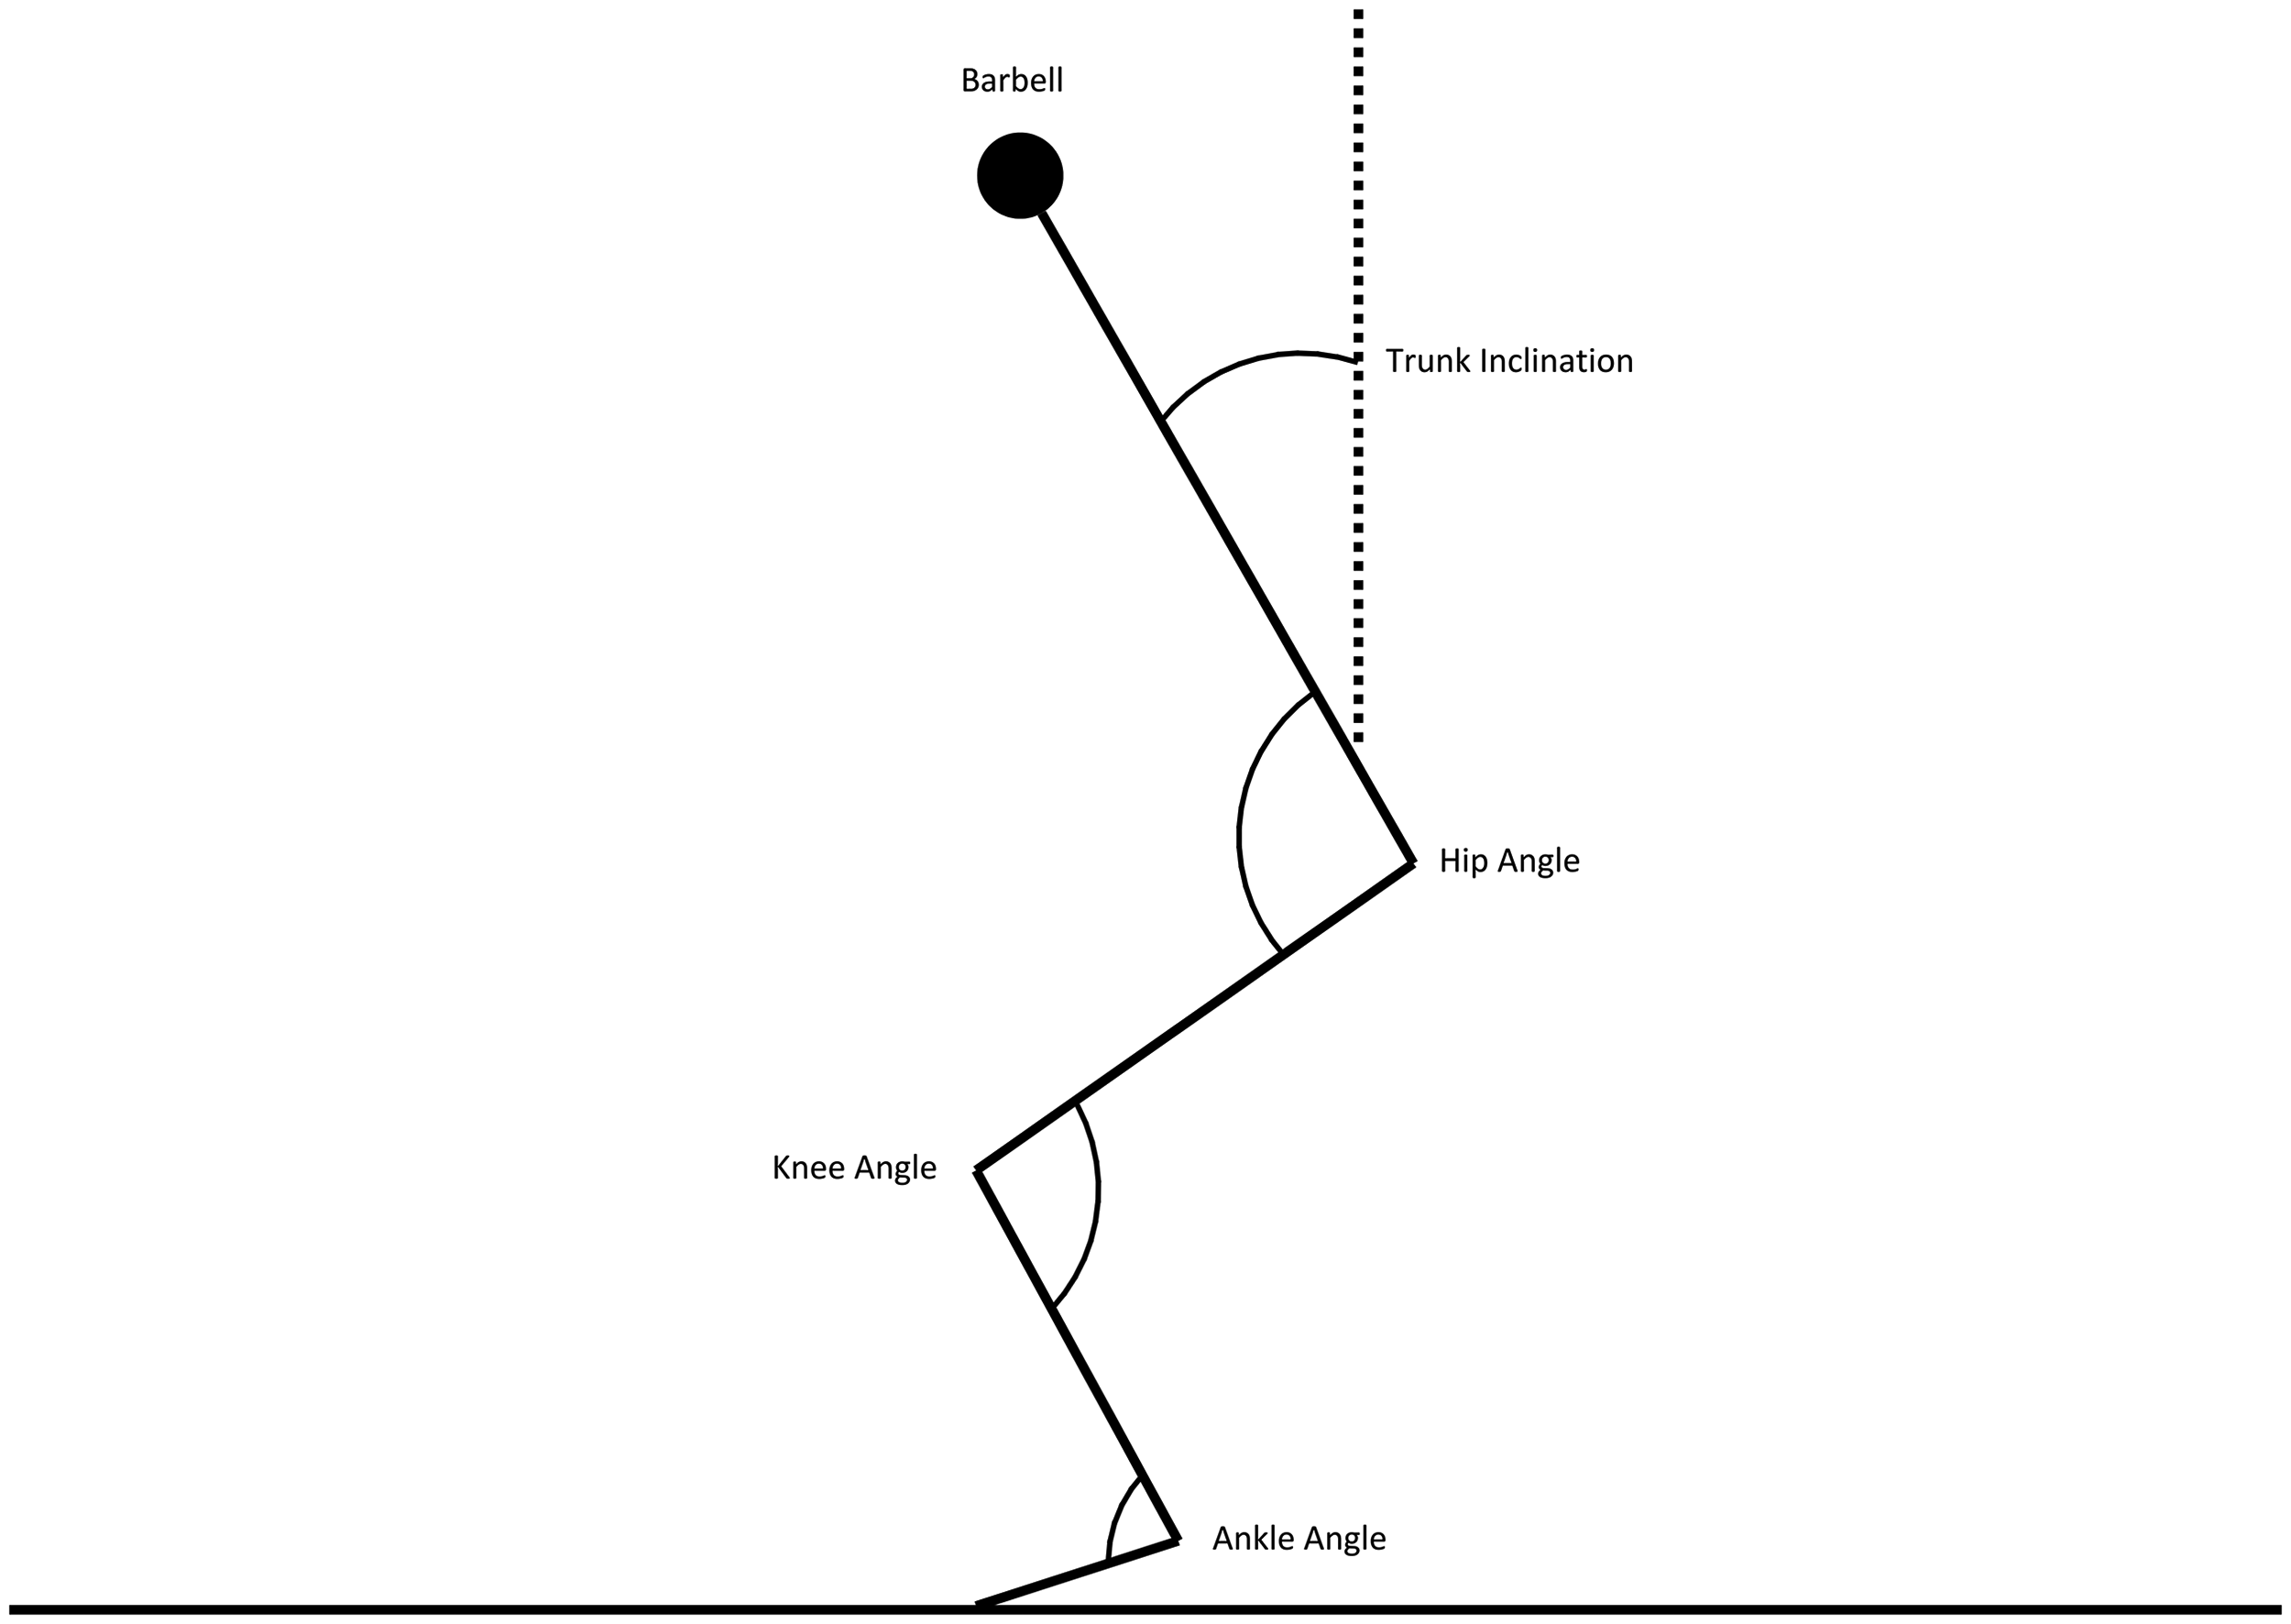
Free body diagram of barbell back squat and segmental angles. Note. Illustration of trunk, hip, knee, and ankle angles used for kinematic analysis.
Mean resultant velocity of the barbell was determined during the concentric phase using 3D motion capture data as the vector sum of horizontal and vertical velocity components. The vertical component of velocity was expressed relative to mean resultant velocity. The 95% confidence ellipse area for CoP during the concentric phase was calculated using previously published methods 37 with the semi-major axis oriented along the antero-posterior axis and the semi-minor axis along the medio-lateral axis.
Procedures
Before the first session began, participants underwent pre-exercise screening and had their anthropometric data collected. The initial two sessions involved 1RM testing and load–velocity profiling to establish an individualised relationship between percentage of 1RM and mean concentric barbell velocity (LVP). 18 In sessions three and four, participants gradually worked up to a target velocity corresponding to the mean concentric velocity achieved with 80% of their 1RM (± 0.03 m·s−1), derived from this LVP. Subsequently, they performed one set to volitional fatigue. During the testing and familiarisation sessions, participants were not provided with velocity feedback. However, they were instructed to perform the concentric phase of all repetitions with maximal intent. The participants were otherwise advised to use their regular squatting technique, and no additional coaching or cueing was provided. Each session began with a standardised warm-up routine, consisting of dynamic stretches followed by barbell back squats. This involved 2 sets of 8 repetitions using a 20 kg barbell, and 1 set of 3 repetitions at 20%, 40%, and 60% of their 1RM.
In the fifth and sixth sessions, the participants participated in structured squat training. These sessions also started with the same standardised warm-up, followed by three sets of eight squats at 80% of their 1RM, with a three-minute rest period between each set. The squat load was gradually increased post-warm-up until MCV was within 0.03 m.s−1 of the target velocity corresponding to 80% of the participant's 1RM. Once this load was determined, it remained constant for all three sets. The structure of these sessions was identical, but they differed in training methods: one employed VBT and the other used TR methods. In the VBT session, participants received real-time MCV feedback through visual and audio outputs via an iPad and were instructed to perform each repetition with maximal concentric intent. In contrast, the TR session involved no MCV feedback, and participants were instructed to squat using their regular technique. No additional cues, coaching, or verbal motivation were provided in either session. The order in which participants performed each session was randomly assigned.
Statistical analyses
Statistical analyses were conducted using Microsoft Excel and IBM SPSS Statistics (Version 29). For each training condition, repetitions from all three trials were analysed collectively to enable paired comparison. Repetitions were excluded from analysis when excessive data loss occurred due to marker obstruction. In cases of bilateral data, such as joint angles, data were aggregated before analysis. Descriptive statistics, including the mean, standard deviation, and coefficient of variation, were computed for each variable. A Shapiro-Wilk test of normality was administered to validate the use of parametric tests; it confirmed normal distribution of all variables (p > 0.05) except for relative ankle angle during the TR session (p = 0.042). To address this deviation from normality, a Wilcoxon signed-rank test was conducted for the relative ankle angle variable, finding no significant median difference between the TR and VBT conditions (p = 0.203). This finding was consistent with the findings from parametric tests, justifying the use of parametric tests in the final analysis. Accordingly, differences between training conditions were examined using paired sample t-tests, with the alpha level of significance set at p ≤ 0.05. Effect sizes were quantified using Hedges’ g, selected for its suitability with smaller sample sizes, and interpreted using standard thresholds: small (g ≥ 0.2), medium (g ≥ 0.5), or large (g ≥ 0.8). 38 Additionally, 95% confidence intervals were calculated for both the mean and Hedges’ g.
Results
No significant differences were found in peak joint angles or trunk inclination (p > 0.05), with small to moderate effects observed (Hedges’ g = −0.51 to 0.37). Mean resultant barbell velocity was lower during TR (0.43 ± 0.04 m·s−1) than VBT (0.48 ± 0.05 m·s−1; p < 0.001; Hedges’ g = −1.70). The vertical component of velocity was higher during TR (94.7 ± 2.1%) than VBT (92.3 ± 3.1%; p = 0.016; Hedges’ g = 0.85). The 95% confidence ellipse area for CoP was smaller during TR (58.4 ± 16.1 cm2) than VBT (106.7 ± 26.9 cm2; p < 0.001; Hedges’ g = −1.75). Coefficients of variation were similar between methods, ranging from 2.2–33.3% for TR and 3.4–32.5% for VBT, with absolute between-method differences < 3 percentage points across variables. Descriptive statistics and statistical analyses for all variables are provided in Table 1. Figure 3 illustrates the 95% confidence ellipses for CoP for both groups.
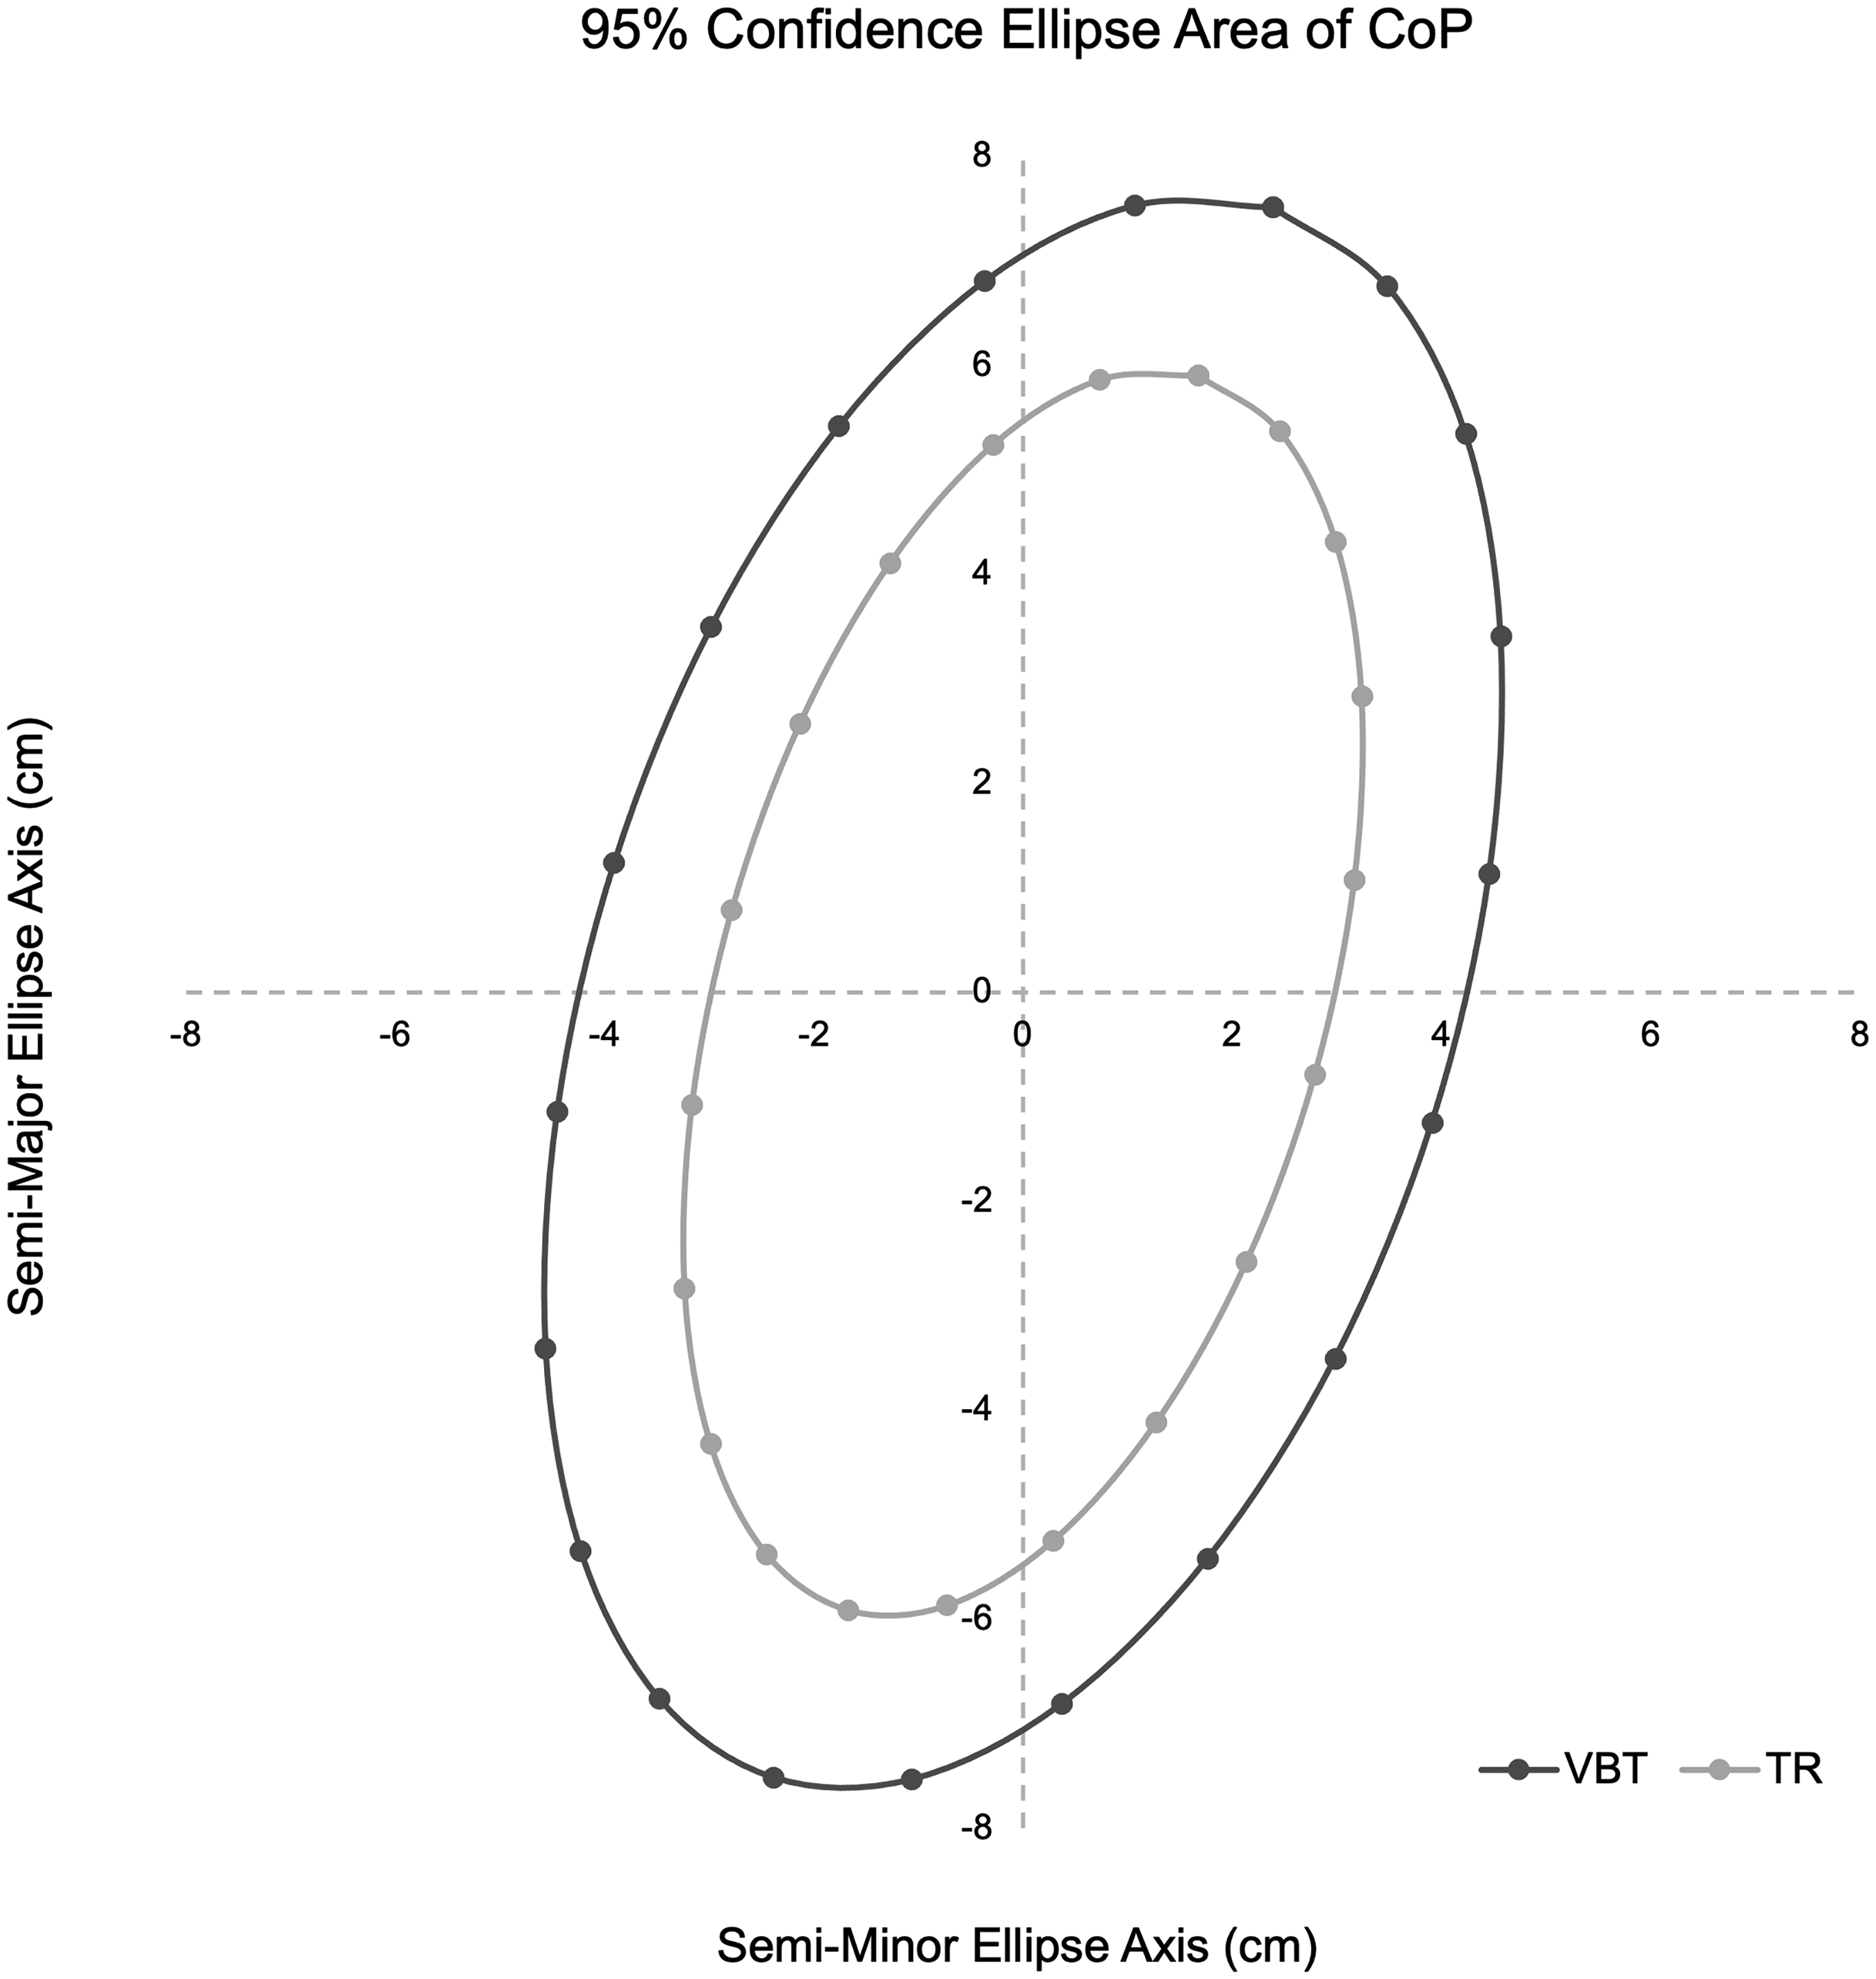
95% confidence ellipses of the CoP during squats. Note. Confidence ellipses of CoP during the concentric phase of the squat during VBT and TR methods. The semi-major axis is oriented along the antero-posterior axis and the semi-minor axis along the medio-lateral axis. VBT produced a significantly larger ellipse area compared with TR (p < 0.001).
Differences in peak relative joint angles, trunk inclination, barbell velocity, and CoP between VBT and TR methods.
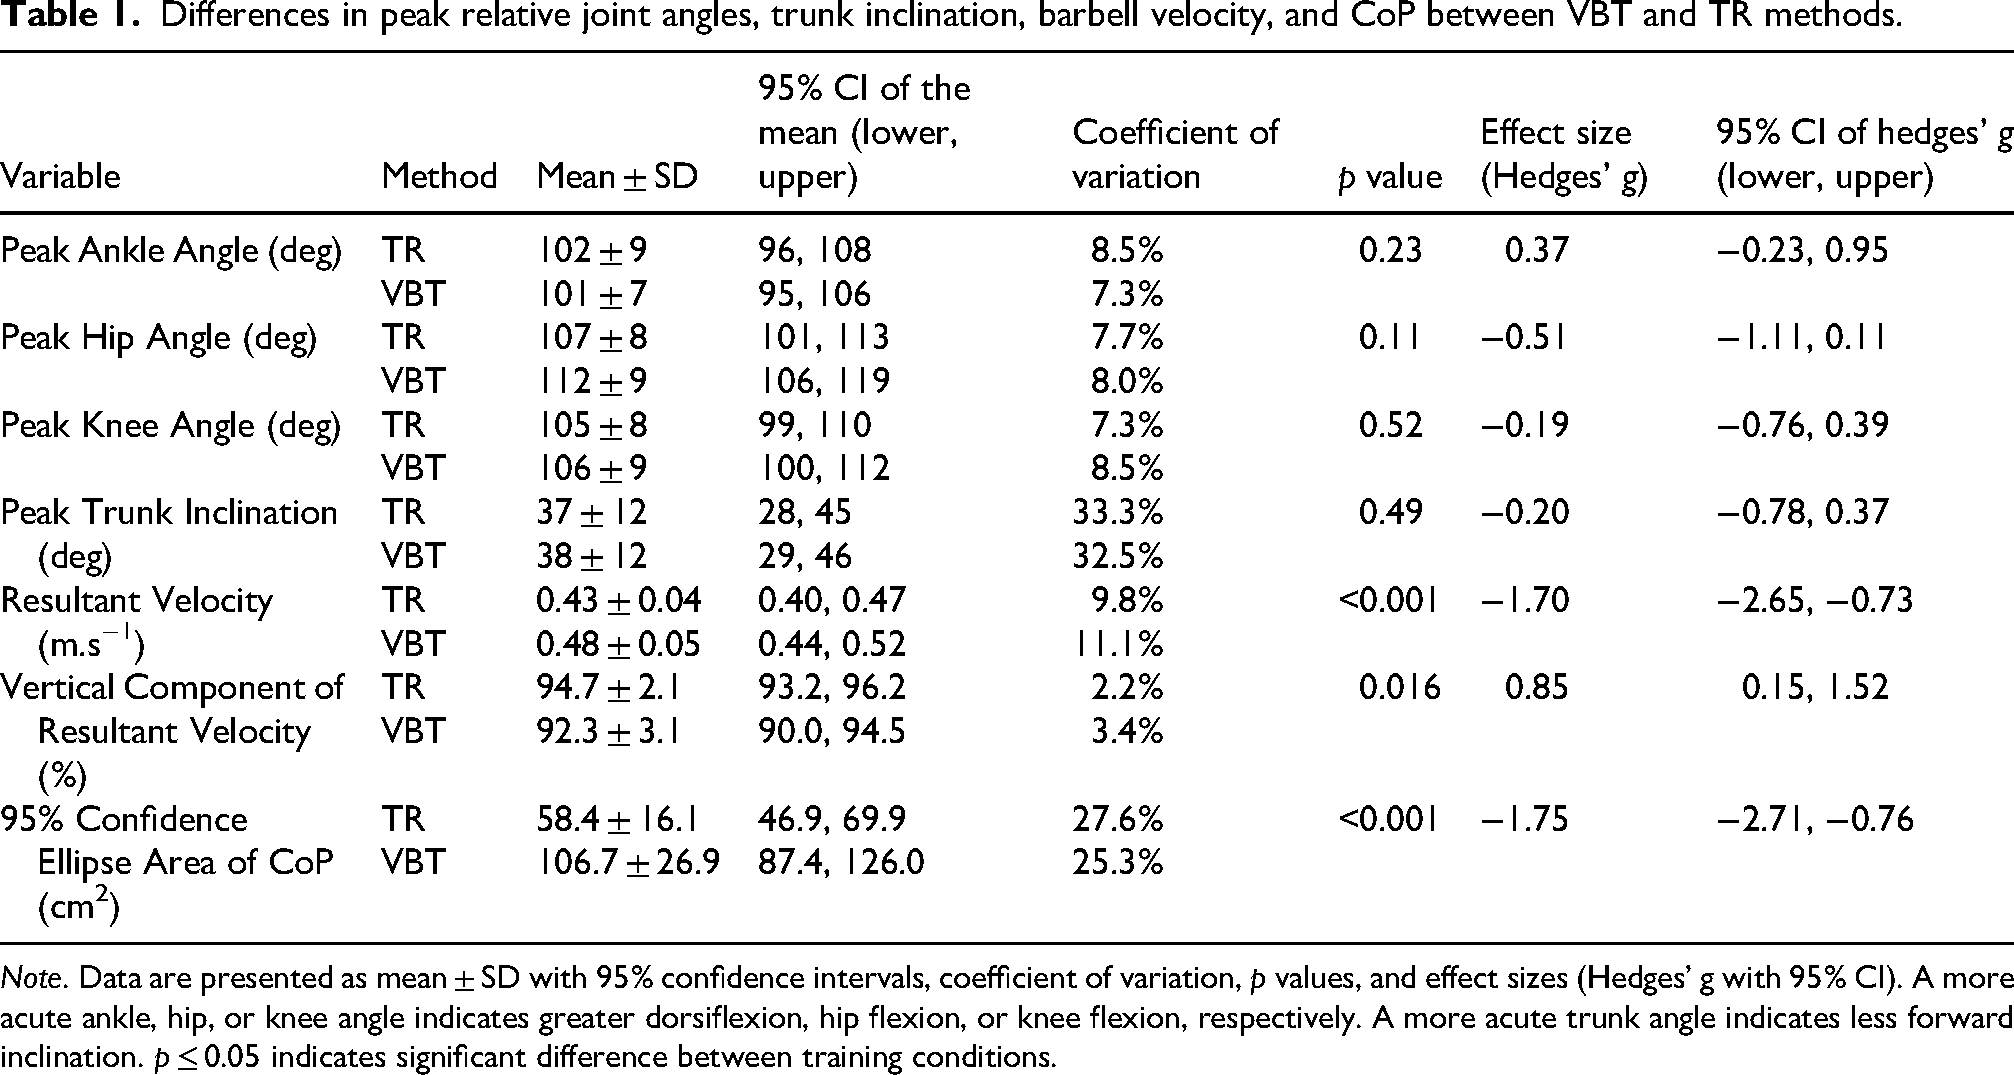
Note. Data are presented as mean ± SD with 95% confidence intervals, coefficient of variation, p values, and effect sizes (Hedges’ g with 95% CI). A more acute ankle, hip, or knee angle indicates greater dorsiflexion, hip flexion, or knee flexion, respectively. A more acute trunk angle indicates less forward inclination. p ≤ 0.05 indicates significant difference between training conditions.
Discussion
The aim of this study was to compare exercise technique during free-weight barbell back squats using VBT and TR methods. It was hypothesised that VBT would significantly impact squat technique variables and lead to greater movement variability compared to TR methods. There are several key findings from the study. First, VBT methods did not significantly impact peak joint angles or trunk inclination relative to TR methods, and variability between methods was minor. Although effect sizes indicated small to moderate differences in peak joint angles and trunk inclination between methods, the practical significance of these differences is likely trivial.
For example, the most notable difference in peak angles between training methods was seen at the hip, with hip flexion being lesser during VBT (p = 0.11, Hedges’ g = −0.51). Although the effect size is moderate, the actual mean difference in peak hip flexion between VBT and TR was approximately 5 degrees, which is relatively small in the context of the squat movement, and unlikely to have meaningful practical implications. Direct comparisons of VBT and TR on squat technique are limited; however, studies examining different squat speeds report negligible impacts on joint kinematics, 39 aligning with the present findings. Similarly, even when more substantial factors such as squat variations 40 or different footwear 41 are examined, differences in peak angles are typically less than 10 degrees at the hip and less than 5 degrees at the knee, ankle, and trunk. Taken together, these findings suggest that the small differences in joint kinematics observed between TR and VBT in the present study likely fall within the normal range of technical variation expected during squats and are unlikely to be of practical importance.
The study's other key findings pertain to barbell velocity and CoP. As anticipated, due to the emphasis on maximal concentric effort, mean resultant velocity was greater during VBT. However, only 92.3% of resultant velocity during VBT was directed vertically, compared with 94.7% during TR. This was accompanied by a markedly larger 95% confidence ellipse area of CoP – nearly double that observed in TR – suggesting greater instability and shifts in the centre of mass during the concentric phase. Together, these findings suggest that VBT promotes faster concentric movement, but with less vertically directed velocity and greater instability.
While VBT promoted higher bar velocities, the accompanying increase in instability may limit the extent to which maximal movement intent translates into maximal force production. Prior research demonstrates that unstable conditions can reduce maximal force production. 42 Accordingly, although VBT emphasises maximal concentric intent, excessive instability could constrain its potential benefits for force production during free-weight movements. Additionally, the implications of CoP perturbations and velocity in relation to injury risk are noteworthy. Variations in CoP during squat exercises can alter joint moments,43,44 which may in turn increase shearing forces and elevate injury risk. 45 Furthermore, performing squats at higher speeds independently increases both shear and compressive forces. 45 While these factors do not necessarily make VBT high-risk, given that the absolute risk of injury in resistance training is relatively low, 46 they remain important considerations for athletes and practitioners, particularly where injury management is a concern.
To date, little direct research has examined the effects of VBT on free-weight squatting technique, so these findings help to address an important gap in the literature. This is particularly relevant given that most prior VBT research has focused on acute performance outcomes rather than movement characteristics, and has frequently been conducted using Smith-machines, where constrained bar paths limit insights into free-weight technique. Nonetheless, several limitations should be acknowledged. First, participants were instructed only to perform the concentric phase of the squat with maximal intent. In practice, coaches would typically provide additional cues and adapt their instructions to manage concerns about technique or safety. Second, although familiarisation sessions were provided, participants had no prior experience with VBT. With prolonged exposure, athletes may adopt movement strategies that mitigate potential negative impacts of VBT on free-weight exercise technique. Third, while this study inferred possible implications for joint kinetics and injury risk, direct investigation is needed to validate these assumptions. Fourth, intensity was fixed at 80% of 1RM. It is possible that the influence of VBT on technique could vary at different loading intensities. Future research should address these issues across diverse populations and exercise variations.
Conclusion
This study addresses a little-researched aspect of VBT: how providing velocity feedback after each repetition and emphasising maximal concentric effort influence free-weight barbell back squat technique. The findings indicate that VBT did not significantly alter joint or trunk kinematics; differences suggested by effect sizes were small and unlikely to be practically meaningful. VBT did, however, result in greater mean resultant velocity of the barbell compared with TR, accompanied by a lower proportion of vertically directed velocity and markedly larger CoP perturbations. These outcomes suggest that while VBT can increase barbell velocity, it leads to decreased stability. Accordingly, strength and conditioning coaches should monitor technique closely and consider athlete experience, training goals, and injury risk when implementing VBT methods using free weights.
From these findings, the following recommendations can be made for applying VBT in practice:
Footnotes
Acknowledgements
The authors thank the participants for their time and effort in contributing to this study.
Ethical considerations
This investigation was approved by the Research Ethics Committee of The University of New England (approval number: HE22-085).
Consent to participate
All participants completed a pre-exercise screening and provided written informed consent to participate in the research.
Funding
The authors received no financial support for the research, authorship, and/or publication of this article.
Declaration of conflicting interests
The authors declared no potential conflicts of interest with respect to the research, authorship, and/or publication of this article.
Data availability
Data used within the study is available upon reasonable request from the corresponding author.