
Abstract
Sports schools provide an environment that foster both academic and sporting excellence in youth athletes, yet physical performance during adolescence is strongly influenced by biological growth and maturation. High intensity actions such as sprinting, jumping and changing direction are important in many sports, particularly team sports, but how these characteristics develop across the school year remains unclear, especially in mixed-sex populations. This study explores the seasonal variations in physical performance across an academic year within a sports school, accounting for biological maturation status and sex. A total of 337 different student athletes between the ages 9–19 years (14.10 years ± 1.93) completed anthropometrics assessments, maturity estimations (percentage predicted adult height) and performance testing (20 m sprint, countermovement jump, Pro Agility and 30-15 IFT) at up to ten testing dates across four year (2021–2024). Performance increased with both chronological age and biological maturity in both sexes. In males, sprint, agility, and jump performance increased progressively across age groups, while females demonstrated significantly lower performance at U12 compared to all other age groups yet few differences after that except in 20 m sprint. Females saw maturational differences between pre- and post-PHV in all tests. A significant interaction between test date and maturity was evident in males for CMJ and VO2max yet only a small effect size was evidenced. These findings highlight the importance of tracking sex specific and maturity related changes across the academic year to appropriately support training prescription, particularly in female athletes who may require more targeted developmental opportunities.
Introduction
A pronounced global growth in the participation of youth athletes on the world stage has occurred 1 and many children and adolescents now aspire to reach the elite levels.2,3 Sports schools create an environment to develop both sporting and academic excellence. However, the dual pressures of combining both sport and academics, termed a dual career, is associated with challenges such as high workloads, 4 a lack of rest and recovery 5 and subsequent feelings of fatigue. Due to stress’ multifaceted nature, increased psycho-emotional factors, such as academic stress, can compound the physical stress brought about by training. 6 This can lead to student-athletes showing lower levels of readiness, reduced physical performance and increased injury risk. 6 A better understanding of the annual changes in physical performance characteristics and the factors which influence this could help practitioners periodise training.
Sports demand repeated bouts of effort at various levels of intensity7–9 through general and specific movement skills.7–9 These underlying physical characteristics have been shown to differentiate between elite and sub-elite athletes.10–25 Crucially, high intensity actions such as jumping, accelerating and change of direction have been shown as determinants of success in games, 26 with straight-line sprinting being the most frequent action in goal situations within soccer. 27 Several studies have utilised a prospective study design, tracking youth athletes into adolescence, for one12,23,28–31 or several age groups.13,32,33 However, whilst prospective, these studies do not provide insight into the yearly differences in patterns of physical development over longer durations. 11 Saward et al. 11 longitudinally tracked academy footballers and found future professional players maintained faster 20-m sprints and a steadier annual improvement, whilst non-professionals’ rate of improvement gradually declined with age. This underscores the importance of monitoring the development of physical characteristics to ensure physical development is sustained throughout adolescence, a critical factor in preparing athletes for senior-level demands. 34
A large proportion of research on youth physical development has focused on the identification of talent within age-grouped analysis whilst overlooking factors such as biological maturation, despite its influence on athletic development.35–38 Tingelstad et al. 34 found only 31% of studies accounted for the biological maturation of their participants. For example, Thompson et al. 39 highlighted significant improvements in sports school students’ strength and speed across the academic year, yet lacked information regarding the influence of maturation on physical performance during that time. Inter-individual variations in the timing and tempo of growth and maturation can lead to youth players of the same chronological age being as much as six years more biologically mature. 40 Early maturing individuals often outperform peers in strength, power and speed tasks, 41 increasing their chances of selection and access to better coaching 42 and, introducing a selection bias. Moreover, the adolescent growth spurt, especially around the time of peak height velocity, brings a relatively higher risk of sports injuries in youth athletes due to rapid physical changes such as increased limb length, muscle mass and force production capabilities. 43 Sex specific differences in the effects of biological maturation are also evident with males seeing a large increase in circulating testosterone whilst females see greater oestrogen levels. 44 This leads to a divergence in body composition, and subsequent performance, due to the greater muscle mass developed in males whilst females see a relatively larger rise in fat mass. 45 A recent systematic review reported that many existing studies have relied exclusively on male athlete samples (85%; n = 151), with only a small proportion focusing on female participants (8%; n = 14) (34). Therefore, tracking biological maturation is vital for safe, effective and continued youth athlete development helping to inform periodisation for both sexes.
This study explores the variations in physical performance across the academic year within a sports school setting, concomitantly accounting for biological maturation status and sex. Specifically, the aims were to; [1] explore changes in physical performance characteristics across an academic year; [2] describe the physical performance of male and female athletes aged 10–19 years; and [3] investigate the influence of biological maturity status on these characteristics across a year. A clearer understanding of how physical performance evolves across an academic year, and how age and maturity interact, will support practitioners in more effectively tracking and assessing development relative to athletes’ specific peers.
Methods
Study design
We used a longitudinal descriptive cohort study design to explore the physical performance characteristics of sports school students over a four-year period (2021–2024) using retrospective data collected as part of the operating procedures of the Strength and Conditioning (S&C) team within an independent school in the United Kingdom. Upon joining the schools S&C department, students and their parents or guardians agreed to the collection of data as part of the departments normal operating procedures. Within the schools “Privacy Notice” parents were made aware of the schools need to “share personal information relating to its community of pupils and parents with third parties”. This includes “If the school employs a PhD student whose doctorate analyses school data”. Participants and / or parents could opt out of testing at any time as well as have any data previously collected removed from the study. Ethical approval was approved by the university's ethics committee (ETH2425-0796).
There was a total of 10 tests completed across September, December and March in 2021, 2022 and 2023, with only one testing data in September 2024, creating 10 time points. Testing at each time point took place over two days, with 10 to 14 -year-old and 14 to 18-year-old students participating on separate days. Anthropometric data (height, seated height and weight) were collected the week prior to physical testing. A standardised 5-min warm-up of light aerobic exercise and dynamic stretching were performed before commencing testing. All testing equipment and surfaces were the same throughout all the testing dates, and all testers had been trained and had performed the tests before.
Participants
A total of 337 unique participants (male = 241, female = 97) between the ages of 9–19 years (14.1 years ± 1.9) took part in the study between 2021–2024. Due to the testing being repeated up to ten times per athlete, the data comprised of 897 total performance observations. Therefore, the sample size reflects the total number of participants with participant ID included as a random effect to account for within-subject clustering. The male participants (n = 634) had an average age of 14.2 ± 1.9, years, height 170.4 ± 11.8 cm and body mass 59 ± 13.2 kg. The female participants (n = 263) had a mean age of 13.7 ± 2.0, years, height 161.5 ± 8.1 cm and body mass 52.8 ± 9.5 kg. Participants played in a wide range of competitive levels across multiple sports including tennis, golf, hockey, rugby, netball, cricket and football with most athletes competing in more than one sport, especially those under the age of 16. Within the context of the sports school in question, categorisation by competitive level would see groups be very heterogenous in chronological age, biological maturity and training age. Due to the strong influence these factors have on physical performance during adolescence, further analysis on the influence of competitive level would confound maturity related effects.
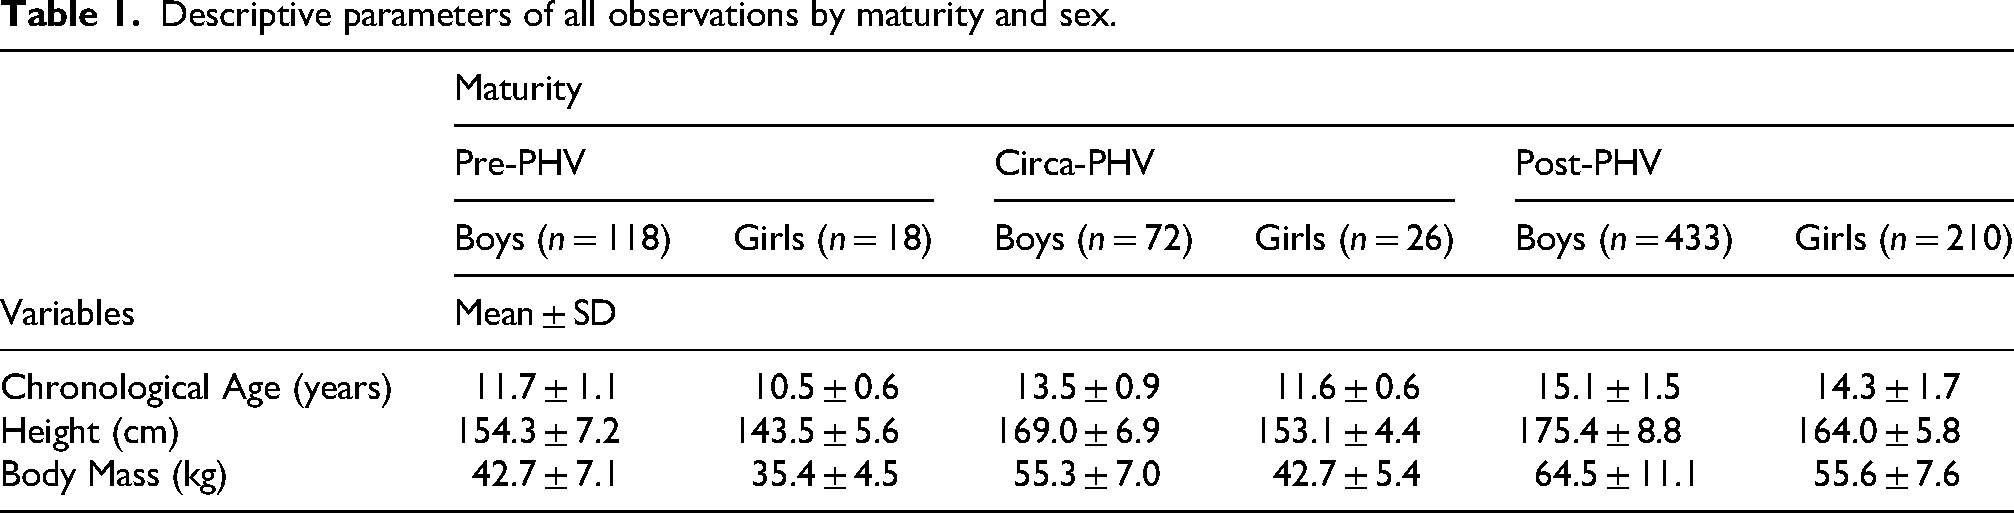
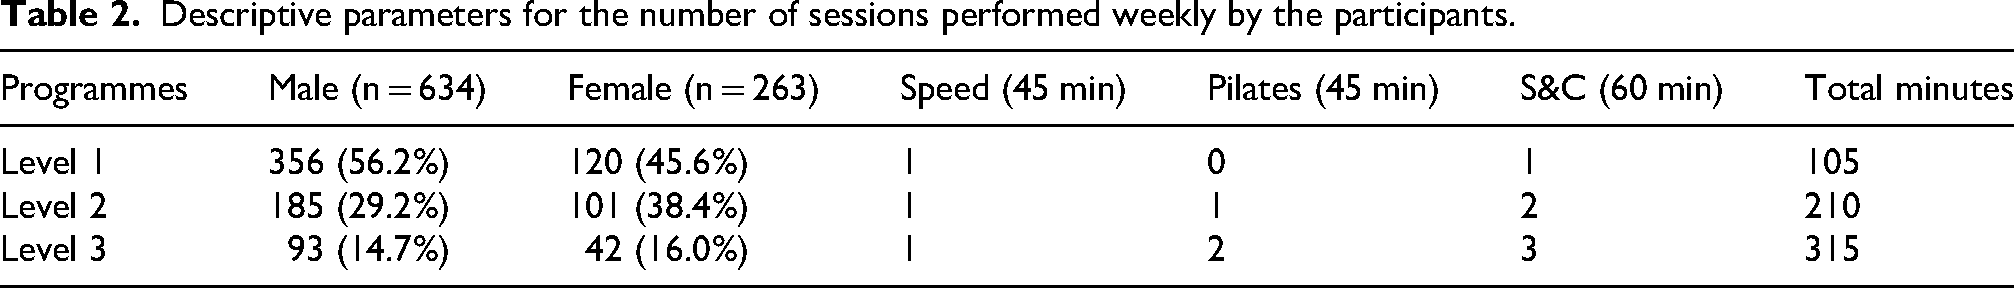
Data points were categorised into three groups according to participants’ biological maturity (Pre-PHV, Circa-PHV and Post -PHV) for both sexes. Mean chronological age, height, and weight for both maturity group and sex, are shown in Table 1, respectively. Given the potential influence of training exposure on physical performance outcomes, a summary table (see Table 2) outlining the frequency of S&C related sessions (weight room, speed or Pilates) completed by participants is included for contextual purposes.
Descriptive parameters of all observations by maturity and sex.
Descriptive parameters for the number of sessions performed weekly by the participants.
Procedures
Anthropometric characteristics were measured with participants barefoot and wearing light sports clothing. Body mass (kg) measurements were performed on an electronic scale, with 0.1 kg accuracy (Seca 876 1321004); height and sitting height measurements were all performed using a stadiometer (Seca 213) with a 0.1 cm accuracy.
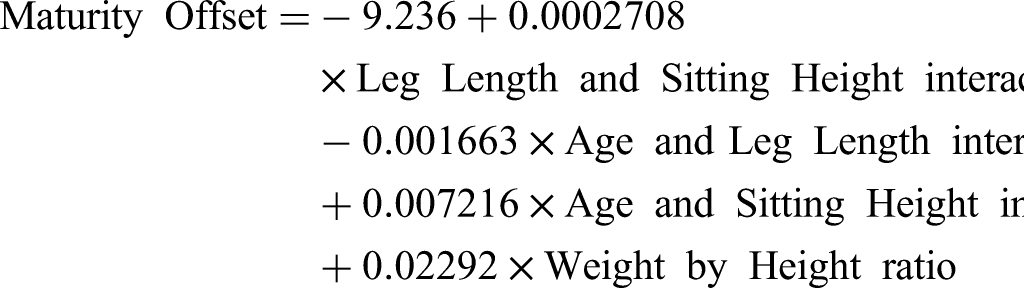
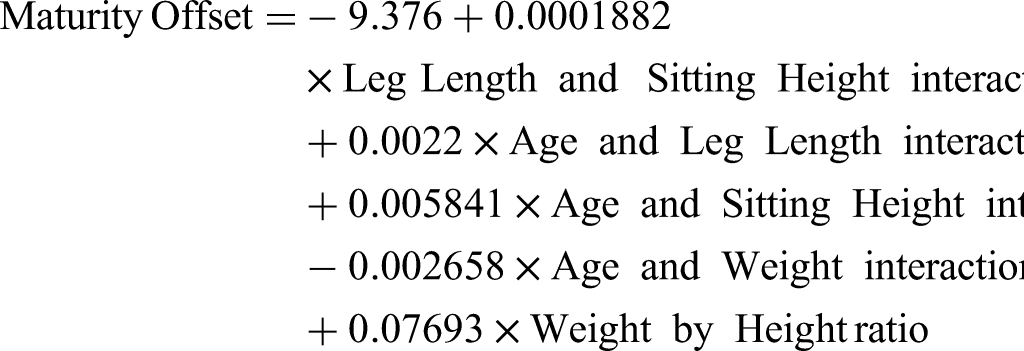
Participants’ maturity was estimated from anthropometric measurements using the method of Mirwald et al. 46 which provides sex-specific equations (equations 1 and 2) to predict the participant's maturity offset. Using the Sherar et al. method, 47 maturity offset was used to calculate the predicted adult height. Conservative guidelines were used in line with previous literature48,49 to classify student-athletes maturation status as being either pre-peak height velocity (PHV) < 85% PAH, circa-PHV 85–96% PAH, or post-PHV >96% PAH. 50
For sprint testing two pairs of Browers timing gates (TCi-System 2022) were set up at the start and finish line, 20 m apart, at a height of 0.6 m. The assessment was initiated by instructing the student to position themselves in a two-point stance with their lead foot 1 m back from the starting gate. The test was performed at their maximal effort three times with a rest period of two minutes between each trial. The fastest time was used for statistical analysis. Brower timing gates have demonstrated sex-specific reliability differences with research finding high intraclass correlation coefficients (ICC) of 0.94 and 0.91, in both males and females respectively. 51 Additionally, minimal detectible difference of 0.124 s (3.3%) for males and 0.154 (4%) for females have been evidenced. 51
The pro agility test is a change of direction assessment in which participants sprint 5 m, perform a 180° turn, sprint 10 m in the opposite direction, perform a second 180° turn, and sprint 5 m back across the start line. Participants began 30 cm behind the start line. Timing commenced at the initiation of the first 5 m sprint and stopped when the athlete crossed the start line after the final 5 m sprint (Figure 1). 52 Participants were given two practice trials to familiarise themselves with the test before having three timed trials with a two-minute rest period between trials. The trial was considered void and was re-attempted if the participant slipped or did not place their foot over the line. The fastest time was used for statistical analysis. Sex-specific differences have been noted within literature when assessing the reliability of the pro-agility COD test, with males seeing ICC of 0.67 whilst females saw a good ICC at 0.82. 53
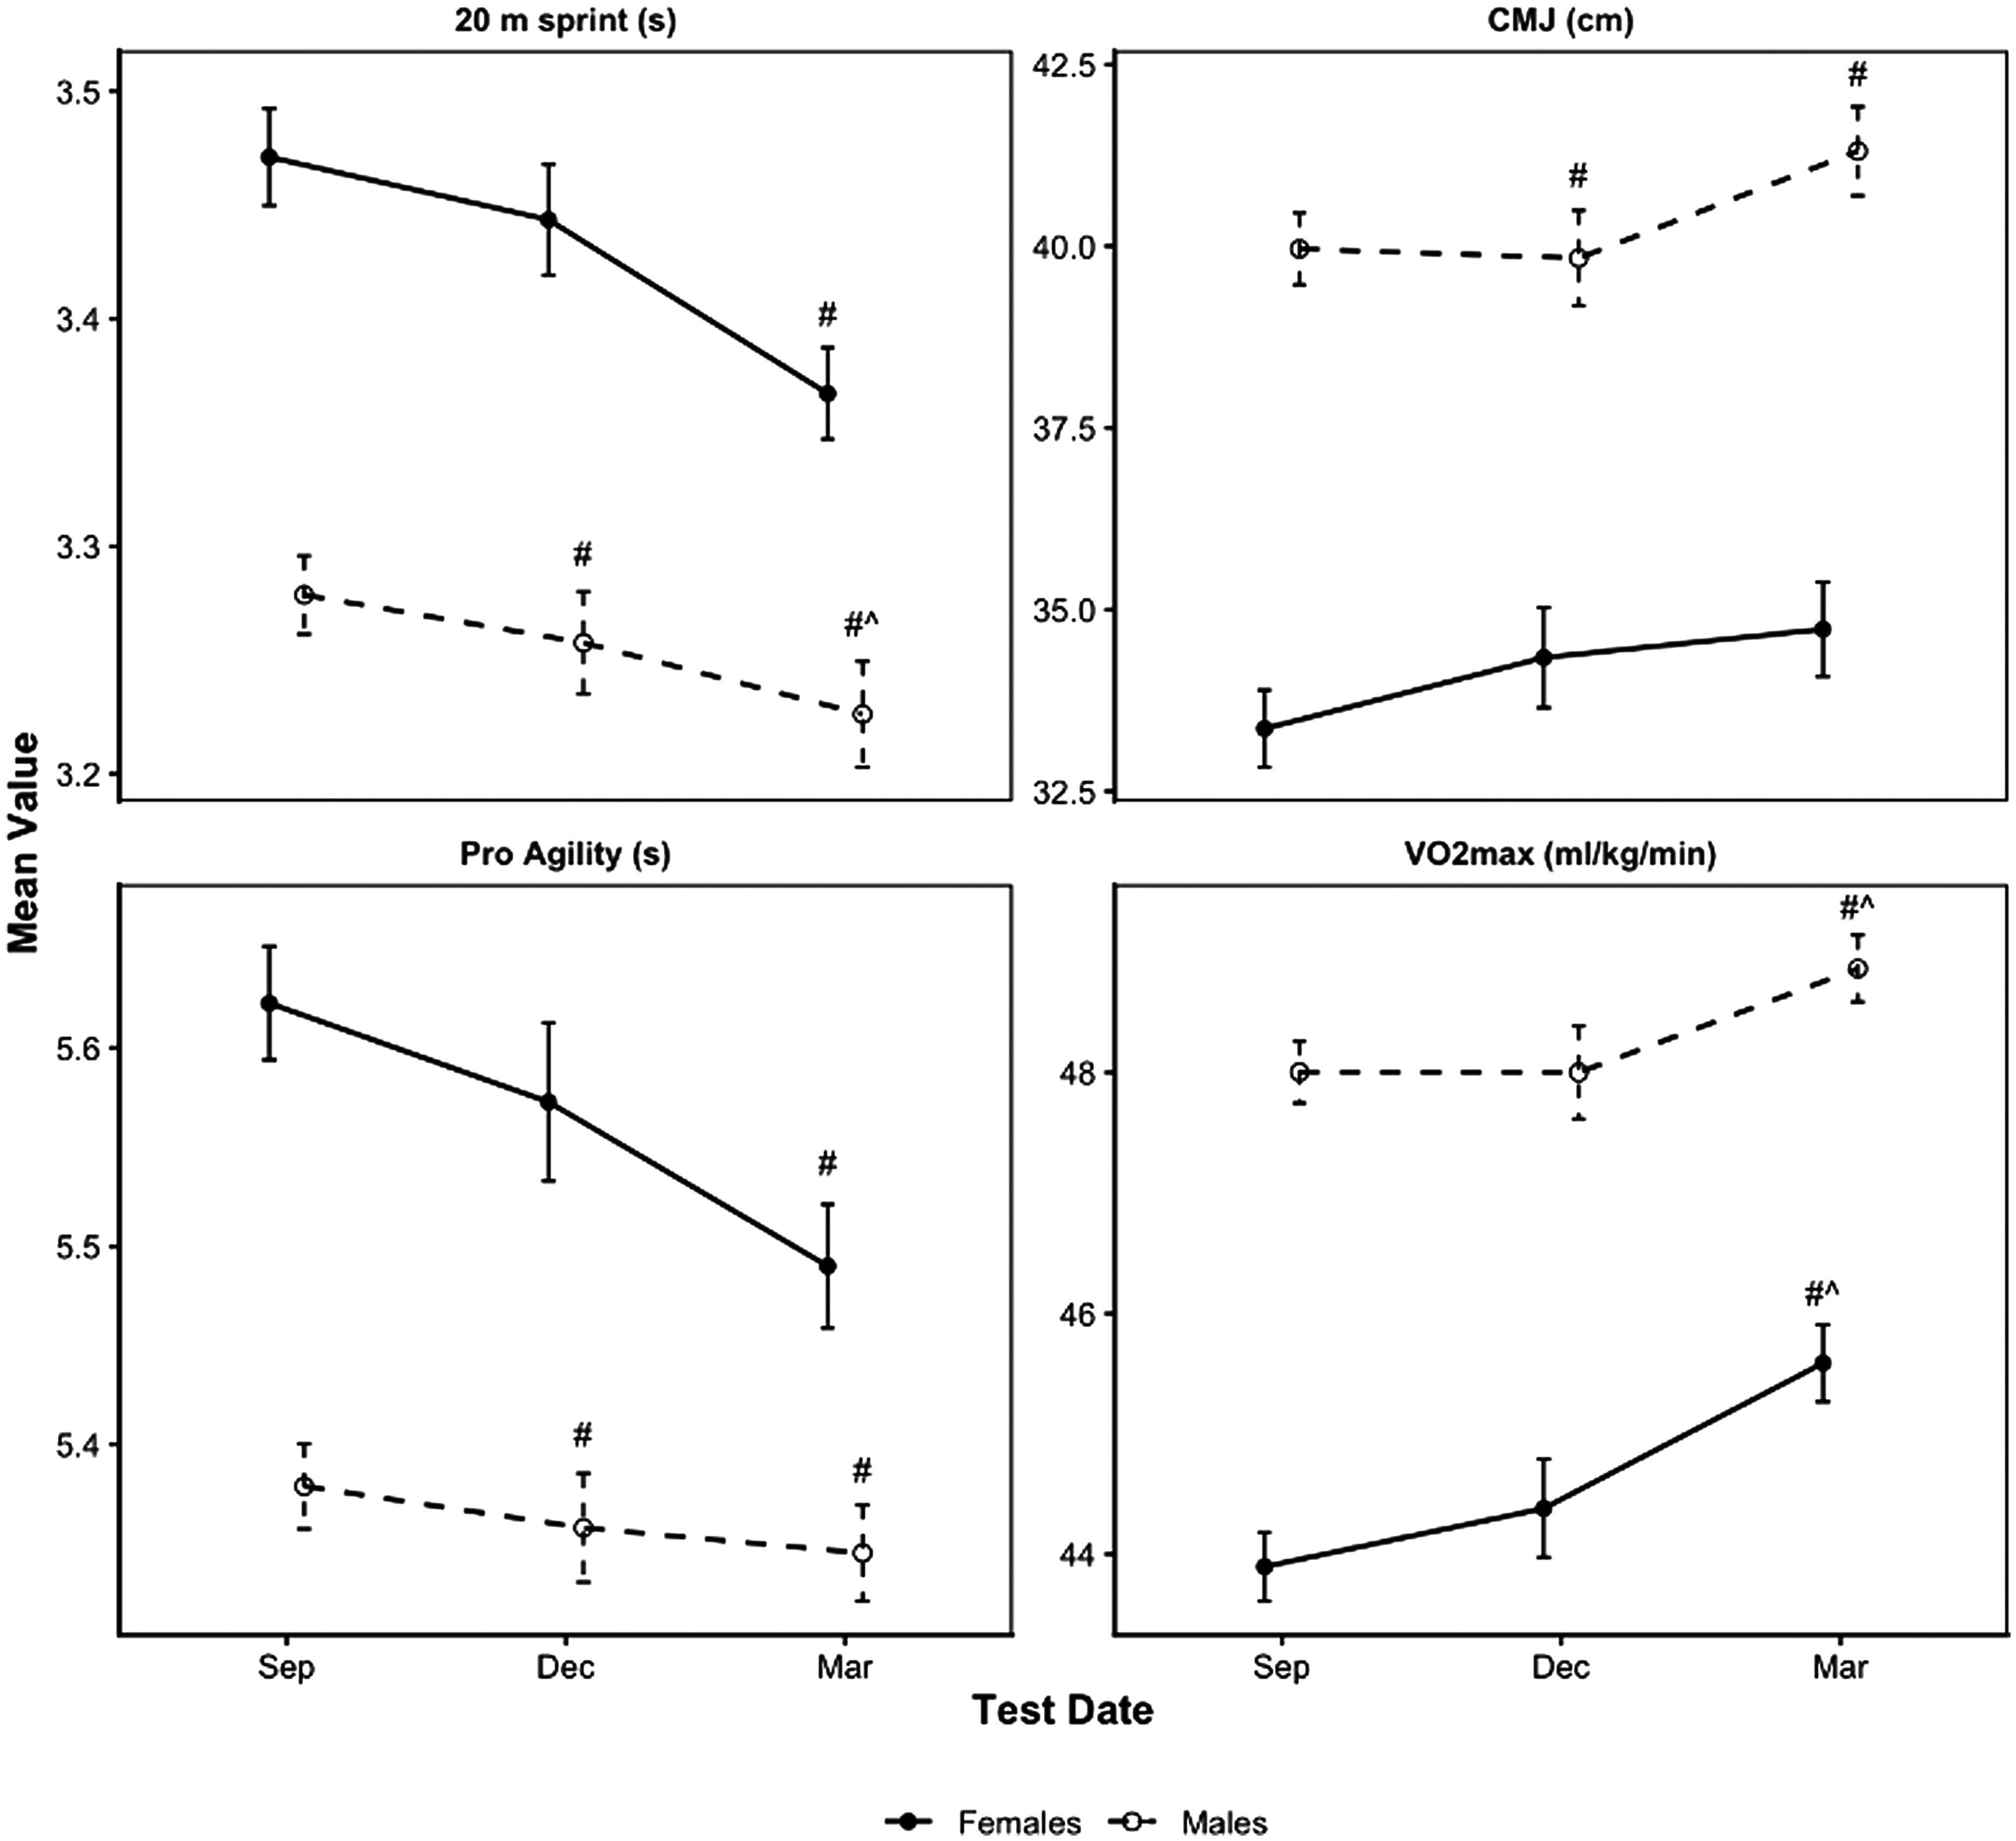
Estimated marginal means of 20 m sprint, pro agility, CMJ and VO2max across testing dates for both males and females.
Countermovement jump (CMJ) testing was performed on a jump mat (Just Jump Systems). Participants stood on the mat with a near-weightless wooden dowel across their shoulders to eliminate the effect of the arm swing. 54 From this position, participants were instructed to perform a rapid countermovement to a self-selected depth, followed by a maximal vertical jump staying straight during the flight phase. Each participant performed two practice jumps to familiarise themselves with the test before three recorded trials were performed with 60 s rest between each jump. Whilst the Just Jump mat system is a reliable method of measuring jump height, it has been found to overestimate the output value. Therefore, a correction equation was used, as suggested by McMahon et al.. 55 The countermovement jump using the just jump system has been shown to demonstrate excellent within-session reliability of jump height measurements with ICC at 0.96. 55
The 30:15 Intermittent Fitness Test was administered to assess the participant's aerobic capacity and intermittent high intensity running performance. 56 The test was administered in an indoor tennis centre across 28 m with cones at 14 m intervals and a 3 m buffer zone at each set of cones. The test involved intervals of 30 s running at progressively increasing speeds, followed by 15 s recovery between efforts. The running speed was controlled by using an audio signal emitted from a pre-recorded soundtrack played through a portable speaker, with no pacer provided. Participants were required to reach the designated cone by the end of the 30 s interval. Testing began at 11 km/h, which increased by 0.5 km/h at the start of each subsequent 30 s stage. Participants continued until they could not maintain the required running speed for two consecutive stages. At that point, they were withdrawn from the test and the final speed of the last completed stage recorded, expressed in km/h.
The final speed of the last completed stage (vIFT) was used to calculate VO2max using the following equation proposed by Buchheit 56 :

Statistical analysis
The data was analysed using R software (The R Project for Statistical Computing 4.4.3, Vienna, Austria). Descriptive data was presented as mean ± SD and grouped by sex and maturity status. For seasonal comparison, performance data reflets the average values recorded in each month (September, December and March) pooled across all testing years. Separate linear mixed-effects models were fitted for each performance outcome (20 m sprint, Pro Agility, CMJ and VO2max) for both males and females. Each model included fixed effects for maturation (Pre-, Circa-, Post-PHV) and testing month, with random intercepts for participants to account for repeated measures. Interaction effect (Maturation×Month) was included to determine whether the influence of maturation on performance development differed across an academic year for either sex. Separate models were conducted to examine the effect of age group on performance characteristics. Estimated marginal means (EMMs) were extracted from the mixed-effects models, and ANOVA output were generated to test the significance of fixed effects. Pairwise comparisons between levels of maturity, age groups and test date were performed using Bonferroni adjusted post hoc tests. Effect sizes for fixed effects were expressed as partial eta squared (ηp2), calculated from the estimated sum of squares. Interpretations followed commonly used thresholds of 0.01 (small), 0.06 (medium) and 0.14 (large). 57 These values were provided to assist readers in evaluating the practical magnitude of changes across time points, alongside statistical significance. In addition to significance testing and effect sizes, percentage changes between variables were calculated using EMMs to provide a clear, practitioner-orientated indication of the direction and magnitude of changes. Using model-estimated means allowed percentage change values to reflect the adjusted differences accounting for maturity status and repeated measures.
Assumptions of the linear mixed effects model were examined prior to interpretation. Residual normality was assessed using visual inspections of histograms and Q-Q plots of the standardised residuals. In all models, residuals were approximately normally distributed, with close alignment to the theoretical reference line in the central portion pf the Q-Q plots and only minor deviations were noted in the tails, which is to be expected in applied datasets. Homoscedasticity and linearity were evaluated using residuals versus fitted plots, which showed no meaningful patterns indicative of violations. These diagnostics support the appropriateness of the linear mixed effects modelling approach for the present data
Results
The descriptive statistics of males’ and females’ performance parameters separated by age group, maturity and test date are shown in Tables 3 and 4, respectively, along with the pairwise comparisons between age groups, maturity and testing date.
Estimated means ± standard deviations of males’ performance metrics grouped by age group, maturity status, and test date averaged across all years. Partial eta squared (ηp2) values represent the magnitude of the main effect of each factor derived from a linear mixed effects model.
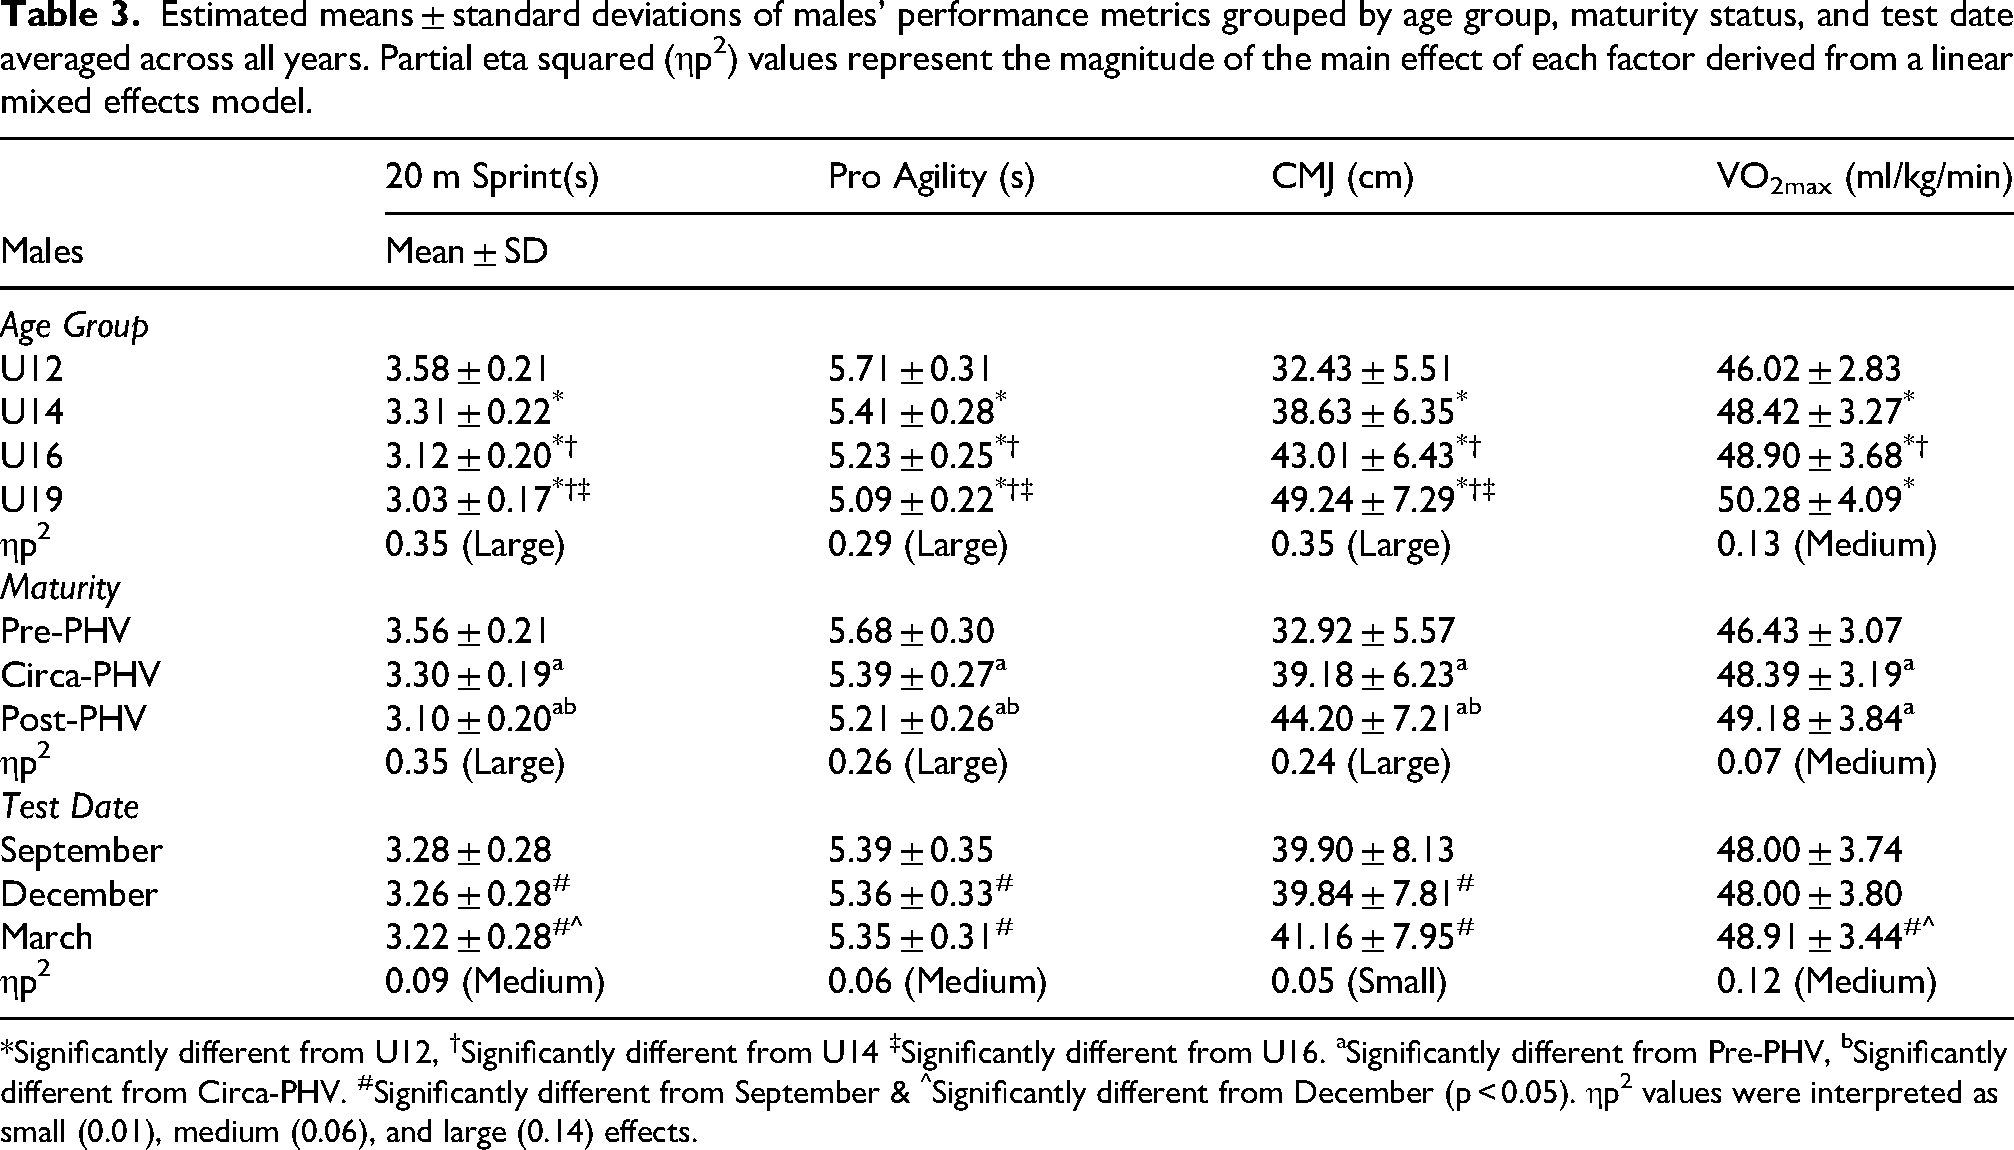
*Significantly different from U12, †Significantly different from U14 ‡Significantly different from U16. aSignificantly different from Pre-PHV, bSignificantly different from Circa-PHV. #Significantly different from September & ^Significantly different from December (p < 0.05). ηp2 values were interpreted as small (0.01), medium (0.06), and large (0.14) effects.
Estimated means ± standard deviations of females’ performance metrics grouped by age group, maturity status, and test date averaged across all years. Partial eta squared (ηp2) values represent the magnitude of the main effect of each factor derived from a linear mixed effects model.
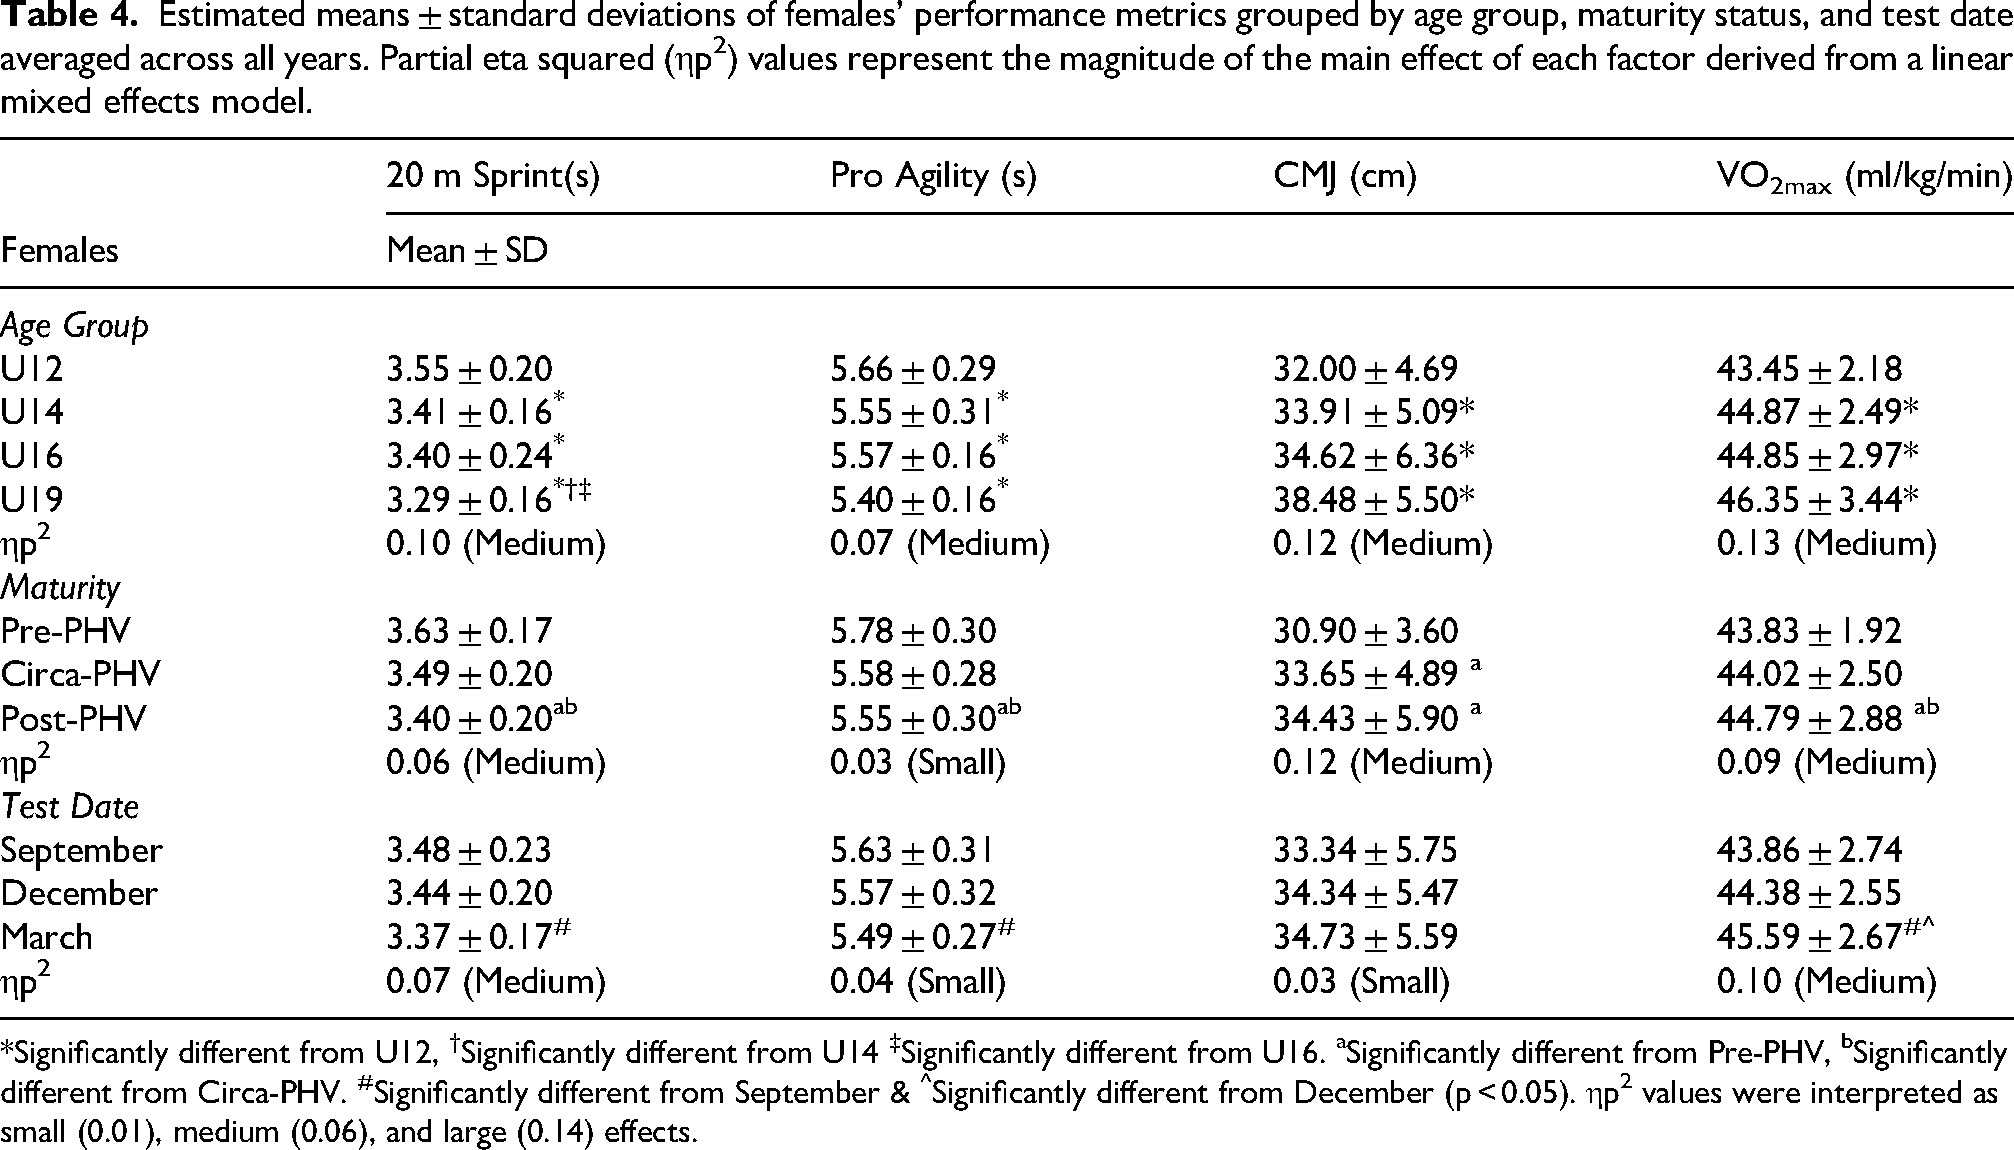
*Significantly different from U12, †Significantly different from U14 ‡Significantly different from U16. aSignificantly different from Pre-PHV, bSignificantly different from Circa-PHV. #Significantly different from September & ^Significantly different from December (p < 0.05). ηp2 values were interpreted as small (0.01), medium (0.06), and large (0.14) effects.
Interaction effect
A significant interaction effect was found between Test Date and Maturity only for male athletes within both the CMJ (F 2417 = 2.54, p < .05, ηp2 = 0.02) and estimated VO2max scores (F 2298 = 3.70, p < .01, ηp2 = 0.05). No other significant interaction effects were found (p > .05).
Age group
A significant main effect of age group was observed for all performance measures in both males and females, including 20 m sprint times (males: F 3512 = 92.03, p < .001, ηp2 = 0.35, females: F 3219 = 8.00, p < .001, ηp2 = 0.10), pro agility (males: F 3544 = 75.68, p < .001, ηp2 = 0.29, females: F 3224 = 5.49, p < .01, ηp2 = 0.07), CMJ (males: F 3552 = 99.51, p < .001, ηp2 = 0.35, females: F 3217 = 10.01, p < .001, ηp2 = 0.12) and VO2max (males: F 3414 = 20.63, p < .001, ηp2 = 0.13, females: F 3168 = 8.10, p < .001, ηp2 = 0.13). Post hoc analysis indicated that, for males, the advancing chronological age led to significant performance improvements in the 20 m sprint, pro agility and CMJ (p < .001). Regarding VO2max, the U14 to U19 significantly outperformed the U12 s, whilst the U16 s outperformed the U14 s. Among females, the U12 group showed significantly lower performance than all other age groups (p < .05) in all performance metrics. The under 19 s performed better than both the U14 s and U16 s in the 20 m sprint for females (p < .05).
Biological maturity stage
The results showed significant differences across maturational stages (Pre-, Circa-, Post-PHV) in both males and females for 20 m sprint times (males: F 2526 = 138.93, p < .001, ηp2 = 0.35, females: F 2203 = 6.34, p < .01, ηp2 = 0.06), pro agility (males: F 2559 = 96.84, p < .001, ηp2 = 0.26, females: F 2214 = 3.75, p < .05, ηp2 = 0.03), CMJ (males: F 2567 = 90.16, p < .001, ηp2 = 0.24, females: F 2195 = 13.61, p < .001, ηp2 = 0.12 and VO2max (males: F 2414 = 16.29, p < .001, ηp2 = 0.07, females: F 2148 = 7.00, p < .005, ηp2 = 0.09). Among males, performance in all metrics improved significantly with advancing maturity (Pre- to Circa- to Post-PHV; p < 0.0001), except for the Circa- to Post-PHV transition in VO2max. In females, performance significantly improved from pre- to post-PHV (p < 0.05) across all metrics, with additional significant gains observed from pre- to circa- PHV in CMJ (p < 0.0001) and from circa- to post-PHV in 20 m sprint and VO2max (p < 0.05).
Test date
Test date had a significant variation effect on 20 m sprint times(males: F 2361 = 16.84, p < .001, ηp2 = 0.09, females: F 2151 = 5.53, p < .01, ηp2 = 0.07), pro agility (males: F 2559 = 96.84, p < .001, ηp2 = 0.06, females: F 2157 = 3.43, p < .05, ηp2 = 0.04), CMJ (males: F 2413 = 11.85, p < .001, ηp2 = 0.05) and estimated VO2max (males: F 2297 = 20.847, p < .001, ηp2 = 0.12, females: F2,116 = 6.68, p < .01, ηp2 = 0.10).
Post-hoc comparisons revealed that males exhibited significant differences in all physical metrics from September to March (p < 0.0001) as shown in Figure 1. Significant differences were observed between September and December in the 20 m sprint, pro agility and CMJ. Further significant differences were seen between December and March in VO2max and 20 m sprint. Fewer significant changes were observed among females across test dates. A significant improvement in performance was seen from September to March (p < 0.05) in 20 m, pro agility and VO2max. The only other significant difference for females was seen between December and March, with VO2max improving (p < 0.05).
Discussion
This study examined the effects of age group, biological maturity status, and test date on the physical performance in student athletes. Performance generally improved with advancing chronological age and maturity, though clear sex-specific trends appeared. Males displayed near-linear gains across age groups, whereas female athletes plateaued between the U14 and U16 categories. These findings underscore the value of routinely assessing biological maturity status and physical performance to ensure accurate peer comparisons and set accurate precise benchmarks, especially for female athletes where inter-individual differences may be less apparent.
Older males significantly outperformed younger groups across all four measures, with age showing a large significant effect sizes in 20 m sprint (ηp2 = 0.35), pro agility (ηp2 = 0.29) and CMJ (ηp2 = 0.35) and the largest differences observed between U12 and U14 levels (5% - 19%). This aligns with previous research identifying 12–14 years as a critical time for the development of speed and power.41,58,59 Pre-PHV sprint improvements have been associated with adaptations such as increased neuromuscular function, recruitment and coordination. 60 Conversely, during mid- to post-PHV sprinting gains have been associated with increases in limb length, muscle cross-sectional area and maximal strength because of the hormonal changes taking place during maturation. 34 Males experience significantly greater increases in circulating testosterone and growth hormone, compared to females, which stimulate protein-synthesis pathways, leading to increased muscle growth, strength and power production. 34 These favourable adaptations support greater force expression during sprinting, jumping and change of direction performance allowing for the expression of more explosive movements. 61 Furthermore, the increase in lower limb length contributes to greater stride lengths, which when applied with an appropriate stride frequency, facilitates higher sprint speeds. 62 Given these insights, practitioners should emphasise neuromuscular coordination in pre-PHV athletes (e.g., varied sprint, plyometric and movement tasks) whilst Post-PHV athletes should progressively target force production, particularly horizontal force, e.g., resisted sprinting. 63
Whilst males showed larger and continually improvements in performance between age groups (1% - 19%), females exhibited notable performance gains between U12 to U14 (2% - 6%), consistent with Malina et al., 41 with minimal improvements between U14-U16 (0% - 2%). Sex-specific hormonal changes likely contribute to these divergent trajectories. 41 Whilst males exhibit greater increases in circulating anabolic hormones than females, 34 females see greater estrogen production during maturation than males. This leads to greater fat mass accumulation 64 from 12 to 15 years and comparably less lean mass development. 34 This shift can reduce relative force production, as evidenced by Emmonds et al. 65 who found a reduction in relative peak isometric force from −0.5 years (27.1 ± 4.2 N/Kg) to +0.5 years from PHV (24.6 ± 3.7 N/Kg) in elite youth female footballers. These findings highlight the importance of sustained engagement in resistance and plyometrics training for both sexes, to support strength, power and lean muscle mass development,66,67 especially when they could be suppressed due to advancing and interacting maturational process such as those described above.
Across maturity groups, males showed greater differences between pre- to post-PHV than females in the CMJ (34% vs 11%), 20 m (13% vs 6%), pro agility (8% vs 4%) and VO2max (6% vs 2%). This likely reflects the greater physical development typically observed in males compared with females during maturation, which is influenced by well-established physiological sex specific differences.34,68 Additionally, higher dropout rates and lower ongoing participation in sport and exercise contexts have been documented in girls relative to boys, 69 which may contribute to reduced gains in physical performance characteristics due to decreased engagement in S&C activities. In contrast, Fernandez-Fernandez et al. 70 reported larger relative gains for both CMJ (males 21% vs. females 57%) and 10 m sprint (5% vs. 18%) in females compared to males. However, the subjects were regionally selected talented badminton players, whereas the participants in the current study came from a wide range of competitive levels. The later maturation of males could potentially lead to pre-PHV males within their study being engaged in formal S&C for a longer duration than the pre-PHV females, accruing a greater training age and potentially seeing diminished improvements through training. 71 Therefore, early S&C engagement for females may help mitigate declines in relative strength seen with maturation and the inclusion of training age within longitudinal tracking would make comparisons between groups more robust.
Maturational differences in sprint speed, change of direction and lower body power improved sequentially in males with large effect sizes seen for 20 m sprint, pro-agility and CMJ. Females on the other hand only showed significant differences between pre- and post-PHV in the 20 m sprint and pro-agility tests with a medium- and small effect for both variables and maturation, respectively. Within the current study, males saw the greatest differences in 20 m sprint between pre-to circa-PHV compared to circa- to post-PHV (−7% vs. −6%) which agrees with Baker et al. 72 (−6% and −5%, respectively). Standing et al. 73 however reported a smaller percentage difference for 20 m sprint between pre- to circa-PHV (−2%) than circa-PHV to post-PHV (−5%) in males, contradictory to our findings. This discrepancy likely reflect variations in sample characteristics and training load differences; student athletes (10–19 years) average higher training loads (1.57–10.23 h/week) 39 versus general youth samples, where large percentages of youth males (49%) and females (56%) fail to meet the recommended 60 min/week of moderate to vigorous activity. 74 These results demonstrate the likely additive effect of maturation and structured training with early and continual engagement for female athletes potentially leading to greater improvements in performance.
A small to medium main effect size was observed across the academic year for both sexes (ηp2 = 0.04–0.12; p < .001) for all physical measures except CMJ in females (ηp2 = 0.03; p = 0.1). Females saw slightly greater improvements than males in 20 m sprint (3% vs 1%), pro agility (3% vs 1%) and VO2max (4% vs. 2%) between September and March. Resistance training has been shown to significantly increase strength in both male and female youth athletes’ beyond natural maturational development 75 with Moran et al.66,67 finding pooled mean estimates of g = 0.98 and 0.54, respectively. Adaptations include both morphological changes such as increased muscle fibre size, changes in myosin heavy chain, greater tendon stiffness, and increases in the angle of muscle pennation angle as well as neural adaptations such as increased motor units recruitment and inter-muscular coordination.76–78 Collectively these changes improve the efficiency of the stretch-shortening cycle, a mechanistic determinant necessary for improving sprinting, change of direction and jumping performance. 79 Plyometric training is another efficacious method of improving jump height through improved efficiency of the stretch shortening cycle with pooled effect sizes of 0.73 in males 79 and 0.57 in females. 80 The larger September – March improvements observed in females may indicate a greater degree of detraining over the 8-week summer holiday throughout July and August. A lack of access to coach-led training provided by schools may further reduce physical activity in females, potentially increasing the detraining of physical qualities. Research by Cerar et al. 81 has shown a significant difference in the number of female students participating in unorganized sport compared to males. This may highlight a greater requirement to provide females with structured, year-round training options to drive adaptations beyond the effects of maturation, preventing detraining out of term time. Unfortunately, due to the constraints of the retrospective data set no conclusions can be made regarding the fluctuations in physical performance between term time and out of term time. Future research should seek to specifically examine these time specific changes within a school more directly.
Although significant interaction effect was observed between test date and maturity for males in both the CMJ (p < .05) and VO2max (p < .01), the group effect sizes were small (ηp2 = 0.02 & 0.05, respectively). Pre-PHV males saw the largest increases in CMJ and VO2max (11% & 4%, respectively) across the academic year relative to circa-PHV (4% & 3%, respectively) and post-PHV groups (2% & 1%, respectively). This suggests that, while the intervention reached statistical significance, the magnitude of the effect was modest, suggesting that the practical differences between maturity groups were limited. However, the larger percentage improvements in the pre-PHV group may still reflect a greater for development. In contrast, Moran et al. 79 reported a large magnitude of change in CMJ height in post-PHV(ES = 1.0) and pre-PHV (ES = 0.9) with a large effect size for change in the circa-PHV group (ES = 0.5). These differences likely reflect methodological factors. Our findings come from a single, context specific sport school cohort tested using consistent protocols whilst Moran et al. 79 aggregated data from multiple studies with different methodologies, populations and intervention protocols. Additionally, Moran et al. 79 used chronological age as a proxy for maturation whereas the current study classified maturation directly via percentage of peak adult height. Within a sport school setting, older athletes may have accumulated greater training experience and may therefore present a lower ceiling of adaptation due to approaching a higher performance ceiling. 71 Consequently, practitioners may need to provide a greater stimulus and training volume to elicit further adaptation in post-PHV athletes.
Conclusion
This study demonstrates that physical performance in student athletes improves with chronological age and maturity, though sex specific patterns exist. Notably, advancements in chronological age and biological maturation in males led to steady gains through adolescents, especially between U12 and U14, whilst females experience most improvements by U14, followed by a plateau. This highlights the maturational differences in hormonal, neuromuscular and morphological adaptations, emphasising the need for age- and sex-specific training protocols. Structured S&C programmes appear to enhance performance, with early and sustained engagement potentially preserving relative strength and power through mid-adolescence. Coaches and practitioners should monitor maturity status, adjusting emphases and volume accordingly, whilst providing a supportive environment. Future research should investigate the fluctuations in performance between in and out of term time and the influence of sex and maturation to refine training strategies within a sport school environment.
Footnotes
Ethical considerations
This study was conducted in accordance with the ethical standards of the University of Essex. Ethical approval was granted by the University of Essex Ethics Sub-Committee 2 (approval number: ETH2425-0796).
Consent to participate
This study used retrospective data provided by a school, with institutional consent obtained from the Head of Co-Curricular Provision, who acted as the organisational gatekeeper. Written permission was granted for the use of pseudonymised data for research purposes. All data were originally collected by the school as part of routine operational practice and in accordance with the school's privacy notice, which informs parents and guardians that anonymised or pseudonymised data may be used for educational research and publication. Parents or guardians retained the right to withdraw consent or request erasure of personal data in line with the school's data protection procedures, and the school retained the right to withdraw participation at any time. Individual informed consent was not required due to the retrospective use of fully pseudonymised data collected as part of routine educational practice.
Consent for publication
Not applicable. This study reports only anonymised or pseudonymised retrospective data collected as part of routine educational practice. No identifiable images, personal details, or individual case information are included in this publication. Institutional permission for the use and publication of the data was granted by the schools Head of Strength and Conditioning department and Head of Co-Curricular acting as gatekeepers.
Declaration of Conflicting Interests
The author(s) declare that there are no conflicts of interest with respect to the research, authorship, and/or publication of this article.
Funding
This research received no external funding.
Data availability
The data supporting the findings of this study are available from the corresponding author (Aiden Griggs, ag17673@essex.ac.uk) upon reasonable request, subject to institutional and ethical restrictions.