
Abstract
Background
Physical fitness tests are crucial for evaluating athletic development and health in children. However, methodological variations in standardized test batteries (e.g., different strength test durations) hinder comparisons between studies. Despite the widespread use, conversion formulas remain largely unexplored. This study aimed to develop conversion formulas between commonly used physical fitness tests in children, focusing on strength, speed, and flexibility.
Methods
A sample of 878 primary schoolchildren (age: 8.3 ± 0.6 years; 49.5% boys) performed ten physical fitness tests, comprising two tests for each of five different abilities: sprint speed (10 m/20 m), flexibility (standing-&-reach/sit-&-reach), throwing ability (with ball/shuttlecock), core strength (30 s/40 s Sit-ups), and upper limb strength (30 s/40 s Push-ups). Regression analyses (curve estimation) with multiple function types were employed to develop conversion formulas between corresponding test variations.
Results
Significant gender differences were found in certain tests (p < 0.001, 0.3 ≤ d ≤ 1.1), resulting in the development of separate calculation formulas for males and females. Linear and quadratic models explained up to 99% of the variance for sprint, Push-up, and Sit-up tests. Quadratic models explained up to 84% of the variance for flexibility tests, whereas linear models explained up to 96% for throwing tests. Adding a constant term improved variance explanation only for flexibility tests.
Discussion
The results indicate that simple extrapolations of sprint and strength values are unsuitable for converting test results. The proposed conversion formulas offer a more nuanced approach, potentially enabling comparisons between different test methods.
Introduction
Physical fitness (PF) is a fundamental determinant of athletic performance and health across the lifespan.1,2 Individuals with high PF are more likely to excel in sports, 3 cope better in daily life, and exhibit reduced susceptibility to illness or injury. 4 Therefore, assessing and comparing PF levels, particularly in children, is crucial for determining appropriate individual support and evaluating developmental processes. 5
In recent years, the number and use of performance tests in childhood have notably increased. Most studies employed a combination of different PF assessments to create comprehensive performance profiles of children. These test batteries typically combine exercises assessing strength, speed, coordination, flexibility, and endurance. 6 Notable test batteries are EuroFit, 7 FitBack, 8 Fitnessgram, 9 and the German Motor Test 6–18. 10 These standardized test batteries enable international comparisons and tracking of developmental trends within different contexts, such as the school system. 11 Gender-specific norm values for various age groups have been published, 12 facilitating the assessment and evaluation of overall athletic performance within an age-appropriate developmental framework. 13
However, despite efforts to establish common reference standards and generalizable measurement methodologies, no universal test instrument has been widely adopted. Consequently, diverse tests are often employed to assess identical performance metrics. 7 Test batteries are often culturally developed 10 or system-dependent. 14 Slight variations, such as differences in sprint distances ranging from 10 m 15 to 20 m, 16 complicate result comparisons. 17 Even minor test design changes affect standard value calculations, limiting many studies to their tests and samples and making comparing PF results difficult. While future studies may address the issue of inconsistent test items by standardizing the test battery, retrospective data pose a significant challenge, especially for specific or small populations (e.g., individuals with injuries or illnesses).
In response to this challenge, various studies have begun comparing the results of similar test tasks. For example, flexibility is often assessed using the Sit & Reach test,18,19 the Back-Saver Sit & Reach, 9 or the Stand & Reach test.10,20 Although studies have demonstrated a positive correlation between the two seated versions in university students21,22 no study has examined a specific conversion factor among the three variations. Furthermore, only one pilot study has investigated the rationale behind the starting positions of these flexibility tests. 23 Similar variations and the absence of conversion factors also appear in sprint assessments. For instance, the time required for Push-up and Sit-up tasks varies across test descriptions.16,24 The GMT measures the number of repetitions in both tests over 40 s, whereas other studies reduce the time to 30 s.11,25 Due to the lack of conversion formulas, practitioners have attempted to extrapolate values using simple linear methods. However, the efficacy of such extrapolations has not been investigated. Particularly in strength endurance, the relative number of repetitions may decrease in longer test duration due to fatigue. Therefore, pure extrapolation may not be valid.
Given the lack of adequate adjustment and conversion options for similar PF test performances, the present study aims to develop conversion formulas for selected test items among children, focusing on strength, speed, and flexibility. The results may provide an opportunity for cross-national comparisons (e.g., with the USA or Europe) regarding performance metrics or other influencing factors on PF.
Methods
Study design
More than 800 primary schoolchildren were tested to create conversion formulas between standard PF tests for young athletes. The test tasks included pairs of widely used performance diagnostics in the areas of speed, upper limb strength, trunk strength, flexibility, and throwing ability (Table 1). Regression analyses (curve estimation) were used to develop suitable conversion formulas between corresponding test variations.
Test items.
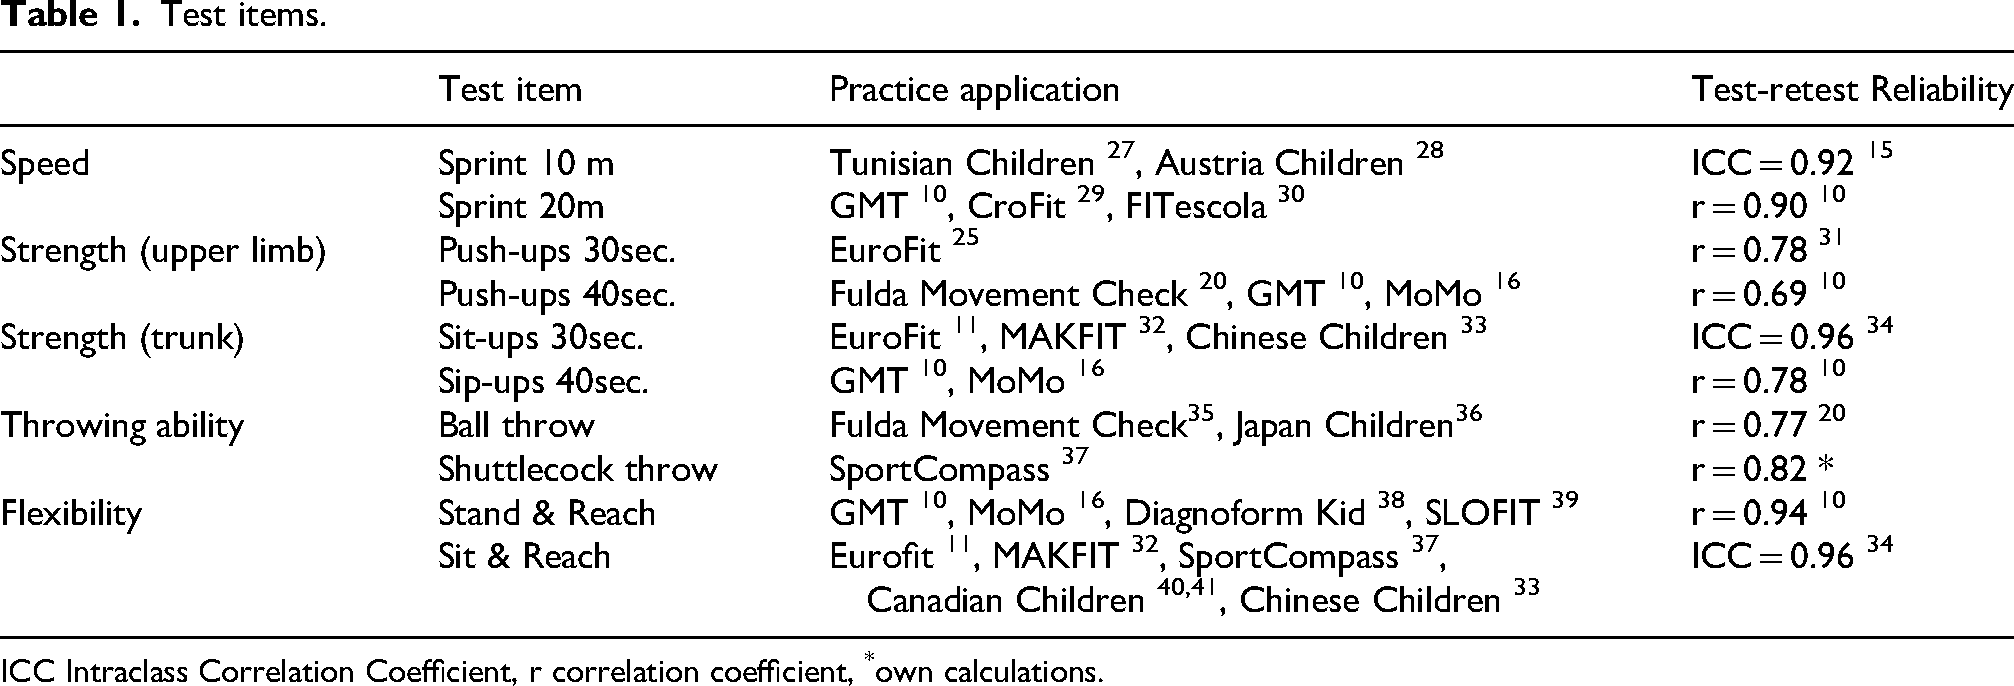
ICC Intraclass Correlation Coefficient, r correlation coefficient, *own calculations.
Participants
The sample consisted of 878 primary schoolchildren from the 2nd grade (8.3 ± 0.6 years, 132.2 ± 6.7 cm, 29.6 ± 6.8 kg; n♂ = 435, n♀ = 443). All participants were tested in 2023 as part of a regional health and talent campaign (Movement Check, Bavaria, Germany; Hohmann et al., 2017). The sample size was estimated based on a priori power analysis (G*Power, version 3.1.9.7; University Kiel, Germany). A minimum number of 327 participants was calculated for an estimated power of 95%, an α-error of 5%, and at least a small effect size of d ≥ 0.2. 26
Measurements
All participants completed ten tests, arranged in five pairs of corresponding tasks assessing the same PF component. The measurements included a 10 m sprint and 20 m sprint, stand-&-reach and sit-&-reach, throwing with 80gr balls and badminton shuttlecocks, Sit-ups for 30 s and 40 s, and Push-ups for 30 s and 40 s. Trained test personnel conducted all tests during regular school hours in a sports hall. A standardized warm-up was performed before the assessment, and all test tasks were conducted and evaluated strictly in accordance with established test manuals.3,10,11
Statistics
Pairwise comparisons were made in all calculations, and missing values were excluded by default. The data fulfilled a normal distribution, which was verified through visual observation and QQ plots for all test variables.
Sex differences in test performance were examined using independent t-tests. Effect sizes were interpreted according to Cohen 26 : d ≥ 0.2 as small, d ≥ 0.5 as medium, and d ≥ 0.8 as large.
For sprint and strength tests, expected values were calculated using linear extrapolation (doubling 10 m sprint times, multiplying 30-s strength scores by 1.33). One sample t-tests compared expected and observed values. If no significant differences emerged, conversion formulas were not calculated.
Correlation analyses were conducted to determine the relationship between the similar test items. Effect sizes were interpreted as small for r ≥ 0.1, moderate for r ≥ 0.3, and large for r ≥ 0.5. 26 Additionally, scatter plots were created.
Finally, regression analyses (curve estimation) were conducted on the paired test variables using IBM SPSS Statistics (Version 27, 2021; Armonk, NY, USA). The regression analyses were performed via the Curve Estimation procedure, testing different function types (linear, quadratic, cubic, logarithmic, and exponential), both with and without constant terms (by selecting or deselecting the “Include constant in equation” option). In each analysis, one test variable (e.g., 20 m sprint) served as the dependent variable, and the corresponding paired test (e.g., 10 m sprint) as the independent variable. Model significance was examined using ANOVA within the curve estimation procedure, and only significant models (p ≤ 0.05) were retained for further interpretation. The function type with the highest explained variance (R²) was selected as the final conversion formula. When significant gender differences in performance were found, separate regression analyses were conducted for boys and girls.
Results
Significant differences between the sexes (Table 2) were found in the tasks related to speed, flexibility, and throwing ability. The effect sizes range from small in sprinting to large in ball throwing. Boys and girls showed no significant differences in performance in the Push-up and Sit-up tests (0.13 ≤ p ≤ 0.38). The comparison of the expected value of 20 m sprinting, Push-ups and Sit-ups for 40 s through classic extrapolation and the observed values in the study show significant differences in all three categories. Except for the sprint item (d = 1.5), the results in the strength tests did not achieve any more relevant effect sizes (d ≤ 0.2).
Descriptive statistics of each test item.
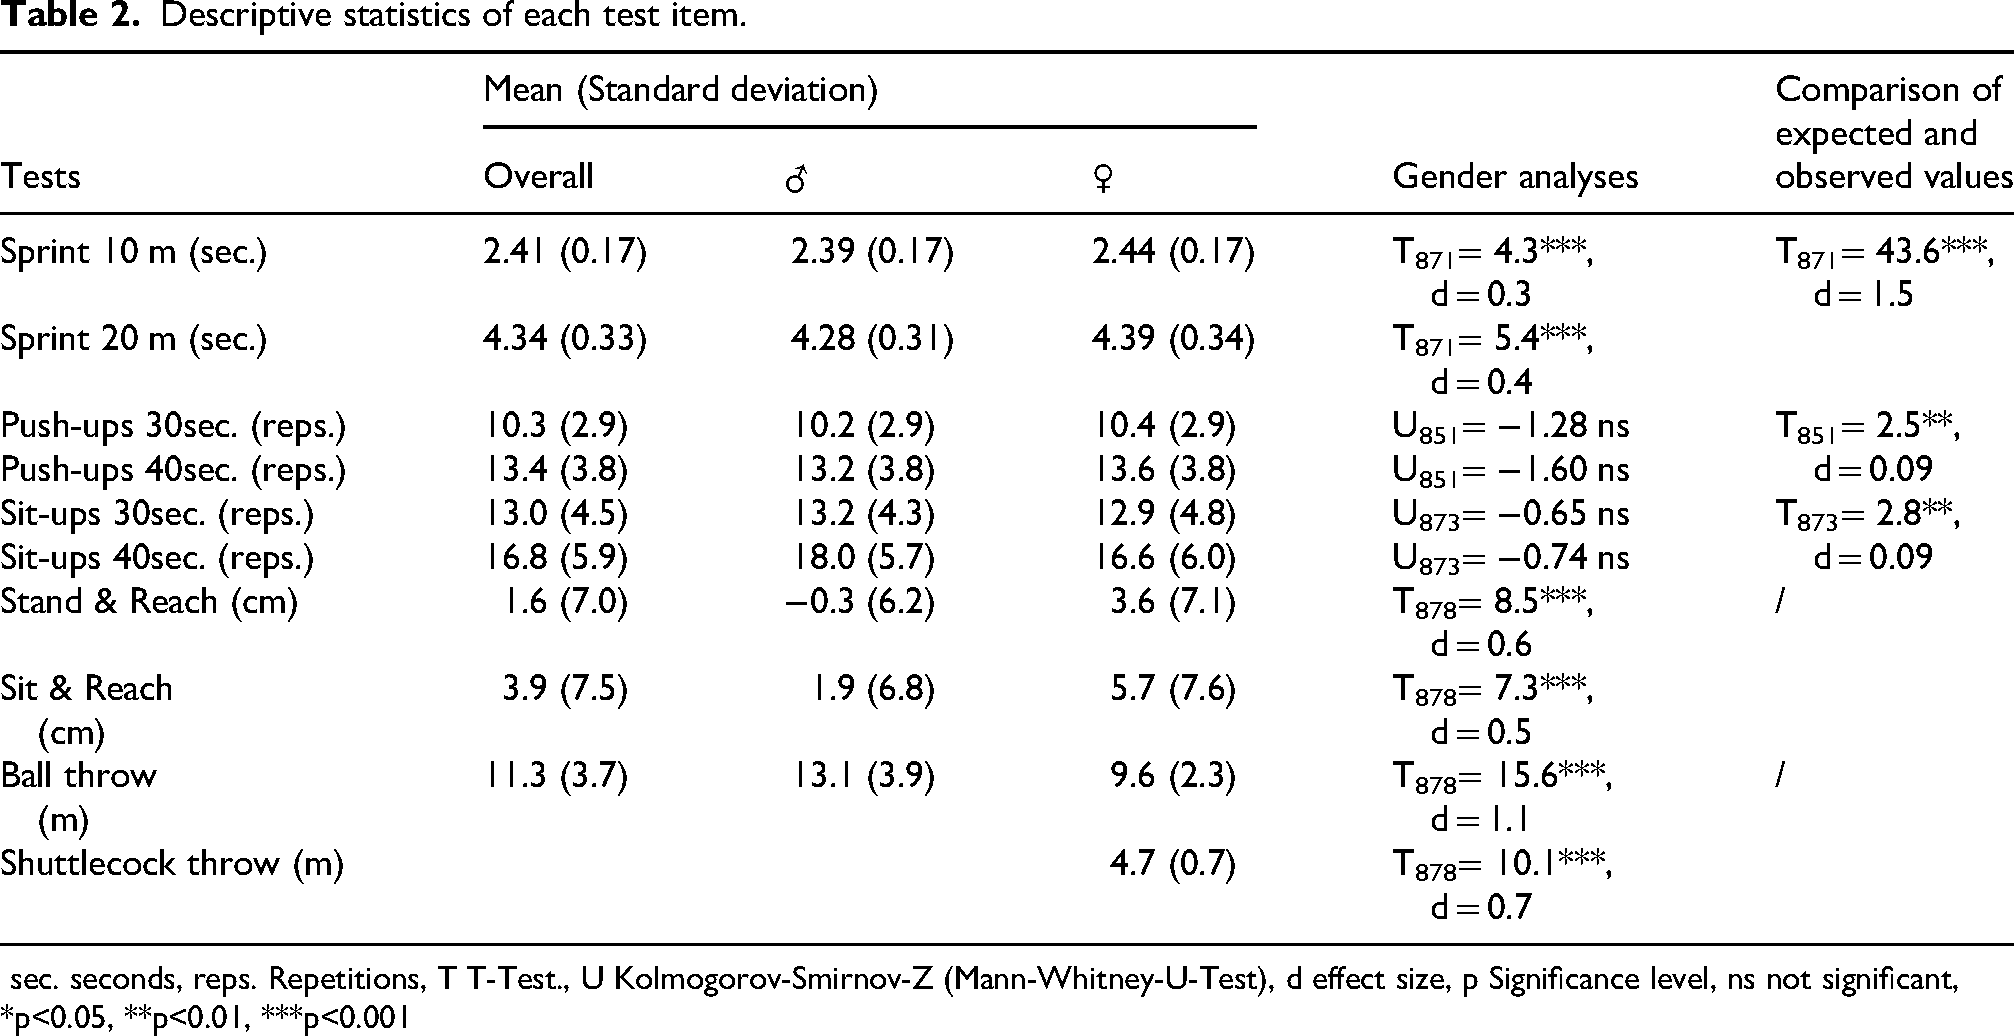
sec. seconds, reps. Repetitions, T T-Test., U Kolmogorov-Smirnov-Z (Mann-Whitney-U-Test), d effect size, p Significance level, ns not significant, *p<0.05, **p<0.01, ***p<0.001
Sprint
The scatter plot (appendix 1) shows the relationship between the two sprint times over the different distances. Due to a high correlation r = 0.93 (p < 0.001, Pearson) between both variables, it can be assumed that a regression analysis will also show a high R2.
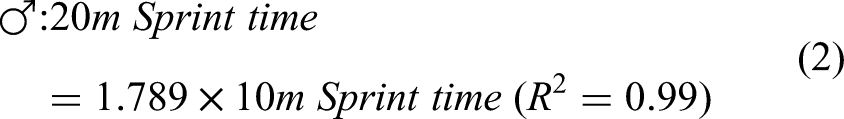
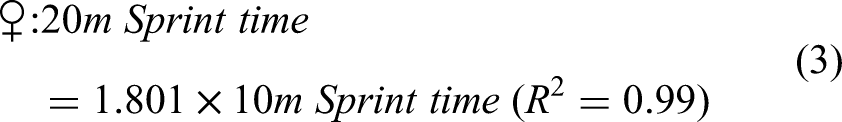
Variance explanation of a linear regression analysis (without constant model term) reaches R2 = 0.99 (p < 0.001; for all analyses regardless of gender). Quadratic and cubic models achieve the same results. Since boys and girls differ significantly in sprinting, the calculation formulas were set up separately for male and female athletes (formulas 1–3; p < 0.001).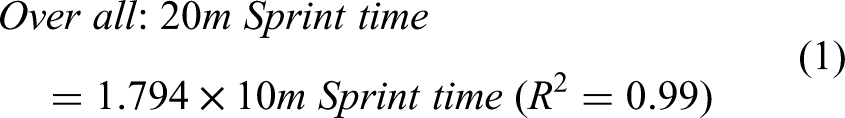
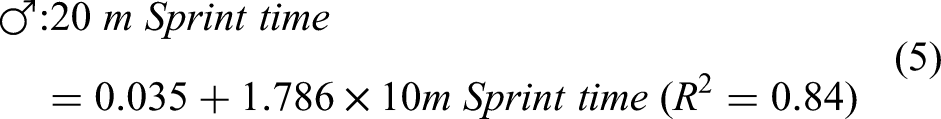
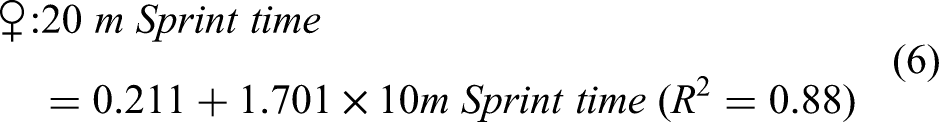
The adjusted conversion formulas with a constant model term can be seen in formulas 4–6 (p < 0.001).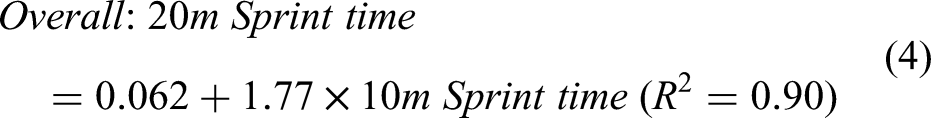
Push-ups
The correlation coefficient of the two tests corresponds to r = 0.96 (p < 0.001). A conversion (p < 0.001) can be calculated according to formulas 7 and 8.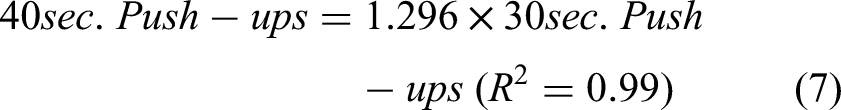
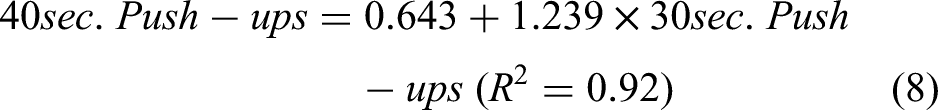
The curve analysis showed that the three types of analysis—linear, quadratic and cubic—do not differ sufficiently from each other and result in the same variance explanation. As zero (0 reps.) is part of the data set, logarithmic and exponential curves had to be omitted from the analyses.
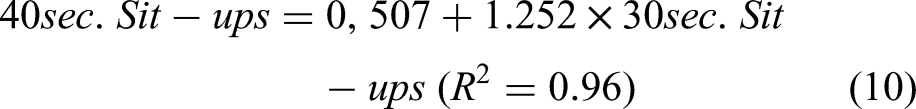
Sit ups
For the two sit-up tasks, the correlation analysis yielded an r of 0.98 (p < 0.001). The curve fitting model achieves a variance explanation exceeding 96% (p < 0.001) across all types of analyses (linear, quadratic, etc.). A linear adjustment (p < 0.001) is provided by the equations 9 and 10.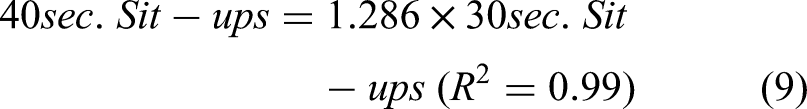
Flexibility
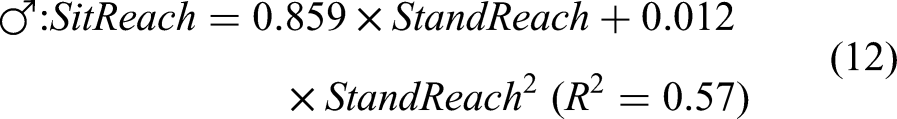
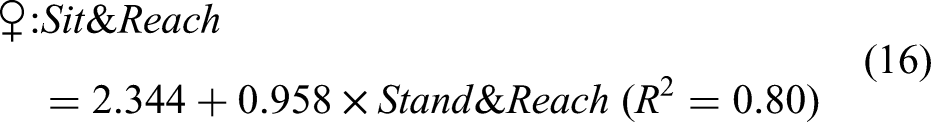
Correlation analyses reveals a significant relationship between the two test tasks (r = 0.86, p < 0.001). The regression analyses achieve a variance explanation ranging from 57% to 84% (p < 0.001, formulas 11–13).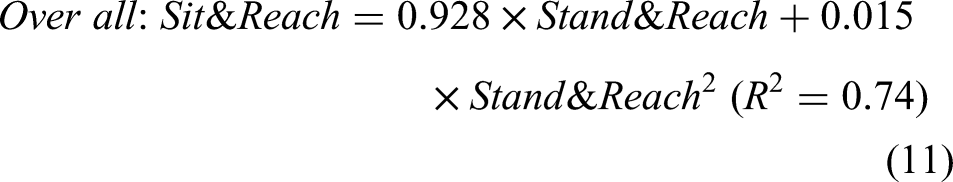

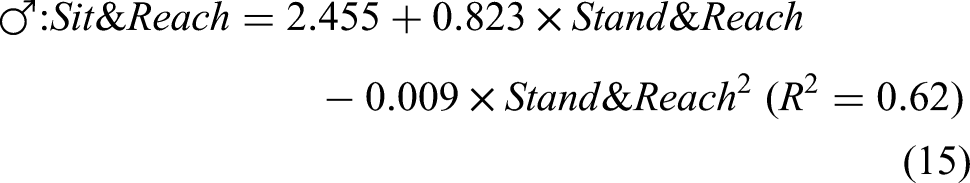
Formulas with a constant term yield similarly R2 values compared to those functions without a constant term (formulas 14–16).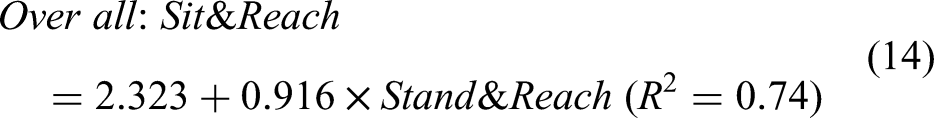
Throwing
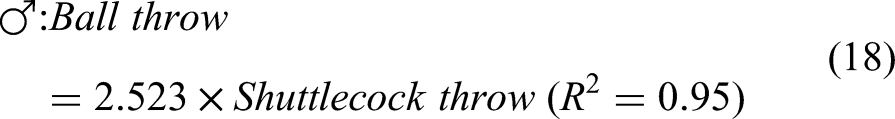
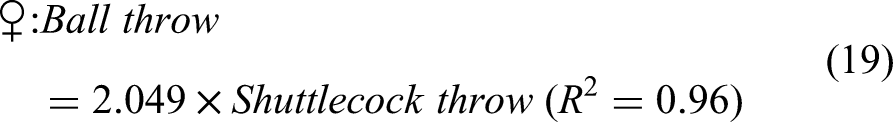
The correlation analysis reveals a significant coefficient of r = 0.67 (p < 0.001). Curve fitting analyses used to calculate ball throw distances based on shuttlecock throw values reveals similar variance qualities for the five types of analysis (linear, quadratic, cubic, logarithmic and exponential). Conversion equations and their explained variances (p < 0.001) are provided in formulas 17–19.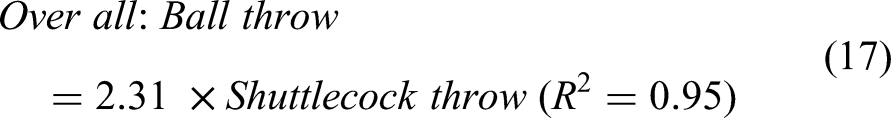
Including a constant term in the conversion formulas leads to lower R2 values (R2 ≤ 0.47, p < 0.001).
Discussion
The findings indicate that simple extrapolation of sprint and strength values is unsuitable for comparing test results, highlighting the necessity for validated conversion formulas. Unlike earlier studies, which primarily concentrated on evaluating the content of the test methods, 23 this study focused on the statistical conversion of test values for similar test tasks. In our study, almost all conversion formulas showed high variance explanations. Therefore, they seem suitable for comparing results from several studies and measuring population differences.
In studies, it is often reported that elementary speed performance in the time range below 10 s involves multiple factors, including reaction speed, movement speed, and frequency. 42 In linear sprint tests up to 40 meters, a distinction is also made between starting ability, acceleration ability and maximum speed. 17 Starting and accelerating abilities dominate at shorter distances, while maximum sprint speed becomes more prominent as the sprint distance increases. These differences appear more pronounced in children than adults, while children reach performance limits earlier than professional athletes who peak at 60 m. 43 It is, therefore, not surprising that expected and observed sprint times differ significantly in our tests. A simple extrapolation seems unsuitable to explain the entirety of the variance. In the present study, boys were faster than girls in the first 10 meters and the second 10 meters. Nevertheless, the age-separated conversion formulas calculated were sufficient to explain the variance. An additional constant term in the conversion did not increase the significance. The conversion formula could be used to compare different populations, for example, Tunisia 27 and Germany. 10
The comparison of the two strength performances over 30 and 40 s revealed significant differences with very small effect sizes. The expected and observed test values differed by only 0.3 repetitions. The slight differences suggest that fatigue in children over 40 s is not yet so pronounced that test performance drops off towards the end of the test. This supports previous findings, 44 which confirmed that the performance loss due to fatigue in dynamic strength exercises is significantly greater in the first 30 s than towards the end of an exercise. However, their study focused on the strength performance of young adults. For children with a good strength-to-load ratio, 20 the performance losses towards the end of the test period could be even lower. The findings suggest that the 30 s execution is preferable to the 40 s execution in tests due to the time saved. Despite the low effect sizes, it may still be beneficial to prefer the adjusted linear, quadratic, and cubic conversion formulas over simple extrapolations. Especially in large samples, significant differences between expected and observed test values could lead to a distortion of the test results. The conversion formulas presented in this study achieved an almost perfect variance resolution, which supports their preferred use. In the present sample, no gender-specific differences were found concerning strength, so gender-independent conversion methods could be used. The results emphasize that minimal differences in the test performance across different studies can limit comparability. Conversion formulas can help enable cross-national comparisons, for example, between Germany, 10 Europe,11,25 or China. 33
Gender-specific analyses in flexibility tests yielded a lower variance explanation of the conversion formulas compared to the other formulas in this study. This may be due to greater variability in test results and fundamental differences in muscular activation between standing and sitting positions - particularly the varying contribution of back versus leg flexibility depending on the position. 23 These differences challenge developing standardized conversion formulas and support previous research questioning the direct comparability of different flexibility tests.45–47 Studies have reported high deviations in the validity of individual tests, particularly regarding their ability to assess lumbar flexibility and moderate validity values for hamstring flexibility with slightly higher values in women.46,47 Additionally, comparing the Sit & Reach and Stand & Reach tests with a passive hamstring flexibility test revealed differences in variance explanation. 45
The high variance explanation in throwing performance conversions suggests strong transferability between ball and shuttlecock throws using curve estimates. This enables comparisons between different protocols, such as SportCompass 37 and Movement Check. 35 At the same time, this raises the question of test efficiency, as the shuttlecock throw achieves lower distances than the long ball throw and would, therefore, require less space.
Including a constant term in most regression equations results in a lower R2. If the constant term is excluded, R2 indicates the proportion of variability in the dependent variable through the origin. Consequently, the origin is always an integral part of the curve equation, potentially distorting the results — similar to the effect of outliers in correlation analyses. The extent of this distortion depends on how far the origin deviates from the overall data distribution. In certain cases, conversion formulas without a constant term may be better suited to explain the total variance than models with a constant term. In all of the tests conducted, except the flexibility test, a (0|0) result is realistic. For example, if a person achieves zero sit-ups in 30 s, this is likely the case over 40 s. Consequently, it is unsurprising that the conversion formulas without a constant term showed better variance explanations in these tests. In the flexibility tests, it could be assumed that gravitational influence may provide a slight advantage in Stand & Reach compared to Sit & Reach, suggesting that a constant term might improve the conversion formulas. However, this assumption could not be confirmed in the findings.
Limitations
While the study provides meaningful conversion formulas, certain limitations must be mentioned. First, we limited our approach to linear and curve-specific estimates, omitting more complex models to develop conversion formulas. This decision was driven by the need for intuitive and practical applicability, as complex methods can hinder usability in real-world contexts. The chosen non-complex approach ensures the easy implementation of conversion formulas and is more accessible to practitioners. Nevertheless, future studies should explore integrating more sophisticated models 35 to enhance the precision of conversion formulas. Second, our analysis was developed and validated using a single dataset, which may limit the generalizability of the results. The validation should be conducted on additional datasets from different laboratories, under varied conditions, and using different samples. This would help ensure the robustness of the formulas across diverse settings. Thirdly, the present study only considers children aged 8 years. Therefore, it can be speculated that for other age groups, the conversion formulas we calculated could lose their high variance explanation. However, due to the predominantly linear development of performance between the ages of 6 and 10 years, 16 it can be assumed that the formulas can be applied to the entire period of early childhood. Larger leaps in performance occur primarily with the onset of puberty. For this reason, future studies should create new formulas from the age of 11 years onwards. However, it remains questionable whether this is even possible due to the differences between biological and calendar age.
Conclusion
The choice of conversion methodology plays a crucial role in determining the accuracy of performance estimations. Curve estimates and gender-specific approaches are promising alternatives to simple extrapolations. However, their robustness needs to be tested in diverse populations, across different training levels, and in various competitive settings. Developing conversion formulas offers a pragmatic approach to addressing regional disparities and facilitating meaningful comparisons between studies and populations. While the findings represent a valuable step in this direction, they also underscore the need for further research and enhanced international collaboration.
Supplemental Material
sj-docx-1-spo-10.1177_17479541251407995 - Supplemental material for How to compare physical fitness when different tests are performed. A cross-sectional study on conversion formulas of common test items for young children
Supplemental material, sj-docx-1-spo-10.1177_17479541251407995 for How to compare physical fitness when different tests are performed. A cross-sectional study on conversion formulas of common test items for young children by Tizian Schuck and Maximilian Siener in International Journal of Sports Science & Coaching
Footnotes
Ethical considerations
The study was approved by the Institutional Review Board of the University of Bayreuth (O 1305/1 – GB) and conducted in accordance with the Declaration of Helsinki. All data were handled confidentially.
Consent to participate
The participants’ parents were informed about the study, including its procedures and purpose, through a detailed information letter. Written informed consent was obtained from all individuals involved in the study. Participation was voluntary.
Funding
The authors received no financial support for the research, authorship, and/or publication of this article.
Declaration of conflicting interests
The authors declared no potential conflicts of interest with respect to the research, authorship, and/or publication of this article.
Data available
The data that support the findings of this study are available from the corresponding author upon reasonable request.
Supplemental material
Supplemental material for this article is available online.
References
Supplementary Material
Please find the following supplemental material available below.
For Open Access articles published under a Creative Commons License, all supplemental material carries the same license as the article it is associated with.
For non-Open Access articles published, all supplemental material carries a non-exclusive license, and permission requests for re-use of supplemental material or any part of supplemental material shall be sent directly to the copyright owner as specified in the copyright notice associated with the article.