
Abstract
Although variations in task demands are common in athletic performance training, we have little insight into when they elicit enhancing or diminishing effects. Models that can comprehensively capture the diverse influence of changes in task demands are largely lacking. Hormesis – the fundamental dose-response model found in toxicology and medicine – suggests that small doses of task demands can enhance performance, while large doses that go beyond tolerance thresholds are detrimental. This principle may be leveraged to identify personalized doses of task demands for performance enhancement. Therefore, the aim of this study was to test whether hormesis can be scaled to athletic performance. To do so, we created dose-response profiles of shooting accuracy in field hockey in response to five different exercises with varying doses of task demands for 32 female players. The results reveal a nonlinear change pattern of performance in response to increasing task demands in line with hormesis. Additionally, a significant proportion of players (62.50%) demonstrate shooting accuracy improvements of more than 30% relative to the lowest dose. Exploratory inspections of the dose-response profiles indicate that challenge points can be identified that are assumed to trigger optimal learning. Thus, hormesis appears to be a valuable concept for sports, which can help coaches to develop individualized training programs.
To enhance their athletes’ performance, coaches typically design challenging training exercises with varied task demands which foster adaptational processes. In training sciences, the notion of disrupting the homeostasis to induce performance enhancement has been well-established for many decades and holds across various disciplines.1,2 For example, in physiology, the concept of supercompensation implies that for athletes to build strength or endurance, a specific training load needs to be applied to cause an initial disruption, which is followed by a functional improvement over time during a recovery period.3,4 Similar principles – applying changing task demands like dribbling around an opponent instead of cones to induce challenge for an athlete and stimulate growth – have also existed for decades in motor development for performance enhancement. 5 That is, athletes can be exposed to challenging environments to foster adaptations in the motor pattern and ultimately enhance performance.6,7 However, while for many physiological processes the specific amount of load is well-established, such precise doses are not well defined for task demands used in motor performance. To illustrate, to build muscle mass, precise weight-repetition-ratios have been identified to induce small tears in the muscular structures which lead to the desired overcompensation response (i.e., muscle hypertrophy)8,9 without inducing injuries. Thus, to optimize training designs, a comprehensive assessment of task demands, which are typically induced during performance training, and the athletes’ responses needs to be implemented. Hereby, a cautionary note needs to be addressed. Similar to physiological processes and the risk of injury, increasing task demands to enhance motor performance may also have negative consequences. Thus, the arbitrary alteration of task demands cannot be justified without proper assessments.10,11 Therefore, an open question remains how task demands that are typically integrated into training programs for performance enhancement can trigger both facilitative as well as detrimental effects.
To address this problem, scholars have recently suggested that inspirations from toxicology can be taken to derive a comprehensive framework with specific methodological guidelines.5,12–17 Specifically, in the field of toxicology, so-called dose-response profiles are used to systematically assess how gradual increases of the dose of a potentially toxic agent influences an organism's functioning. 18 Interestingly, the concept of dose-dependent effects is also not foreign to sports science. As discussed above, training load is tailored to an athlete based on the idea of exposing athletes to doses that enhance the desired capacities while minimizing risk of injuries due to too high intensities. 3 Despite this general consensus, the changing effects of systematically varied doses are only rarely assessed, particularly on the behavioral level for perceptual-motor tasks. Even the famous inverted-U of the Yerkes-Dodson law 19 has never been applied to humans with such systematic variations. Instead, researchers heavily rely on 2 × 2 designs distinguishing high and low doses, rather than investigating systematic variations of task demands. 5 Moreover, approaches that attempt to capture the effects of systematically varied doses like load-and-recovery dynamics are often simply assessed on group-level aggregates which distorts the dose-response relations on the individual-level. 4 Understanding the precise dose-response dynamics between different variables for each individual athlete may help sports coaches to develop truly personalized training routines that can stimulate performance enhancement while avoiding potential negative effects.5,15 The aim of this article is thus to scale these dose-response profiles to the behavioral level of sports performance to identify the specific dynamics of systematically varied task demands – specifically for shooting accuracy in field hockey.
Developing and interpreting dose-response profiles
Traditionally, dose-response profiles have been used to examine the effects of a potentially harmful substance on an organism's functioning.20,21 For example, the effect of a medication is tested by systematically exposing the organism to gradually increasing doses to identify both the minimally necessary dose to stimulate beneficial responses as well as the upper threshold of safe exposure before potentially toxic effects emerge. 21 Thus, to create such profiles, two parameters must be defined. First, the dose should represent a variable that is assumed to induce functional changes in the organism and can be systematically altered. Second, the corresponding response variable should reflect a relevant and measurable adaptation of the organism (for a detailed tutorial using the example of crew rowing, see Hill et al. 13 ). Mapping the response variable as a function of the increasing dose depicts the dose-response dynamics, which may be inspected to determine the range of the doses that are beneficial, harmful, or trigger no notable reaction in the organism. 14
The most commonly occurring dose-response dynamics have been categorized into three different models (see Figure 1), which carry practical implications regarding whether and how a systematically varied dose can enhance an organism's functioning. First, the linear non-threshold model describes a linear association between the dose and the response variable.18,22 This means that with increasing doses, the response of the organism declines proportionally. In terms of sports, with performance outcomes as response variable, this implies that one's potential can only be reached when task demands are virtually absent. For example, a field hockey player would only shoot as accurately as they can when they can approach the goal freely without a goalkeeper present. An extension of this model is the so-called threshold model.18,22 This model suggests that the potential negative impact of a stressor can be resisted, and the functional state maintained until the dose of the task demands exceeds a limit, after which a linear decline occurs. Following the example of field hockey, a player would be able to perform to their potential and shoot as accurately as they can at a range of different doses before the decline starts to emerge. Note, however, that resistance to a stressor is not equivalent to growing from a stressor.23,24 To account for the potential of growth, the hormesis model argues that initially increasing doses may improve performance before the pattern is reversed and increasing doses cause detrimental effects.20,21,25 That is, a field hockey player may shoot most accurately when they experience small doses of task demands, but the performance declines when the dose becomes too large. This small-dose stimulation and high-dose inhibition yields a bi-phasic pattern that follows a J-shaped curve – often also referred to as an inverted-U). 21 Because functional improvements in response to small doses seem to be the rule, rather than the exception across different organisms and their subsystems, hormesis has even been labeled the “fundamental dose-response model”.22,25
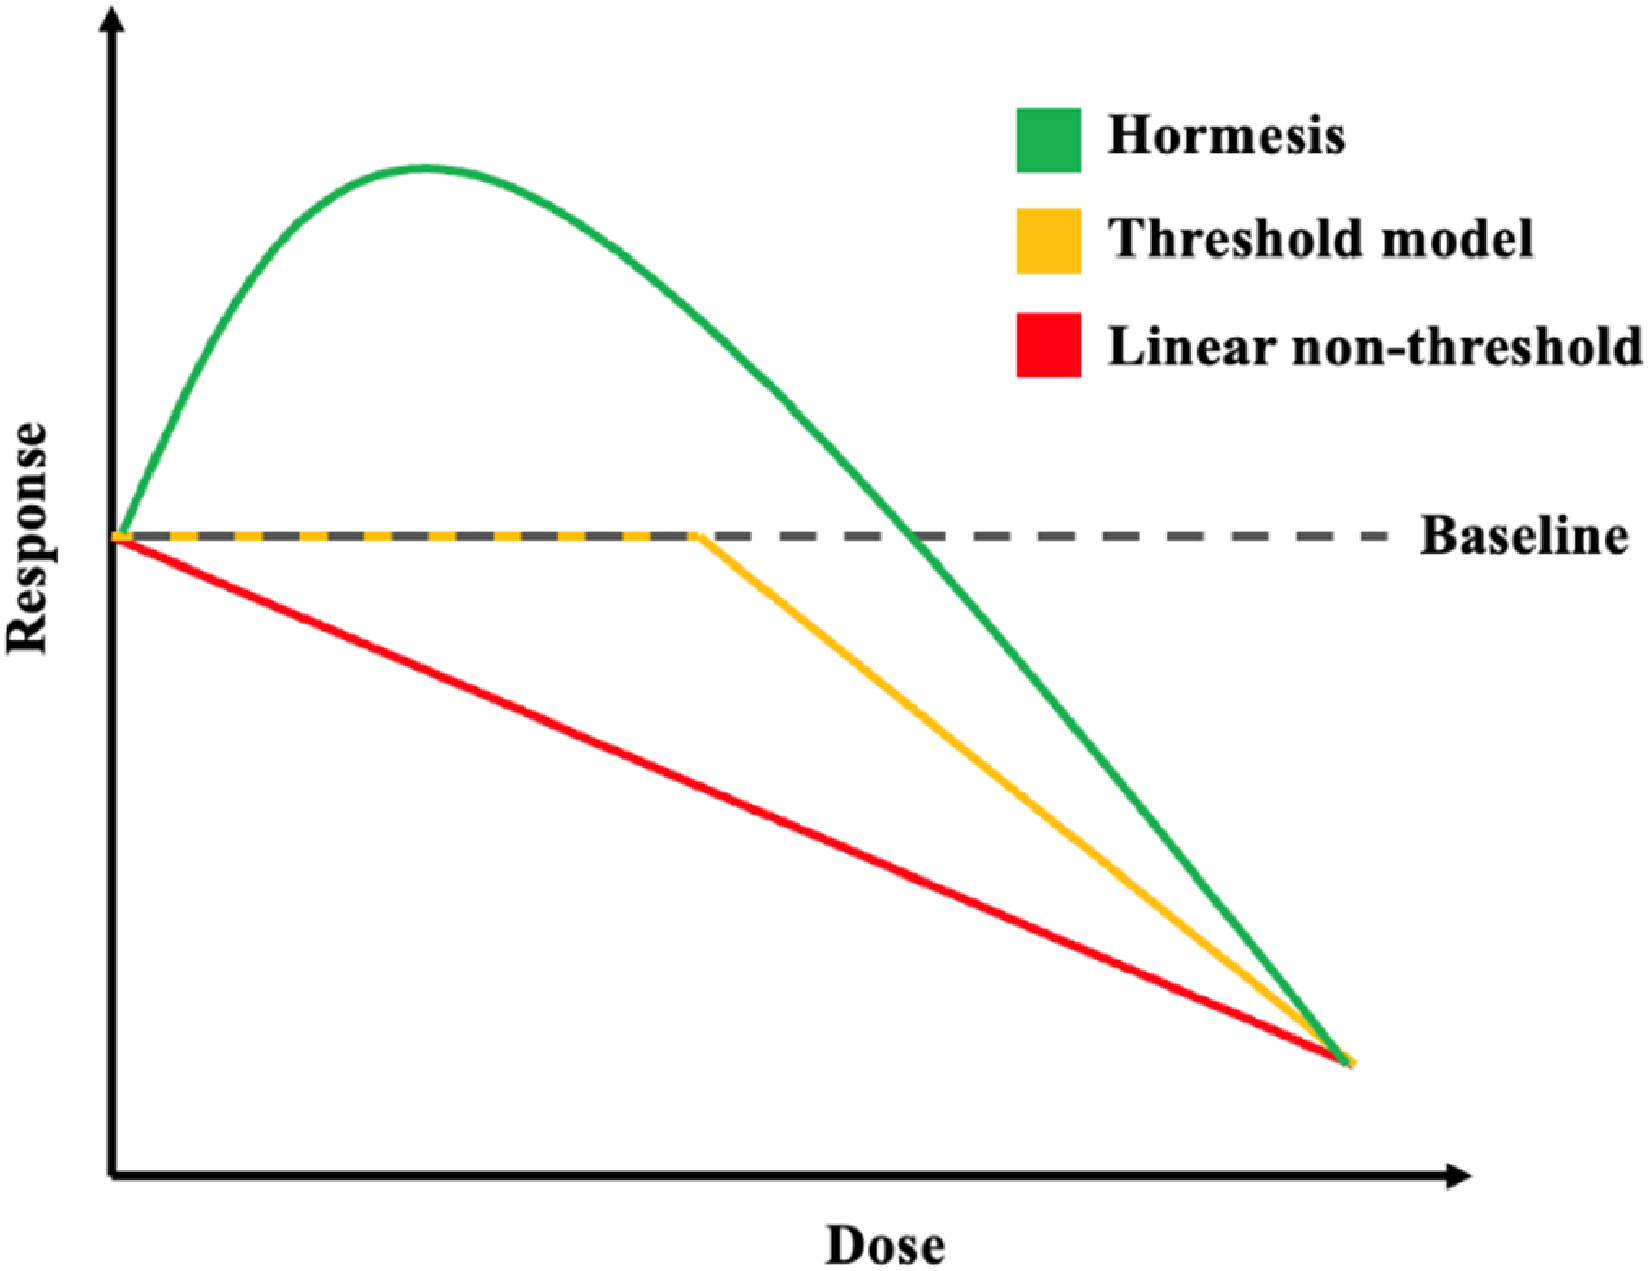
Visualizations of the most common dose-response models. The grey, striped line indicates the baseline response in the absence of a stressor. A drop below the baseline indicates a decline in the response variable, for example sports performance. Note that in sports tasks, the absence of a stressor is impossible. 13 Therefore, the baseline refers to the baseline refers to the lowest observed dose of the task.
Despite its frequent occurrence in biology and its striking resemblance with common principles and concepts in human performance (for an elaborate discussion on these parallels, see Hill et al. 5 ), hormesis cannot be assumed to occur for every task demand and response variable. Specifically, due to homeostatic control mechanisms, some variables change linearly with increasing doses of specific stressors.5,13 For example, heart rate would always be assumed to increase with training intensity. The nonlinear dynamics associated with hormesis are therefore more likely to occur at more macro-levels of organization like behavior in humans rather than on the subsystem-level that are governed by homeostatic control. 5 Moreover, even if hormesis is observed for the dynamics between a specific task demand and response variable, these dynamics may change for different variable combinations. In other words, if we find that small doses of time pressure enhance dribbling speed (i.e., response variable), we cannot assume that time pressure has similar effects on other response variables, or that dribbling speed is enhanced by small doses of every stressor. The same task demand does not always induce a J-shaped response curve in every variable and vice versa. 13 Furthermore, dose-response profiles likely differ among athletes (i.e., non-ergodicity).4,26 Thus, the implementation of dose-response profiles requires coaches to be aware of the exact dynamics between a given task demand and the desired response for each individual athlete. 15
Leveraging dose-response profiles
Establishing individual dose-response profiles – and specifically hormesis – for athletes also allows coaches and practitioners to adjust and create personalized training programs. However, deriving specific recommendations from the dose-response dynamics largely depends on the goal for the training and the level of expertise of the performer.14,15,27,28 For example, Kiefer and colleagues argued that such individualized approaches can be used in rehabilitation processes to identify what training doses of specific exercises the recovering athlete can be exposed to safely in order to optimize the recovery progress and simultaneously minimize the risk of re-injuries.14,15 According to Hodges and Lohse, low training dose (i.e., a low task demands) can also be beneficial if the goal of the training is to reinforce skills and strengths, to develop a degree of automaticity of motor skills, or to motivate and encourage athletes. 28 While the cautious approach in choosing training doses can be motivated by avoiding unnecessary risks, attain automatization, or motivation, aiming to improve the performance levels over a longer timescale (i.e., learning) of healthy athletes may instead focus on inducing challenge beyond the current capacities.29–34 Classic learning theories like Vygotsky's Zone of Proximal Development have already argued that the learner should be challenged by tasks that are just outside of their comfort zone and yet reflect attainable learning goals that are not too far away from the current level. 35
For motor learning specifically, Hodges and Lohse (building upon Guadagnoli and Lee) recently proposed that the optimal challenge point can be identified through systematically scaling the task demands. In other words, identifying the challenge point advocates for scaling the well-established dose-response profiles from toxicology to human performance.27,28 The optimal challenge point refers to the level of task demands (i.e., the dose) that leads to optimal motor learning. In a dose-response profile, the optimal challenge point or zone occurs when the performance starts to decline as a result of the increasing dose. This means that the performance and learning curves are intertwined, but not the same. Specifically, the peak amplitude for learning occurs at higher doses than the peak amplitude of performance. This implies that when an athlete can easily perform a task, they likely do not learn very much, while a slight (yet not too large) decline in the performance level indicates the optimal point for learning.12,28 Although the original conceptualization draws on information processing, from a dynamical systems perspective, training at the optimal challenge point forces the athlete to explore additional motor solutions to the task which may result in more adaptive behaviors.5,15,36 Thus, it is argued that the optimal challenge point for learning lies just behind the peak amplitude of the hormesis curve.
The current study
The aim of this article is to scale these dose-response profiles to a performance to identify the specific dynamics of systematically varied task demands during a shooting accuracy task in field hockey. The emerging profiles may equip coaches with tools to personalize training and map the specific effects of varying doses on their athletes’ performance. Therefore, we designed a field hockey shooting task, which resembles exercises with varying doses of task demands which are frequently used in training sessions. We expect that the performance (i.e., shooting accuracy) follows the typical pattern associated with hormesis rather than patterns associated with the linear non-threshold and threshold model (Hypothesis 1). This means that the athletes demonstrate functional increases in their performance relative to the lowest level of task difficulty. 5 13–15,17 Furthermore, we explore the individual dose-response profiles to examine whether optimal challenge points or zones can be identified and thus be used for specific training to enhance the shooting performance. 12 Together, these analyses can reveal whether the fundamental model of hormesis and the potential functional implications of dose-response profiles can be scaled to the behavioral level of sports performance.
Method
Participants
We recruited 32 female field hockey players who competed at a sub-elite level in The Netherlands. The mean age of the participants was 21.50 years (SD = 2.98) with an average experience of 15.00 (SD = 3.28) years. The players were equally distributed with regards to their main playing position on the field (11 defenders, 10 midfielders, and 11 attackers).
Procedure
The study's procedure was reviewed by an institutional review board and assigned the code (VCWE-2023-121R1). All data and accompanying dose-response profiles for each individual can be accessed via https://doi.org/10.34894/SEAF4R. Upon arrival at the training ground, participants received information about the study and filled in the informed consent form. During the study, the participants used their own equipment (e.g., shoes, stick, and clothes). The warm-up program lasted approximately fifteen minutes and consisted of the team's standard routine before a training session or a game. After the warm-up session, the actual data collection began.
The data collection consisted of five different shooting exercises starting at the 23-meter line with a goalkeeper (see Figure 2), each repeated five times (so per participant 25 shots in total). Task demands for these exercises were operationalized as the degree of difficulty. The doses were ordered in terms of increasing difficulty by the expert ratings of two experienced players during the conceptualization of the study and verified by two additional players who piloted the exercises but were not included in the final study. The doses were specifically designed to represent exercises that are commonly used during training sessions. Dose 1 was a free shot from between outer and inner circle (the line from which the shot had to be taken [determining the distance of the shots] was kept the same across the different doses). Dose 2 included maneuvering through a slalom line before the shot was taken, and Dose 3 was a shot after dribbling though a “minefield” of cones. Note that for both Dose 2 and 3, the players were told that points would be deduced from the total score if their ball touched the cones to enhance adherence to the instructions. However, no points were actually deduced. For Dose 4, the participants were put under time pressure by counting down loudly from three to zero. Dose 5 included a defender chasing the attacker who had a 2-meters head start. In order to avoid ordering effects during the data collection, the sequence of the doses was counterbalanced between participants. The participants were instructed to shoot as accurately as possible with the aim to score.
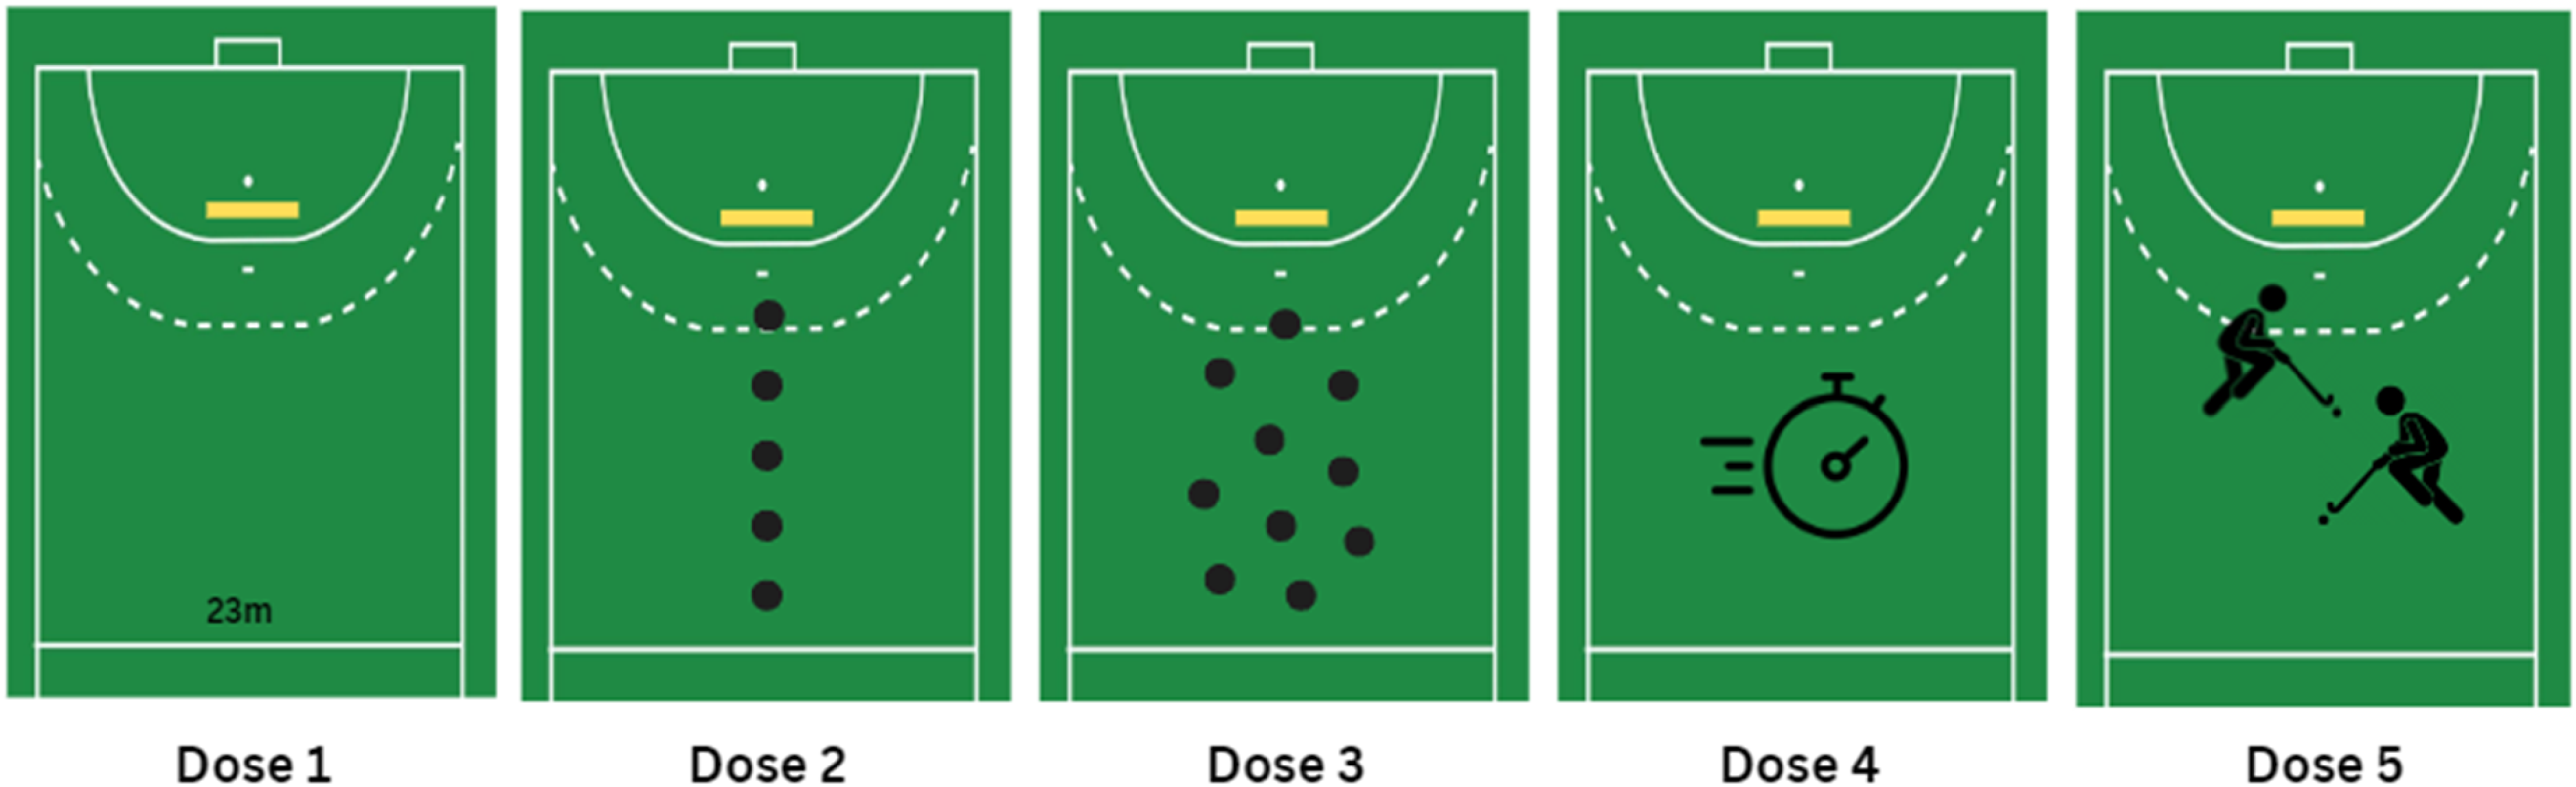
Visualization of the shooting exercises ordered by difficulty (i.e., dose). The yellow stripe marks the distance from where the shot had to be taken.
Measures
The performance output (i.e., response variable) of this task was defined as the players’ shooting accuracy. To assess the accuracy of each shot, the goal was divided into five circular zones. Hitting the innermost circle earned the participants one point because this represents a region where the keeper is typically able to stop the shot. The further the ball was placed towards the edges of the goal, the more points could be earned per attempt, independent of whether or not the keeper stopped the shot. When the goal was missed, zero points were awarded, except when a shot just missed the goal enabling a potential tap-in during a match; in that case the maximal number of points (i.e., 5) was also awarded. The tap-in scoring rule was added based on the recommendations of the two players who helped to develop the shooting exercises for the doses. Thus, the scoring ranges from 0 to 5 points per shot. Because each exercise (i.e., dose) was repeated five times, a maximum of 25 points could be earned per dose. To ensure reliable scoring of the points by an expert rater, each attempt was videotaped from behind.
Data analysis
The first step of the analysis was to test whether the increasing doses generally induced the bi-phasic, J-shaped pattern of hormesis in the performance rather than linear effects (Hypothesis 1). To do so, we conducted a repeated measures ANOVA with dose as a factor with five levels. A significant main effect would indicate that the performance changes as a function of dose. The within-subject contrast further indicates the nature of the change. A significant linear trend would indicate that a linear effect (as proposed by the linear (non-)threshold model) best fits the change across the doses while a quadratic fit would indicate a bi-phasic trend. A power analysis yielded that at least 21 participants were necessary to reach a significant result assuming a medium effect size (f = 0.25) at an alpha level of .05 and 80% power. Note that our sample size (n = 32) exceeds the minimal number by eleven participants because our recruitment approach focused on targeting whole teams with varying player availability at a given data collection moment.
Regardless of whether the main effect of dose is significant in the repeated measures ANOVA, an additional indicator of hormesis is the specific improvement of at least 30% relative to the smallest dose (i.e., Dose 1).13,37,38 That is, the shooting accuracy must improve with increasing doses by at least 30% relative to the performance at Dose 1. However, given that the specific pattern may vary largely between individuals, it is recommended to assess these relative changes in the individual dose-response profiles.12,13 Using Microsoft Excel, we plotted the response (i.e., shot accuracy performance) as a functioning of increasing dose (i.e., difficulty) for each participant (i.e., points per dose per participant). Specifically, the x-axis depicts the five different doses order from smallest to largest, and the y-axis depicts the performance score (i.e., shooting accuracy) relative to the performance score obtained at Dose 1. For example, if the accuracy score at Dose 1 equals 15 points for a given participant, a score of 18 at any higher dose would represent a relative improvement of 20%. Thus, every dose-response profile that contained a relative improvement of at least 30% was classified as meeting the criterion for hormesis. Finally, we applied a proportion test to assess whether the number of profiles demonstrating hormesis occurs more often than chance (i.e., 33.33%) considering the alternatives of the threshold model and linear non-threshold model.
In the final step of the analysis, we determined for each dose-response profile whether an optimal challenge zone could be identified and if so, which doses corresponded to this optimal challenge zone. Specifically, we followed the example by Hill and colleagues to observe whether a clear drop in performance with increasing doses can be identified through visual inspection. 12 Assuming hormesis to occur in the dose-response profiles, we classified the challenge point as any decline in performance after the peak amplitude has been reached. To do so, two of the authors (YH and MK) first individually classified the dose-response models and then discussed potential differences to arrive at a final, joint rating. Given the exploratory nature of this analysis, we provide descriptive statistics that indicate after which dose most athletes enter challenging zones.
Results
The repeated measures ANOVA assessing whether performance changes as a function of dose on a group-level yielded no significant main effect but a medium effect size (F(1,31) = 2.363, p = .057, η2partial = .071). However, the within-subject contrast yielded a significant, large effect for the quadratic (F(1,31) = 6.846, p = .014, η2partial = .181) but not for the linear fit (F(4124) = 0.142, p = .709, η2partial = .005) as depicted in Figure 3. This provides partial support for Hypothesis 1.
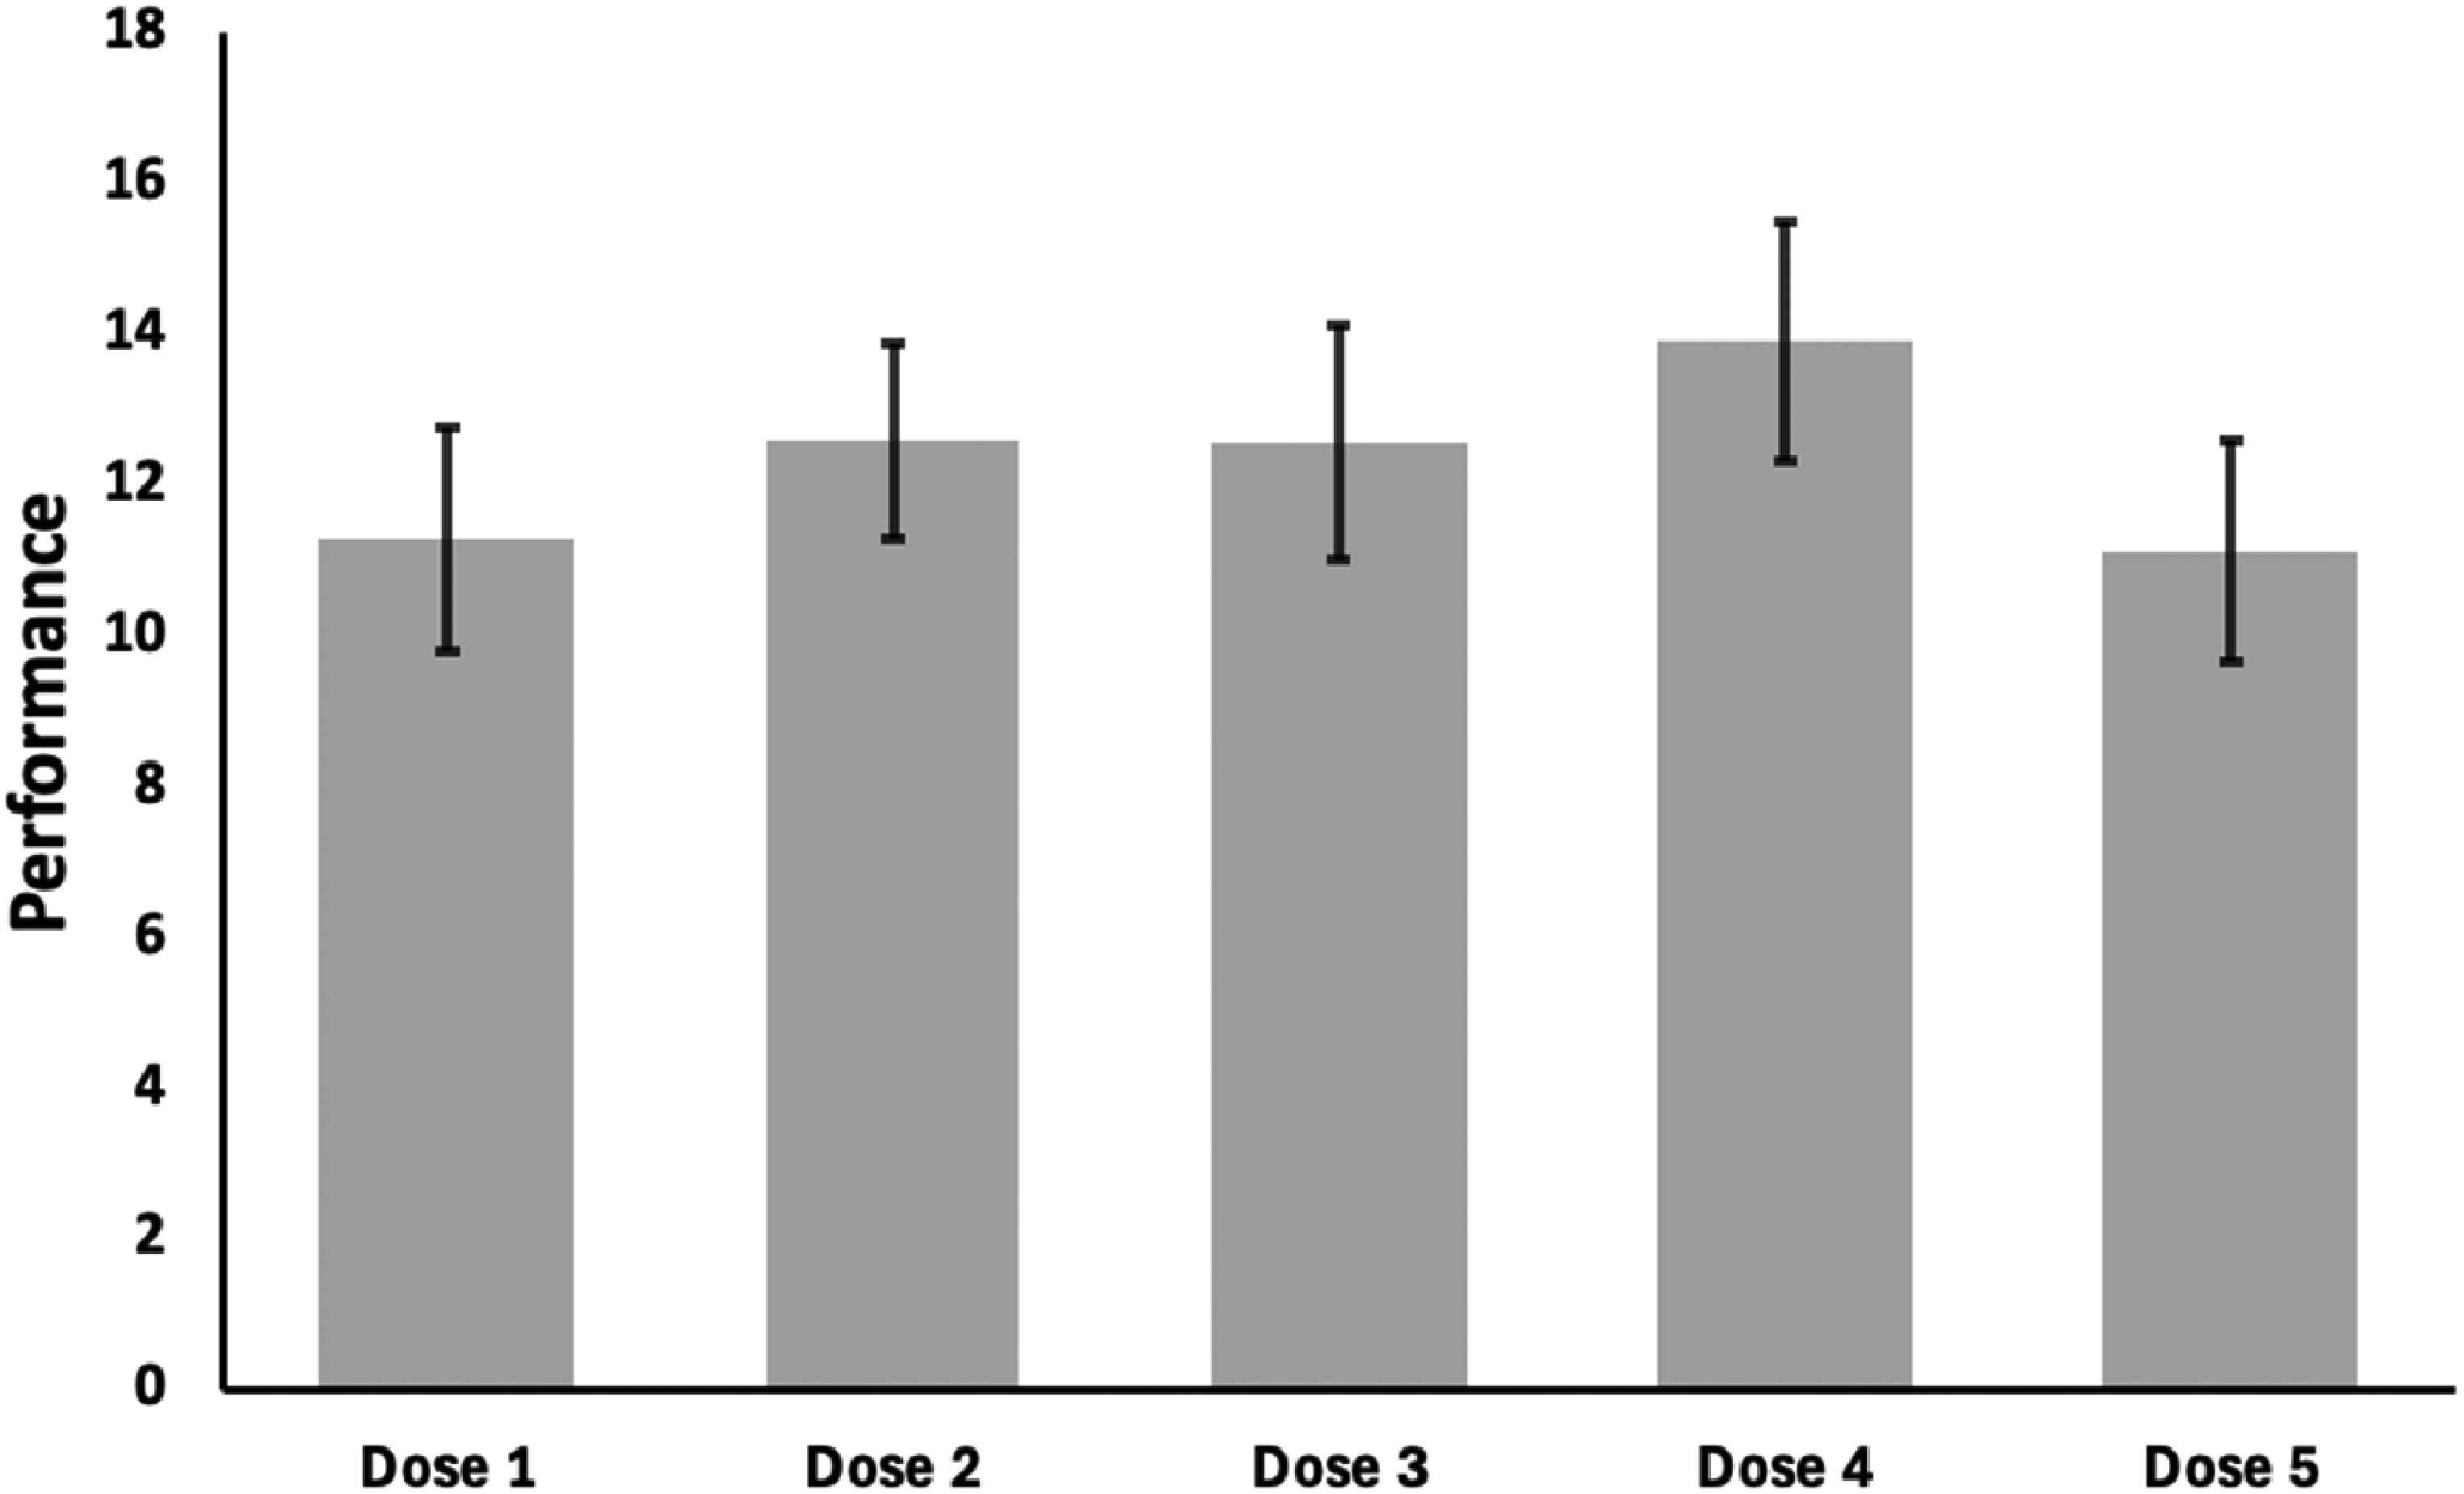
Average performance across the 32 players per dose. The error bars are based on the 95% CI.
Moving to the individual-level analyses, the test for the 30% threshold revealed that 20 participants (62.50%) showed an improvement of at least 30% in their shooting accuracy with increasing doses (for select examples of dose-response profiles, see Figure 4A-4C; all dose-response profiles can be found in the online repository). However, in twelve cases (37.50%) no signs of hormesis were detected (for examples, see Figure 4D-4F). That is, no improvement of at least 30% in shooting accuracy relative to the lowest observed dose occurred. The observed frequency of hormesis (62.50%) is statistically larger than chance (z = 3.55, p < .001, h = 0.60) considering the potential emergence of threshold and linear non-threshold response models, further supporting Hypothesis 1. However, it should be noted that some dose-response profiles did not mimic the proposed bi-phasic, J-pattern despite reaching the 30% threshold (e.g., Figure 4C), while other profiles showed the characteristic J-pattern without reaching the 30% threshold (e.g., Figure 4D).
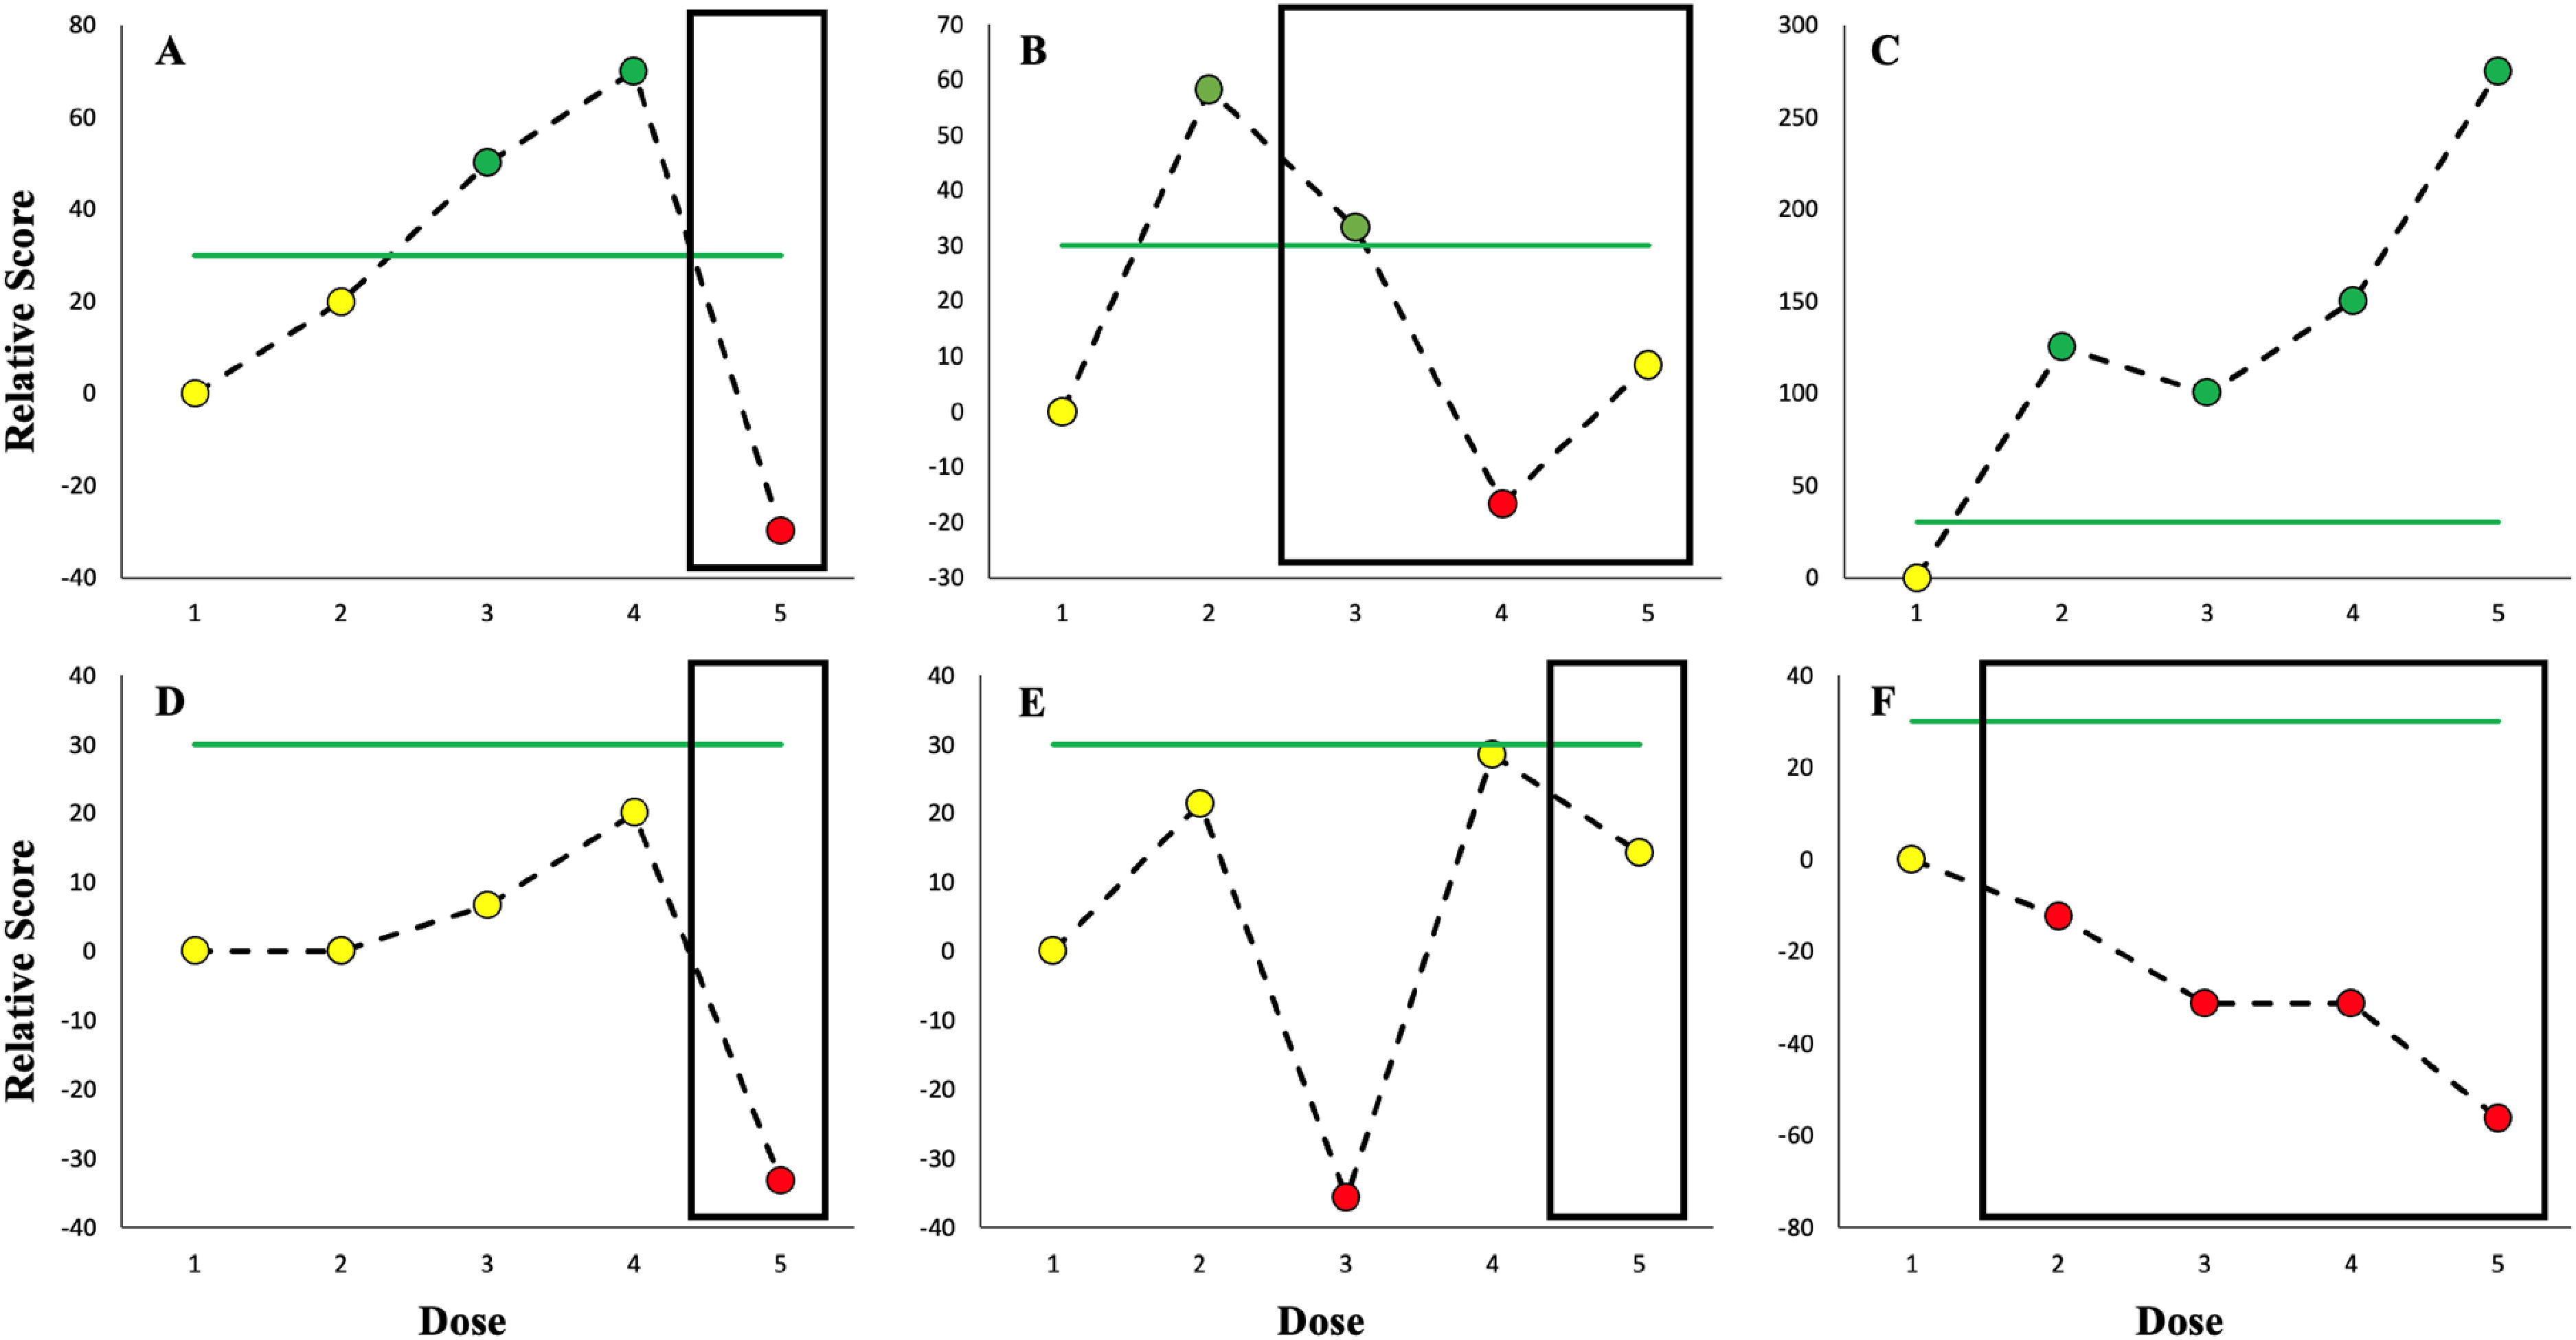
The dose-response profiles of six participants. The dose represents the five different shooting exercises ordered by difficulty, and the relative score represents the shooting accuracy relative to the performance at the lowest observed dose (i.e., Dose 1). The green horizontal lines mark the 30% improvement criterion for hormesis. Points marked in yellow represent performance scores that are either equal to the performance at the lowest dose or yield an improvement smaller than 30%. The green points mark an improvement of at least 30% relative to the smallest dose. Performances below the score at the lowest dose are marked in red. The black box within the profiles marks the zone where performance declines after the peak amplitude (i.e., the optimal challenge zone).
Determining the challenge zones mimicked the large inter-individual variability in dose-response profiles and the resulting patterns. Overall, the most common point at which participants (43.75%) reached their peak performance (i.e., amplitude) was at Dose 4, placing the challenge point at Dose 5 (see Figure 4A, 4D, and 4E). The second most occurring challenge point could be placed after Dose 2 (15.63%) and Dose 3 (15.63%). Interestingly, some participants reached the peak amplitude either at the lowest (12.50%, see Figure 4F) or highest dose (12.50%, see Figure 4C). This means that for the former group, the shot accuracy is not developed enough to benefit from these doses, while for the latter group, the optimal challenge point and peak amplitude of the dose-response relationship lie beyond the observed doses of this study. However, not all profiles allowed for a clear indication of an optimal challenge point even when displaying hormesis. For example, the profile depicted in Figure 4B demonstrates a slight increase in performance after the initial drop following the peak amplitude. Furthermore, other profiles demonstrated the steepest decline before the peak amplitude occurred (Figure 4E). Although this latter case was an exception, it calls into question whether several challenge points may exist, or subjective (i.e., functional) difficulty should be placed on the x-axis to determine the challenge point as suggested by Hodges and Lohse. 28 In line with the challenge point framework, dose-response profiles also allow for clear identifications of a challenge point even in the absence of hormesis.27,28 That is, some profiles demonstrated either a clear biphasic pattern despite not reaching the 30% threshold (Figure 4D) or a monotone decline in performance following the smallest dose, resembling a linear non-threshold model (Figure 4F).
Discussion
Although coaches intuitively use variations of task demands during training to stimulate performance enhancement, a precise assessment of the dose-response dynamics for individual players is often lacking. Because too small doses are likely to have no beneficial effect for learning to occur and too large doses may also elicit the commonly known detrimental effects to performance,2,39–41 precise mapping of the varying doses of task demands is warranted. 15 Therefore, this study aimed to scale dose-response profiles which have commonly been applied in the domain of toxicology to the behavioral level of sports performance. 21 This approach can equip coaches with a detailed overview of the dose-response dynamics which is necessary to design personalized training routines that are safe and effective for attaining training goals.14,15
The dose-response profiles in this study consisted of the shooting accuracy (i.e., response variable) of field hockey players in exercises with varying degrees of difficulty (i.e., dose), which are commonly used in training sessions. Although the dose variation did not yield statistically significant effects on performance on a group level, despite a medium effect size, the data clearly indicates a general bi-phasic, J-shaped pattern. Furthermore, on the individual-level analyses showed that most participants (62.50%) improved in their shooting accuracy by at least 30% when the task became more challenging.20,21,25 Therefore, our data provides evidence that shooting accuracy in hockey generally follows the typical pattern hormesis with increasing task demands. This implies that coaches should refrain from using too easy tasks to enhance shooting accuracy performance because players may not perform at their potential at those doses, which may hinder even typically low-dose training purposes like enhancing motivation and automizing movements. Note also that approximately one third (37.50%) of the participants did not show notable performance improvements with increasing task difficulty. According to Kiefer and colleagues, these dose-response profiles may still bear valuable information for training purposes, such as determining optimal challenge points. 15
We also observed large heterogeneity between the different dose-response profiles, even for the ones that were classified as hormesis. 20 For example, some profiles that met the hormesis criterion (i.e., the 30% improvement) did not follow the typical J-shaped curve associated with hormesis, while at the same time profiles with an emerging J-shape did not always meet the requirements to be classified as hormesis. It should be noted that the 30% threshold is derived from controlled experiments within toxicology, which often uses precise cellular processes to assess hormesis. Given the inherently complex nature of human performance, 15 the margins of these cutoff scores may need to be adjusted for behavioral measures. This is especially important when considering on-field performance variables in sport setting as these are highly constrained by tactical instructions from the coaches and interactions with teammates. Nevertheless, these diverging patterns reinforce the notion that group-level aggregates of dose-response dynamics may be misleading for the individual level.4,26 Therefore, individualized assessments of these profiles are recommended. Thus, coaches should not create one profile based on the aggregate scores of all players to design training routines that meet the needs of entire team. Instead, the profiles should be used to tailor the training routines to each individual player.
The call for individualized training approaches is also evident in our exploratory analyses for determining the optimal challenge point or zone. 28 Despite the relatively homogeneous sample consisting of women who play on a similar level with the same amount of experience, the potential challenge zones ranged across all doses. Moreover, some profiles call into question whether determining a single challenge point is feasible when the order of the dose is determined objectively.5,13 Nevertheless, for a clearer identification of potential training zones, we need to consider the stimulative effect of increasing doses to make sure that too little challenge is also identified adequately. If the stimulative effect of increasing doses is neglected, false performance declines may be identified as challenges because the initial phase of the hormesis curve is not represented adequately. In other words, ignoring the potential stimulative effect of increasing doses maintained by hormesis could lead to falsely identifying lower performance as induced by challenge rather than correctly identifying it as zones that are too easy and thus fail to have a stimulative effect. Thus, the J-shaped curve associated with hormesis based on objective task difficulty can make crucial distinctions between the effect of doses to enhance learning. Therefore, we recommend precise monitoring of increasing doses to identify optimal challenge points or zones.
Overall, it should be noted that the results pertain only to task demands commonly used in training exercises at a single point in time. In line with our argument that dose-response profiles need to be carefully established for each set of parameters, the current findings should not be assumed to extend to other kinds of task demands without rigorous testing. Similarly, the specific dose-response profiles here are built on a single measurement moment. However, the specific dynamics heavily depend on how they are embedded in the history of events.2,39,23,24 Thus, practitioners need to consider how any given dose-response profile is embedded in the athlete's training history.
Limitations
The current study has three limitations that should be addressed by future research. First, we did not test whether the recommended optimal challenge points actually help athletes to improve their shooting accuracy more than randomly running general drills. Future studies utilizing repeated assessments connected to targeted intervention can provide more insight into the malleability of the dose-response dynamics and challenge points.15,27,28,42
Second, the doses that were applied in the current study were the same for each participant. In line with the notion of individual dose-response dynamics, the dose variation itself should also be tailored to each individual.5,13 Applying the same range of doses to players with different skill sets and who play in different positions may yield the erroneous conclusion regarding the specific dose-response profile for an individual. 21 That is, the absence of a notable performance improvement does not imply that this cannot be stimulated for a given athlete. Instead, it is necessary to consider if the doses were sufficiently nuanced to observe the improvement. Alternatively, the lowest dose may have already been too high or the highest observed dose too low to represent the adequate spectrum for an athlete. In other words, for a specific individual, such general doses may be either entirely on the left or right side of the peak amplitude. Thus, future studies should consider utilizing personalized doses. 13 Similarly, the current design of the study rests on the assumption that the random order in which the doses are presented averages out fatigue effects. However, the fatigue rates may be different for each individual. This reinforces the necessity for more personalized approaches in generating dose-response profiles for training purposes.
Third, not all dose manipulations may have equal influence over the performance measures. Specifically, Dose 2 and Dose 3 required dribbling movements before the shot was taken, while Dose 4 and Dose 5 used (time) pressure. It can be reasoned that the pressure conditions had direct influence on how the shot was executed, while the dribbling elements influenced the preparation for the shot. Although this study was motivated by realistic shooting drills as they are commonly used in field hockey practice, more standardization for future research may be desirable. For example, the time pressure present in Dose 4 and 5 may be an inherent element of any manipulation as almost every on-field action related to scoring needs to be completed with limited time available. That is, hockey players must perceive, select, and execute relevant actions that lead to success under constant pressure from their opponents. Therefore, such realistic pressure could provide the foundation for more systematic dose-variations.
Implications and future directions
The quest for determining the precise dose-response relationships can also be found in the literature on pressure training. Pressure training refers to the safe exposure of athletes to stressful situations in order for them to adopt strategies to adapt to such circumstances during competitions.43,44 However, contemporary approaches lack systematically varied doses of pressure training. Most studies are mainly concerned with how stressful circumstances can be evoked during training as well as how athletes can learn from these training methods.11,29,45 Furthermore, we also lack insight into when pressure training may be most effective (e.g., immediately before a competition or during the regular training). 46 Given that we assume that the dose-response relationship changes with such targeted training interventions by increasing the area under the curve (e.g., delaying the drop below the baseline or moving the peak amplitude to higher doses), more systematic assessments are required. 5 Therefore, we suggest using systematic dose-response profiles to guide the future research agenda of pressure training to fill these voids.
A particular future direction tailored to the malleability of dose-response profiles has recently been suggested by Burggren and Mueller. 47 Specifically, dose-response profiles can be extended by a third axis. For example, Hardy demonstrated that varying the doses of two interacting variables can have vastly different effects on performance (or any other response variable) compared to the effect of either variable in isolation. 48 One of these factors that is of particular interest for the domain of sports is time.5,14 Placing time on the third axis would enable identifying so-called critical windows of development. 47 For example, children at a very young age may not be receptive to specific exercise aimed at motor skill development regardless of the dose. This pattern may change over the years and particular doses become more effective. Consequently, adding time as the third axis may provide insight into which exercises may be effective at what dose (e.g., intensity or difficulty) for different age groups. The same reasoning may also be extended to smaller timescales, such as weekly training cycles or particularly for female athletes, the menstrual cycle. Thus, adding time as a third axis in dose-response profiles provides a comprehensive understanding of the time-dependent factors for performance enhancement. 14
Conclusion
Due to the ubiquitous nature and use of varied task demands for performance enhancement in sports, we examined whether dose-response profiles, which are commonly used in toxicology, can help researchers and coaches to understand when such task demands elicit positive effects and when they elicit negative effects. We found that field hockey players demonstrate signs of hormesis for their shooting accuracy in response to increasing task difficulty. That is, under small to medium doses, performance was facilitate, while very small or high doses elicit less desirable responses. Therefore, these profiles and the concept of hormesis may be leveraged to develop personalized training routines for athletes to stimulate performance enhancement over time while minimizing potentially harmful effects.
Footnotes
Funding
The authors received no financial support for the research, authorship, and/or publication of this article.
Declaration of conflicting interests
The authors declared no potential conflicts of interest with respect to the research, authorship, and/or publication of this article.