
Abstract
This study examined the representativeness of a small-sided game for high-pressure phases of play in Australian football. One elite AF team (age = 23.5 years ± 3.85) completed a training drill designed with modified task constraints (10-versus-10 players and reduced playing space) to replicate the high-pressure of contested phases of matches. Across 11 weeks, player possession data from 11 drills and contested phases of 11 matches were analysed. On average, players completed the drill 5.3 times and participated in 6.9 matches. Environmental and behavioural variables were compared between settings, analysed relative to frequency per minute and as proportions of variable occurrences per minute within contested phases of play. Findings showed significantly higher pressure points in matches (median = 2.34) than in training (median = 2.02). Indeed, matches featured significantly higher frequencies of all high-pressure variables than training. Comparatively, training produced match-like proportions of possessions with physical (median = 28.31%) and closing pressure (median = 13.61%), but also featured a higher prevalence of low-pressure events, such as longer possession durations (median 2–3s = 15.28%, median 3 + s = 15.83%) and disposals with no opposition pressure (median = 9.2%). Training (median = 63.75%) also involved more effective outcomes than matches (median = 49.64%). The drill was not entirely representative of match-like high-pressure phases of play and may have been less challenging. Interestingly, different measures of representativeness provide different results and interpretations. Coaches should be clear on training drill aims and the outcomes they hope to achieve to attain the most meaningful insights.
Introduction
When designing any training drill, a key consideration is the transfer of learning from practice to competition. 1 The greatest transfer of behaviour occurs when the training environment is representative of the performance environment. 2 This concept is captured in the Representative Learning Design (RLD) framework, which proposes that training tasks can be made more representative by integrating contextual information specific to the performance environment. 3 By designing training activities that preserve key information movement coupling processes that athletes experience in competition, transfer of skill to competition may be enhanced.3,4 Team sports such as Australian Football (AF) have been a popular choice for RLD research due to performance (i.e., effective execution of a strategy) being highly dependent on the team's ability to collectively coordinate and respond to opposition players. 5 Australian Football coaches commonly use training activities, such as match simulation or small-sided games (SSG), and manipulate task constraints (e.g., playing space, player numbers and rules) to replicate the demands of the match environment. 6 However, it is often unclear how representative these training activities are, as the complex performance conditions of matches can be difficult to recreate in training.
Within AF, several studies have assessed how well training represents the environmental information and athlete behaviours seen in matches (e.g., Bonney et al., 2020; Browne et al., 2019, 2020; Dawson et al., 2004; Ireland et al., 2019; Parrington et al., 2013; Robertson, 2016). One important contextual factor is the amount of physical pressure applied to the ball carrier from an opposition player. High physical pressure may be represented by factors such as physical pressure applied by opposition (i.e., tackles), and large numbers of opposition players surrounding the ball carrier, and consequently less time and space for a player to dispose of the ball.14,15 This typically occurs during contested phases of match play when possession of the ball is in dispute, such as after a marking contest when the ball goes to the ground. These phases typically involve high player density and congested ball movement, and subsequently, frequent turnovers. 16 High physical pressure (referred to as high pressure hereafter) can be associated with a breakdown in skill execution and possession efficiency.9,11,13 Therefore, AF coaches attempt to design specific training drills that aim to improve skilled performance under high pressure. According to the RLD framework, if athletes are regularly exposed to game-like high pressure, they will have the opportunity to become better attuned with relevant information movement coupling processes, and develop robust and adaptable movement solutions that can be transferred to matches, which may improve competition performance. However, previous research has found high-pressure moments to typically occur at significantly lower frequencies in training than in competition, indicating less-representative conditions in training.7,9,12 These findings appear problematic, but the studies compared a collection of training drills to matches (i.e., game-scenario drills, SSGs, and match simulation), meaning the intention of individual drills was not accounted for. Drills within a training session typically have various objectives and may only contain elements specific to a particular phase of match play. Subsequently, they can be expected to have various levels of representativeness for match elements, which may be diluted when various drills are combined for analysis. To advance this area of research and to make more accurate interpretations about practice representativeness, research needs to assess specific drills within a training session. Therefore, the aim of this study was to investigate the representativeness of a training drill designed to replicate high-pressure phases of play in elite AF. This evaluation can assist coaches in understanding the effectiveness of training, and identifying modifications required to improve their drill design to better replicate specific game phases.
Materials and methods
Study design
Secondary data analysis was completed using data collected by one elite AF club during the 2022 season. The data described player possessions from training and matches, and was originally collected by club analysts via notational analysis of training and match footage. An ethics exemption was granted from the University Human Research Ethics Committee.
Data collection & participant details
Data from one SSG designed to replicate high-pressure moments representative of contested phases of match-play was used. Data from 36 players was included in the analysis (age = 23.5 years ± 3.85). Players completed the training drill an average of 5.3 times (SD = 2.4, range = 1–9) and the average number of matches played per player across the 11 weeks was 6.9 (SD = 3.7, range = 1–11). Participation in the training drill or match was subject to player availability (i.e., unavailable if injured) and team selection by the match committee.
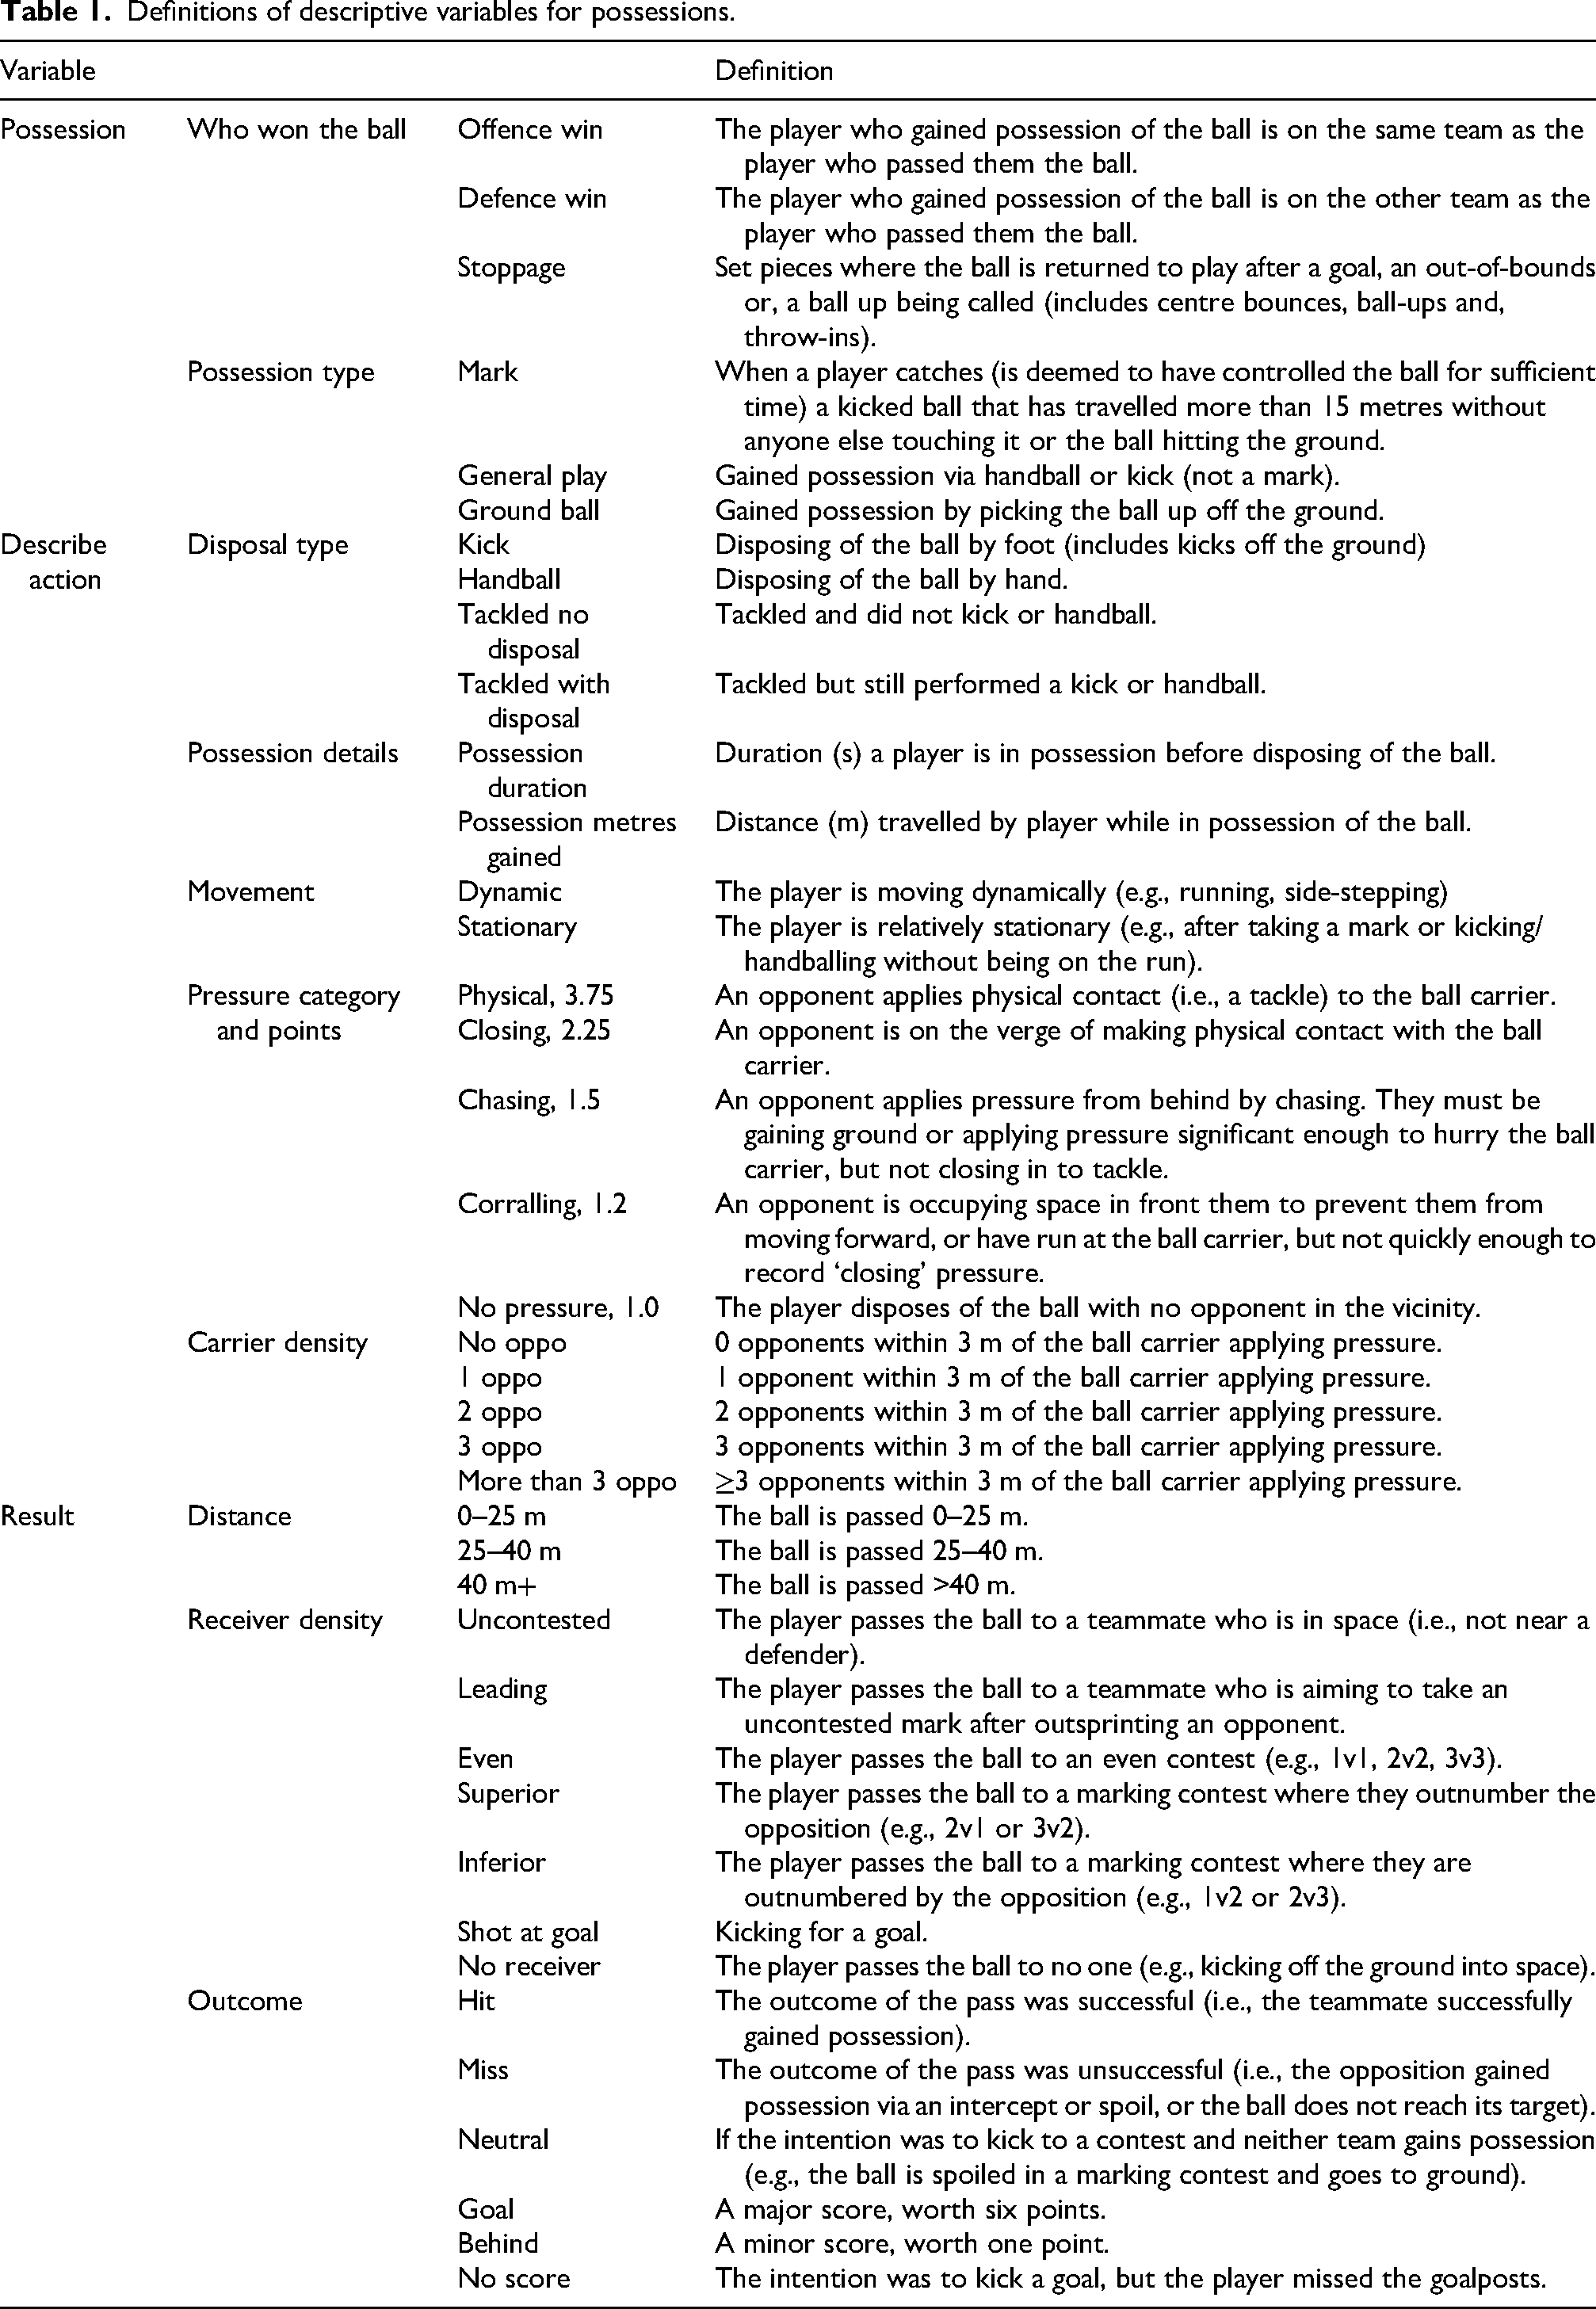
The dataset comprised descriptive variables for every possession executed by players during the training drill and the matches to provide the context in which the possessions occurred (See Table 1 for a list of the variables). A possession refers to when an athlete receives the ball (such as through a mark, groundball-get, or handball-receive) with a reasonable amount of time to dispose of it, while a disposal refers to when an athlete legally disposes of the ball via handball or kick. 17 To capture data for possessions where athletes were unable to dispose of the ball (i.e., due to being tackled), variables were recorded for each possession, at either the time of disposal, or when the possession came to an end due to the athlete being tackled. Physical pressure in AF is measured by classifying the opposition pressure at the time of disposal into five categories – physical, closing, chasing, corralling and no pressure. These pressure categories were included in the match and training datasets as coded by the analysis staff. If more than one type of pressure was applied to the ball carrier, the highest category was recorded. Each of these categories have a corresponding numerical value reflecting the Champion Data pressure points values which increases as the type of pressure increases in intensity (see Table 1 for pressure categories and points). These numerical values are referred to as pressure points. 17
Definitions of descriptive variables for possessions.
Drill design
The SSG was designed and implemented by coaching staff prior to the study commencing, so there was no input by the research group, and the coaches were not aware that the study would be conducted when designing training. Three task constraints were modified to achieve the high density and pressure of match contested phases in the training drill, based on the expertise of the coaching staff: modified player numbers (10 versus 10 compared to 18 versus 18 in a match), reduced playing space (only utilising a rectangular portion of the field, from the centre square to the end of the right forward-50, see Figure 1) and a rule change (any possession that would usually be a ‘mark’ was not paid and the play continued). The training drill was completed weekly across 11 weeks during the in-season period, with the constraints applied consistently each session. To compare training to matches, the corresponding match data from those 11 weeks were analysed.
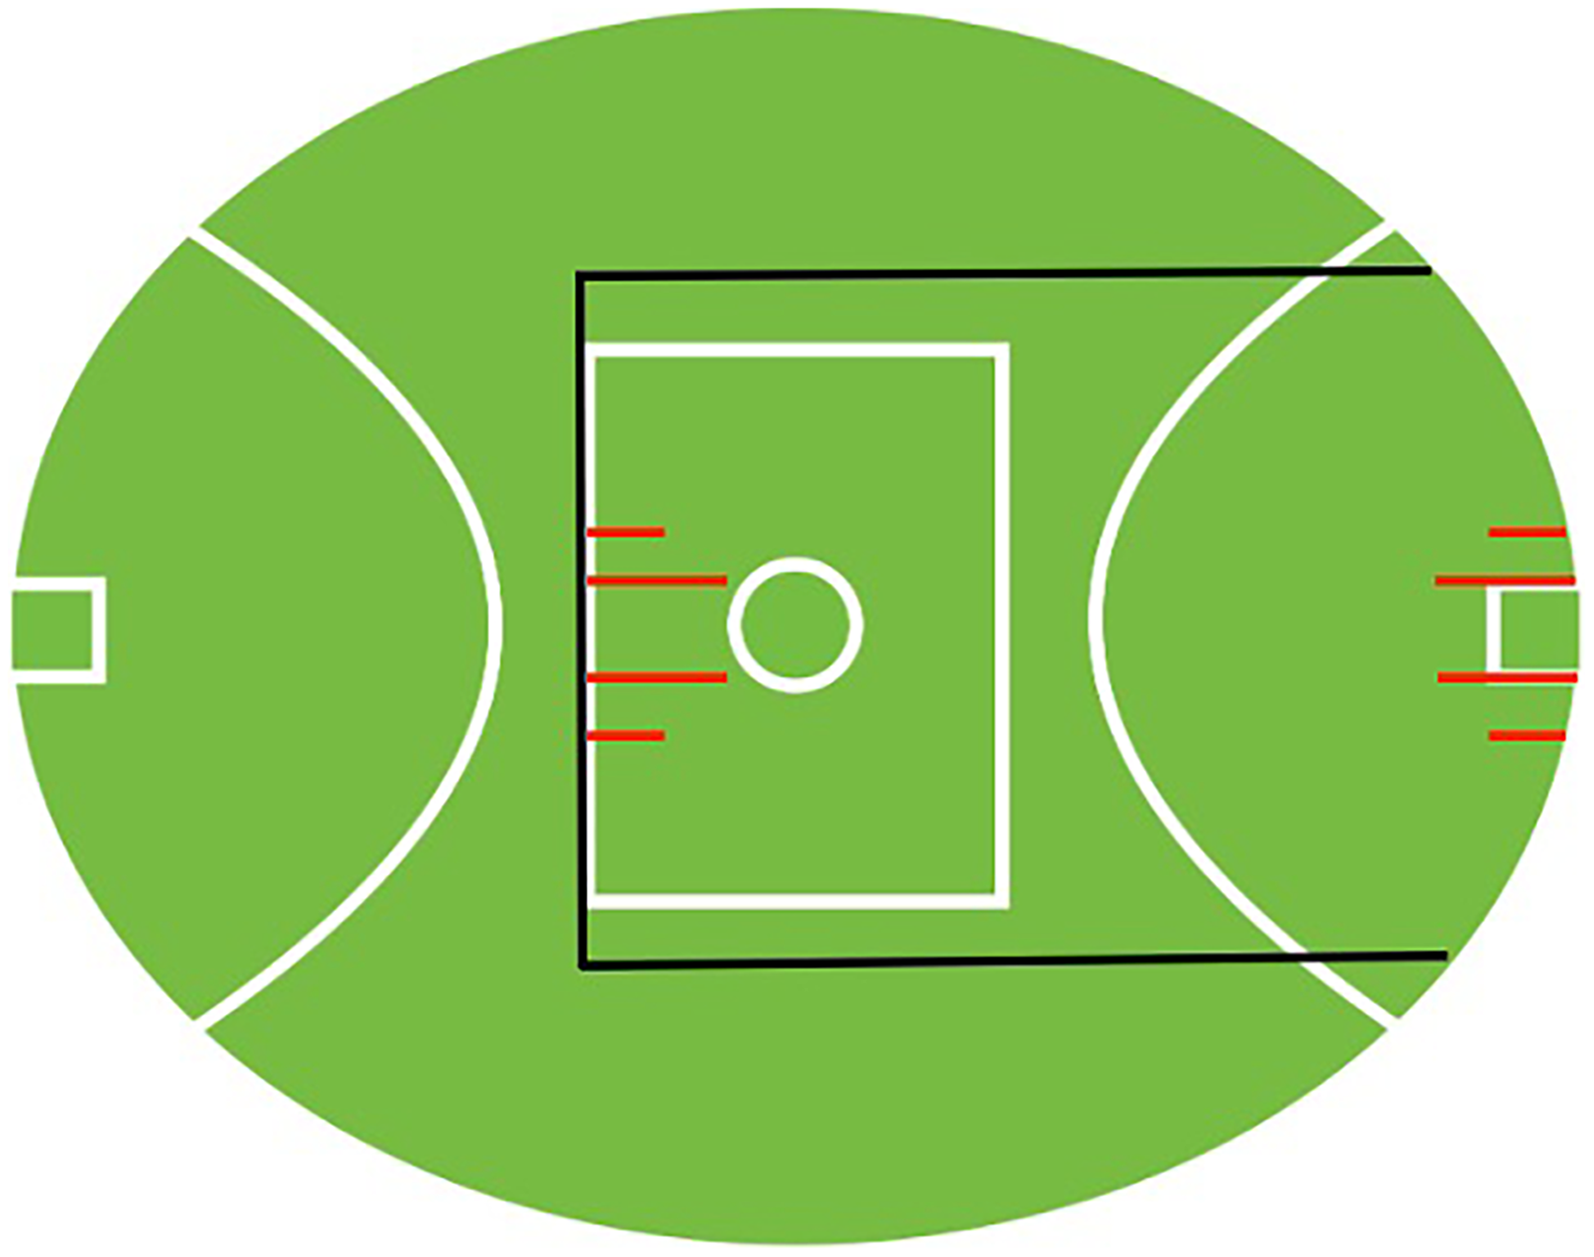
Diagram of training drill playing space. Note. Reduced field dimensions within the black lines, goal posts indicated in red.
As the training drill focused on simulating high-pressure moments seen in contested phases of competition, only these contested phases of the matches were included in the dataset and analysis. These were defined as periods in which ball movement was congested with frequent turnovers, typically occurring at a stoppage, or following a marking contest whereby neither team gained clear possession of the ball. 16 Based on this definition, these phases were subjectively identified by the coaching and analysis staff at the AF club from original match footage. The average duration of a contested phase of play during the training drill was 23.0 s (range: 0.8–56.3) and contained an average of 6.40 possessions (range: 2–17). The average duration of a contested phase of play during matches was 11.9 s (range: 0.5–60.0) and contained an average of 4.31 possessions (range: 2–21) (see Figure 2 for an example distribution of contested phases in a match compared to a drill). Contested phases of play were considered to have ended once a team had clearly gained control of the ball, or play came to a stop (e.g., such as through a score, or a stoppage being generated).
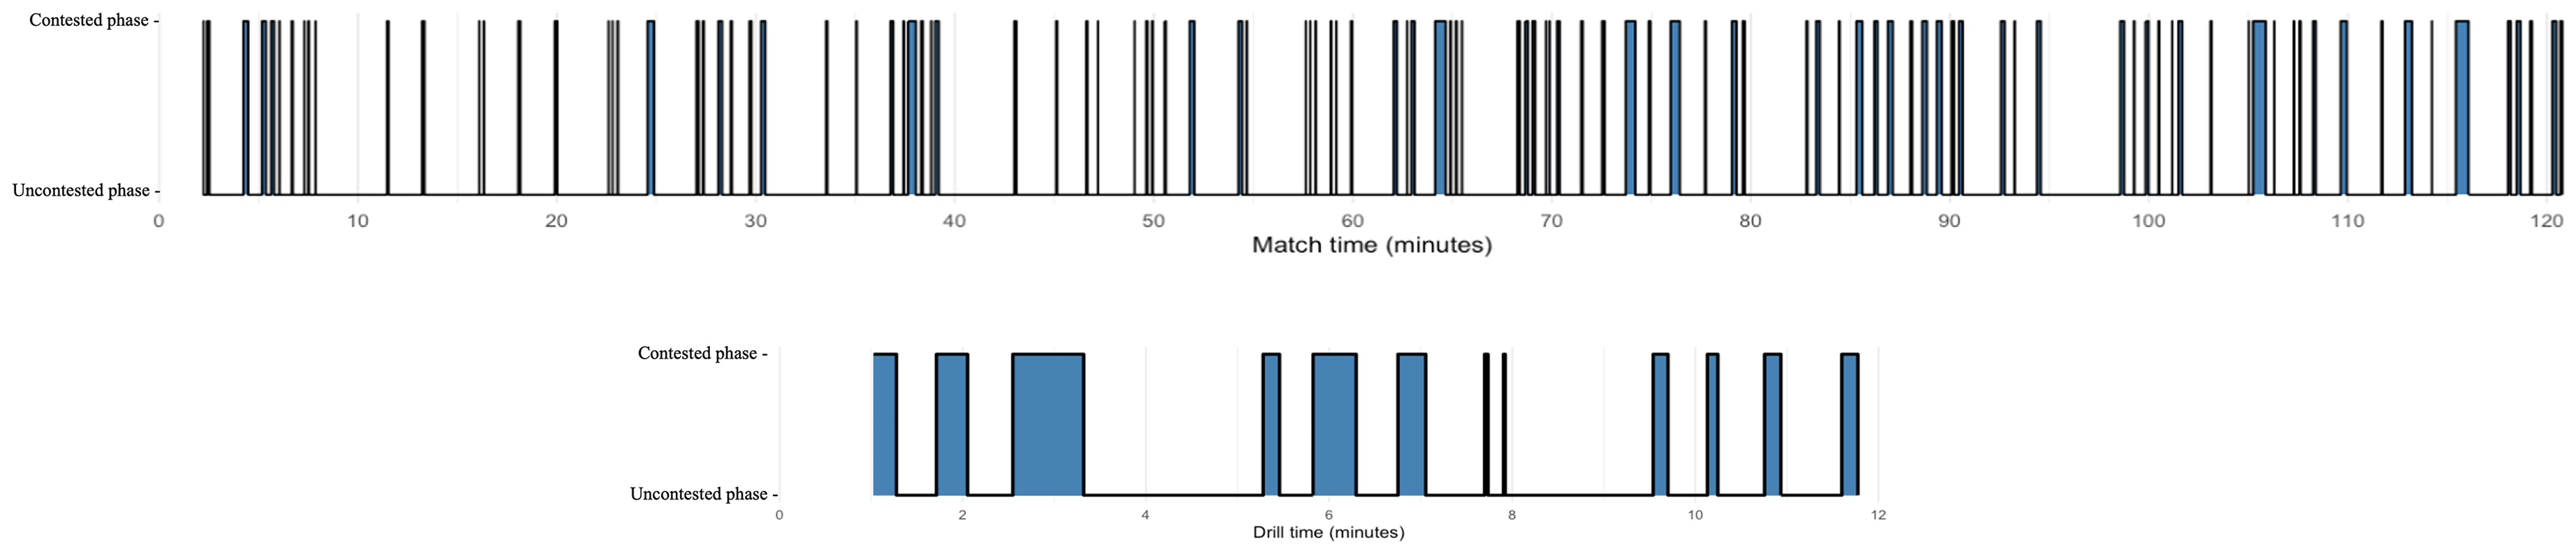
Example distribution of contested phases for one match and one drill from the same week. The timeline (in minutes) is displayed on the x axis, with the vertical lines indicating the occurrence and duration of each contested phase of play.
Data processing
There were 678 training drill possessions, and 4140 match possessions included in the dataset. From the raw values, two datasets were created for analysis – one focused on frequencies (i.e., the regularity of a possession variable per minute) and the other focused on proportions (i.e., the amount a variable occurred as a percentage of all possessions per minute).
Frequency dataset. This dataset standardised the contested phases of play by time to account for the time difference between contested phases in the training drill and AF matches. Frequency per minute was calculated for each possession variable. This type of data has typically been used for comparing the density of behaviours for training and match variables.6,7,8
Proportion dataset. The second dataset detailed the amount a possession variable occurred relative to the other variables within the same category per minute. For instance, the percentage of kicks that occurred was recorded as a percentage relative to all disposal types (i.e., kick, handball or tackled with no disposal). This approach can provide insight into the overall structure of the phases of play, opposed to the frequency of events. 10
Outcome variables for each possession were collapsed into effective (hit, goal, behind, no score), neutral (neutral disposals resulting in a stoppage or offence retaining possession), or ineffective (miss or disposals resulting in a turnover).
Statistical analysis
Data was analysed with the R programming language in RStudio software (version 2022.12.0). Descriptive statistics (mean [M] ± standard deviation [SD]) were calculated for all standardised variables. Normality was assessed using Shapiro-Wilk tests and violin plots and consequently, non-parametric analyses were utilised. Significance was set at p < .05 for all tests unless otherwise stated. To test for differences between the level of pressure for the training drill and matches, Mann Whitney U tests were performed using the average pressure points for each of the 11 training drills and matches from the raw dataset. A multivariate analysis of variance (MANOVA) was conducted to assess whether disposal effectiveness (i.e., disposal outcomes) differed between the training drill and matches for both the standardised frequency and proportion datasets. Subsequent Mann-Whitney tests and effect sizes were used to determine which of the disposal outcomes (i.e., effective, neutral, or ineffective outcomes) were significantly different between performance settings. As multiple comparisons of were conducted between disposal efficiency outcomes, a Bonferroni correction was applied to the alpha level of .05, with the corrected level to achieve significance being set at p < .017. Finally, to test for differences between possession characteristics in high-pressure phases of play between settings, Mann-Whitney U tests and effect sizes were also used for both the frequency and proportion datasets. Effect sizes (reported as Rank-Biserial Correlations) are interpreted as small (r = .10–.30), medium (r = .30–.50) or large (r = .50–1.0). 18
Reliability
An intra-rater reliability test was completed by an analyst at the AF club who recoded approximately 10% of the training sessions (n = 1 training drill) and matches (n = 1 match) approximately three months after the 2024 AF season concluded. Cohen's Kappa was used to assess the intra-rater reliability for all possession variables. All possession variables produced Kappa values between .806-.982, indicating almost perfect agreement. 19
Results
Raw values, standardised frequencies, and proportions were calculated for disposal variables during contested phases of play (see Table 1 in Supplementary Material).
Pressure points
Figure 3 displays the average pressure points per possession during contested phases of play in matches and the training drill. The average pressure points in matches (median = 2.34) were significantly higher than in training (median = 2.02), U = 18.0, z = –2.791, p = .004, r = .581.
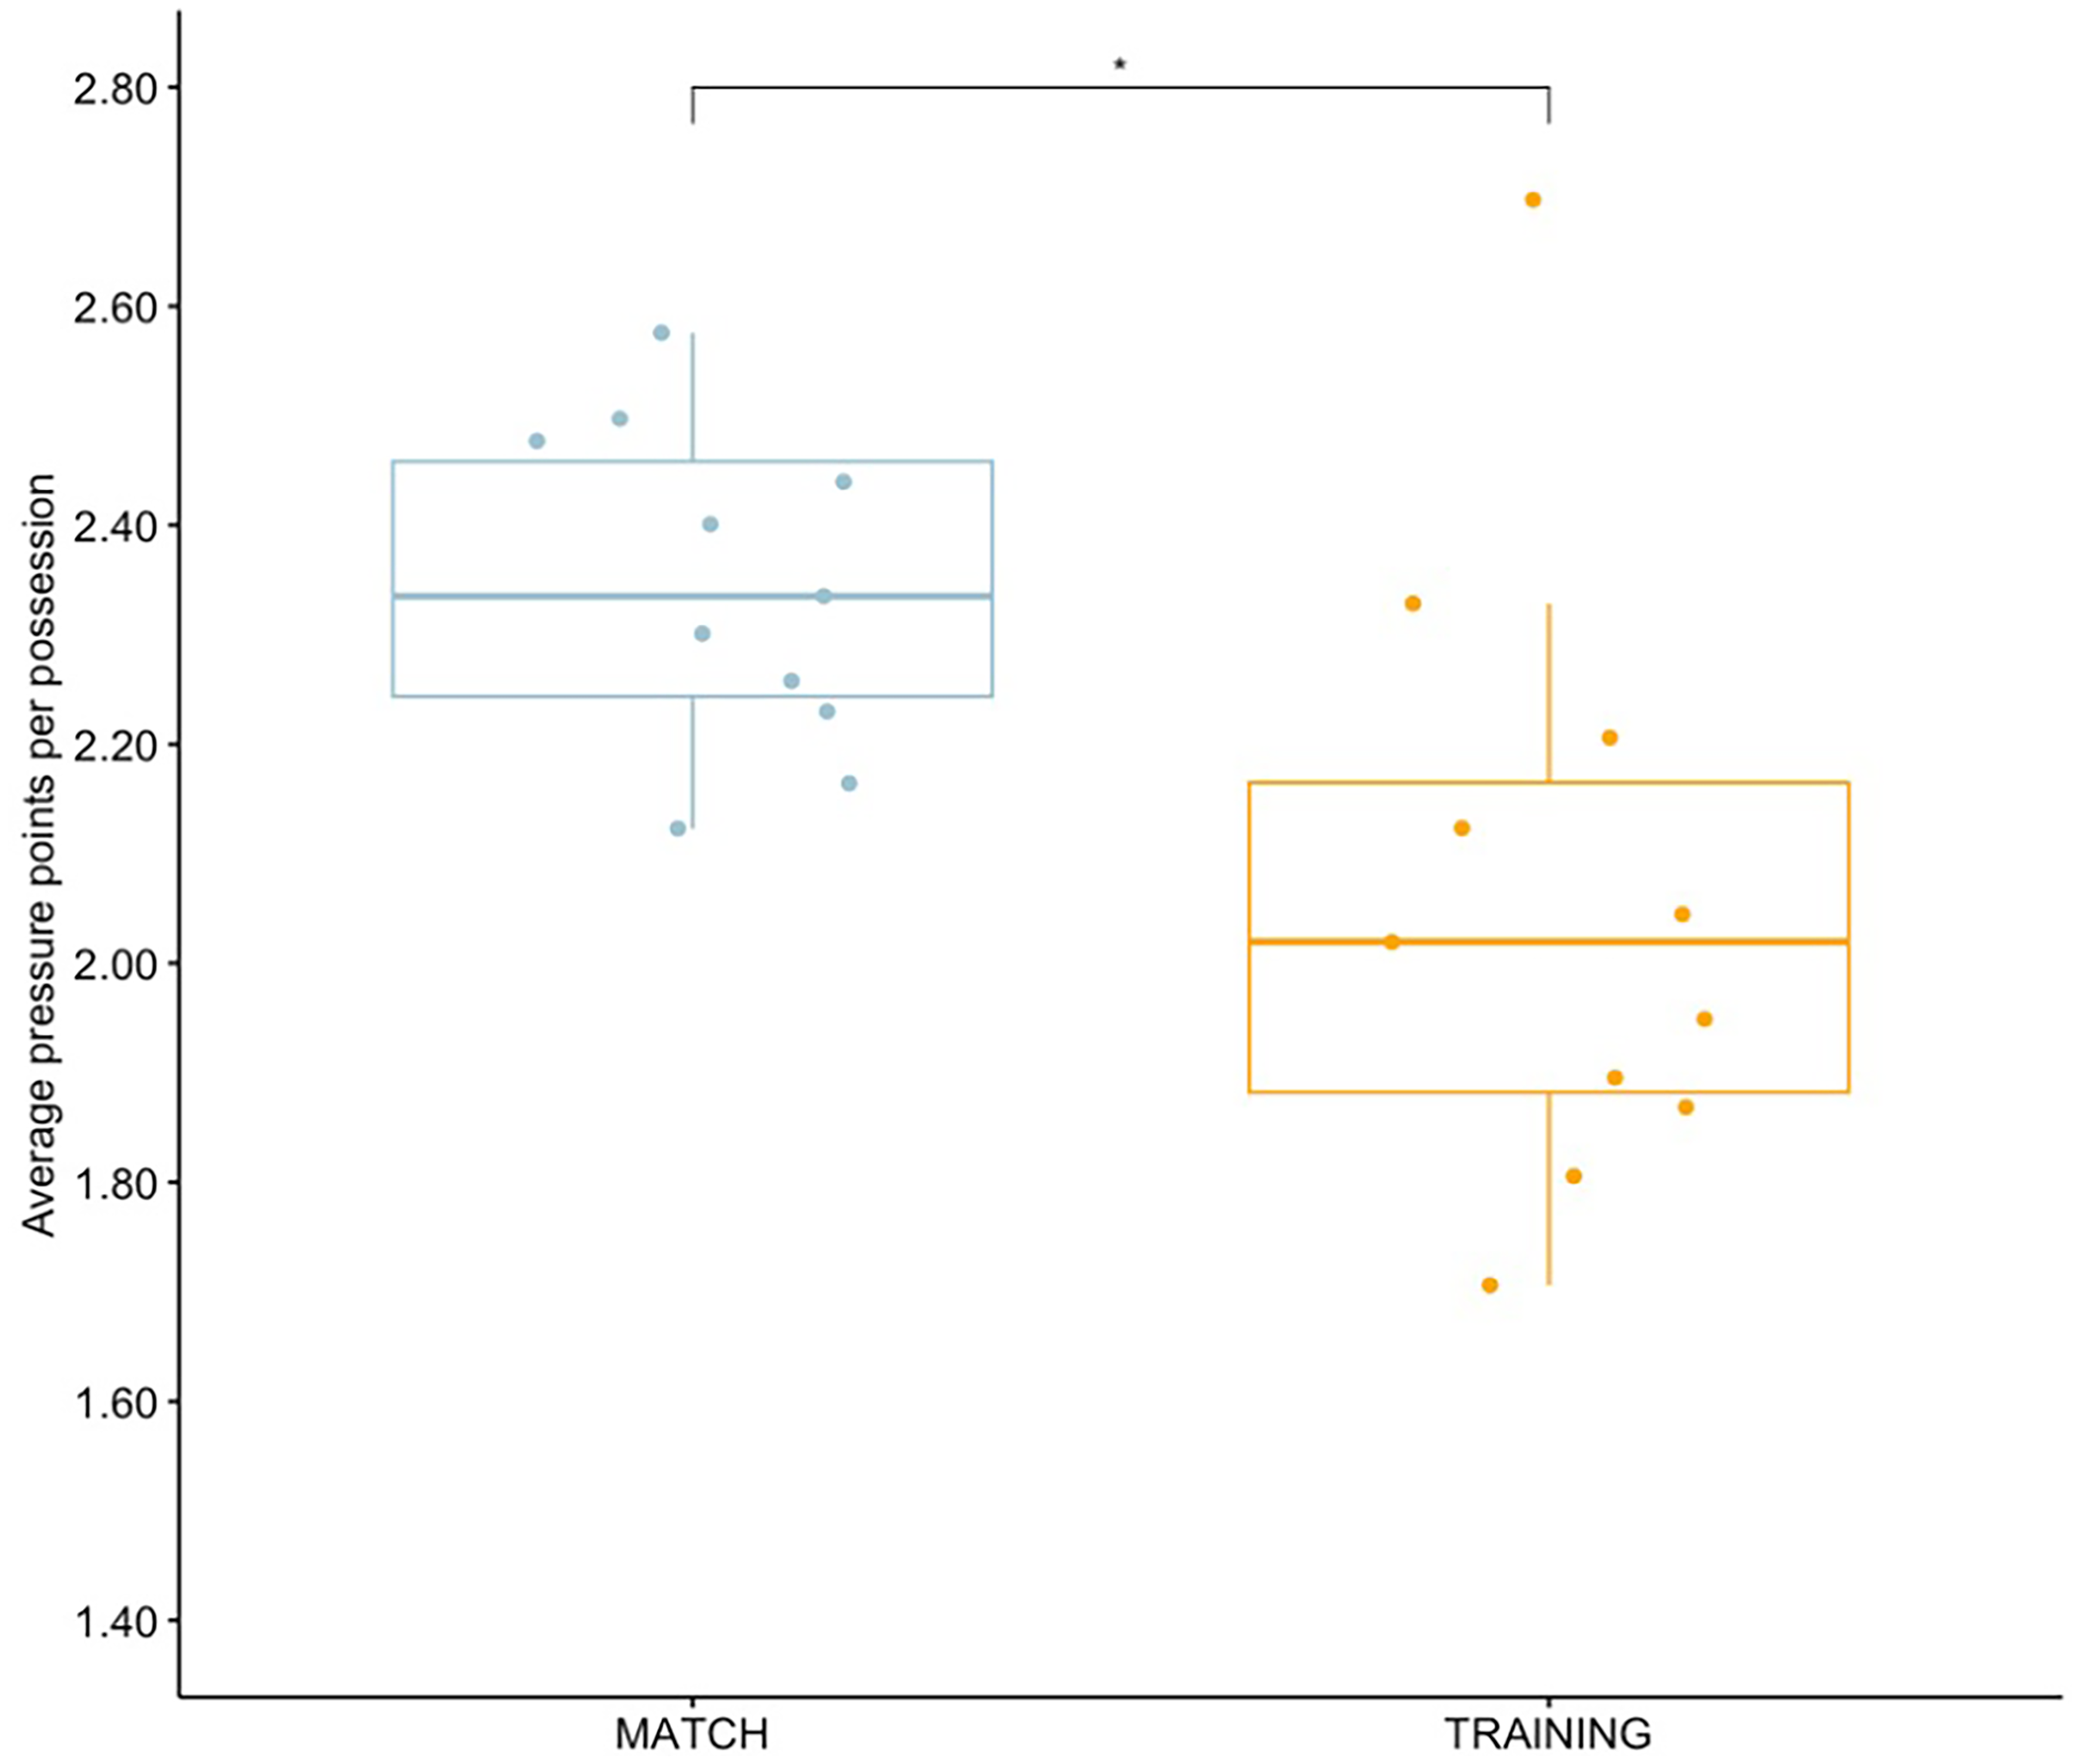
Average pressure points per possession during contested phases of play. * Indicates significant difference (p < .05).
Possession characteristics
Significant differences were identified between the training drill and matches for 31 out of the 36 variables analysed for the frequency per minute of possession characteristics in contested phases of play (see Table 2). Most possession characteristics had significantly higher frequencies per minute in matches, except for marks, possession durations greater than 3 s and possessions under no pressure, which occurred more often in training. There was no significant difference between matches and training with respect to the frequency of possessions of 2–3 and >3 s, possessions with one opposition, superior receiver density, or shots at goal (see Figure 1 in Supplementary Material).
Mann-Whitney test results for frequencies of possession variables per minute during contested phases of play.
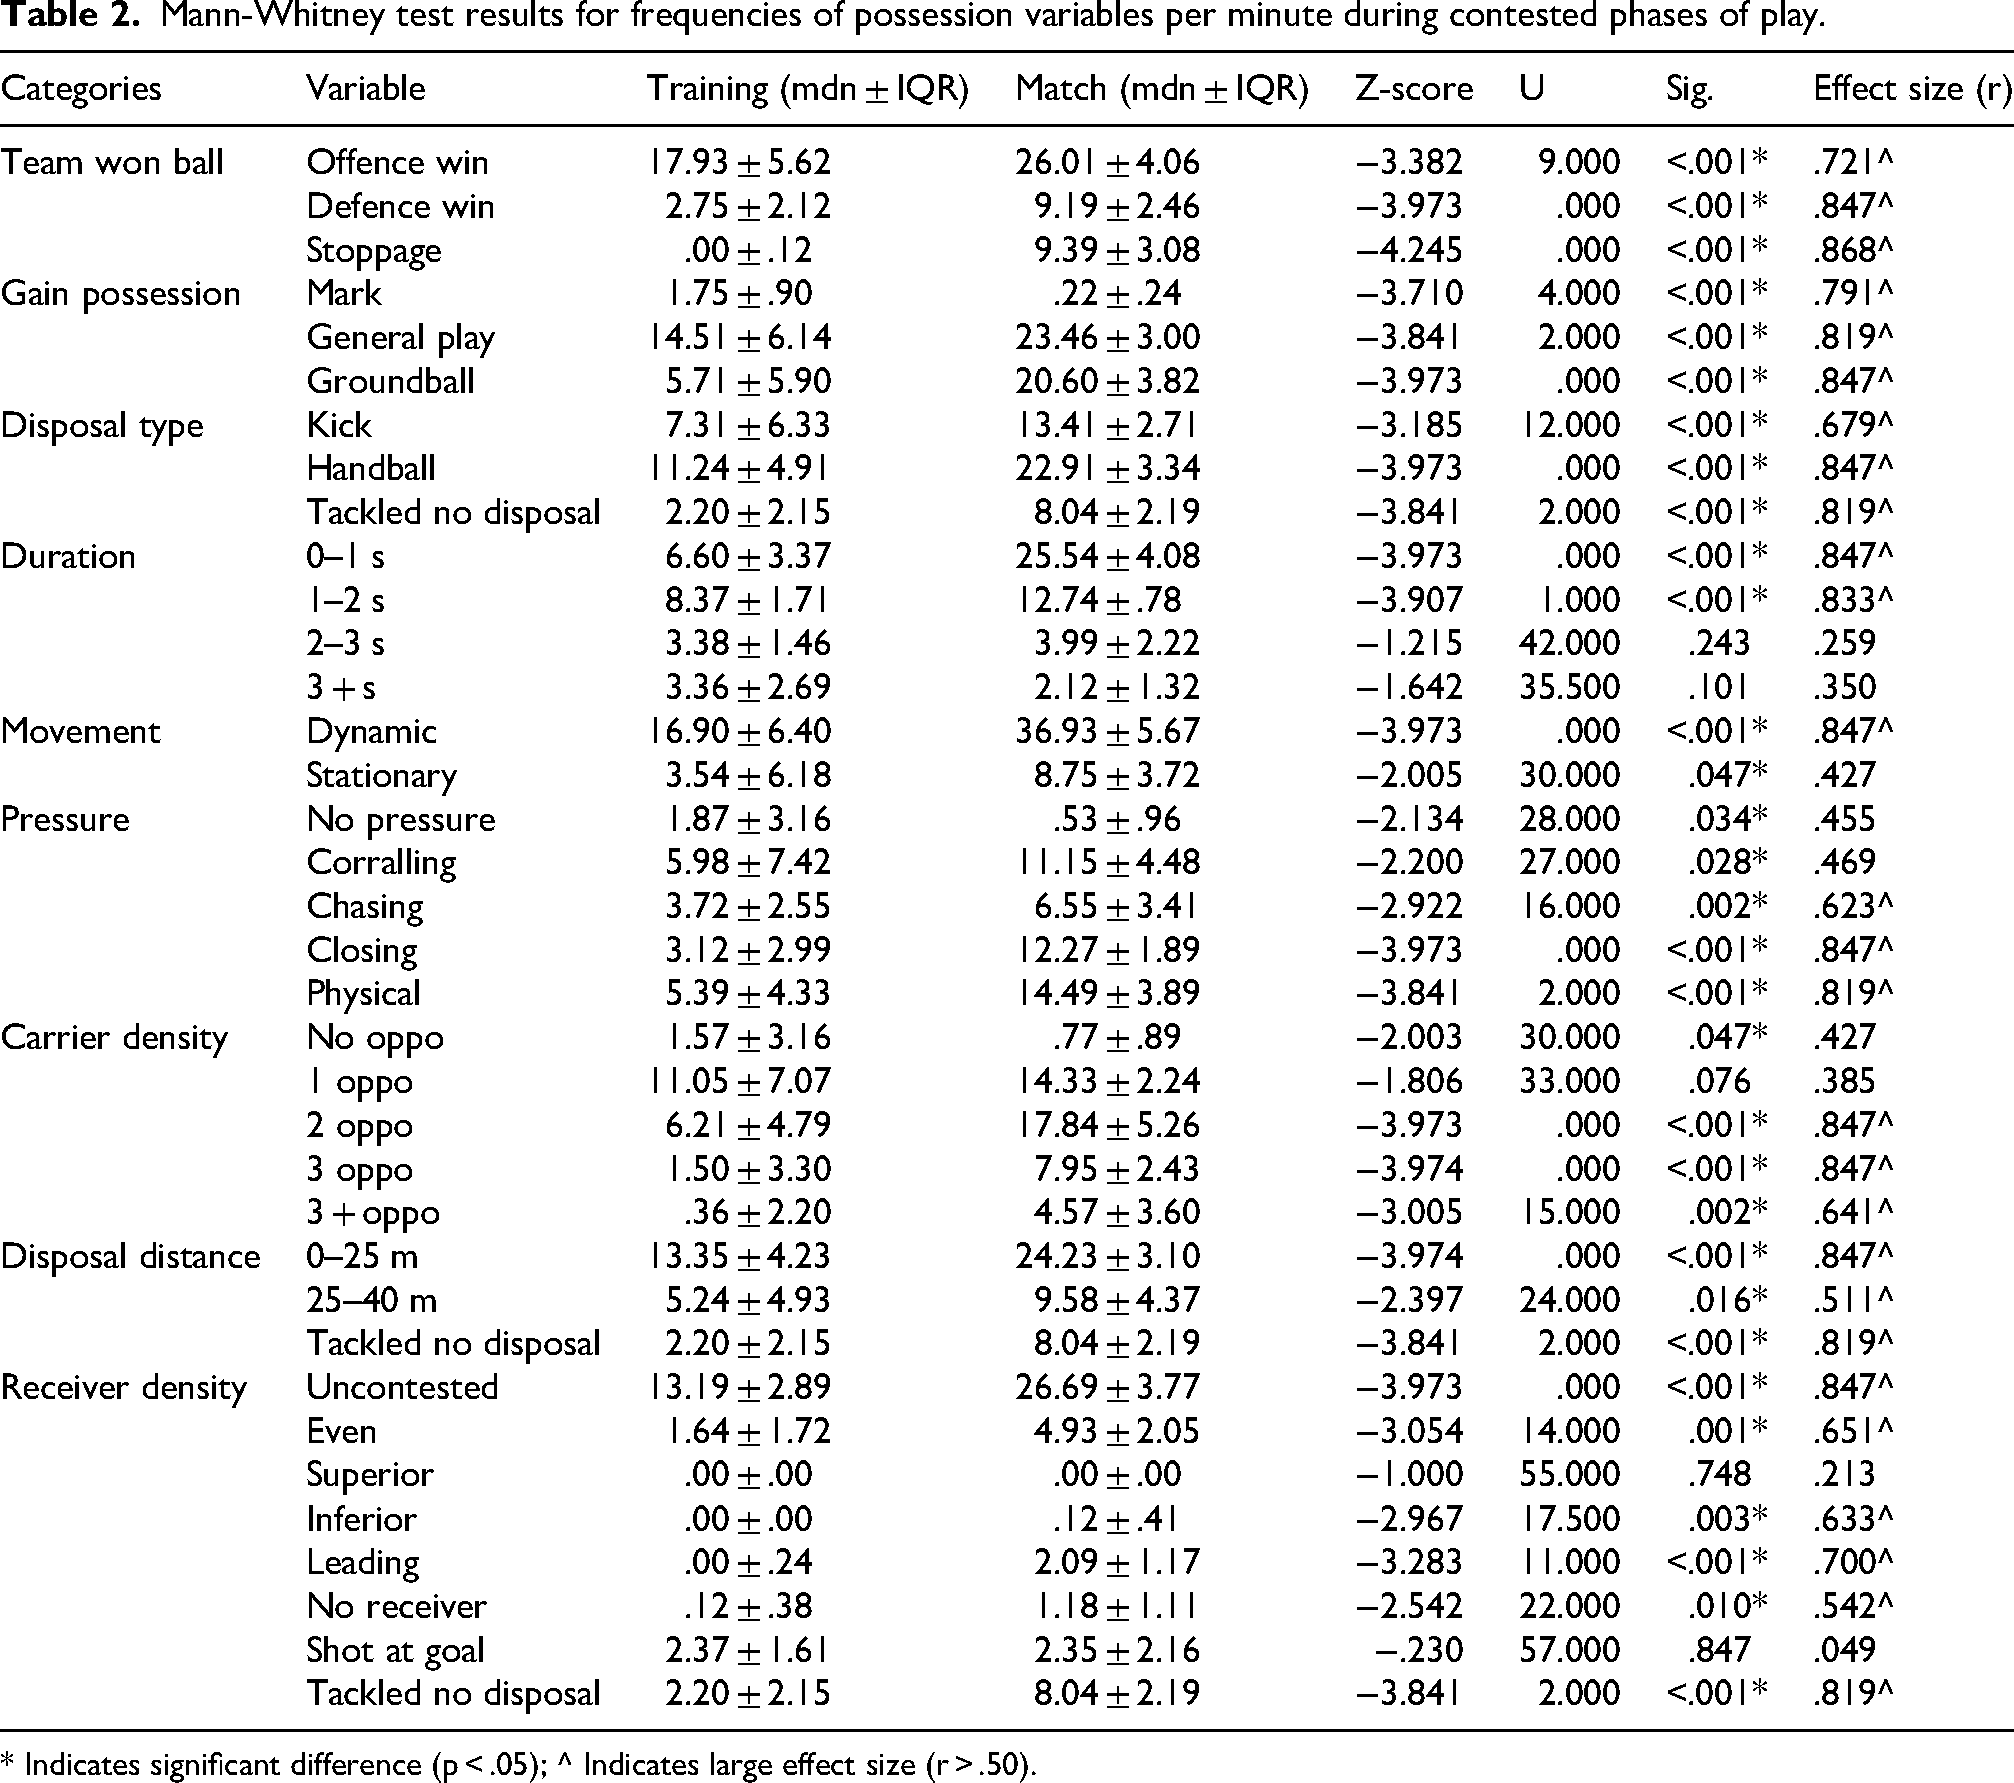
* Indicates significant difference (p < .05); ^ Indicates large effect size (r > .50).
Significant differences were also identified between matches and training for proportions of variable frequencies for 24 out of the 36 variables analysed in contested phases of play (see Table 3). Matches involved a significantly greater proportion of turnovers (i.e., defence wins) and effective tackles (i.e., tackled with no disposal). Further, matches produced significantly greater proportions of possessions with carrier densities of two, three, or more than three opposition, short durations (i.e., 0–1 s), and contested receiver densities (i.e., inferior or leading). There was no significant difference between settings for high, physical pressure. Training predominantly produced greater proportions of possessions with longer possessions before disposal (i.e., 1–2 s, 2–3 s, or >3 s), possessions under no pressure and carrier densities of no or one opponents.
Mann-Whitney test results for proportions of possession variables per minute during contested phases of play.
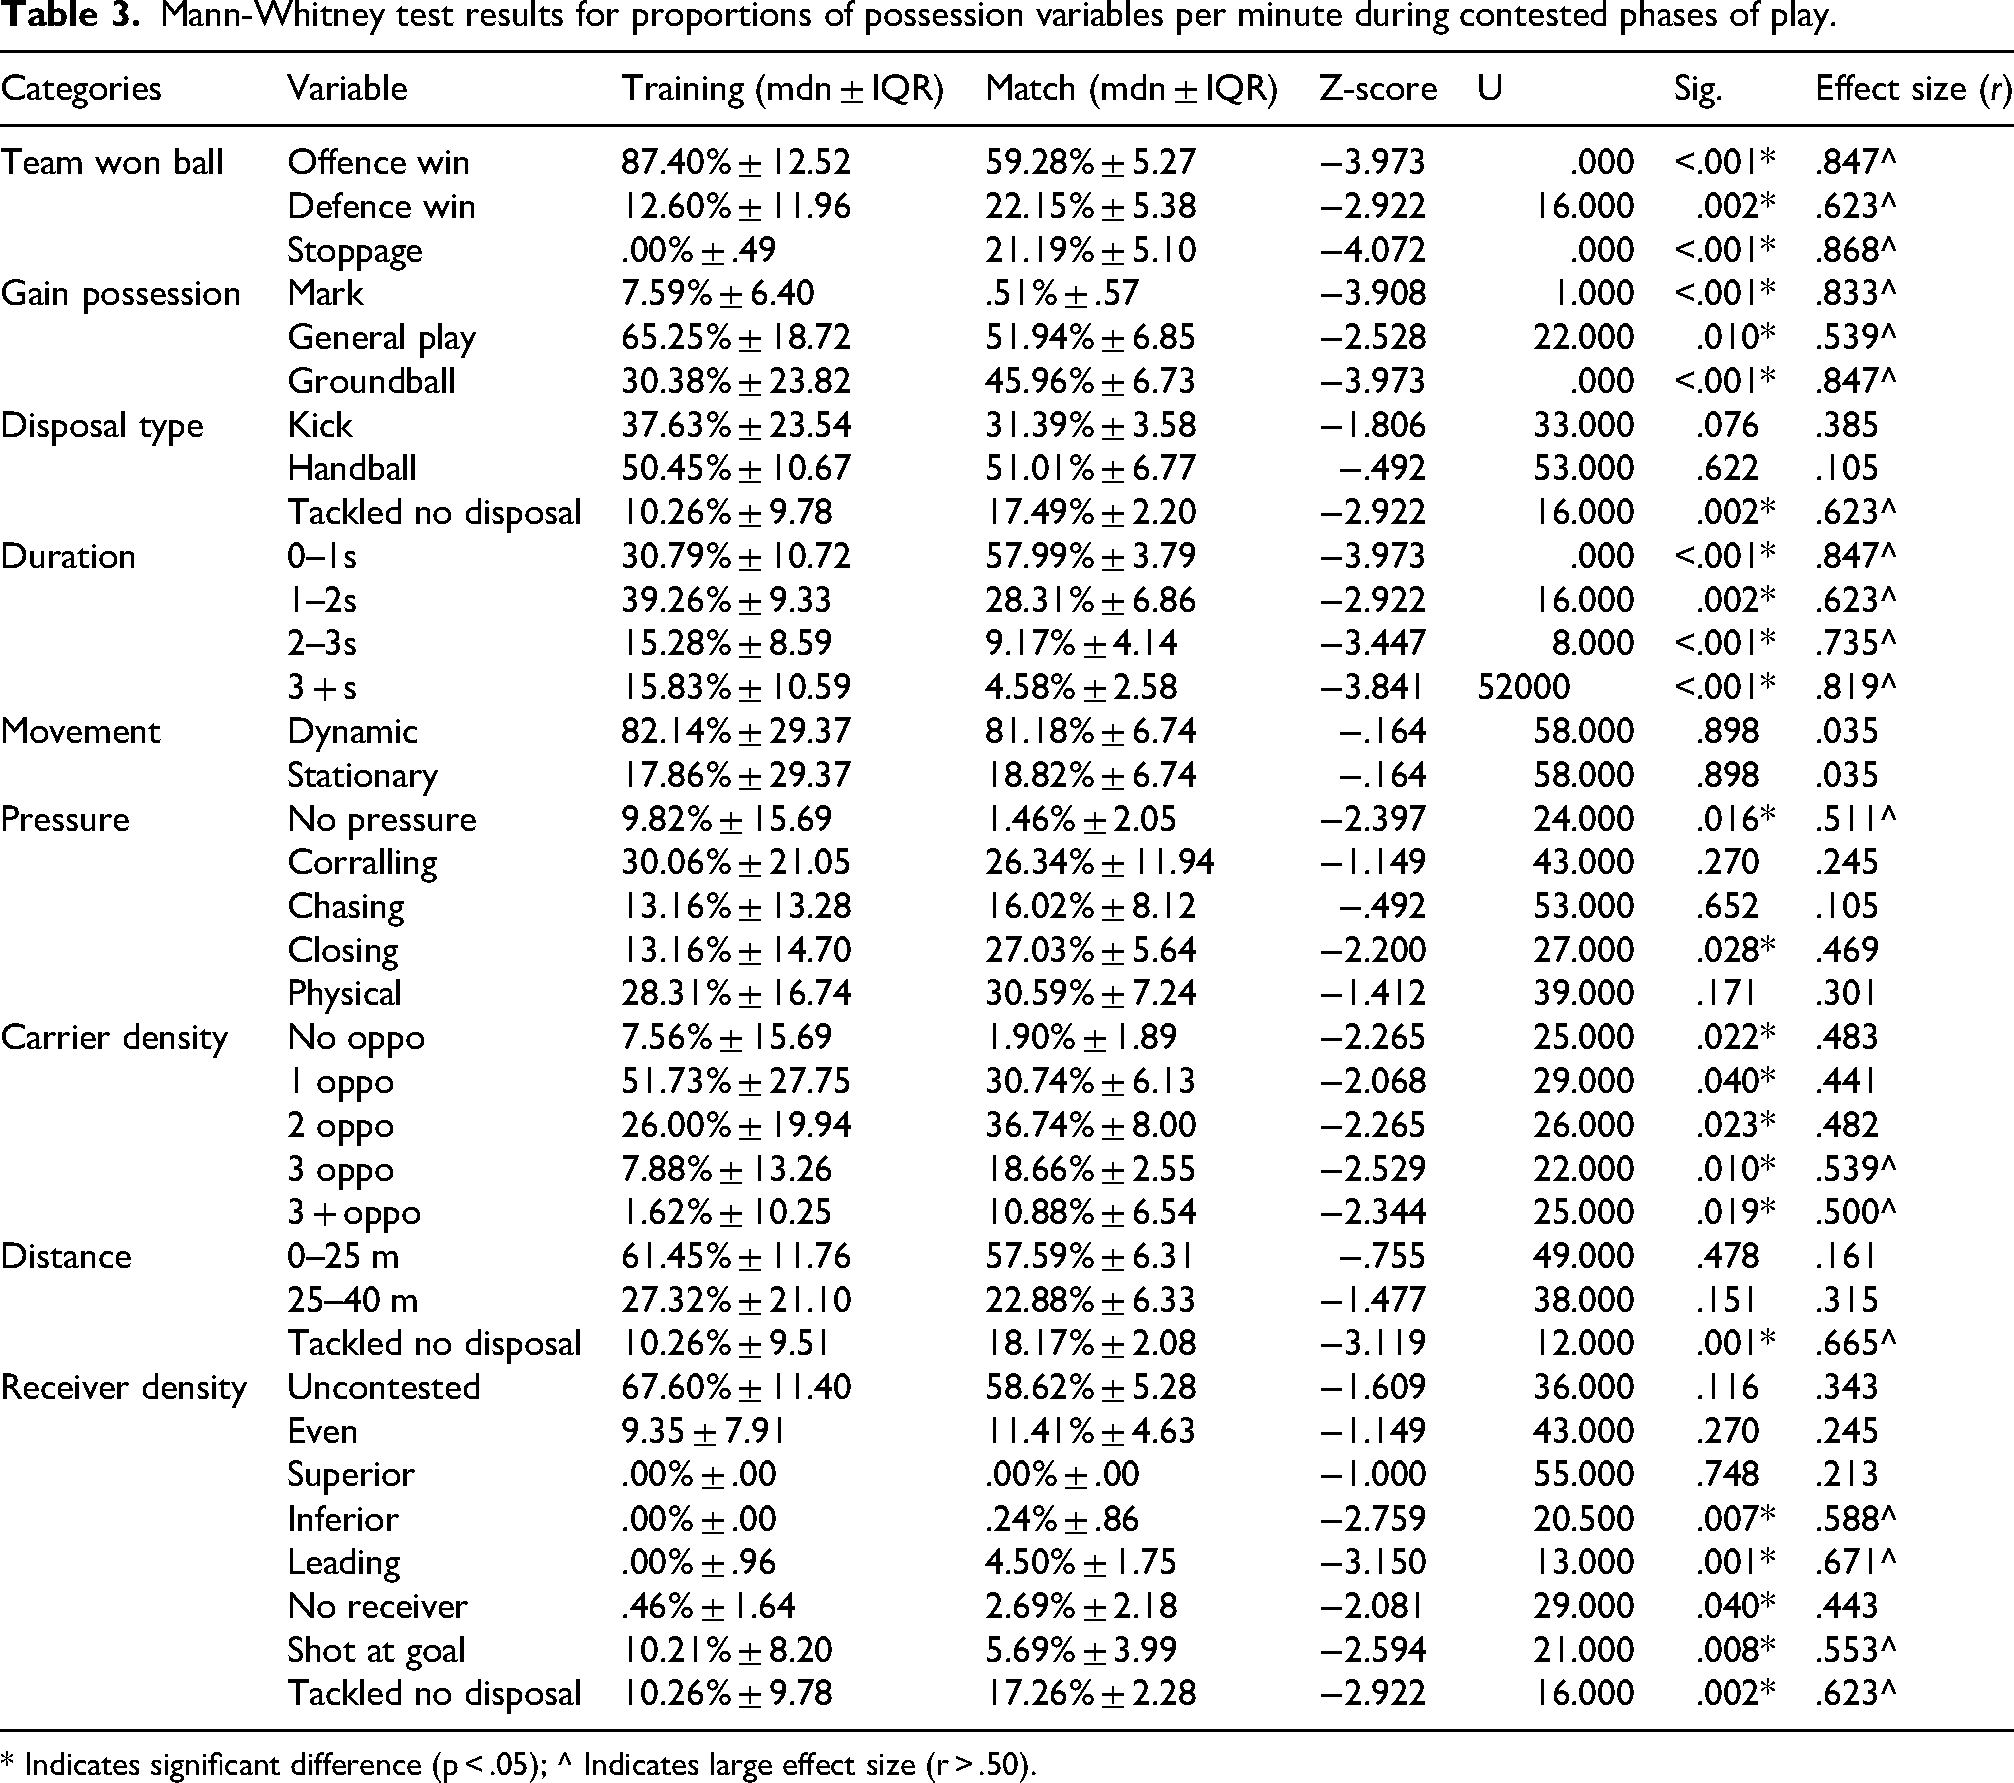
* Indicates significant difference (p < .05); ^ Indicates large effect size (r > .50).
Disposal outcomes
Results of the MANOVA examining frequency of disposal efficiency per minute revealed a significant overall difference between the training drill and matches during contested phases of play, V = .71, F(3, 22) = 78.704, p = < .001. Subsequent Mann-Whitney tests revealed matches produced significantly higher frequencies of effective (U = 2.000, z = –3.841, p < .001, r = .819), neutral (U = 4.000, z = –3.710, p = < .001, r = .791) and ineffective disposal outcomes (U = .000, z = –3.973, p = < .001, r = .847) than the training drill (see Figure 4).
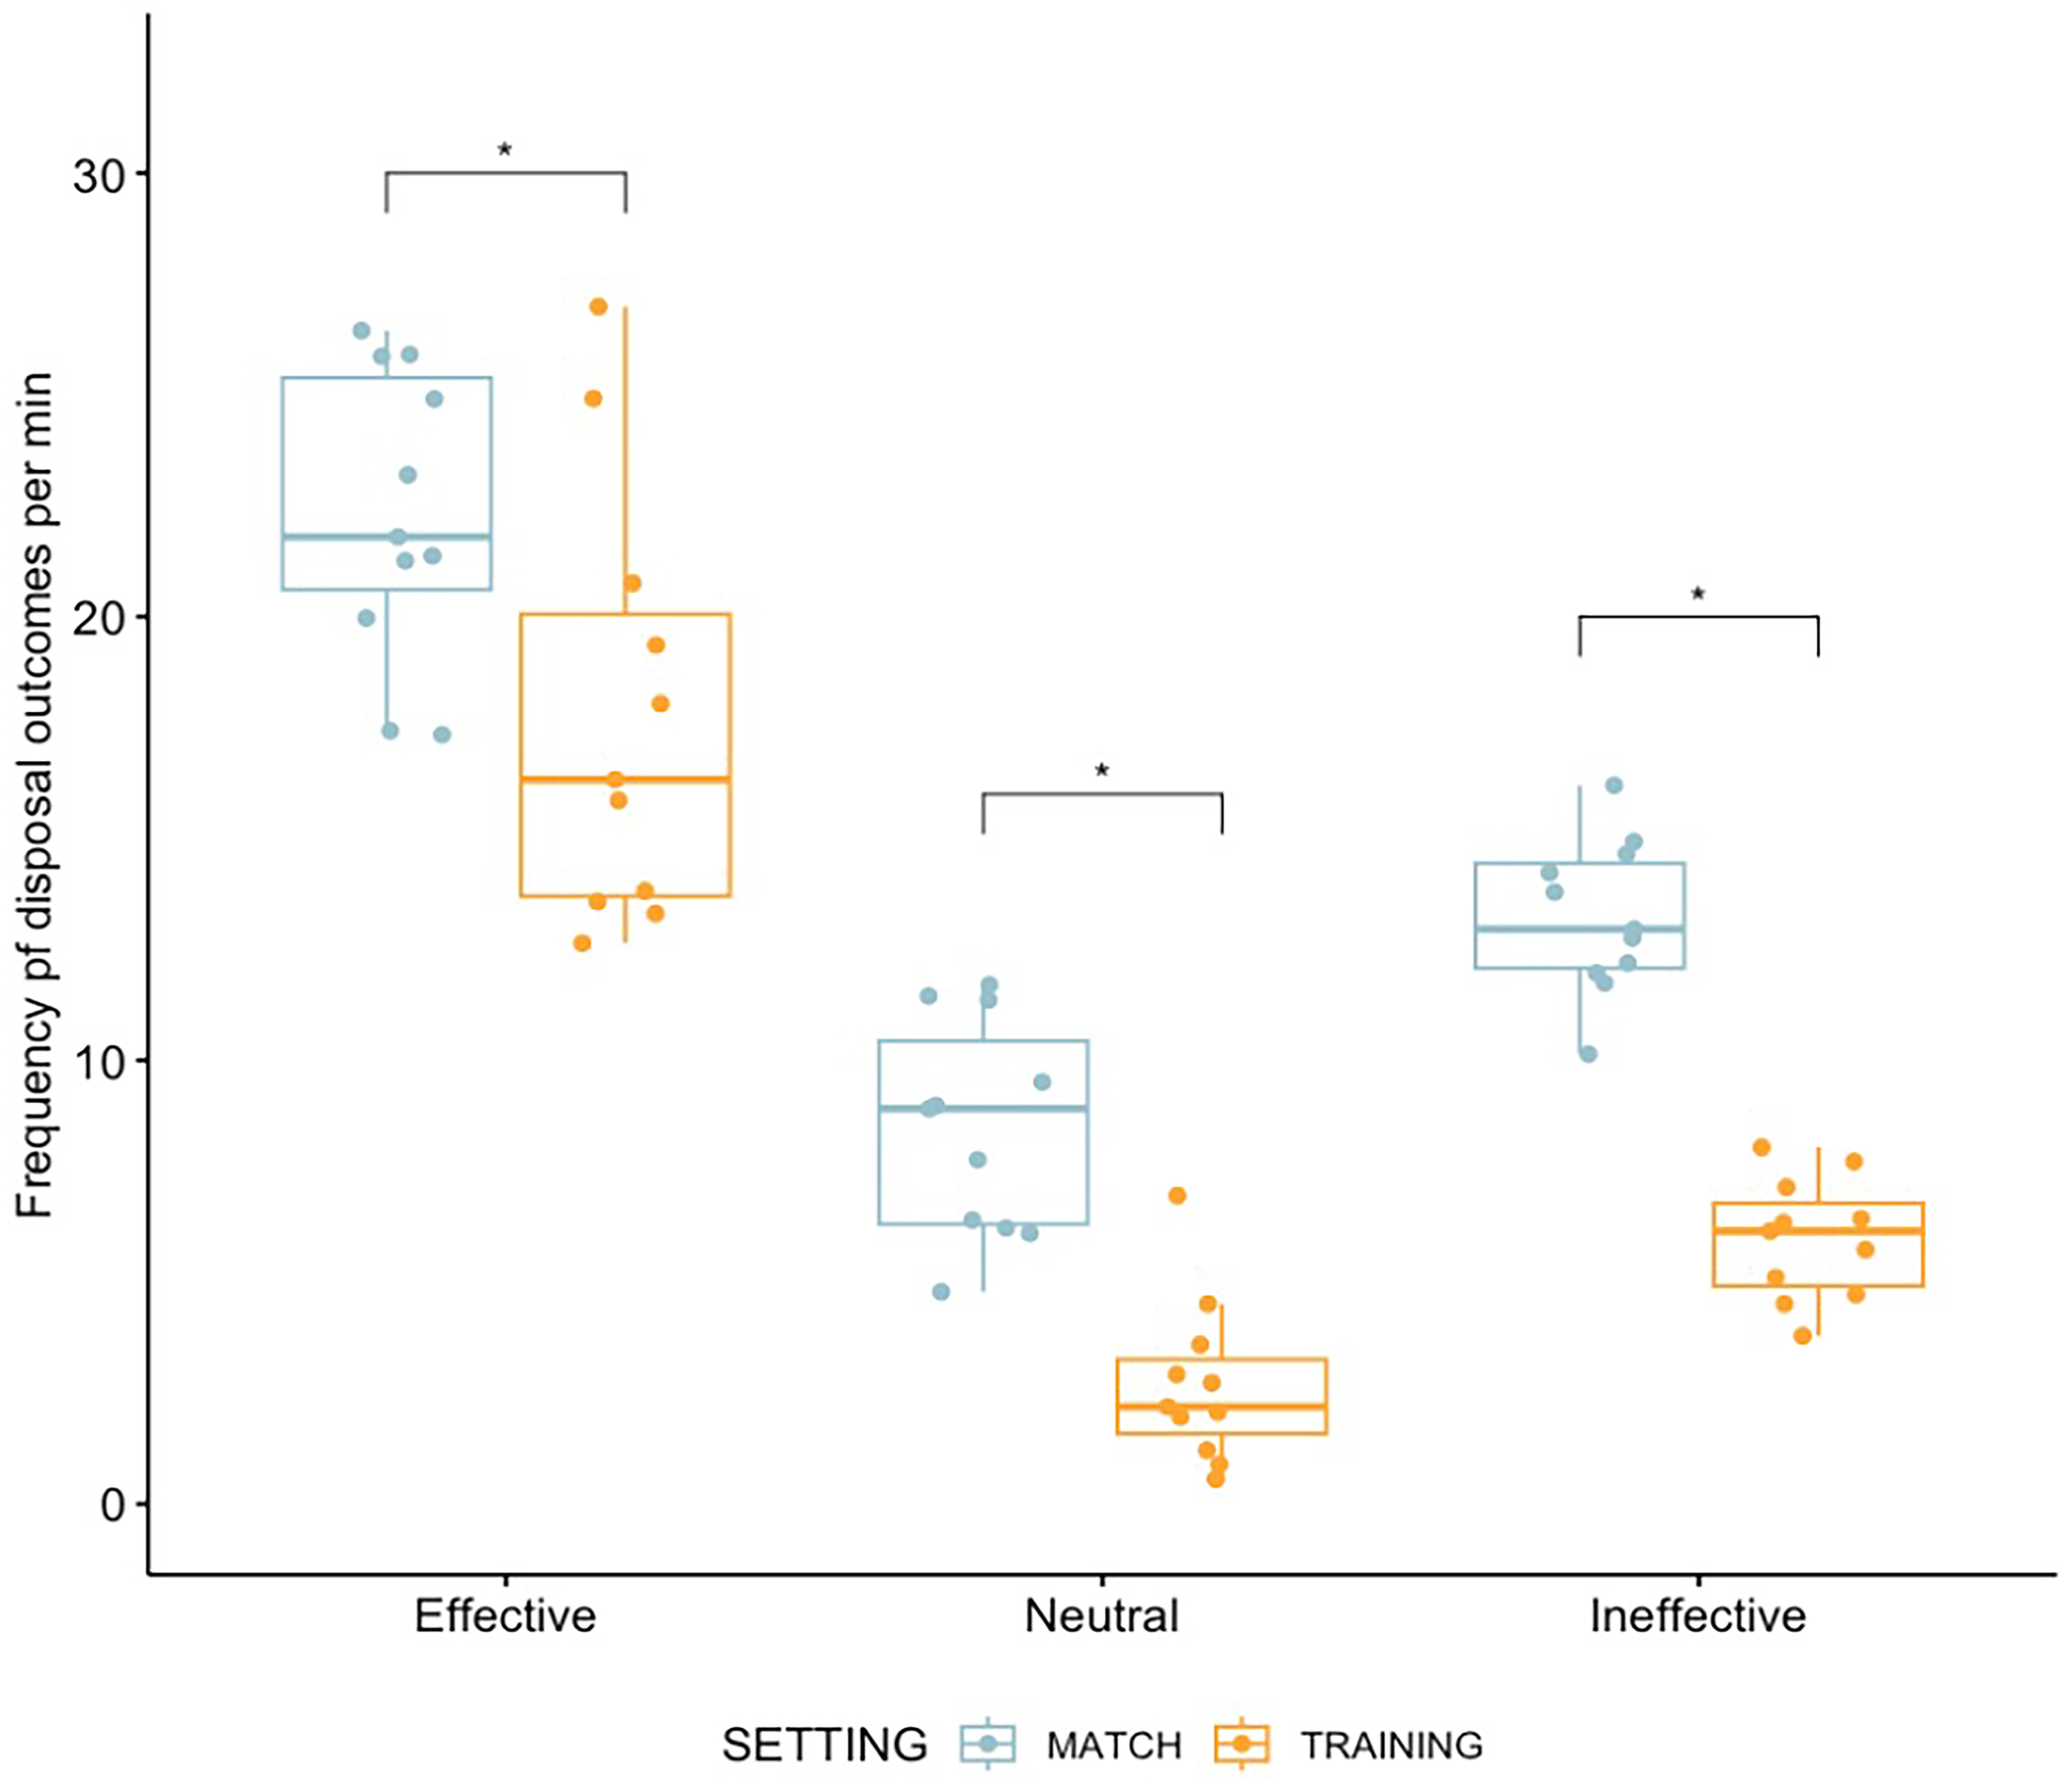
Frequency of disposal outcomes per minute in contested phases of play. * Indicates significant difference (p < .05).
When examining proportions of disposal outcomes per minute during contested phases, the MANOVA results revealed a significant overall difference between the training drill and matches, V = .371, F(3,22) = 10.183, p < .001. Subsequent Mann-Whitney tests revealed that during training there was a significantly greater proportion of effective disposals (U = 10.000, z = –3.316, p < .001, r = .707), whereas matches produced a significantly greater proportion of ineffective disposals (U = 24.000, z = –2.397, p .016, r = .511) and neutral disposal outcomes (U = 26.000, z = –2.265, p .023, r = .483) (see Figure 5).
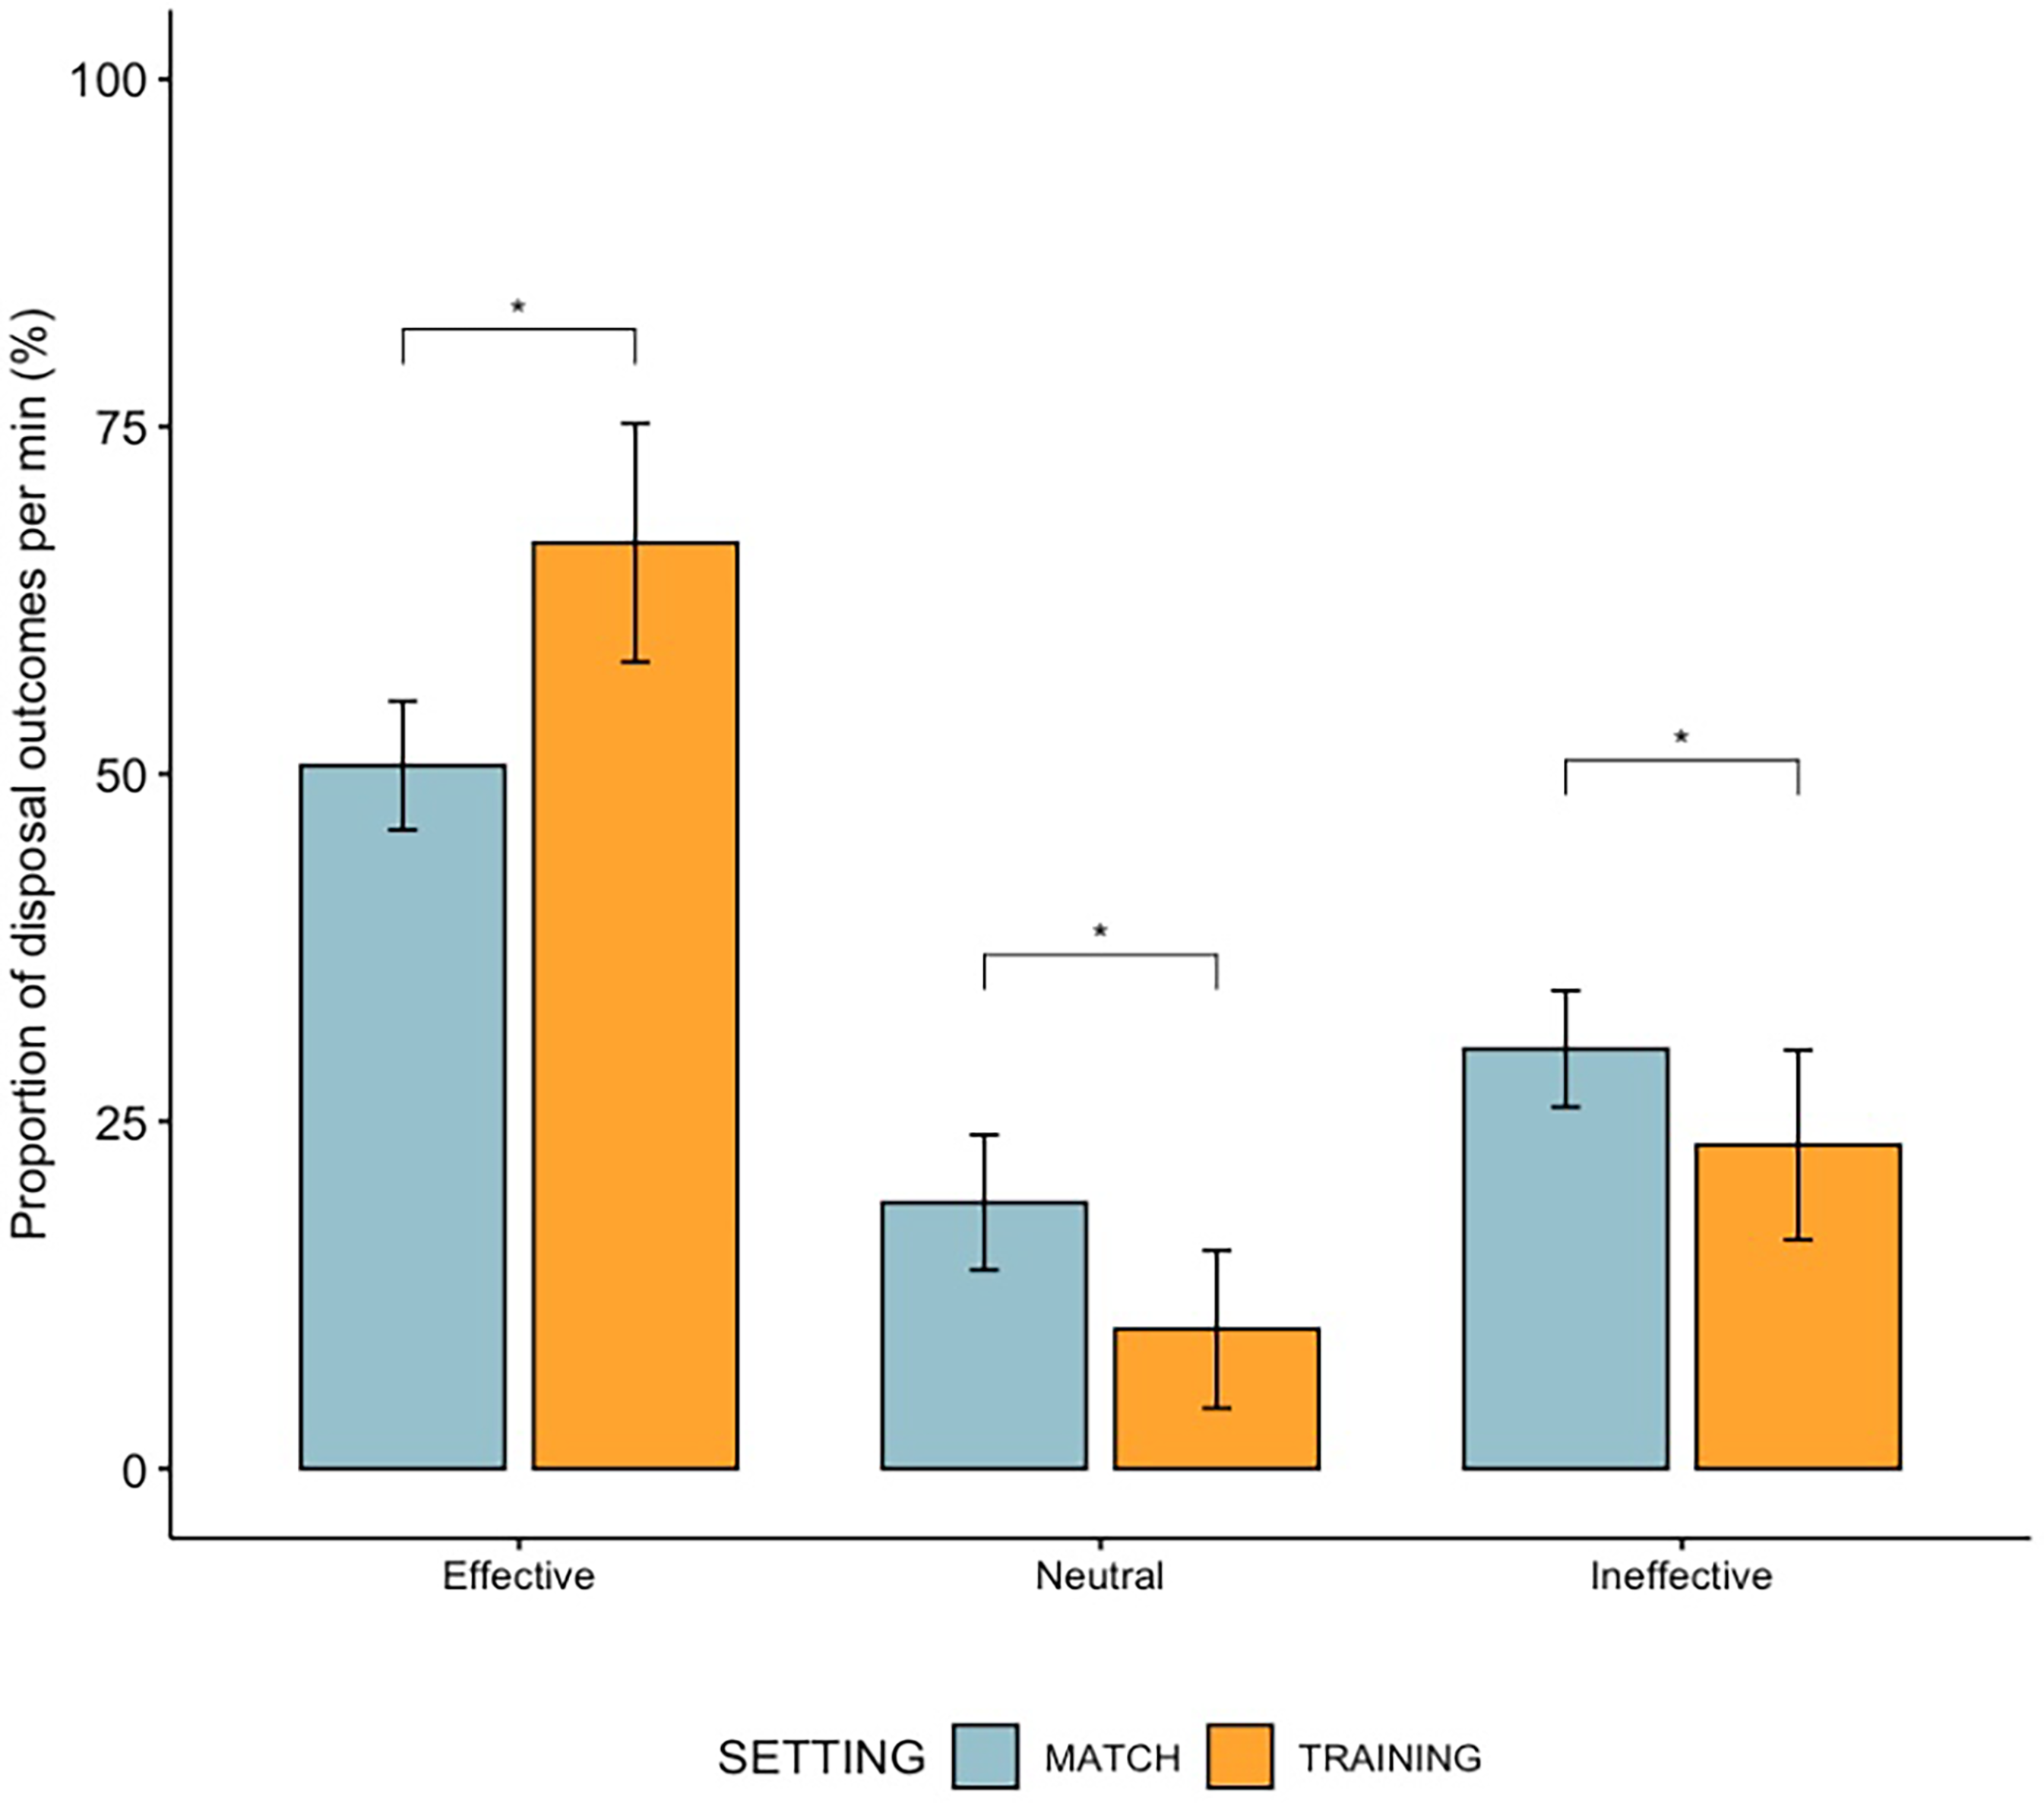
Proportion of disposal outcomes per minute during contested phases of play. * Indicates significant difference (p < .05).
Discussion
The primary aim of this study was to evaluate the representativeness of a training drill designed to replicate the high-pressure conditions of contested phases of AF matches. Focusing on the pressure point metric revealed that contested phases of matches produced a significantly higher average possession pressure point value than the training drill. The two datasets (i.e., frequency and proportional) provided insights into the density of behaviours and trends in the structure of contested phases, respectively. When examining possession characteristics relative to frequency per minute, training produced significantly lower frequencies than matches for most variables. The proportion dataset provided deeper insight into the structure of the contested phases of play, revealing matches produced significantly higher proportions of variables associated with high-pressure, and subsequently greater proportions of both neutral and ineffective disposals, while training disposals had predominantly effective outcomes.
Findings from this study are like those of Bonney et al. (2020) who found that training produced a greater proportion of effective disposals than matches. The improved disposal efficiency in training suggests that the drill was not as challenging as a match and subsequently, the amount of transfer of behaviour may have been limited. 20 This is also supported by the finding that the average pressure point score was higher in matches compared to training. While previous research has not used the pressure point metric (Champion Data, 2019), findings are generally consistent with the current study, with training typically consisting of much lower frequencies of high, physical pressure acts than matches.7,12,13
During high-pressure moments, the training drill produced significantly lower frequencies than matches for possession characteristics associated with high pressure (i.e., turnovers, effective tackles, physical or closing pressure, carrier densities of two or more than three opposition, and possession durations of 0–1 s). These results likely reflect the higher density of possessions per minute seen in match phases of play, indicating that the training drill was insufficient in replicating match demands for frequencies of high-pressure variables. Given no significant difference was found between matches and training for frequency of lower-pressure variables (i.e., carrier density of one opposition, and chasing or corralling pressure), these were likely overrepresented in training. This is supported by the proportion dataset results, with matches showcasing more events associated with higher pressure, such as tackles, turnovers, high carrier densities (i.e., two, three, or more than three opposition nearby the ball) and shorter possession durations (i.e., 0–1 s). The training drill also produced significantly greater proportions of other low-pressure variables, including low carrier densities (i.e., one or no opposition), longer possession durations (i.e., >1 s), and uncontested receiver densities. These findings collectively suggest that the training drill might not have been successful in replicating the structure of the contested, high-pressure conditions of matches. Rather, the training drill had a less-challenging performance environment in which players had more time and space to dispose of the ball and subsequently, made more effective disposals.
The current study differs from previous research as it focused on one specific high-pressure drill and phase of match play, while previous studies analysed a variety of game-based training activities.6,7,9,10,12 Despite the novel approach, the conclusions of the current study align with those of previous research, finding pressure to be lower in training. Similarly to the current study, previous research generally found matches to produce more physical pressure, shorter possession durations, turnovers, and tackles, while training produced more possessions with low carrier densities, no or corralling pressure applied and long possession durations.6,7,9,10,12
Collectively, from a methodological perspective, these results highlight how different methods of measurement will influence the perceived representativeness of a task. 21 In the current study, two datasets were created for analysis; frequency data, which has typically been used in previous research,6,7,8 and proportion data, which has been less commonly used. 10 Interpretation of the frequency and proportional results may lead to different conclusions, with measures of frequency providing insight into the density of behaviours, while proportional results offer insight into the overall structure of a phase of play. This raises the question of what it means for a task to be truly representative, and how this can best be quantified. Similar to the current study, previous studies have typically found there to be some overlap for frequencies of possession variables between training and matches, while other variables had large differences. The conclusion is typically that tasks producing similar frequencies of match possession variables are more representative. However, a potentially more important consideration is whether the structure of training tasks (i.e., the information available and the proportions of behaviours being produced) reflect those of matches. 21 One of the main purposes of training is to increase athletes’ exposure to situations they need to improve or refine, depending on the specific aim of the drill. The proportion results revealed trends in the structure of the high-pressure moments, showing variables associated with high-pressure to have been significantly underrepresented in training compared to matches. Coaches should therefore be clear on the aim of training drills and the outcomes they hope to achieve (i.e., producing similar frequencies of events or similar overall structures of a phase of play), which can be used to guide analysis of representativeness. The findings of the current study also support the regular evaluation of training, and highlight the need for co-design of training drills between coaches and skill acquisition specialists to promote effective use of constraint manipulation. This will allow coaches to identify whether their training design is achieving the desired outcome, and subsequently update drill design and constraints to better reflect game demands, improving the effectiveness of training. For practitioners lacking the resources to complete notational analysis data collection at the scale of the current study, simplified methodologies may be employed, in which only key metrics related to the specific phase of play being practiced are recorded. For example, an inside-50 entry drill may focus on metrics such as player density inside the forward 50, or the percentage of uncontested marks taken inside 50 in training, compared to games. There is also scope for AI to be used to enhance notational analysis by automating, accelerating, and personalising aspects of performance analysis. For example, AI models (e.g., computer vision) can be used to automatically capture the metrics used in this study by removing the need for manual workload. However, the cost may still be prohibitive for those outside of professional environments.
While the study provides novel insights into representative learning design for high-pressure moments, there are limitations which future research should look to address. First, the high-pressure moments of matches were subjectively identified by club coaching staff from the original training and match footage. Indeed, this subjectivity could potentially limit the validity of match data. Future research should consider using machine learning models to classify contested phases of play from various data inputs (e.g., event tagged data, GPS, etc). These methodologies may then be used to evaluate the representativeness of other phases of play (e.g., offensive inside-50 entries). Second, weather was not recorded during data collection, which may have influenced performance as there are often more contested phases of play and pressure acts during wet conditions. Third, contextual factors present in matches such as the influence of the scoreboard and crowd,22,23 as well as opponent quality and playing style 24 were not considered. Future research may benefit from examining the impact of including contextual factors such as these on the training environment and athlete behaviour. For example, Maloney et al. found that the addition of a scoreboard during taekwondo training increased athletes’ cognitive and somatic anxiety, and emotional intensity. This also influenced their behaviour, with athletes’ technique selection becoming more predictable in the presence of this situational information. 25 In the same way, such contextual factors may act as a competitive incentive in AF training, and help to simulate the affective demands of matches, potentially improving the representativeness of training drills.
Conclusion
Overall, the results indicate that the training drill was not entirely representative of match demands for high-pressure moments, with less challenging conditions in training resulting in different behaviours being produced to those in matches. Subsequently, transfer of behaviour to matches may have been limited. However, different measures of representativeness enable varied results and subsequent interpretations. Measures should be selected based on the intended outcome of a training drill (i.e., whether coaches are aiming to merely replicate match-like frequencies of events or create a similar overall structure of a phase of play) to provide the most meaningful insights.
Supplemental Material
sj-pdf-1-spo-10.1177_17479541251388822 - Supplemental material for Evaluating the representativeness of a small-sided game for high-pressure phases of play in elite Australian football
Supplemental material, sj-pdf-1-spo-10.1177_17479541251388822 for Evaluating the representativeness of a small-sided game for high-pressure phases of play in elite Australian football by Sarah Green, David P Broadbent, Tim Buszard, and Lyndell Bruce in International Journal of Sports Science & Coaching
Footnotes
Acknowledgements
The authors would like to thank the club who participated in the project for providing the dataset for analysis.
Ethical considerations
An ethics exemption was granted from the Deakin University Human Research Ethics Committee (2022-351) as the study involved analysis of retrospective, deidentified data.
Funding
The authors received no financial support for the research, authorship and/or publication of this article.
Declaration of conflicting interest
The authors declared no potential conflicts of interest with respect to the research, authorship, and/or publication of this article.
Data availability
Supporting data is not available due to commercial restrictions.
Supplemental material
Supplemental material for this article is available online.
References
Supplementary Material
Please find the following supplemental material available below.
For Open Access articles published under a Creative Commons License, all supplemental material carries the same license as the article it is associated with.
For non-Open Access articles published, all supplemental material carries a non-exclusive license, and permission requests for re-use of supplemental material or any part of supplemental material shall be sent directly to the copyright owner as specified in the copyright notice associated with the article.