
Abstract
This review highlights the relationship between maturity status, body composition and fitness performance in women's football. The scoping review protocol was registered on the Open Science Framework (osf.io/6wvm5).The literature on growth and maturation in female football players was scoped on PubMed, SCOPUS and Web of Science between February 2023 to April 2025. Studies were considered if they were on, or if they included female football players less than 17 years and included indicators of biological maturation. Two reviewers (FB and BK) selected studies and extracted data. Forty-six studies met the criteria. Regarding maturation the mean age at peak height velocity (APHV) ranged between 12.5 and 12.4 years and the mean age at menarche between 13 and 12.8 years. Body composition varied according to maturation status. Early maturing players are heavier and have greater fat mass than the late maturing ones. Concerning physical performance it was observed that, countermovement jump improved after the PHV, as did change-of-direction ability; for pre-PHV players greatest improvements were observed in sprinting performance and anaerobic endurance. Coaches should consider maturity status while programming their training sessions, not only to adapt their training load more rigorously but also to prevent injuries. However, scientific research on the growth and maturation of female football players is still limited and most of the studies carried out did not consider the players’ training age.
Keywords
Introduction
The description of growth and maturation are determined by changes in body size, shape or functional ability. Growth is related to changes in body dimensions, meaning increases in size in the whole body or in particular body parts.1,2 Growth can be measured and tracked using anthropometric measurements. Maturity means a state throughout a long maturation process which ends after obtaining an adult or any other final state considering all tissues, organs and systems or the limit of the functional capabilities of each one.1,2 Maturity is assessed with maturity indicators which must be universal, as they are required to be present in normal healthy children and follow a continuous process. 2 Regarding maturity, careful consideration should be given to both timing and tempo. The first, timing is related to the time occurrence of a specific event (e.g., age at peak height velocity, age at menarche or maturity offset – distance to the peak height velocity).3–5 Tempo can be determined using maturity timing indicators, and relates to stages/status of biological maturation (e.g., early, “on-time”, late, pre- or post-menarche, secondary sexual characteristics stages). 5 Maturation tempo and timing have great variability. In a group of different individuals of the same chronological age, some might be early maturing while others “on-time” or late maturing.
Since 2019, participation in women's football has increased by 24%, encompassing approximately 16.6 million players. This rise has been accompanied by a progressive professionalisation of the sport (i.e., football in Europe, or soccer in North America). 6 This has led to an increased investment in the women's game. Specifically, FIFA 6 has the goal of reaching 60 million players by 2026, by implementing football in schools or encouraging each member association to outline women's football strategy, and by promoting competitions and developing youth tournaments. Additionally, to FIFA's goals, UEFA wants to increase professionalization of players, referees and coaches and to promote women's football in traditionally men's football clubs. 7
As a consequence of this amplified interest in women's football a growing participation of youth players is observed. The growing youth players’ participation along with the professionalization of the sport enhances the importance of the talent identification process in women's football. However, only a small number of youth players reach professional levels, with Datson et al. 8 reporting that only 22% of academy players progressed to competitive teams. Clubs invest in talent identification and development programs in order to prepare the players for the demands of the game and to achieve victories at the senior level while increasing fans’ interest and recovering their investment.9–11 However, the period of youth development is a key stage of development within growth and maturation impacting the athletic development of youth players.12,13 Within male football the impact of growth and maturation has been well documented. 14 It has been reported that there is often a selection bias towards early maturing males as these players often express advanced physical attributes (i.e., strength, speed) which are often misinterpreted as “talent”.15,16 However, by giving more opportunities to older and more mature players, football may miss out on nurturing talented athletes, as early specialization and the resulting drop in self-confidence often cause late-maturing players to leave the sport.17–22 As a result of this system, the talent pool becomes smaller, which in turn lowers team quality, especially in countries where football is highly popular. 17 An alternative to the above system where groups are based on chronological age cut-offs, is to consider the growth and maturation process of each player.23,24 Despite all this, research has shown that being early maturing does not guarantee professionalization, and that late maturing males, who avoid deselection along their development career pathway, are more likely to obtain a professional contract than early maturing ones, emphasizing the importance of considering maturity status in the talent identification and development process.25,26 Another issue related to the increase in the number of talent identification programmes is rising the presence of the relative age effect (RAE). The relative age effect relates to the age differences observed in athletes within the same age group (e.g., an athlete born in January is 12 months older than an athlete born in December).18,19 Chronologically older athletes will certainly be at an advantage, because they will be more experienced and, in most cases, will have larger body dimensions. 1
Contrary to male counterparts, to date there is limited research that focuses on youth female players. This is a significant gap, given the well-documented sex differences in the timing of maturation and the associated hormonal, physiological, and biomechanical changes. These differences make it challenging to apply findings on males to females, as they may affect talent identification and development in distinct ways.2,16,27 According to a review by Kryger et al., 28 the majority of research on women's football refers to the study of injuries in senior players.
The combination of body composition, neuromuscular changes, and maturity variables, such as age at peak height velocity (APHV), skeletal age (SA), age at menarche (AM), together with the use of normative references of the study population, are tools needed to improve athletes’ development and adapt training to individual demands. 23 Therefore, the aim of this review it to scope available peer-reviewed literature regarding women's football and maturation. Understanding which are the maturation indicators applied in female footballers and the association between maturation, body composition and physical performance in these athletes, considering their competitive level.
Methods
Search strategy
A scoping review on growth and maturation in female football players was conducted following the Preferred Reporting Items for Systematic Reviews and Meta-Analyses extension for Scoping Reviews (PRISMA-ScR) guidelines. 29 Three different electronic databases were searched: PubMed, SCOPUS and Web of Science. For searching purposes, the combination of the following terms was used: “maturation“ or “biological age” or “peak height velocity” or “skeletal age” or “pubertal status” or “menarche” or “body composition” with “youth female football” or “youth female soccer” or “female football” or “female soccer”. The literature search was done at two different time points: the first search ended at 7th April 2023, then the authors opted to conduct a second search spanned from 2023 to the 4th April 2025 to update the paper.
The protocol for this scoping review was registered on the Open Science Framework (osf.io/6wvm5). No statement of consent was required for this paper.
Study selection
The selected literature was written in English, Spanish or Portuguese languages and included observational or interventional studies. The following inclusion criteria were applied:
The article sample should include female football players; When an article encompassed not only female football players, but athletes from other sports, the paper was only included if results were presented separately for each sport. This allowed the authors to extract data related to female footballers only; The age of the subjects in the articles should be aged 17 years or younger; The article must include indicators of biological maturation.
Initial screening was completed by title and abstract. Articles which didn’t include subjects’ sex distinction or were focused on male players were excluded. Narrative reviews were also excluded. Further exclusion was done following the full article read. To enhance the comprehensiveness of the review, additional studies were identified through citation chain searching, which entailed both backward citation searching (reviewing the reference lists of included studies) and forward citation searching (identifying publications that have cited the included studies). Two independent reviewers (FB and BK) assessed the studies (Cohen's κ = 0.79), the discrepancies in 9 articles were solved by a third reviewer (IF) was consulted. Figure 1 presents a flow diagram of the study selection process.
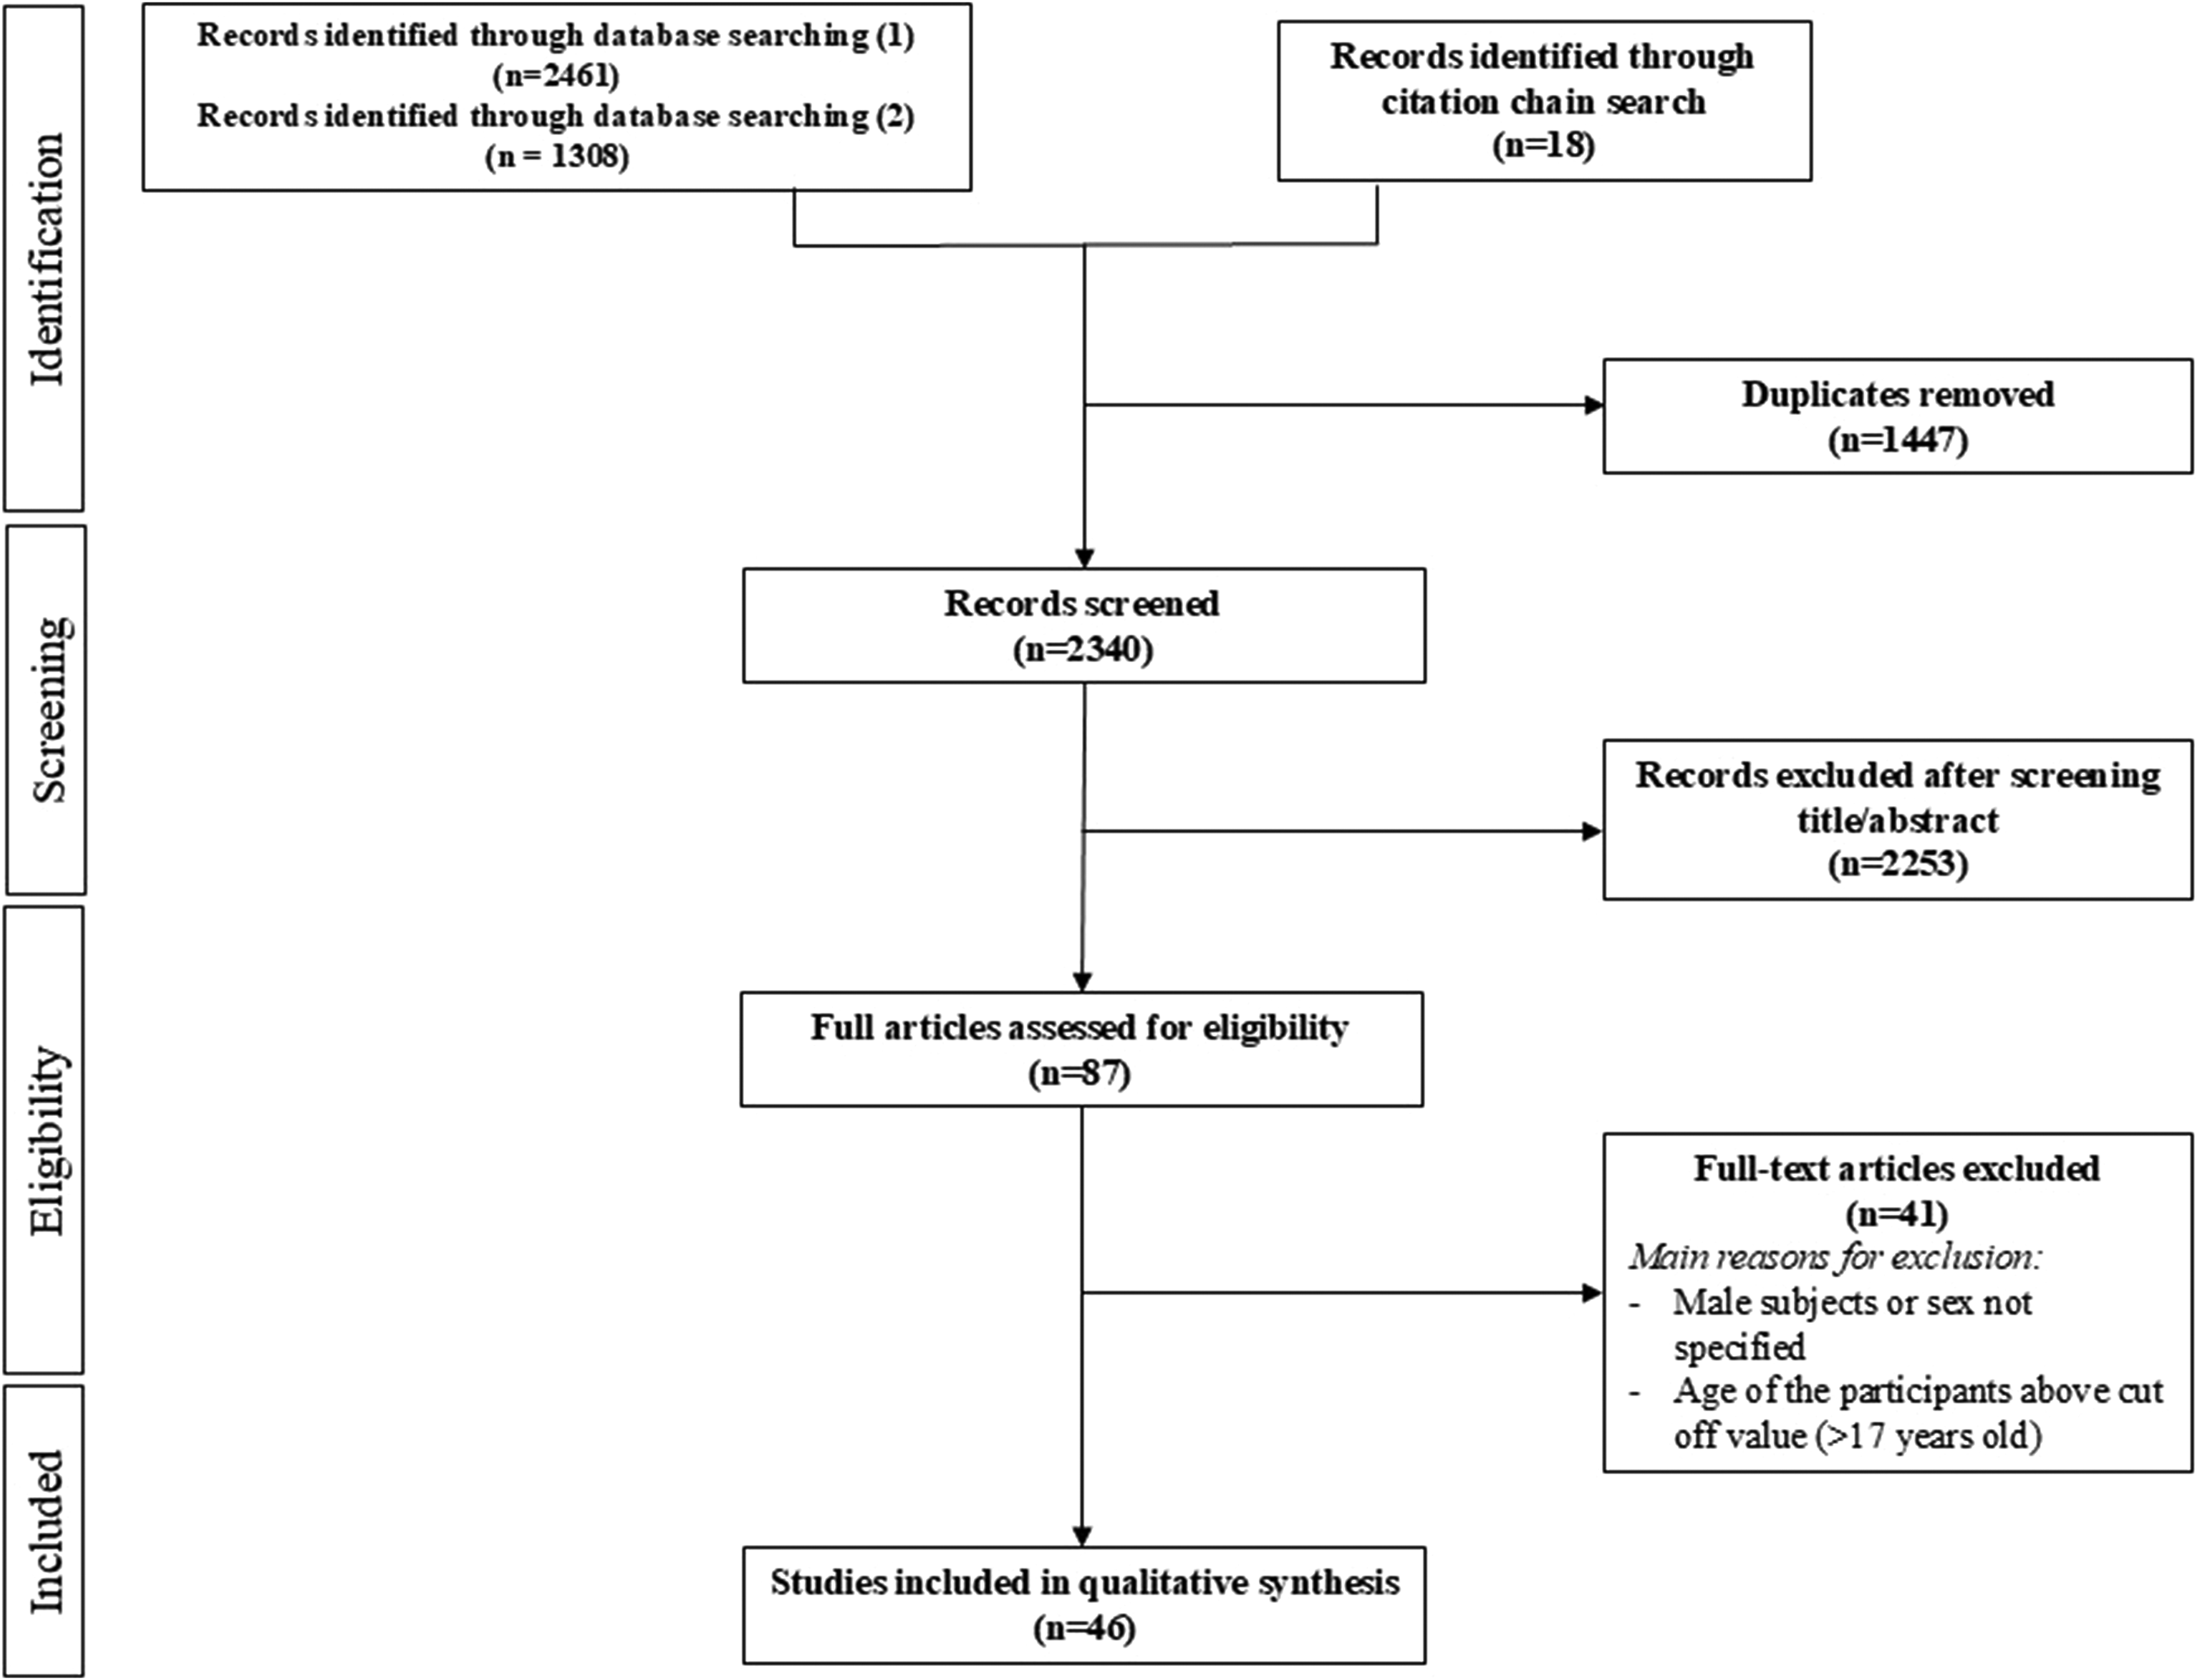
Flow diagram of study selection process for qualitative synthesis. Note. (1) First study search; (2) Second study search.
The main reasons for exclusion were the absence of data on biologic maturation markers and the restriction to male subjects only. The earliest article scooped was from 1996, so the research spanned from 1996 to 2025.
Data extraction
An Excel Spreadsheet (Microsoft, Albuquerque, New Mexico) was created to extract data from papers. One author (FB) extracted data and was confirmed by another author (IF) The extracted data included information on the authors, year of publication, country, sample size, chronological age of the participants, competitive level, duration of football training exposure, maturity indicators and assessment method, anthropometric and body composition methods and data, as well as the physical performance tests applied and their corresponding results.
In football research, the age of the sample is presented as the mean age, age range or even age category. Football's age categories groups are usually done per age, e.g., U10 are the players 10 years or younger. Grouping players into under-age categories places individuals with age differences of one or more years in the same group. Additionally, there is a lack of uniformity in age-grouping criteria, with national federations considering the calendar year between January to December while others, such as England, from September to August.30,31 So, in order to establish age categories, we opted to standardize each study by considering year by year, from January to December born (e.g., a 8 year old born in January is in the same age group that a 8 year old born in December). When in an article the age category was not reported we used the samples’ mean age to determine the appropriate age group.
The competitive level classification was not age or maturity related. Instead the competitive level of the participants was adapted from Kryger et al. 28 and Hammami et al. 32 : recreational or low-level – non-competitive, like participants from a summer camp; medium-level – participants are either part of an academy focused primarily on developing players for competition or are affiliated with regional clubs or in clubs in the third division or lower; high-level – which refers to players whose primary focus is competition, such as athletes of elite club academies or competing for clubs in the second or first division. This last group also includes players that represent national teams or play professionally; lastly, are participants from multiple competitive levels.
Diverse maturation timing indicators were reported: Skeletal age (SA) – biological age estimated through the evaluation of the wrist and hand bones 33 ; age at peak height velocity (APHV) – age at which the maximal height increment occurs during adolescence, commonly referred to as peak height velocity; maturity offset (MO) – distance, in years, from the peak heigh velocity 34 ; age at menarche (AM) – age at which the first menstruation occurs 35 ; developmental stages of secondary sexual characteristics (SSC) – stages given to the development of secondary sexual characteristic 36 ; predicted adult height (PAH); and percentage of predicted adult height attained (%PAH). The two indicators APHV and MO are interrelated, as one provides information about the other, and vice-versa.
The maturation studies’ data was extracted at the initial time point of data collection. In the case of Hammami et al. 32 study, which reported the measurements taken at the beginning and end of the season, and the participant had already reached or nearly reached adulthood (Tanner stages IV and V) we opted to present the results at the end of the season since they were significantly improved compared to the preparatory period. In studies with three or more time points of data collection, the option was to present those at the mid-point of the study. This approach was adopted to align maturation, anthropometric, and performance data at a single time point, thereby avoiding potential bias associated with an untrained baseline or the influence of training adaptations. When the maturity offset was reported and APHV was not present, the later was calculated, and vice-versa. When maturation status was not reported but the data reported allowed its calculation this was performed. In these cases, the authors’ calculation was explicitly indicated in the results section. If the research papers selected reported two or more different maturation indicators, to determine maturation timing, SA was preferred to MO or APHV. SA was preferred since it is the most accurate method to determine biological age and the only valid from infancy through adolescence. 5 MO, and APHV were referenced since they were the most frequent methods reported in the screened studies. It should be noted, however that while possible to determine maturation status from studies that report various maturation indicators, the absence of an explicit classification by the authors may lead to inconsistent results, as different maturation indicators and assessment methods can yield varying maturation stage classifications.
Maturation status was determined using different methods: (a) SA, using the difference between skeletal age and the chronological age. When the former difference was < −1 the sample was late, if it was between −1 and 1 was classified average or “on-time” and if > 1 was classified as early37,38; (b) MO, using the difference between the chronological age and MO to determine the APHV, and then maturity status. The weighted median values for maturation (APHV and AM) were determined for each chronological age. The weighted mean APHV value for each competitive level was determined and these values were used as the reference to determine maturity status (e.g., 12.5 years for high level and 12.4 years for medium level). For articles involving medium or high level samples the corresponding determined mean APHV and a standard deviation of 0.5 years, was used to determine maturity status 39 : if it was < - 0.5 the sample was early, if it was between −0.5 and 0.5 it was “on-time” and if it was > 0.5 it was late (e.g., a high level player with APHV of 12.9 years was considered late).40,41 For the %PAH a result ≥ 85% and < 95% was classified as circa-PHV, below 85% pre-PHV and equal or above to 95% as post-PHV. 42 When only SSC according to Tanner Stages were described, the authors determined maturation status as follows: pre-pubertal (Tanner stage I), pubertal (Tanner stages II-IV) and post-pubertal (Tanner stage V).43–46
To determine the weighted mean values for maturation we only considered the results from studies where the maturation method criteria was respected, in other cases the values were established as outliers.
Regarding anthropometric and physical performance data it was obtained following the same logic as maturation. When articles reported physical performance results at the beginning and end of the season and the players were already close to adulthood, we chose the most recent ones. Some studies did not report the anthropometric and body composition characteristics of the sample, but when available, they were analysed and used to estimate other complementary measures. For example, when body mass index (BMI) was not reported, it was calculated based on the mean weight and height of the sample. Likewise, sitting height and leg length when not reported were calculated based on the mean leg length, sitting height and height values. Despite body composition (% fat mass and free fat mass or lean body mass) has been obtained through DXA, bioimpedance and anthropometric equations in the selected studies, when one of the above components was not reported (five studies) it was determined assuming a two components model.
The weighted means and standard deviations of anthropometric characteristics and physical performance were calculated for each competitive level, according to age and MO. Maturity offset was used since it was the most common reported indicator, along with APHV, which allowed us to calculate MO categories. This methodological approach was chosen since in most of the selected studies average values for the sample's population maturation was not provided. Since the weighted mean APHV was 12.4 years for medium-level players and 12.5 year for high-level players we opted to present maturity offset next to the corresponding chronological age of 12 years.
Equity, diversity and inclusion statement
This study focused on a female population, filling a gap in this research area. The author group consisted of 4 women and 3 men across different career stages, from different countries, Portugal, England and Iran.
Results
Overview
From the electronic database search a total of 3769 articles were found. Eighteen other articles were found through other sources. After the removal of duplicates, 2340 articles were assessed, although only 46 were included in this study.
Studies’ characteristics
From the 46 selected studies 28.3% (N = 13) were longitudinal,8,47–58 and 71.7% (N = 33) were cross-sectional,32,37,41,43–46,59–84 the main studies characteristics can be seen in Supplementary Material 1. The younger sample has a mean age of 8.2 years, 45 and the older 17.6 years. 64 The majority of the studies used only a female football sample (N = 34, 74%),8,32,37,45,48–63,65–69,72–76,78,79,81,83 17% (N = 8) had a female and a male football sample,41,44,46,70,71,77,82,84 and 9% (N = 4) had a multiple sport sample.43,47,64,80 The origin countries of the participants included: Canada (N = 1; 2.2%), 47 England (N = 12; 26.1%),8,48,55–58,73–75,78,79,83 France (N = 1; 2.2%), 51 Germany (N = 1; 2.2%), 52 Japan (N = 1, 2.2%), 72 Poland (N = 1, 2.2%), 50 Portugal (N = 3; 6.5%),37,66,67 Spain (N = 10; 21.7%),41,43,45,46,53,65,68,70,71,84 Sweden (N = 4; 8.7%),62,64,76 Tunisia (N = 2; 4.3%),32,49 United States of America (N = 8; 17.4%),44,54,59,61,63,69,77,82 and multiple countries (N = 2; 4.3%).60,80
The competitive level of the participants were classified as: recreational or low-level (N = 2, 4%)77,82; medium level (N = 19, 41%)8,43,45–47,49,50,53,61,64,68–72,80,83,84; high-level (N = 21, 46%);32,37,44,48,51,52,54–59,63,65,67,73–75,78,79,81 multiple competitive levels (N = 5, 11%).41,60,62,66,76 For the recreational level papers we opted to exclude them from discussion since there were only two studies.
Maturation
All forty-six studies reported indicators of biological maturation, as summarized in Table 1. The timing maturation indicators varied: APHV and MO (N = 18; 39%)8,41,48,52,53,55–58,61,65,68,73–75,78,79,83;%PAH 85 (N = 3; 6%);47,59,77 SSC using the Tanner Stages 36 (N = 7; 15%)32,43–46,49,70; AM (N = 11; 24%)51,54,62–64,72,76,80–82,84; SA according to Fels 86 (N = 3; 6%)37,66,67; SA using magnetic resonance imaging (MRI) (N = 1; 2%) 60 ; multiple methods (N = 4; 11%).37,47,50,69,71,84 However, four studies did not report the results of the maturation measurements.8,50,72,82 Five studies reported maturation results for two different indicators: Baxter-Jones et al. 47 presented, both, APHV and PAH; Jastrzębska 50 and Lozano-Berges et al. 84 reported MO and AM; Lozano-Berges et al. 46 reported SSC and AM. Two studies did not respect the age requirements of the Mirwald method.65,68,87 There were few studies that grouped the sample according to their maturation status instead of age (N = 5).45,46,48,57,59
Maturation status of participants on the selected studies.
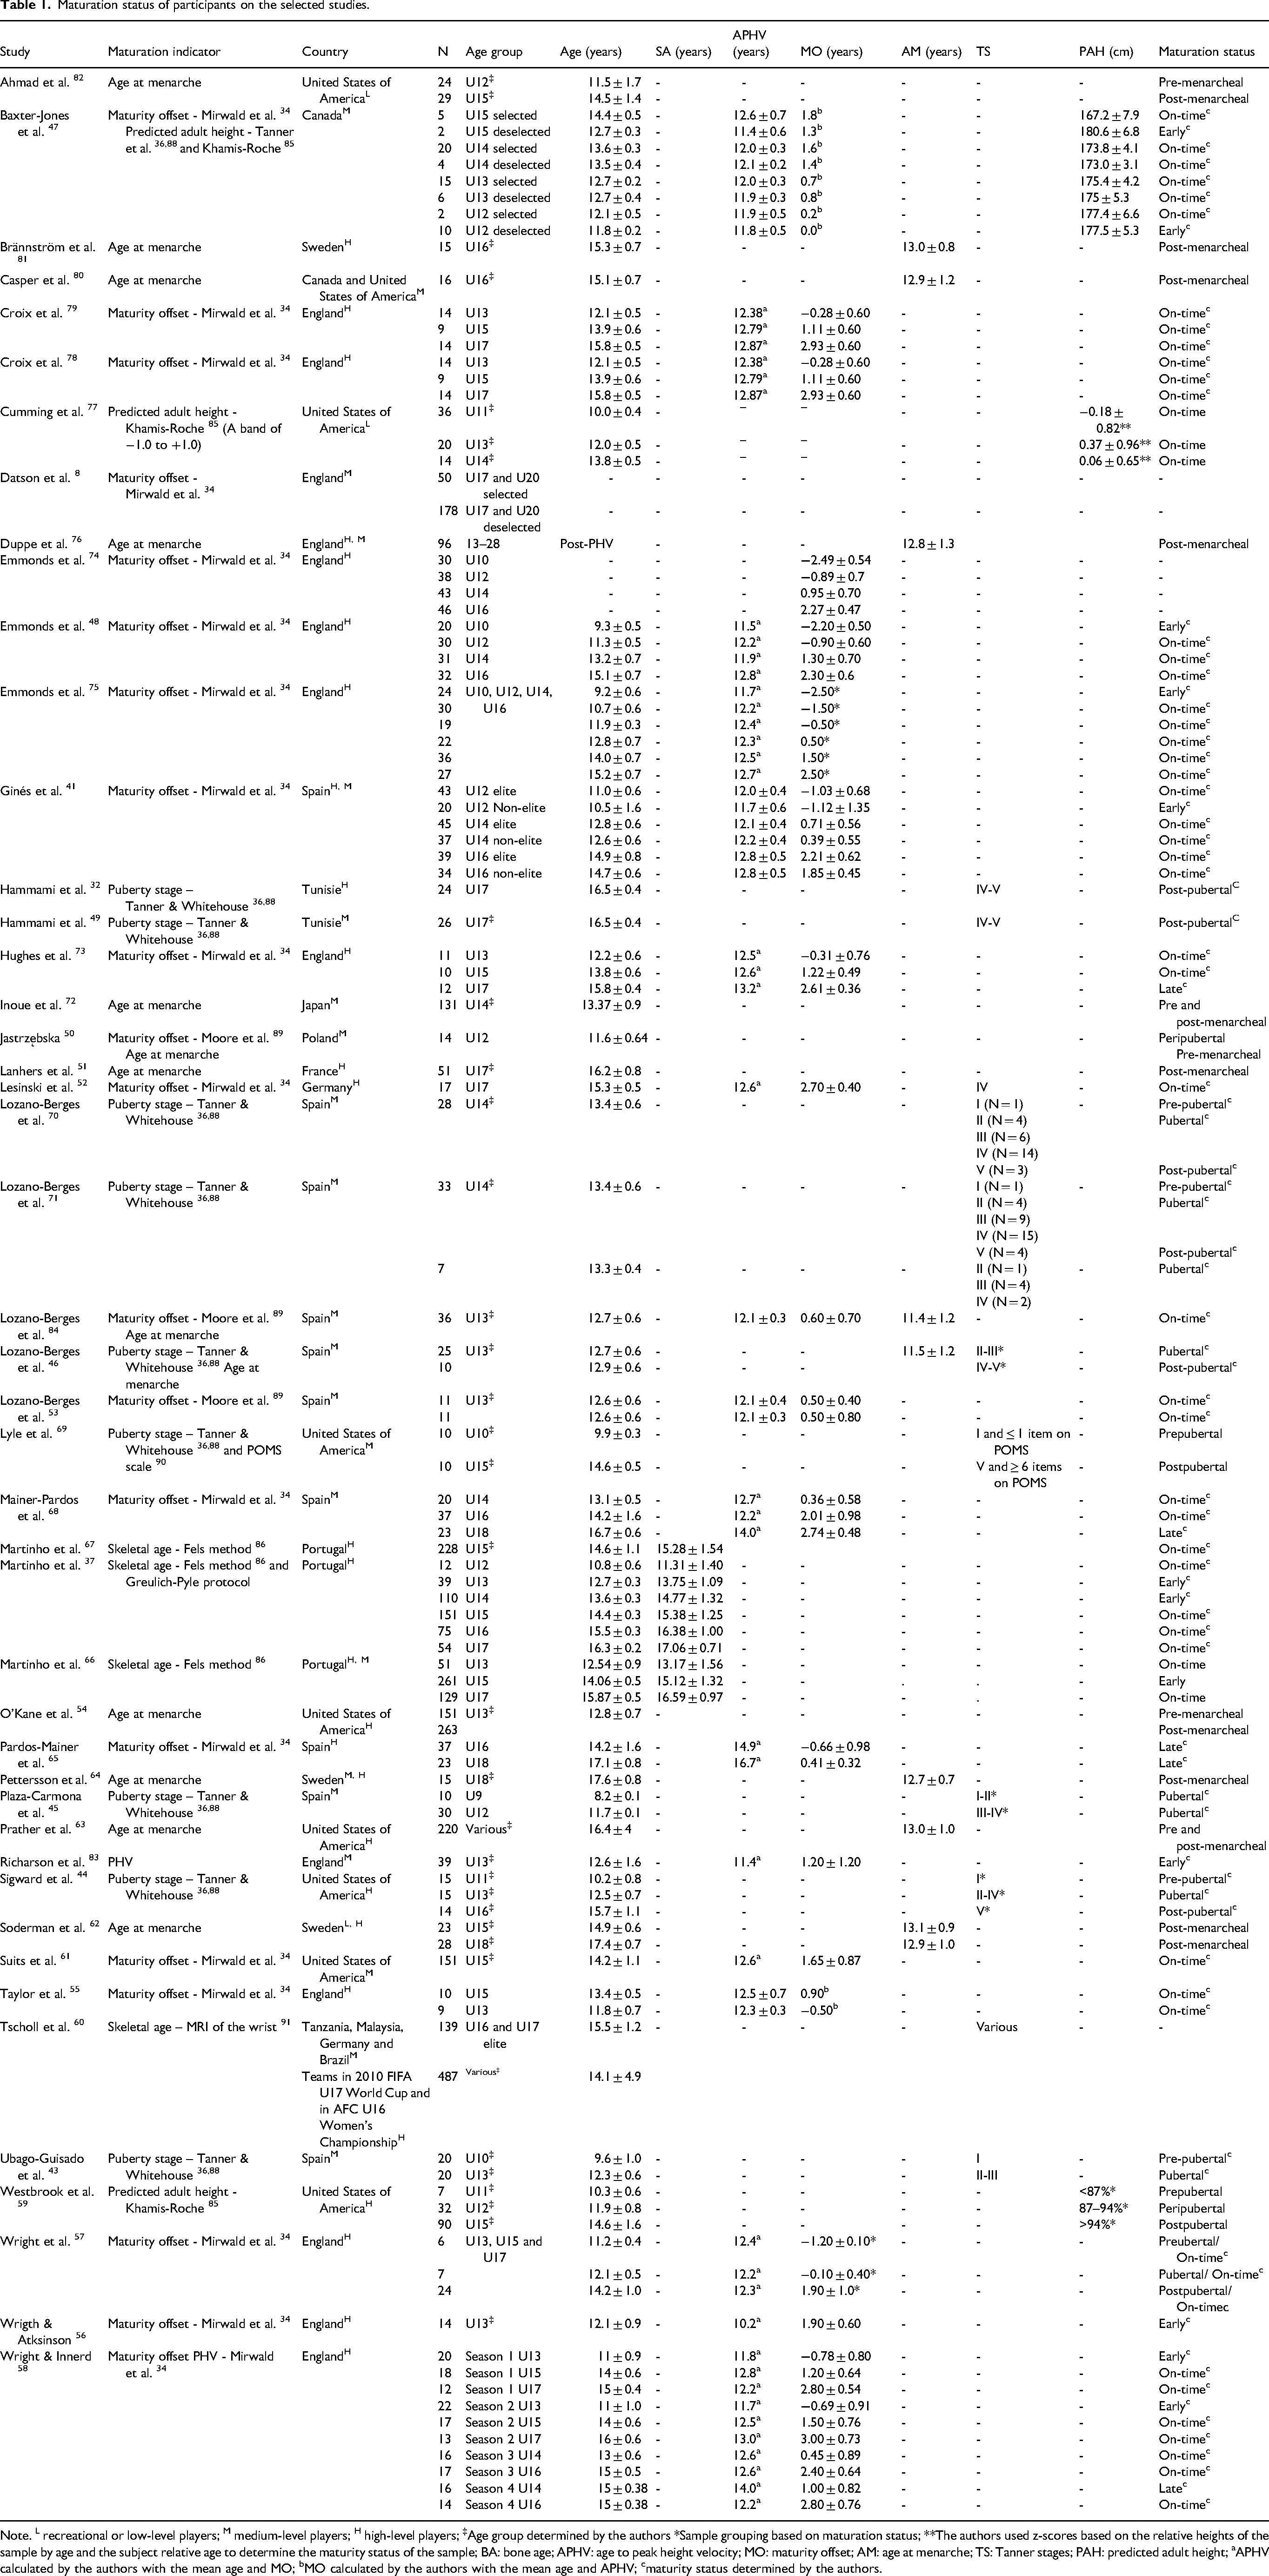
Note. L recreational or low-level players; M medium-level players; H high-level players; ‡Age group determined by the authors *Sample grouping based on maturation status; **The authors used z-scores based on the relative heights of the sample by age and the subject relative age to determine the maturity status of the sample; BA: bone age; APHV: age to peak height velocity; MO: maturity offset; AM: age at menarche; TS: Tanner stages; PAH: predicted adult height; aAPHV calculated by the authors with the mean age and MO; bMO calculated by the authors with the mean age and APHV; cmaturity status determined by the authors.
Most of the research papers (N = 21) have a heterogeneous maturation status.37,41,43,44,46–48,50,54,57–59,63,66,68–73,75,82 One study had a late maturing sample, 65 two an early maturing sample,56,83 and eight studies had an “on-time” sample.53,55,67,77–79,84 In total there were 99 players classified as late maturing (4%), 581 players as early maturing (24%) and 1721 players classified as “on-time” maturers (72%). Some research papers were organized by maturity status and not by chronological age.43,45,46,48,56–59,67,71 Of note that, three of the studies37,66,67 were classified according to the SA while the remaining were classified according to MO or APHV which can lead to a potential bias in the findings.
There were twenty-three studies which had the maturation status defined by the authors: twelve with the menarche,46,50,51,54,62–64,72,76,80–82 ten with the Tanner stages,32,43–46,49,52,69–71 four with the maturity offset,41,50,52,57 and one with the PAH attained. 59 Three studies did not provide the maturity or the mean ages of the sample not allowing to determine the maturation status of the sample.8,60,74 However, in Emmonds et al. 74 despite the mean ages not being reported, the sample was classified as pre, circa and post-PHV using maturity offset. 34
Three papers classified the sample maturity status: Cumming et al., 77 for example, used the z-score distance for the PAH of the individuals based on age-specific references for the general population, were individuals with z-scores between −1 and +1 were classified as “on-time” maturers; Ginés et al. 41 determined the sample mean and standard deviation of PHV by age and used these estimates to classify the individuals accordingly; Martinho et al. 66 used skeletal age, and the same criteria that has previously been established in this research to determine the maturity status.
Following the results of the selected studies it was possible to report the median maturation timing results by age and competitive level for APHV and AM (Table 2). We opted to present median values for each age since the number of articles was small in most of the cases. Finally, the weighted mean for the total sample, according to the competitive level was presented for both APHV and AM. Based on the mean APHV calculated values we were then able to determine the maturation status of each article's sample, according to the corresponding competitive level. High-level players had a mean APHV of 12.5 ± 0.8 years and a mean AM of 13 years, similar to the AM in low-level players. However, in low-level players there was lacking research (N = 1). In medium-level players the mean APHV was 12.4 ± 0.5 years and mean AM of 12.8 ± 0.1 years.
Maturation timing medians according to competitive level.
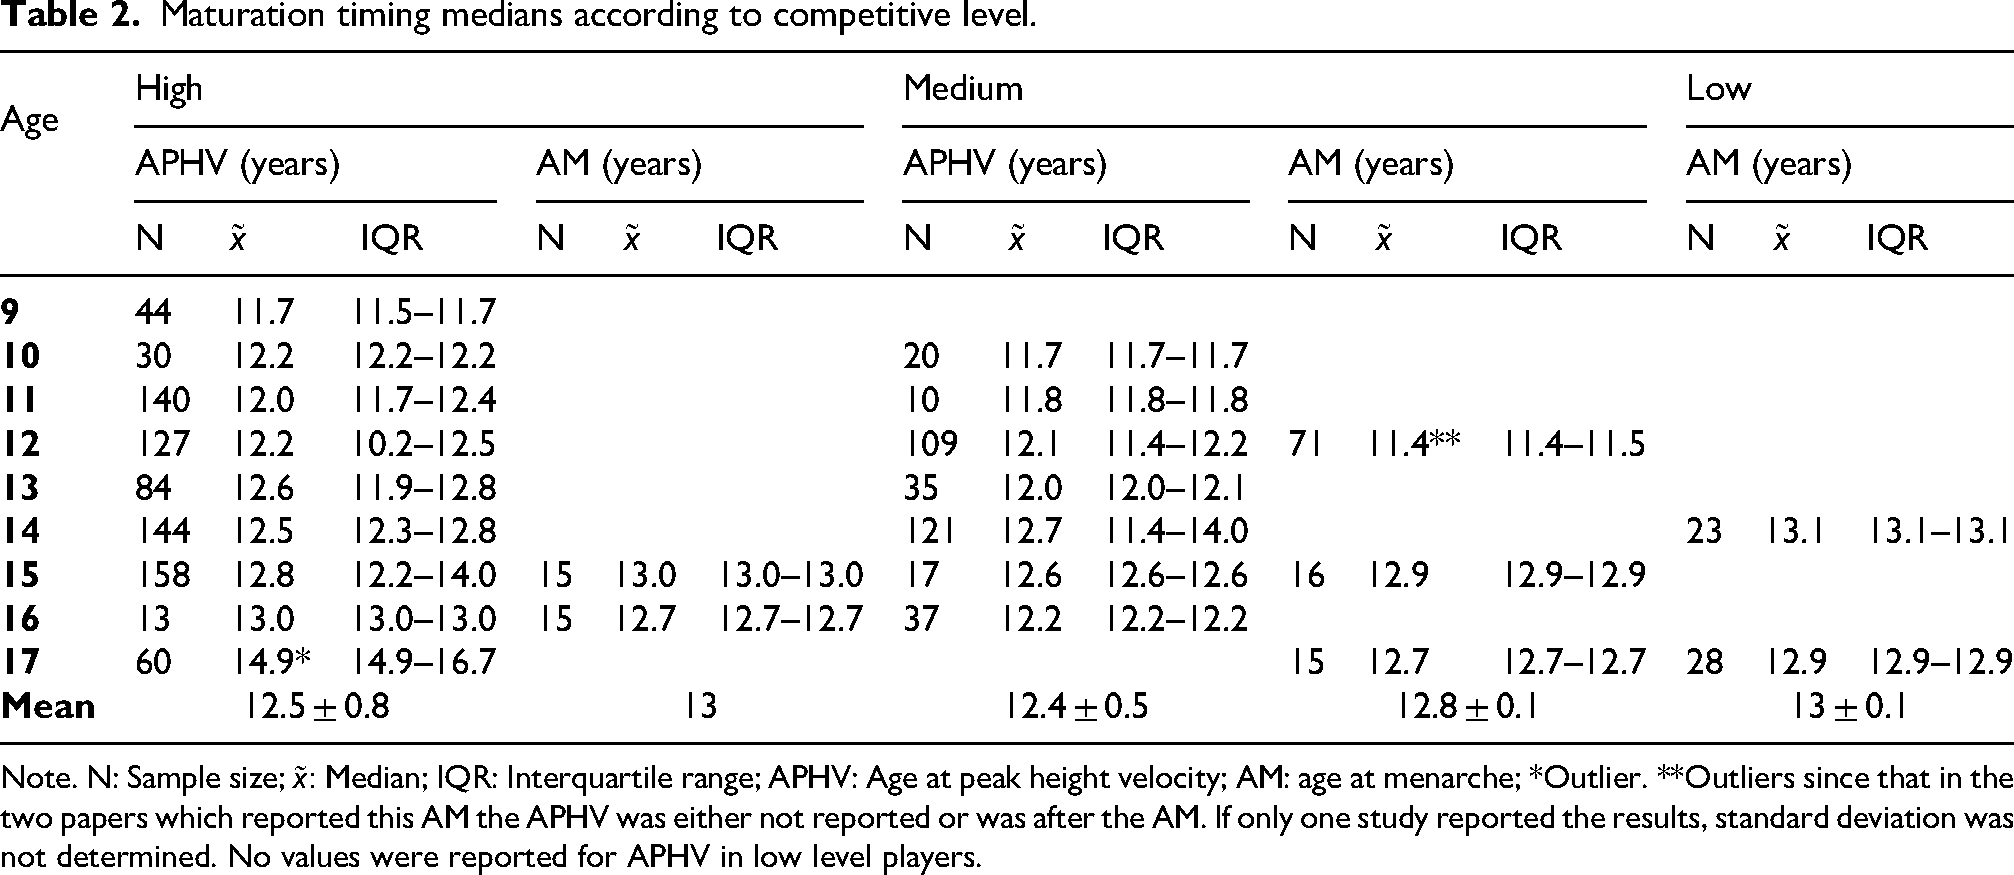
Note. N: Sample size;
Anthropometric and body composition characteristics
Of the forty-six studies included, forty-one (89%) reported anthropometric and fifteen (32%) body composition measurements, as can been seen in Supplementary Material 2. Anthropometric measurements included height, weight, body mass index (BMI), sitting height and leg length. From these forty-four studies, thirty-eight (96%) reported height and weight measurements, while only seventeen studies (37%) reporting values for BMI.41,43,45,46,50,52,53,62–65,68,70,71,77,84 Sitting height was reported in four studies (9%),48,56,73,74 and leg length only in two (4%).48,74 Body composition was determined with equations,8,32,67 bioimpedance (BIA)52,70 or Dual-energy X-ray absorptiometry (DXA),43,45,46,53,62,64,70,71,76 the reported measurements were lean body mass, fat free mass and % of body fat. Lean body mass was reported in ten studies (22%),43,45,46,53,62,64,70,71,76,81 fat free mass was reported in three studies (6%),52,66,67 percentage of body fat was reported in thirteen studies (28%).32,43,45,49,51–53,64,66,67,70,76,81
With the average values of the studies described in Supplementary Material 2 we were able to present Table 3 with the mean values for anthropometry and body composition for each competitive level and according to age and maturity offset of the football players with the mean values for anthropometry and body composition. In high-level players lean body mass increases with age from 41.7 kg to 48.0 kg while fat mass decreases from 25.4% to 21.3%. In medium-level players the same is observed for lean body mass, which increases from 21 kg to 43.2 kg. In medium-level players fat mass varies from 27.2% at 8 years, then increases at 12 years to 30.7% and then decreases to 26.8% at 17 years. In low-level players there was limited research available (mostly one paper per age) making it not possible to report values standard deviations. Values according to maturation status were also unavailable (Supplementary Material 3). At this level only anthropometric data was available, it showed progressive increases in height (from 141.5 cm to 162.1 cm) and weight (from 36.0 kg to 58.1 kg). BMI rose from 18.0 to 22.0 kg/m² across ages.
Anthropometric characteristics of high- and medium-level players by age and maturity offset.
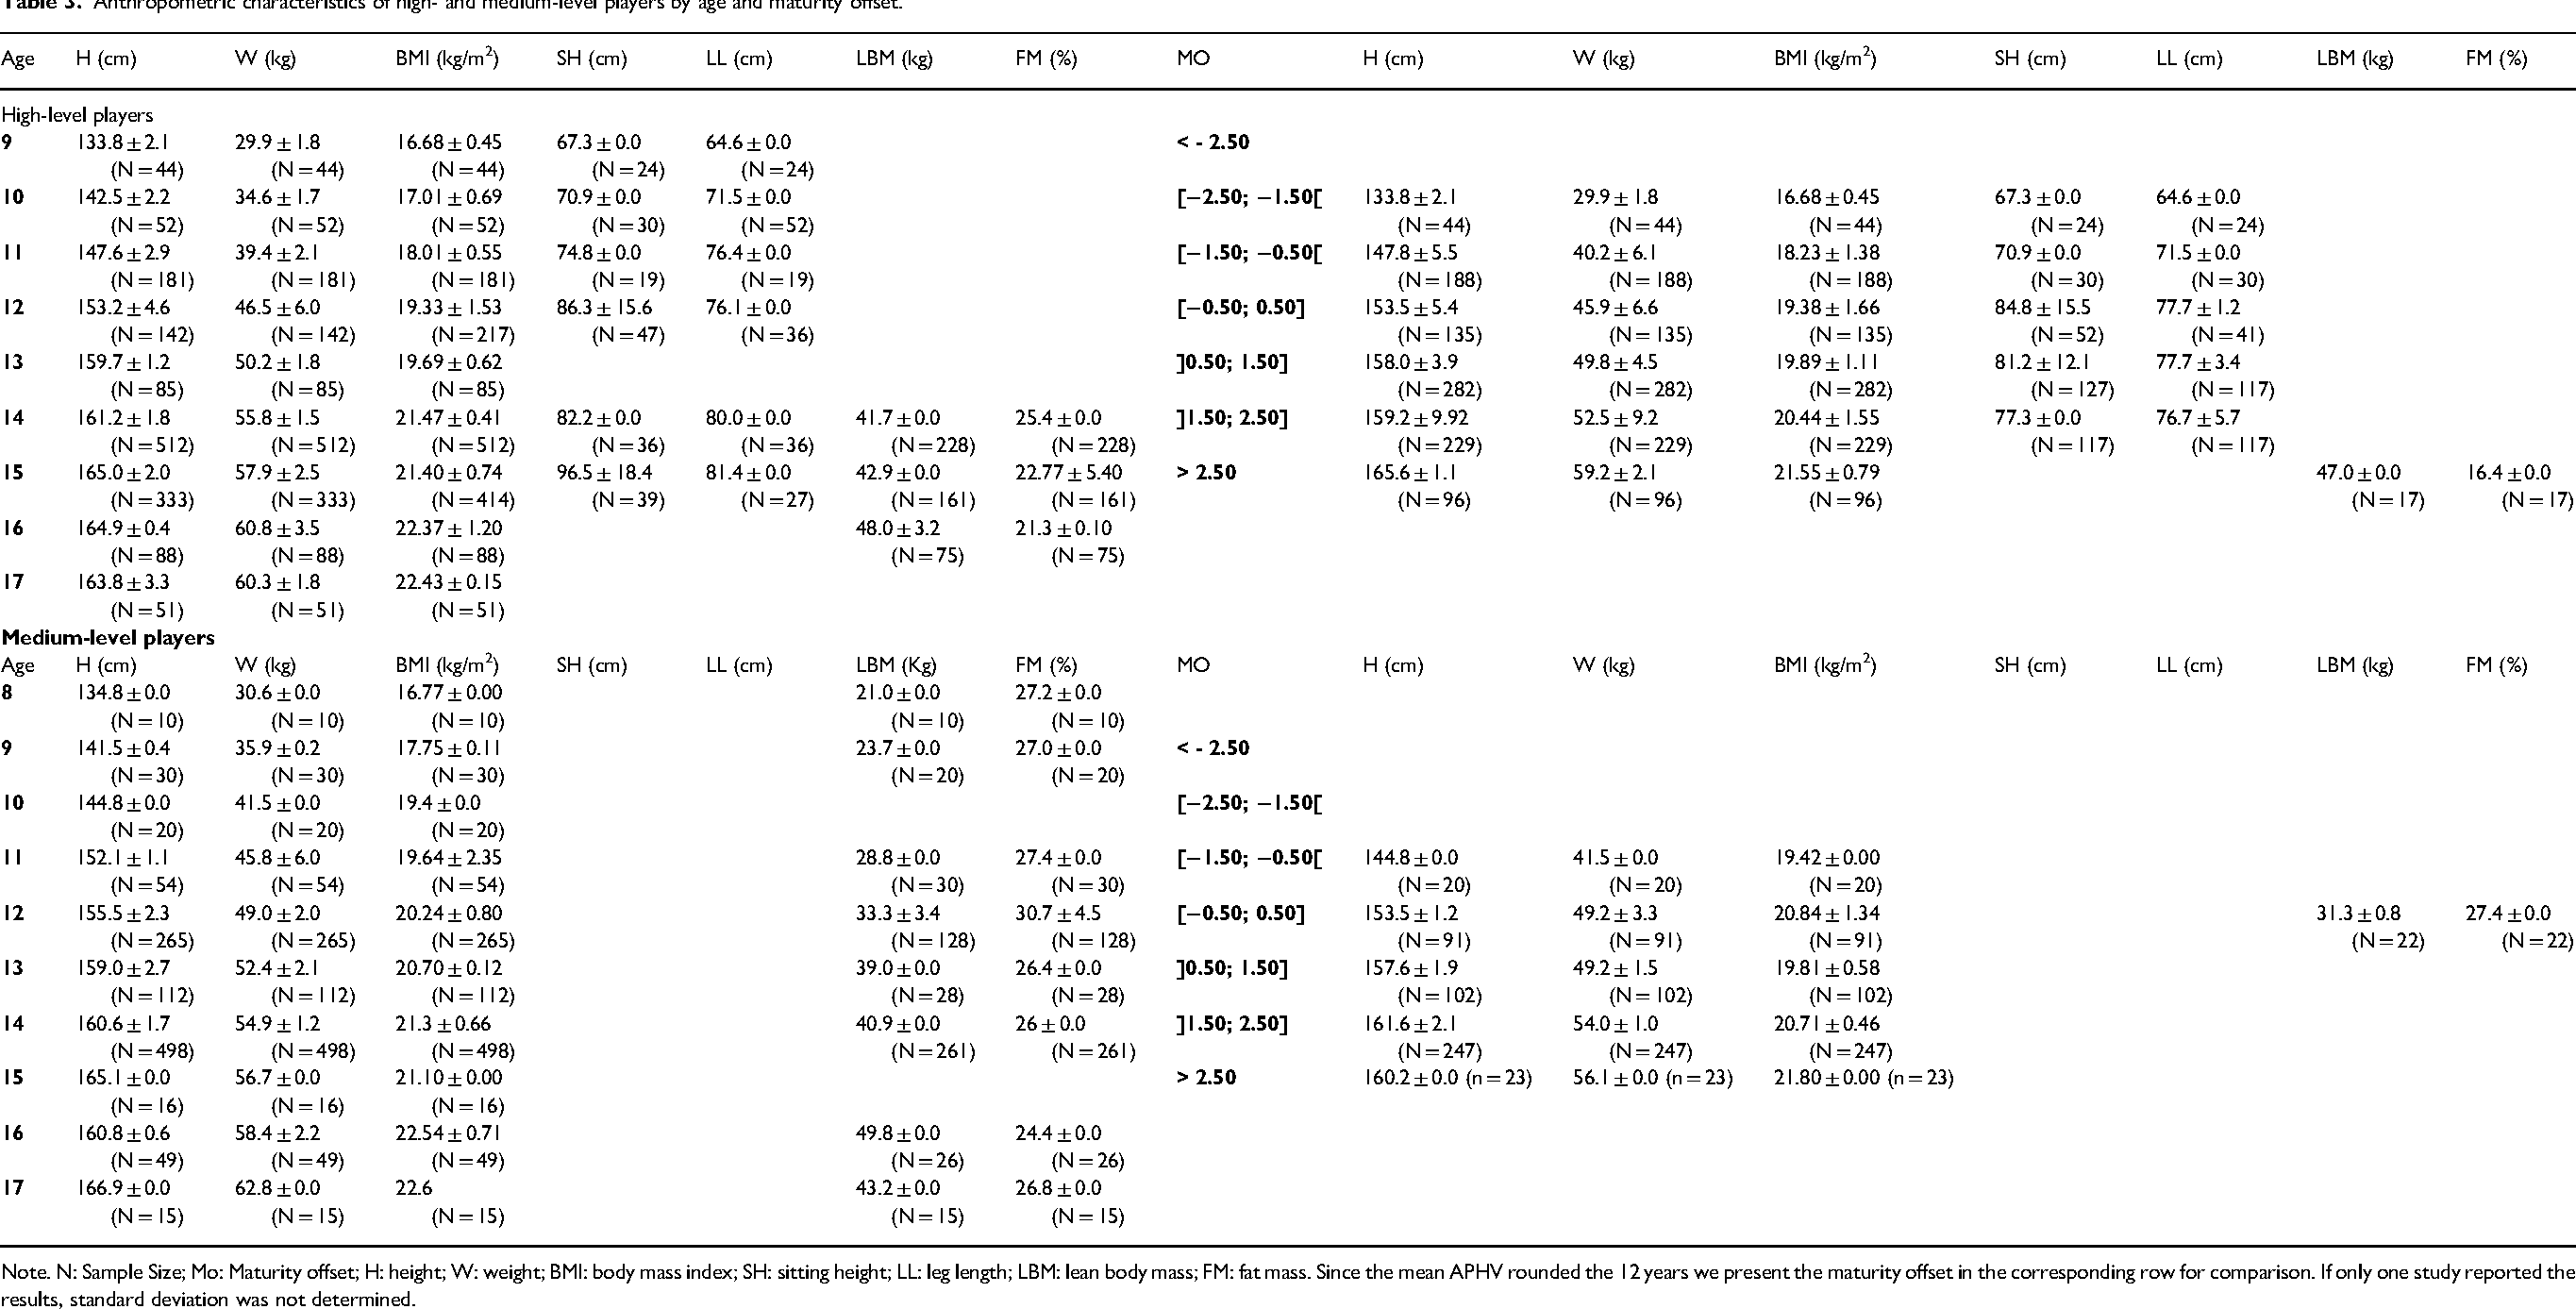
Note. N: Sample Size; Mo: Maturity offset; H: height; W: weight; BMI: body mass index; SH: sitting height; LL: leg length; LBM: lean body mass; FM: fat mass. Since the mean APHV rounded the 12 years we present the maturity offset in the corresponding row for comparison. If only one study reported the results, standard deviation was not determined.
Years of football exposure and physical performance
Years of football exposure were reported as years of football practice. However, although it was reported in few studies (N = 10; 22%),43,46,50,62,64,67,69,72,77,84 the athletes’ experience was not analysed in relation to maturation. The athletes’ experience is presented in Figure 2. The less experienced sample was Jastrzębska 50 sample with 2 years of exposure, the athletes aged 11.6 ± 0.6 years old and were peripubertal. The most experienced had 8.1 ± 2.1 years of exposure and was analysed in the study of Söderman et al., 62 where all athletes were all post-menarcheal.
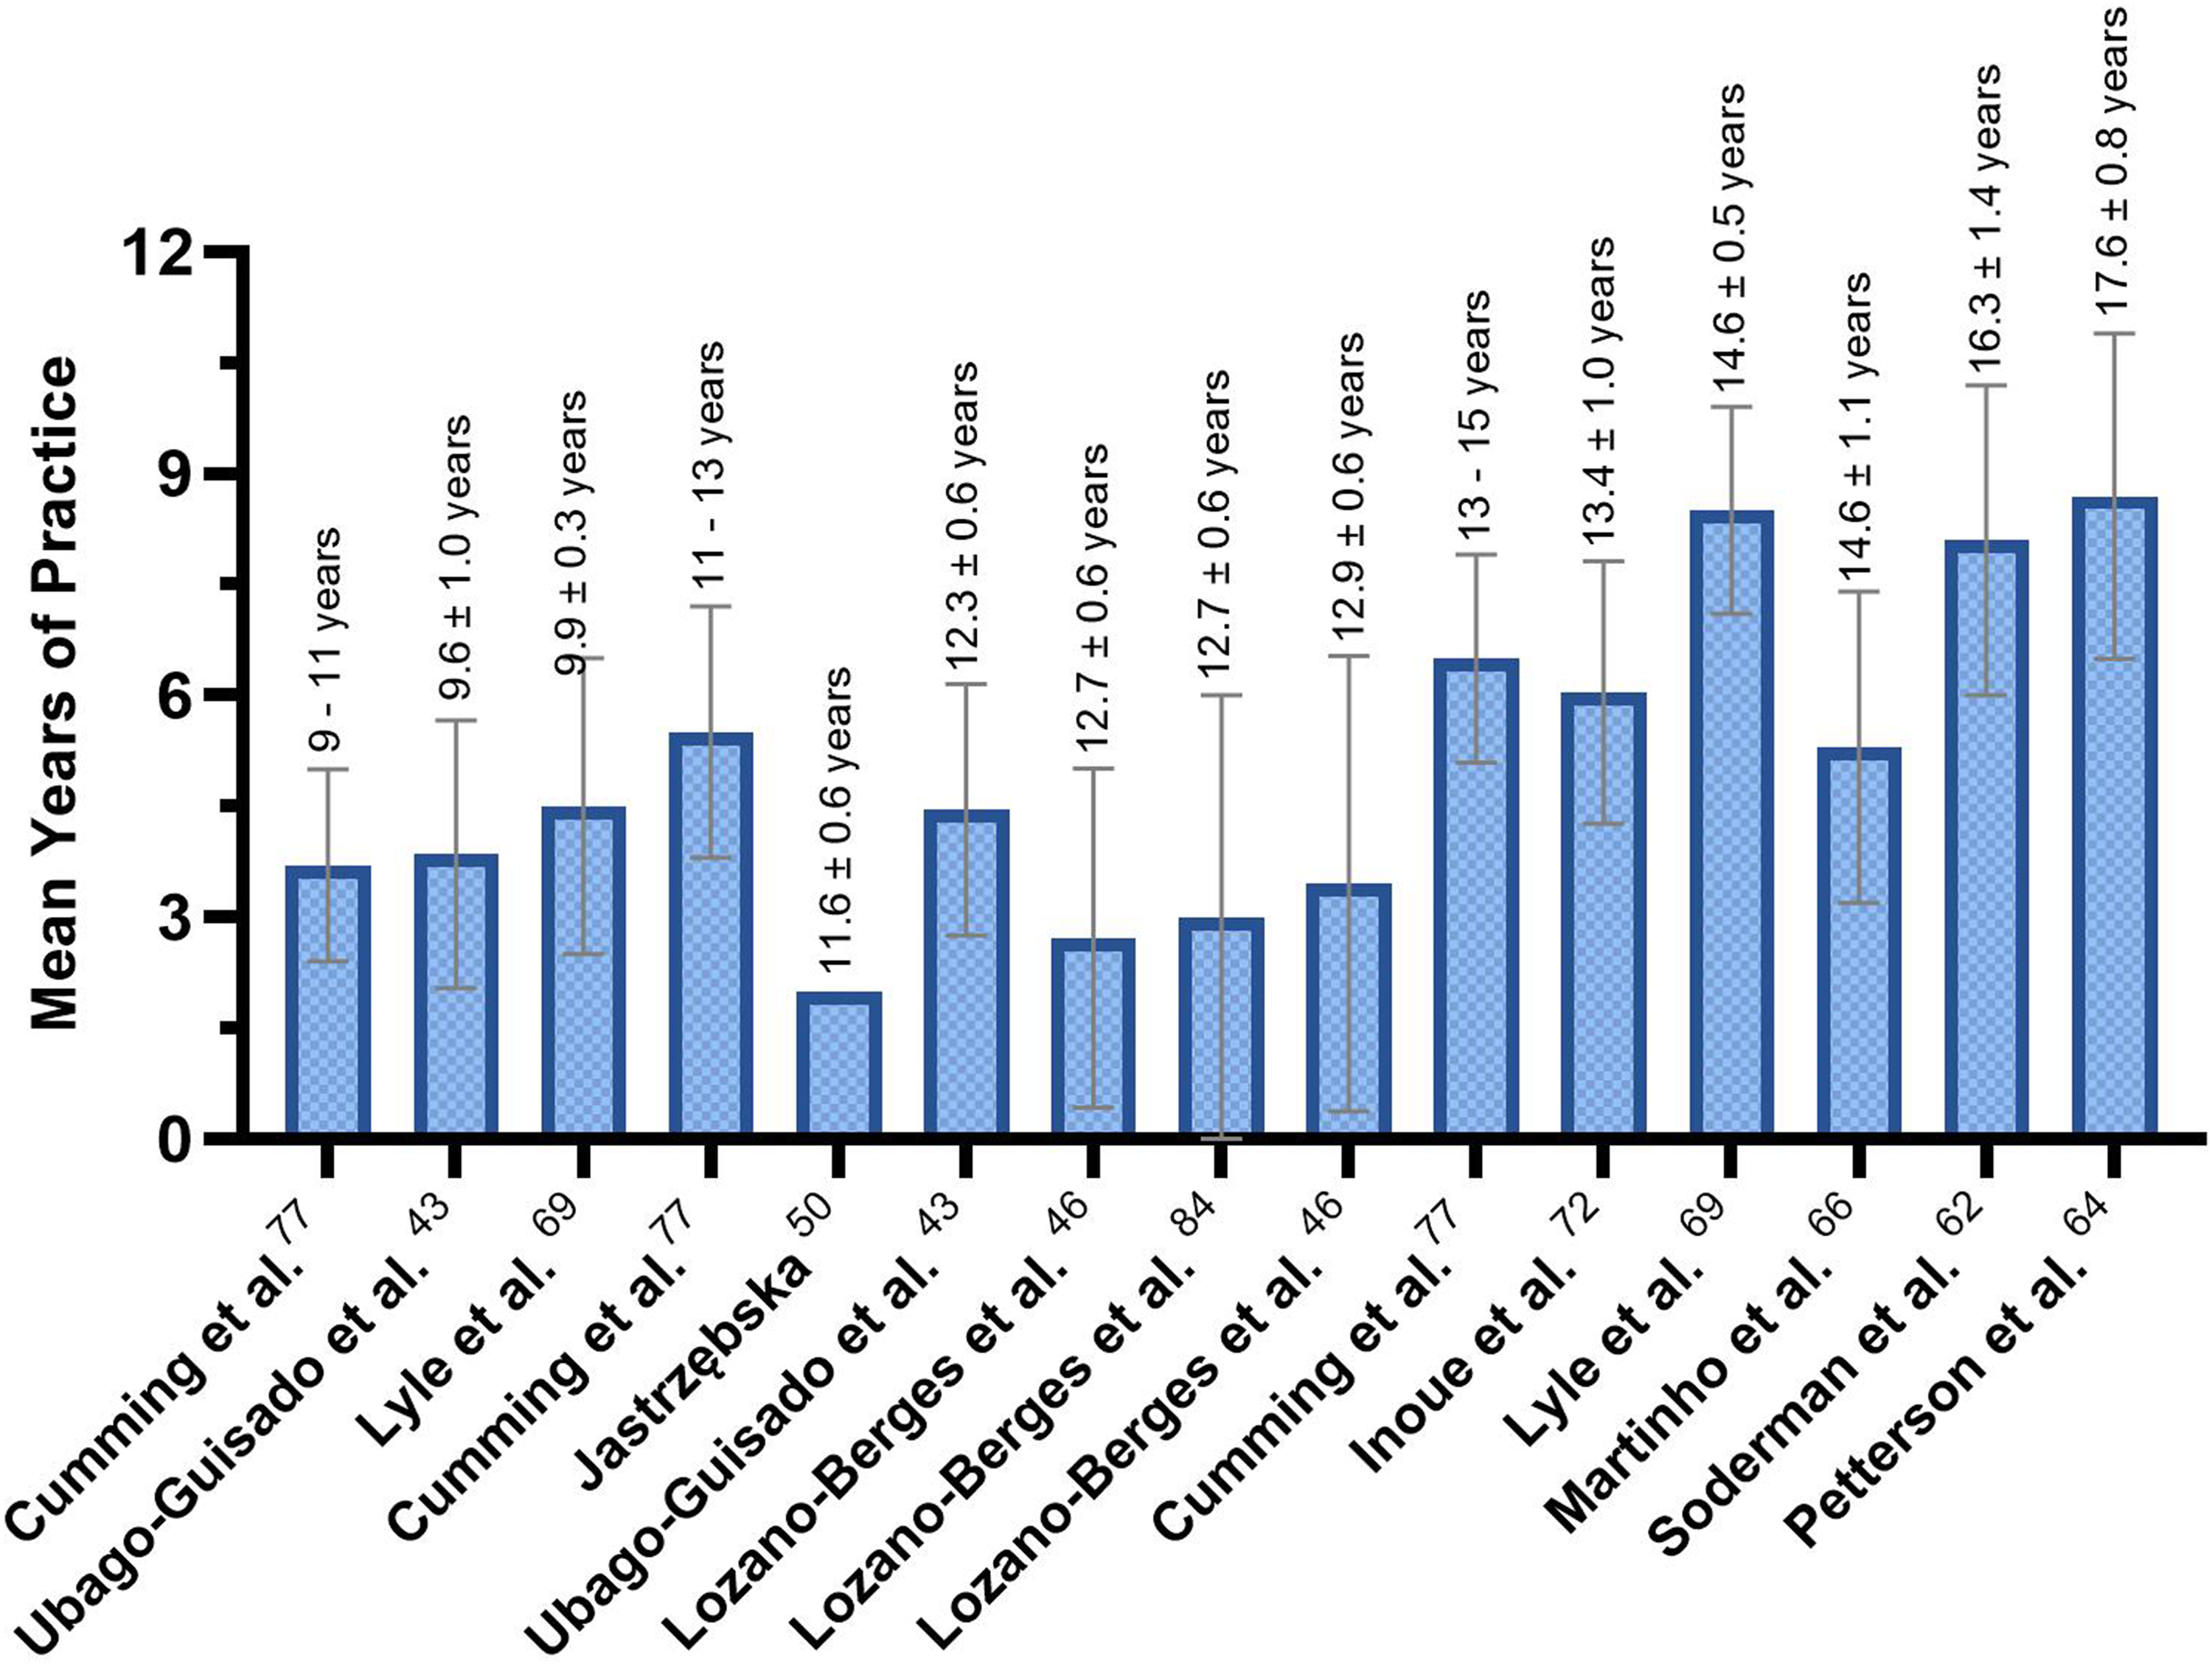
Mean ± standard deviation of the years of practice according to each study sample's mean chronological age. Note. Sample's mean age of each study is labelled above the corresponding column.
The physical abilities of the athletes were divided into power, endurance (aerobic and anaerobic), agility and strength. Of these physical abilities power, aerobic and anaerobic endurance were determined in 33%, agility in 17% and strength in 7% of the studies.
Power was reported for the inferior limbs while using jump tests; speed was determined with sprint tests using different lengths. For the aerobic endurance the Yo-Yo intermittent recovery test (YYIRL1) was used, and for anaerobic endurance repeated sprint ability was determined. Only fifteen studies (33%) reported results for power and resistance as can be seen in Supplementary Material 4.
Countermovement jump (CMJ) was reported in seven studies (15%),8,32,48,65,75,81,83 squat jump (SJ) only in one study (2%), 32 and long jump (LJ) in two studies (4%).53,61 The sprint tests were reported for: 5 m in three studies (6%),32,49,55,56 10 m in seven studies (15%),8,32,48,49,61,65,68,75 20 m in five studies (11%),55–57,65,68,81 30 m in seven studies (15%),8,32,48,49,53,65,68,75 and for 40 m in two studies (4%).65,68
Wright and Innerd 58 followed 86 players of different age categories during four seasons, and in each season, they assessed YYIRL1 results at four times. Nevertheless, the authors only present the results for the overall sample.
The measurement methodology for the sprint tests varied. Some studies measured the partial times during a longer sprint other measured time at different distance sprints, separately. In Datson et al. 8 during a 30 m sprint, times were measured at 10 m and 30 m. The same procedure was used in Hammami et al. 32 and Hammami et al. 49 that, in addiction, also measured the 5 m partial. Mainer-Pardos et al. 68 and Pardos- Mainer et al. 65 tested a 40 m sprint and measured the 10 m, 20 m and 30 m split times. In Wright and Atkinson 56 the 20 m sprint and the 5 m split time were measured. On the contrary in Emmonds et al. 48 and Emmonds et al. 75 times were measured in 10 m and 30 m separately.
Suits et al. 61 were the only authors reporting their results on LJ and sprinting according to maturation status.
For aerobic endurance YYIRL1 was reported in five studies.32,48,57,58,75 In addition, Anaerobic endurance was measured through repeated sprint ability (RSA) tests in three studies.55–57
Agility is reported in seven studies as can be seen in Supplementary Material 5. The 505 change -of-direction (COD) test with the dominant leg was reported in two studies,48,75 and 505 COD with the non-dominant leg only in one study. 48 The 180 COD was reported on three studies.55,56,65 The V-cut test was reported in one study. 65 The T-test was reported in two studies,32,57 and the T-test with ball only in one study. 32 The Loughborough football passing test (LSPT) was reported in the study of Hammami et al. 32
Strength was also reported with the absolute and relative maximum peak forces and the quadriceps/hamstring strength ratio (Q/H). Absolute and relative maximum peak force was reported in three studies,48,74,75 as can be observed in Supplementary Material 6. The Q/H ratio was measured in two studies,78,82 however the results were not comparable due to the different methods used.
Lesinski et al. 52 obtained values for muscle power, muscle strength, linear speed, endurance, dynamic balance and football specific performance, however the absolute values were not reported, only the season variation. In addition, O'Kane et al. 54 followed the female players for one entire season to understand if normalized knee separation (varus and valgus) contributes to lower limb or knee injuries, and in Hughes et al. 73 creatine kinase (CK) and delayed onset muscle soreness (DOMS) were measured at the baseline and after match play.
Like it was done for anthropometric characteristics and body composition, for physical performance we were also able to calculate the mean values according to the competitive level and by age or maturity offset. The results of high level players can be seen in Table 4. The remaining players did not have enough information to be reported. In general we observe an improvement in both CMJ, 10 m sprint, 505 COD and in the YYIRL1 tests with increased chronological age and maturation. Repeated Sprint ability results varied with age and remained relatively stable with maturation, while RPF diminished with age but improved with maturation.
Physical performance of high-level athletes by age and maturity offset.
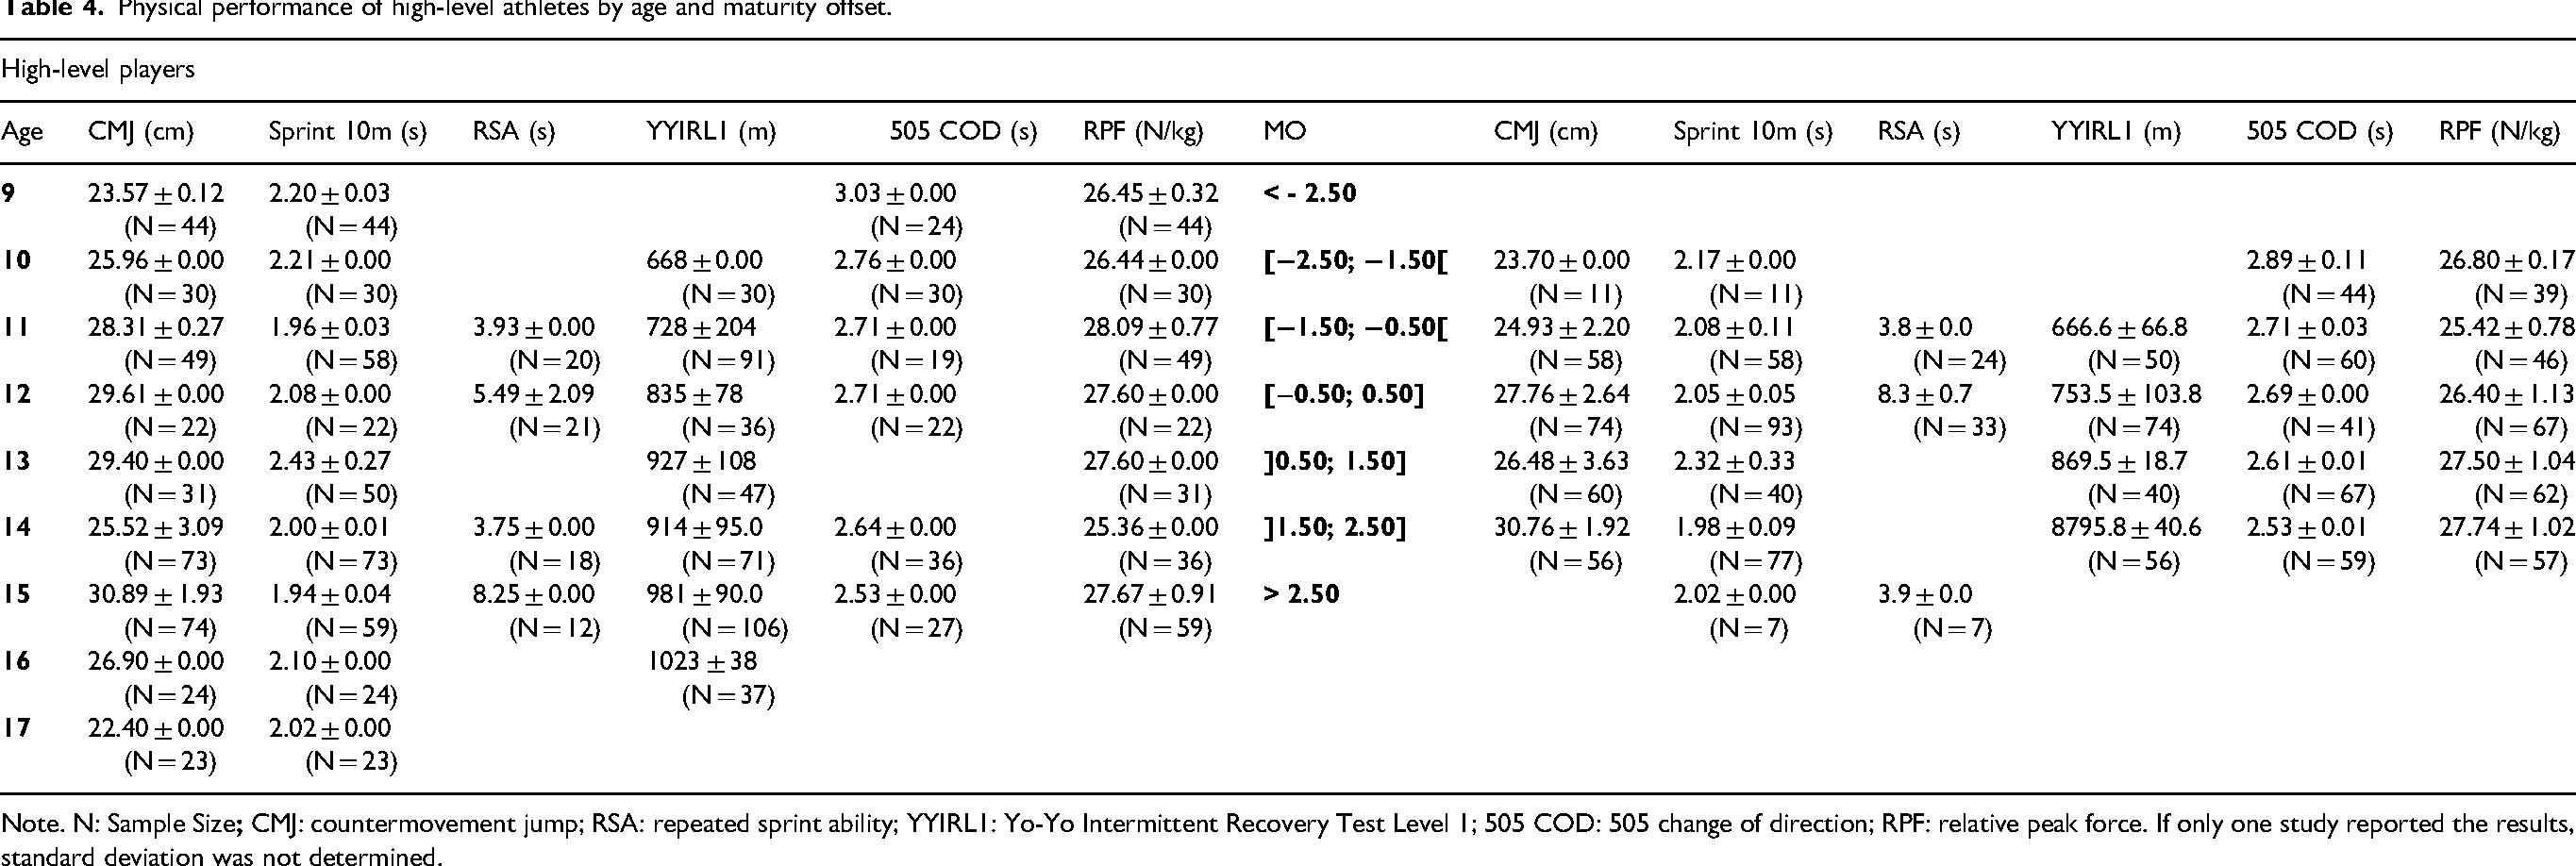
Note. N: Sample Size
Discussion
This is the first scoping review to summarise youth female football players maturation timing and status, and the relation with anthropometric values, body composition, football exposure and physical performance. The majority of the studies involved players in medium (41%) or high competitive levels (46%), since most are in a football academy or focusing on competitions, respectively. Relating to the samples’ maturation status, research is mostly focused on “on-time” players. Only 11% of the studies had at least one group of late maturing athletes, followed by 17% of early maturing groups. One possible explanation for the absence of both early- and late-maturing females is the lower variability in maturation tempo observed among females compared to their male counterparts. 1 In general, anthropometric characteristics tend to be greater in players who are at the high competitive level and body composition is better in these players, with more lean body mass and less % fat mass. For power and agility the best results were also observed in high-level players.
Methodologies to determine maturation status
Maturation can be assessed according to status or timing. 5 To determine maturation status there are several methodologies that can be used. Skeletal age, APHV or AM are a few examples of maturation timing information that easily can be converted into maturation status.92–94
Despite the variability among maturity determination methods, it has been shown that there are moderate to high correlations between them. 13 Nevertheless, caution should be taken when interpreting the results of the selected studies, as there is heterogeneity in the methods used. Although considered the gold standard for determining maturity status, 13 SA results can vary depending on the methodology used. However, this method is the only that can be used from infancy to adolescence, 5 despite not being the most popular method due to the limitations regarding equipment cost and the ethical issues associated. 13 Few studies used SA to determine maturation, with three studies having employed the Fels method,37,66,67 one used the Greulich-Pyle (GP) method, 37 and another one a MRI to the wrist. 60 Consideration should be taken when using the Fels method which tends to overestimate the players bone age when compared to the GP method. 37 The Fels method, when compared with GP method, classified a greater number of subjects as mature or early between 13 and 16 years, respectively more 14.58% and 30.36%.5,37 In the GP method the overclassification as advanced happens around the 12–13 years, overclassification as “on-time” at 14 years and overclassification as late maturing at 15 years old.13,37 One aspect that should be taken into account is the neither the X-Ray or the MRI of the wrist are valid methods to determine maturation from U16 onwards in female football players, as complete ossification occurs around the fifteen years of age. 60 This considerations is crucial when comparing results across studies that classify maturation based on SA, as differences in the methods used to assess SA can lead to variations in both SA estimates and the resulting maturation status classifications.
Many studies (39%) used the APHV or the MO method. The APHV shows similar results to the Fels SA. 95 Most of the studies reporting APHV data present predicted results based on MO, since APHV requires longitudinal measurements to assess the exact moment at which PHV occurs. 5 Flores Olivares and Fragoso 96 reported for the error associated with measuring APHV. Specifically, measurements obtained before and at greater distances from the peak underestimate APHV, while those obtained after and farther from the peak overestimate it. Nevertheless, most of the papers using MO (N = 20) applied the Mirwald equation (N = 17), 34 which have been reported as lacking validity for females and female athletes by overestimating PHV, specially near the PHV.87,89,97 An alternative to establishing maturation status with a non-invasive method would be the %PAH attained with the Khamis-Roche method, 85 however, only 6% of the studies used it.47,59,77 Contrary to Mirwald, the Khamis-Roche method has been validated in females with an 94% agreement for the %PAH.94,98,99 The estimation of %PAH is not only valuable to determine maturation status, but also to determine the players’ predicted height, which might be relevant when selecting players. 13 In addition to anthropometric equations, the attainment of PAH can be also be done using SA. 5
Other method applied in 20% of studies was the determination of the SSC using Tanner's puberty stages. This approach can lead to inconsistent classifications of maturation status, with girls in Tanner stage II being classified has circa-PHV in some studies and as pre-PHV in another,43–46 while according to Murdey et al. 100 the stage II corresponds to the first stage of puberty. A disadvantage of the evaluation of SSC is its invasive nature, 13 which explains why it is not a method widely used.
Age at menarche was also a method applied in 25% of the studies. Menarche is a non-invasive method; however, it occurs after the onset of puberty. This means that a pre-menarcheal girl is not necessarily prepubertal. 13 Menarche typically occurs after the PHV. 5
Maturity status and timing
Based on the maturation methods used we were able to determine maturity timing means for each competitive level according to age (Table 3). We can observe that the mean APHV from the high to medium competitive levels is 12.5 and 12.4 years, respectively. The AM at the medium-level is 12.8 years, while the high-level players have menarche later, at 13 years. At the recreational level we were only able to determine the mean value for AM of 13 years.
It appears that high level players have, a slightly later maturation compared to medium-level players, either comparing APHV and AM. However, when comparing the mean APHV it appears to be similar to that of non-athletic population. According to the study of Mirwald et al., 34 the mean APHV of high level players (12.5 ± 0.8 years) was comparable to the one observed in the Leuven Longitudinal Twin Study (12.5 ± 0.8 years). Similarly, the mean APHV of medium level players (12.4 ± 0.5 years) was close to that reported in the Paediatric Bone Mineral Accrual Study (11.9 ± 0.7 years). This pattern had already been recounted in Malina et al. 95 who reported that female football players exhibited similar mean APHV to three longitudinal studies in a non-athletic population.
Age at menarche of football players is similar to that of the non-athlete population, it occurs between 11 and 13 years. 101 These results are in agreement with Malina et al. 95 where AM did not differ from normal populations (12.9 ± 0.9 years). Menarche is expected to happen 0.5 to 1.5 years after PHV, 101 which was the case of what was observed in this review, where age at menarche occurred always after the APHV. However, we have to conclude, based on the results presented in the Tables 2 and 3, that data on AM is lacking. There are few international or national studies that present mean values on AM of football players. Research discusses a lot about the impact of sport, especially the intensity of physical exercise on menarche, but in reality, in football only twelve studies report the AM. If we want to position menarche in relation to APHV there are even fewer studies that do so in football, only four, not allowing any meaningful of comparison between methods.
Most of the selected studies included predominantly “on-time” maturers (N = 17), while late maturers were represented in only four studies and early maturers in six studies. Among the 2401 players who had maturation status determined only 4% were late maturing, 24% early maturing and 72% were “on-time” matureres. This classification follows a similar trend to that observed in a sample of male Portuguese players, where the early maturers were predomantly selected over to the late maturing players. 102 Cumming et al. 77 found that recreational players were mostly “on-time” or late maturing. At the medium competitive level, player selection does not appear to depend on maturity status, as reported by Baxter-Jones et al. 47 This finding is consistent with Ginés et al. 41 who didn’t find any relationship between the coaches’ selection decisions and players maturity status. The lack of association between coaches’ player selection and maturity status can be attributed to the less popularity and competitiveness of female football when compared to the results of male counterparts.41,47 In addition, puberty in females begins on average two years earlier than in males.25,26,103 Unlike males, who experience a growth period of approximately six years, females generally have a shorter window of around five years. 104 These differences mean that, if selection occurs at the same ages (around 12 to 14 years), the effects of maturation tempo may be attenuated. Another factor could be the increase in fat mass during puberty, which occurs earlier in early maturing players and may negatively impact athletic performance. 2 This latter aspect might support why in high performance environments there are few athletes who have completed their maturation process, 37 and why most of players both in elite and non-elite settings are “on-time” maturers. 41 However, if our reasoning is correct it would be expected to find more late maturers in elite settings, yet, as Ginés et al. 41 reported there were few late maturing players across U12 to U16 groups. It might be relevant in future research to understand how a late maturing status relates to performance and body composition to better explain the small presence of these players in elite settings.
Anthropometric and body composition characteristics
A total of thirty-nine studies included anthropometric measures or body composition data. The maturity process relates to anthropometric and body composition. For example, with increasing SA there is an increase in body mass, lean mass and body surface area. 67 The studies that reported anthropometric and body composition characteristics allowed us to calculate the mean values for each competitive level of the players by chronological age and by MO as can be seen in Table 3. This was possible after obtaining the mean APHV for each competitive level, that value was used as baseline to determine MO intervals which allowed us to compare results between chronological age and maturation timing. Based on our results it is presumed that high-level players are taller than medium and low-level players. Considering weight, the high-level players are lighter (around 50–60 Kg) whereas medium-level players are the heaviest, with 52–63 kg, which possibly is a result of greater lean body mass. Fat mass is lower for high-level players compared with medium-level players.
Body composition results interpretation is dependent on the method applied in each study. BIA and Slaughter et al. equation 105 underestimate % fat mass (FM) compared to DXA. Nevertheless, Slaughter et al. equation 105 is the method showing better agreement with DXA in a female football players population. 70 This Slaughter equation was developed using a four compartment model, being validated for children and adolescents.70,106 Lozano-Berges et al. 71 developed and validated, with DXA, an equation for children aged between 11 and 14 years, using only the upper body skinfolds (triceps and iliac-crest). The authors reported no differences in lower limb composition from 11 to 14 years, explaining why only upper body skinfolds were used. 71
When comparing high-level players with the medium-level ones according to chronological age, we observe a tendency for the latter being taller, contrary to Ginés's and Malina's findings. 41 Ginés et al. 41 reported that, when maturation was not considered, players from elite academies (high-level) were taller than those from non-elite academies (medium or low-level), specially at 15–16 years. 95 In the study of Malina et al., 95 the authors found that at younger ages (11–12 years) the local players were taller and heavier than elite ones, but at 15–16 years the elite players became taller than the local ones. As for weight it does not appear to follow any tendency according to the competitive levels, as shown in Table 3.
When relating to maturation status, Martinho et al. 66 observed that U13 early maturing players were heavier and fatter. In older age groups like the U15 and U17, the differences across maturation groups were trivial. In U15 and U17 late maturing players were lighter and have less fat mass than the remaining. As an effect of training, during the season, while, also the maturation process takes place, there is an increase in height and lean mass.49,52 Additionally, in post-pubertal girls, fat mass can decrease during the season. 52 Therefore, timing and maturation status influence the anthropometric and body composition characteristics of the players. For example, early maturing players have greater values of body mass per stature, along with shorter legs and wider hips. This body structure and composition is associated with lower anaerobic, aerobic and gross motor skills. 17
When comparing football players to non-players, Söderman et al. 62 did not find any differences in what concerns height and weight, unlike Malina et al. 95 Martinho et al. 67 compared height and weight of Portuguese players to North-American general population references. It was found that Portuguese competitive players were on the 50th percentile in what regards to height, and between the 50th and 75th percentile for weight. The disparity between height and weight, might be explained by the fact that players were post-PHV and could exhibit greater fat mass. In another study, Martinho et al. 66 found no differences between football players and the general population regarding height and weight and fat mass.
BMI, which is a risk factor for injuries, 107 also shows differences according to the competitive level, with high-level players having a higher BMI than the medium or low competitive players. The differences in BMI might result from greater lean mass as a consequence of training. However, Cumming et al. 77 observed that BMI of recreational U12 and U14 players was also higher, with a BMI between the 50th and 75th percentile, and above the 75th percentile for the U16. In fact, when compared to non-players, football players have a greater lean mass and less fat mass,43,62,64 which is in agreement with the results of Pedrero-Tomé et al. 108 who found that peripubertal players had greater lean mass, in the lower body extremities, compared with non-players. 45
Sitting height and leg length were only measured in high-level players.56,73–75 According to Emmonds et al. 75 leg length had its greatest growth increase between 2.5 to 0.5 years before PHV, due to the peak of leg length velocity. After this period Emmonds et al. 75 described a trunk and leg length growth plateau.
Years of football exposure and physical performance
Regarding years of football exposure there are few studies that report this variable, despite its importance for body composition and physical performance. When reported, football exposure had a range between 2 to 8 years. However, a lack of information about the players exposure is the most common practice when we analysed the selected studies.
Most of the reported results on physical performance are of high-level players (Supplementary Material 4, 5 and 6). It must be noted that different testing was performed for the same physical capacity and that, when testing talent, jumping, sprinting and agility testing results are more reliable in post-pubertal athletes. 65 However there are some tests, like 10 m sprinting, long jump or the 5–10–5 agility test where maturity is a better predictor of performance. 61 For the most part, increased maturation results in fitness performance improvements,58,61,75 with the exception of relative peak force.
Power
Power performance was tested through jumping tests, predominantly the CMJ. Across all studies CMJ reached near 30 cm of height, improving with chronological age and maturity.8,48,61,65,75 According to Castagna and Castellini 109 a jump of 29.8 cm allows to distinguish the best athletes. However, the authors only considered chronological age to determine this cut-off value. In agreement with Castagna and Castellini, 109 Ramos et al. 110 found that selected and non-selected Brazilian players had differences in the CMJ performance, with senior selected players having a better performance than the non-selected ones. However, the U17 selected players jumped less than the non-selected ones. The CMJ tends to improve until 15 to 16 years and then a plateau is recorded.110,111 Emmonds et al. 48 reported power performance improvements during in-season at U17, evaluated through jump tests and drop jump (DJ) performance index. 52
For sprinting the best reported result at the 10 m was for the medium-level players with 1.88 s, followed by 1.94 s for the high-level players. Sprinting performance follows the same pattern as the jumping performance. In sprinting there is an improvement, specially between 2.5 and 0.5 years before the PHV.56,75 This might be explained by several factors: the increased leg length, improved relative strength or/and biomechanics and neuromuscular control. 75 In small distances (10 m) better performances are observed between −0.5 to 0.5 years to PHV or at younger ages (13–14 years), due to the phosphocreatine system development. 75 According to the chronological age, during in-season the 10 m and 30 m sprints speed decreases in U10 and U12 players, while in U14 and U16 improves. 48 In 5 m and 20 m sprints the in-season sprint performance decreases in U13 and U15 players. 55
Anaerobic and aerobic endurance
Anaerobic endurance, measured through RSA tests (running several sprints interspersed with short rest), improves with maturation, but also with training mainly in prepubertal players.50,57 Anaerobic endurance also showed an in-season increment in U12, U13 and U15 players.49,50,55
Aerobic endurance, measured with the YYIRL1 test, improves with chronological age and along the maturation process. The greatest differences in aerobic endurance are observed between 0.5 years before PHV and 0.5 years after PHV and the best results at age 15.57,75 Aerobic endurance is the best talent predictor in post-PHV, compared to CMJ and sprinting. 8 The YYIRL1 performance is expected to improve even at the senior level. 110 During in-season aerobic endurance improves in U12, U16 and U17.48,52
Agility
Change-of-direction ability, measured with the 505 COD test, improved with chronological age and maturity.48,75 Between 11 and 12 years a plateau is expected in change-of-direction ability, while greater improvements are due between 12 and 13 years, which decrease between 15 and 16 years, reaching a plateau from there onwards.65,111 The improvements across maturity,48,57,61,75 might be explained by the improved control in eccentric force production. 56 However, during the circa-PHV period there is a decrease in improvement, followed by a strong increment at post-PHV. 57 During the in-season, agility performance decreases in U10, U12, U13 and U15.48,55
Strength
Lastly, strength was determined according to the relative and absolute peak forces.48,74,75 The relative peak force had few improvements across chronological age, with the lowest value at 15 years (25.36 N/kg) and the best performance at 11 years (28.09 N/kg). From 11 years and after the PHV relative peak force tended to reach a plateau. Regarding the absolute peak force the contrary was observed, with its increase with maturity, due to an increase in body mass. 75 This explains the similar relative peak force across chronological age and maturity. This results allows us to conclude that the maturation process grant advantageous changes concerning muscle structure, size and metabolism and that the increase in absolute peak force is proportional to the body mass increase.65,111 Such process has implications on the injury risk of more mature and heavier players. In addition, by looking at the force production profile the reported results variation seems related to the maturity status of the players. The impulse between the first 100 ms and 300 ms is greater in post-pubertal athletes; whereas at 100 ms prepubertal athletes have better values than peripubertal ones. 74 The peripubertal athletes are the ones who have less relative impulse. 74 During in-season relative force improves in both U10 and U12 players. 48
Strengths and limitations
The scoping review followed the PRISMA-SR Checklist. 29 The study encompassed the assessment of three databases by at least two independent reviewers, and scoped studies written in three different languages. This review is not without its limitations. Firstly, the inconsistency of maturity indicators reported across research papers made direct comparisons difficult, leading to a preference for a more descriptive approach. Secondly, the lack of information relating to average maturity indicators references, like the APHV of AM, for each sample made it impossible to compare each one with population-wide reference values. These lead us to our methodology: applying the average APHV values attained for each competitive level. We also add that despite being, to our knowledge, the first research to present mean values for maturity, anthropometrics, body composition, and physical performance, these findings must be interpreted with caution due to a lack of research on these topics. For instance, concerning physical performance testing, results primarily pertain to high-level players; however, in fact, few studies reported the competitive level of athletes. Another aspect to consider is the variation in the age-group cut-off dates, particularly between England (12 articles) and the remaining countries. Furthermore, the information regarding the subject's football training age, which may influence the reported body composition and physical performance results, was frequently missing, with only fifteen studies reporting the football training age. Finally, no data regarding ethnicity was included due to the lack of information available in the existing literature which lead to the authors decision of not debating this variable.
Conclusion
To the best of our knowledge this is the first review focusing on the maturation in women's football. The strength of our work is the wide span of studies reviewed and selected by different authors to reduce bias.
The most common maturity indicators were APHV and MO, followed by AM and the evaluation of the SSC with the Tanner Stages method. SA, despite being the standard maturation indicator was only reported in three studies. Only two studies had a sample of low-level players, medium-level players were studied in seventeen studies, while twenty-one studies reported on high-level players. According to maturation status most of the reported studies had an heterogenous sample, with a complete absence of studies focusing on late and early maturing players only. The mean APHV for high-level players was 12.5 ± 0.8 years and the AM was 13 years. The average height and weight for high-level players at PHV were 152.5 ± 5.7 cm and 44.5 ± 6.6 kg respectively. For the medium-level players the mean APHV was 12.4 ± 0.5 years, the AM 12.8 ± 0.1 years.
Thirty-nine studies examined anthropometric and body composition characteristics, with thirty-eight reporting the average height and weight of the samples. It was observed that high-level players were shorter and lighter than their medium and low-level counterparts, and had less fat mass suggesting that the training load may contribute to a reduction in fat mass among post-pubertal players. Furthermore, early maturing players were heavier and exhibited greater fat mass, particularly at younger ages, such as U13.
The lack of data on maturation and limited understanding of its relation with physical performance may have practical implications, as improvements resulting from the natural maturation process could be mistakenly attributed to training. For example, the height of the Countermovement Jump progressively improves with chronological age until 16 years, particularly after Peak Height Velocity, when maturity is considered. Sprinting performance shows the most significant improvement before PHV, although it continues to increase throughout chronological age and maturity. Anaerobic endurance enhances with maturity, while training yields greater improvements in pre-pubertal players. Change-of-direction ability develops across chronological age and maturation, with more significant improvements between the ages of 12 and 13 and after PHV. Relative peak force remains similar across maturation, but absolute peak values improve due to the increase in body mass.
Undoubtedly, research on women's youth football is limited, particularly regarding the players’ maturation status. This limitation is more pronounced given that females begin and complete the maturation process earlier than males, which highlights the need to conduct research on female football players at younger ages. There is a lack of understanding regarding changes in fitness and body composition among female players throughout the maturation process, despite the potential associations involved. Nevertheless, the results of this scoping review highlight the significance of the maturation process in women's football. Coaches, performance staff, and medical personnel should remain mindful of their players’ maturation status to better customise training and respect their windows of opportunity. Further research is necessary to address these important topics, as some training practices, such as fitness training or injury prevention, are currently being implemented without adequate scientific support.
Supplemental Material
sj-pdf-1-spo-10.1177_17479541251380019 - Supplemental material for Growth and maturation in youth female football players and its association with body composition and physical performance: A scoping review
Supplemental material, sj-pdf-1-spo-10.1177_17479541251380019 for Growth and maturation in youth female football players and its association with body composition and physical performance: A scoping review by Fabiana Parreira Bonito, Stacey Emmonds, Júlia Teles, Behnam Keshtkarhesamabadi, Fernando Moura, Manuel João Coelho-e-Silva and Maria Isabel Fragoso in International Journal of Sports Science & Coaching
Supplemental Material
sj-docx-2-spo-10.1177_17479541251380019 - Supplemental material for Growth and maturation in youth female football players and its association with body composition and physical performance: A scoping review
Supplemental material, sj-docx-2-spo-10.1177_17479541251380019 for Growth and maturation in youth female football players and its association with body composition and physical performance: A scoping review by Fabiana Parreira Bonito, Stacey Emmonds, Júlia Teles, Behnam Keshtkarhesamabadi, Fernando Moura, Manuel João Coelho-e-Silva and Maria Isabel Fragoso in International Journal of Sports Science & Coaching
Footnotes
ORCID iDs
Ethical considerations
This study was approved by the Ethics Committee of Faculty of Human Kinetics, following the ethical principles that have their origin in the Declaration of Helsinki (CEIFMH No. 25/2023, approved on 6 September 2023.
Consent to participate
Not applicable.
Consent for publication
Not applicable.
Authors contributions
Conceptualization done by F.B. and I.F.; methodology was done by F.B., J.T.; data curation by F.B., S.E., J.T., B.K., I.F.; formal analysis by J.T.; writing the original draft by F.B. and revising by I.F., S.E., M.C.S., F.M.; supervision done by I.F.
Funding
Declaration of conflicting interests
The authors declared no potential conflicts of interest with respect to the research, authorship, and/or publication of this article.
Data availability
Supplemental material
Supplemental material for this article is available online.
References
Supplementary Material
Please find the following supplemental material available below.
For Open Access articles published under a Creative Commons License, all supplemental material carries the same license as the article it is associated with.
For non-Open Access articles published, all supplemental material carries a non-exclusive license, and permission requests for re-use of supplemental material or any part of supplemental material shall be sent directly to the copyright owner as specified in the copyright notice associated with the article.