
Abstract
Fastballs with greater upward vertical break (“rise”) are believed to induce missed swings. However, batters may use learned associations between pitchers’ throwing arm angles and ball kinematics to predict the trajectory. Even with identical kinematics, batters may respond differently when ball kinematics deviate from expectations based on arm angle. We tested a hypothesis that fastballs typical for a given arm angle are easier to hit in Major League Baseball. We analyzed ball-tracking data from 297 pitchers throwing >150 fastballs swung at during the 2023–2024 seasons. Preliminary regression analysis showed that arm angle explained 67% of the variance in spin axis, so we used the residuals to define a deviation score, representing the atypicality of spin axis for each arm angle. Multiple regression analysis tested whether the variance in Whiff% (missed swings/total swings) was explained by the deviation score and covariates in each pitcher-batter handedness matchup. All variables together explained 41%–52% of the variance in Whiff% (p < .001). The quadratic terms of the deviation score were insignificant, rejecting our hypothesis. In same-side matchups, spin axis showed a positive association with Whiff% while the deviation score showed a negative association, indicating that pitchers whose fastballs had an axis more inclined toward horizontal had lower Whiff%, but those with an axis more inclined toward horizontal for a given arm angle achieved higher Whiff%. These findings suggest that in recent games, fastballs with an axis atypically inclined toward horizontal, potentially generating greater rise, induce more missed swings than fastballs merely having greater rise.
Introduction
In baseball, the increasing availability of affordable and portable measurement systems for a pitched ball, such as Rapsodo flight monitor (Rapsodo Baseball, Singapore), MA-Q (Mizuno Corporation, Japan), and Trackman Baseball (Trackman A/S, Denmark), has allowed pitchers at all levels to measure pitched ball kinematics on a pitch-by-pitch basis. These technological advances have led to a new concept, the so-called “pitch design”,1–3 which has become a mainstream method for developing pitching skills. Through the process of pitch design, ball-tracking systems can provide sophisticated feedback to help pitchers monitor and adjust ball velocity, spin, and the magnitude and direction of spin-induced displacements (hereinafter, break) to create a desired flight trajectory. 2 To make adjustments in accordance with a pitcher's strategic objective, it has become increasingly important to identify ball kinematics and flight trajectory characteristics associated with targeted outcomes.
Although pitches are generally categorized by type (e.g., fastball, slider), even within the same pitch type, substantial variation in ball kinematic characteristics exists across pitchers. Nagami et al. 4 reported a wide range of spin axis directions for fastballs among collegiate and professional pitchers, with elevation angles ranging from −54° to −17° and azimuth angles from −3° to 52°. This variation may, in part, be attributable to the throwing arm angle, which has been shown to correlate with fastball spin axis direction. 5 Due to substantial variations in ball kinematics within each pitch type, the kinematic profile of fastballs thrown by one pitcher may overlap with breaking ball profiles thrown by another. Umemura et al. 6 analyzed pitched ball kinematic data collected by a radar tracking system from 305 pitchers in Japan's professional baseball league. They applied a machine learning method to classify pitches based on the ball kinematic characteristics and found that the pitch types identified by this method did not correspond to the pitch types self-declared by the pitchers, suggesting that pitch type cannot be determined solely based on ball kinematic characteristics. This intra-pitch-type variability in kinematics should result in different pitching results.
Batters, in turn, integrate multiple information sources, including situational probabilities 7 (e.g., the ball-strike count that a pitcher tends to throw a breaking ball), advanced cues (e.g., a pitcher's throwing motion), and visual information available in the early stage of the ball trajectory8,9 to predict pitch types, kinematics, and flight trajectory. Experimental studies in baseball and softball have shown that skilled batters use advanced cues about a pitcher's throwing motion to predict the pitch type (i.e., fastballs, curveballs, and changeups), 10 pitch location, 11 and fastball speed.12,13 Visual information about the ball trajectory also helps batters predict the location of the pitched ball at home plate.11,14 Given limited time to process visual information about the ball trajectory before the motor response (i.e., swing) is initiated, batters must rely on advanced cues and supplementally use visual information available in the early stage of the ball trajectory. 8 Since significant relationships have been found between a throwing arm motion and fastball kinematics, such as between spin axis direction with hand orientation 15 and forearm angle at ball release,4,5 and vertical break with forearm pronation motion, 16 batters may learn this relationship through practice and integrate it to predict ball kinematics and trajectory.
In practice, fastballs with greater upward vertical break, often described as “rise”, are widely believed to increase swing-and-miss rates, as noted by Major League Baseball. 17 Similarly, fastballs with higher spin rate and axis more inclined toward horizontal, which contribute to an increase in upward vertical break, are also believed to generate more missed swings. 18 However, even when fastballs have identical kinematic profiles, professional batters, who presumably have highly developed anticipatory skills, may react differently based on whether ball kinematics align with the expectations derived from advanced cues. When fastball kinematics deviate from this expectation, such as fastballs with an axis atypically inclined toward horizontal and great rise from a sidearm delivery, the deviation may disrupt the batter's perception and prediction, influencing their batting results. The typicality of fastball kinematics for a given pitcher's throwing arm angle may influence opposing batter performance.
Pitchers use various strategies to get batters out, and these differences may affect the relationship between fastball kinematics and batter performance. For example, strikeout-focused power pitchers 19 tend to use high-speed fastballs to induce missed swings, whereas control-focused pitchers 19 (e.g., Hall of Famer Greg Maddux 20 ) tend to use a variety of pitch types with precise command to induce weak contact and ground balls. Consequently, the influence of the typicality of fastball kinematics for a given pitcher's throwing arm angle on batter performance may differ across pitchers based on their playing styles. To date, however, the relationship between fastball kinematics and pitcher performance has not been systematically examined by pitcher playing style. Clarifying this relationship will help understand how a pitcher's delivery and fastball kinematics influence batter performance and provide concrete style-specific targets of fastball kinematics during a pitch design process. In the present study, therefore, using ball-tracking outputs collected in MLB games, we tested three hypotheses: (1) throwing arm angle is significantly associated with fastball kinematics, (2) pitchers whose fastballs have more typical kinematics for a given throwing arm angle have worse pitching statistics compared with those with atypical ones, and (3) the magnitude of this influence differs across pitcher playing styles.
Materials and methods
Baseball-tracking data from MLB games during the 2023–2024 seasons were obtained from the MLB database (https://baseballsavant.mlb.com/statcast_search). These data, collected by the StatCast tracking system 21 at all official MLB ballparks, are publicly available for non-commercial use; thus, ethical approval was not sought for the present study. According to MLB reports, the measurement errors of the system, such as errors in ball position, locations where a batted ball landed, and player locations, were within 0.25 inches (≈ 6.3 mm) on average. 22
Data included player identification, pitcher's handedness, age, height, weight, throwing arm angle at release, pitch type, ball kinematics, namely ball position in the vertical and horizontal directions at home plate, ball speed, spin rate, and spin axis direction, and corresponding pitching results. All variables expressed in imperial units were converted into SI units. The pitched ball kinematics for left-handed pitchers were mirror-reversed. The spin axis direction of fastballs is described by the elevation angle of the angular velocity vector in the vertical plane at the point of release. An angle of 0° represents pure topspin, while an angle of 180° corresponds to pure backspin. The throwing arm angle is defined as an angle of the vector pointing from the pitcher's throwing shoulder to the ball location relative to the horizontal plane at ball release. 23 Throwing arm angles of 0° and 90° represent the throwing arm angled horizontal to the ground (side-arm) and angled vertical to the ground (overhand), respectively.
For the analysis, we selected 297 MLB pitchers who threw at least 150 fastballs that were swung at in any handedness matchups during the 2023–2024 seasons. This included 199 pitchers for same-side matchups (170 right-handed and 29 left-handed) and 281 pitchers for opposite-side matchups (188 right-handed and 93 left-handed). Due to the limited number of fastballs that were swung at in individual seasons, data during two consecutive seasons were analyzed. A pitcher's role (starter or reliever) in the seasons was defined according to whether the pitcher started in >50% of games played. As a result, 112 (56%) pitchers were classified as starters and 87 (44%) as relievers for same-side matchups. For opposite-side matchups, 165 (59%) pitchers were classified as starters and 116 (41%) as relievers. In addition, to describe differences in pitcher playing styles, we classified pitchers into four groups based on median values of their seasonal strikeout rates (strikeouts divided by total batters faced; K%) and walk rates (walks divided by total batters faced; BB%): highK%-lowBB%, highK%-highBB%, lowK%-lowBB%, and lowK%-highBB% groups, in accordance with the common use of K% and BB% in baseball media to characterize pitcher playing styles.24–26
Means of initial speed, spin rate, spin axis direction, and ball position in the vertical and horizontal directions at the instant that a ball crossed home plate were calculated for all fastballs thrown by each pitcher. To quantify the deviation of spin axis direction for a given throwing arm angle, we modeled the spin axis direction as a linear function of throwing arm angle, and each observed value was decomposed into a fitted value, representing the arm-angle-specific typical spin axis, and a residual as a deviation score, which indicates how atypical the spin axis was for a given throwing arm angle. Negative deviation scores represent fastballs with an axis more inclined toward horizontal for a given throwing arm angle, while positive scores indicate an axis more inclined toward vertical for a given throwing arm angle. The deviation score was interpreted in the same manner across pitcher's handedness. Furthermore, the whiff rate (Whiff% [%]: missed swings divided by total swings and multiplied by 100) was computed to evaluate pitcher performance.
To reduce the influence of extreme values on the regression analyses, data with values outside the threshold defined by the interquartile range (IQR) (i.e., [the first quartile – 2*IQR, the third quartile + 2*IQR]) were excluded (4 pitchers for same-side matchups and 13 pitchers for opposite-side matchups). The Shapiro-Wilk test indicated that most variables were normally distributed across pitchers (p-values ranging from .052 to .887), except for age, height, and weight (p < .017). Simple linear regression analysis was conducted to examine whether throwing arm angle significantly explains the variance in spin axis direction. In addition, multiple linear regression with forced-entry was conducted to examine the relationship between the deviation score and Whiff%, with adjustment for fastball kinematics, including mean values of initial speed, spin rate, and vertical and horizontal positions at home plate, pitcher's characteristics (i.e., pitcher's handedness (right = 1, left = 0), pitcher's role (starters = 1, others = 0), age, height, and weight), and K%-BB% group. Horizontal ball motion may influence the batter performance differently between same-side and opposite-side matchups, so the regression analysis was conducted for each matchup type separately. The fitted value of spin axis direction for a given arm angle instead of the spin axis direction itself was entered into the model. The fitted values and residuals are orthogonal by this approach, so we can estimate the effect of the deviation score of spin axis and fitted value of spin axis direction on Whiff% independently. To test whether pitchers whose fastballs have more typical kinematics for a given throwing arm angle have worse pitching statistics compared with those with atypical ones, both the linear and quadratic terms of the deviation score were included. Furthermore, to examine whether the magnitude of this influence differs across pitcher playing styles, we included an interaction term between the deviation score of spin axis direction and K%-BB% group. Using the highK%-lowBB% group as a reference, we tested whether the magnitude of this influence in the highK%-lowBB% group differs significantly from that in the other groups.
Multicollinearity among independent variables was assessed using the variance inflation factor, with values above 10 indicating high multicollinearity.27,28 The variance inflation factor values were below 2.7, indicating no multicollinearity among the independent variables. The significance level α was set at 0.05 for all tests. All analyses were conducted using R statistical software. 29
Results
Descriptive statistics for variables considered in this study are presented in Table 1. Mean throwing arm angle was 41.0° ± 11.0° and was significantly negatively correlated with Whiff% for same-side matchups (Pearson's r = −.22; p = .001) and for opposite-side matchups (r = −.23; p < .001), but these effect sizes were negligible. Simple linear regression showed that throwing arm angle explained 67% of the variance in spin axis direction (p < .001; Figure 1). Mean spin axis direction was 214° ± 12°, and its deviation score was 0° ± 6°. Thus, throwing arm angle accounted for half the between-pitcher variance in spin axis direction.
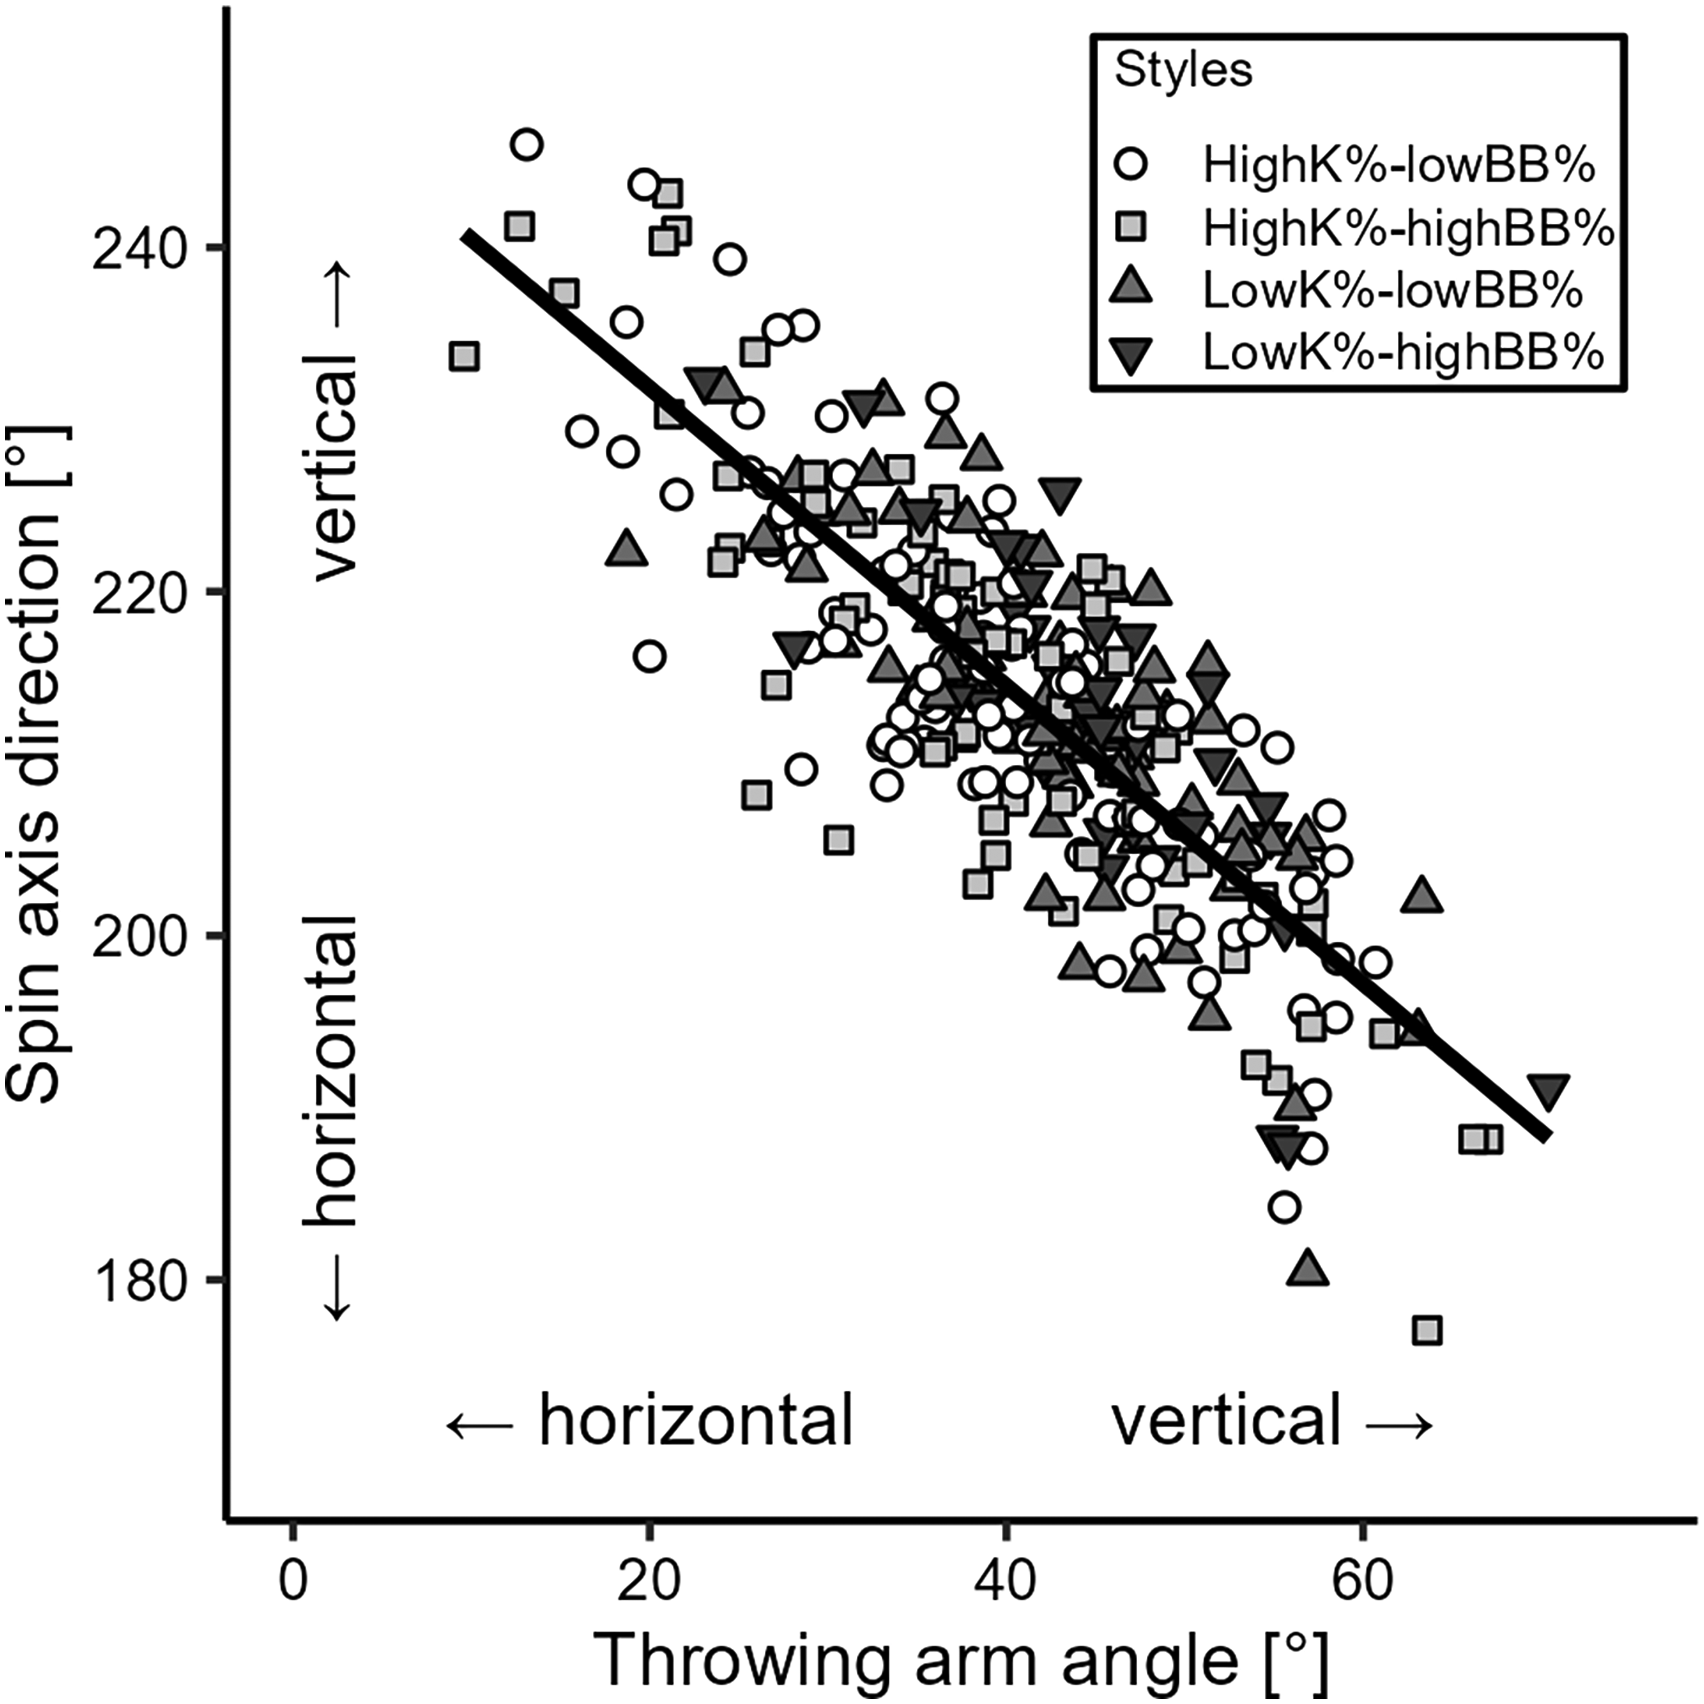
Linear relationship between throwing arm angle and spin axis direction.
Descriptive statistics for variables considered in this study.
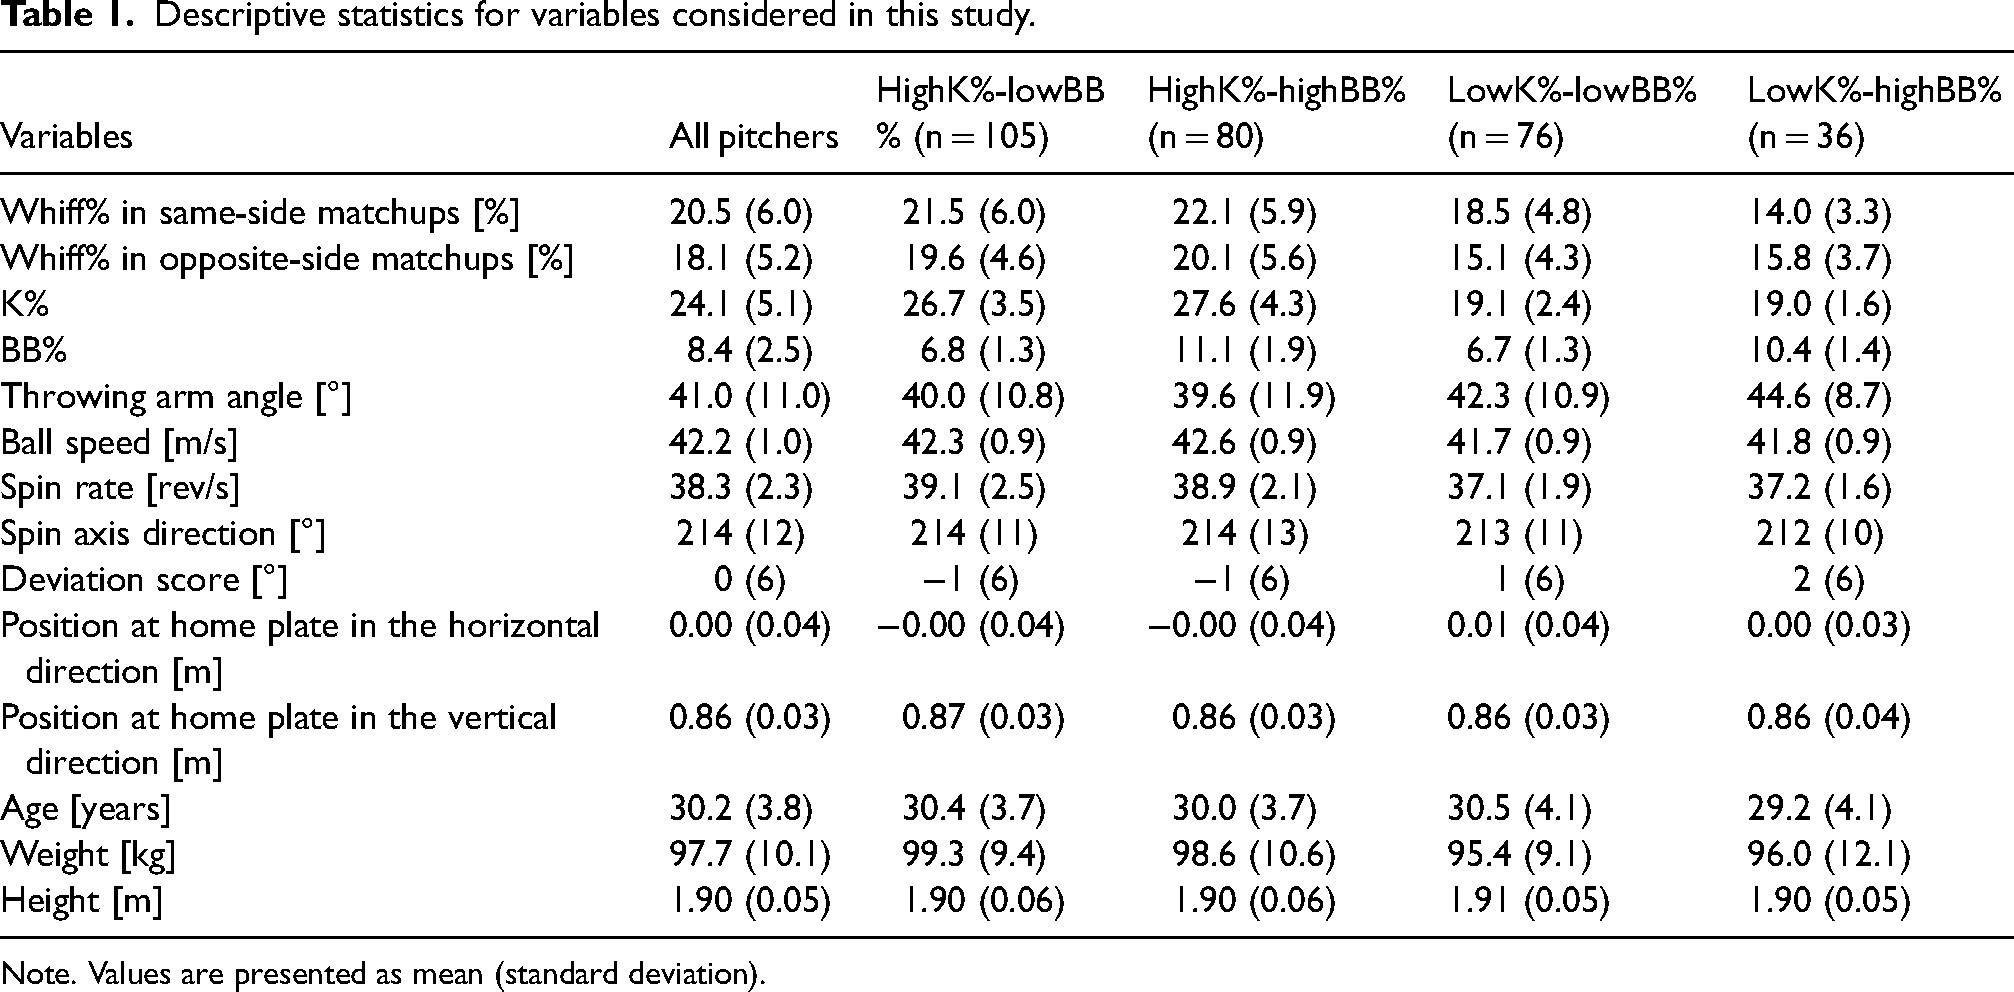
Note. Values are presented as mean (standard deviation).
Multiple linear regression including both the quadratic and linear terms of the deviation score showed that the model was significant for same-side matchups (F = 9.78; p < .001) and opposite-side matchups (F = 20.64; p < .001). In both matchups, the quadratic term was not significantly associated with Whiff% (β = −0.01 and p = .133 in same-side matchups; β = −0.01 and p = .206 in opposite-side matchups). After excluding these non-significant quadratic terms, the models explained 41% and 52% of the variance in Whiff% for same-side and opposite-side matchups, respectively (Table 2).
Multiple linear regression analysis evaluating the associations of independent variables with Whiff%.
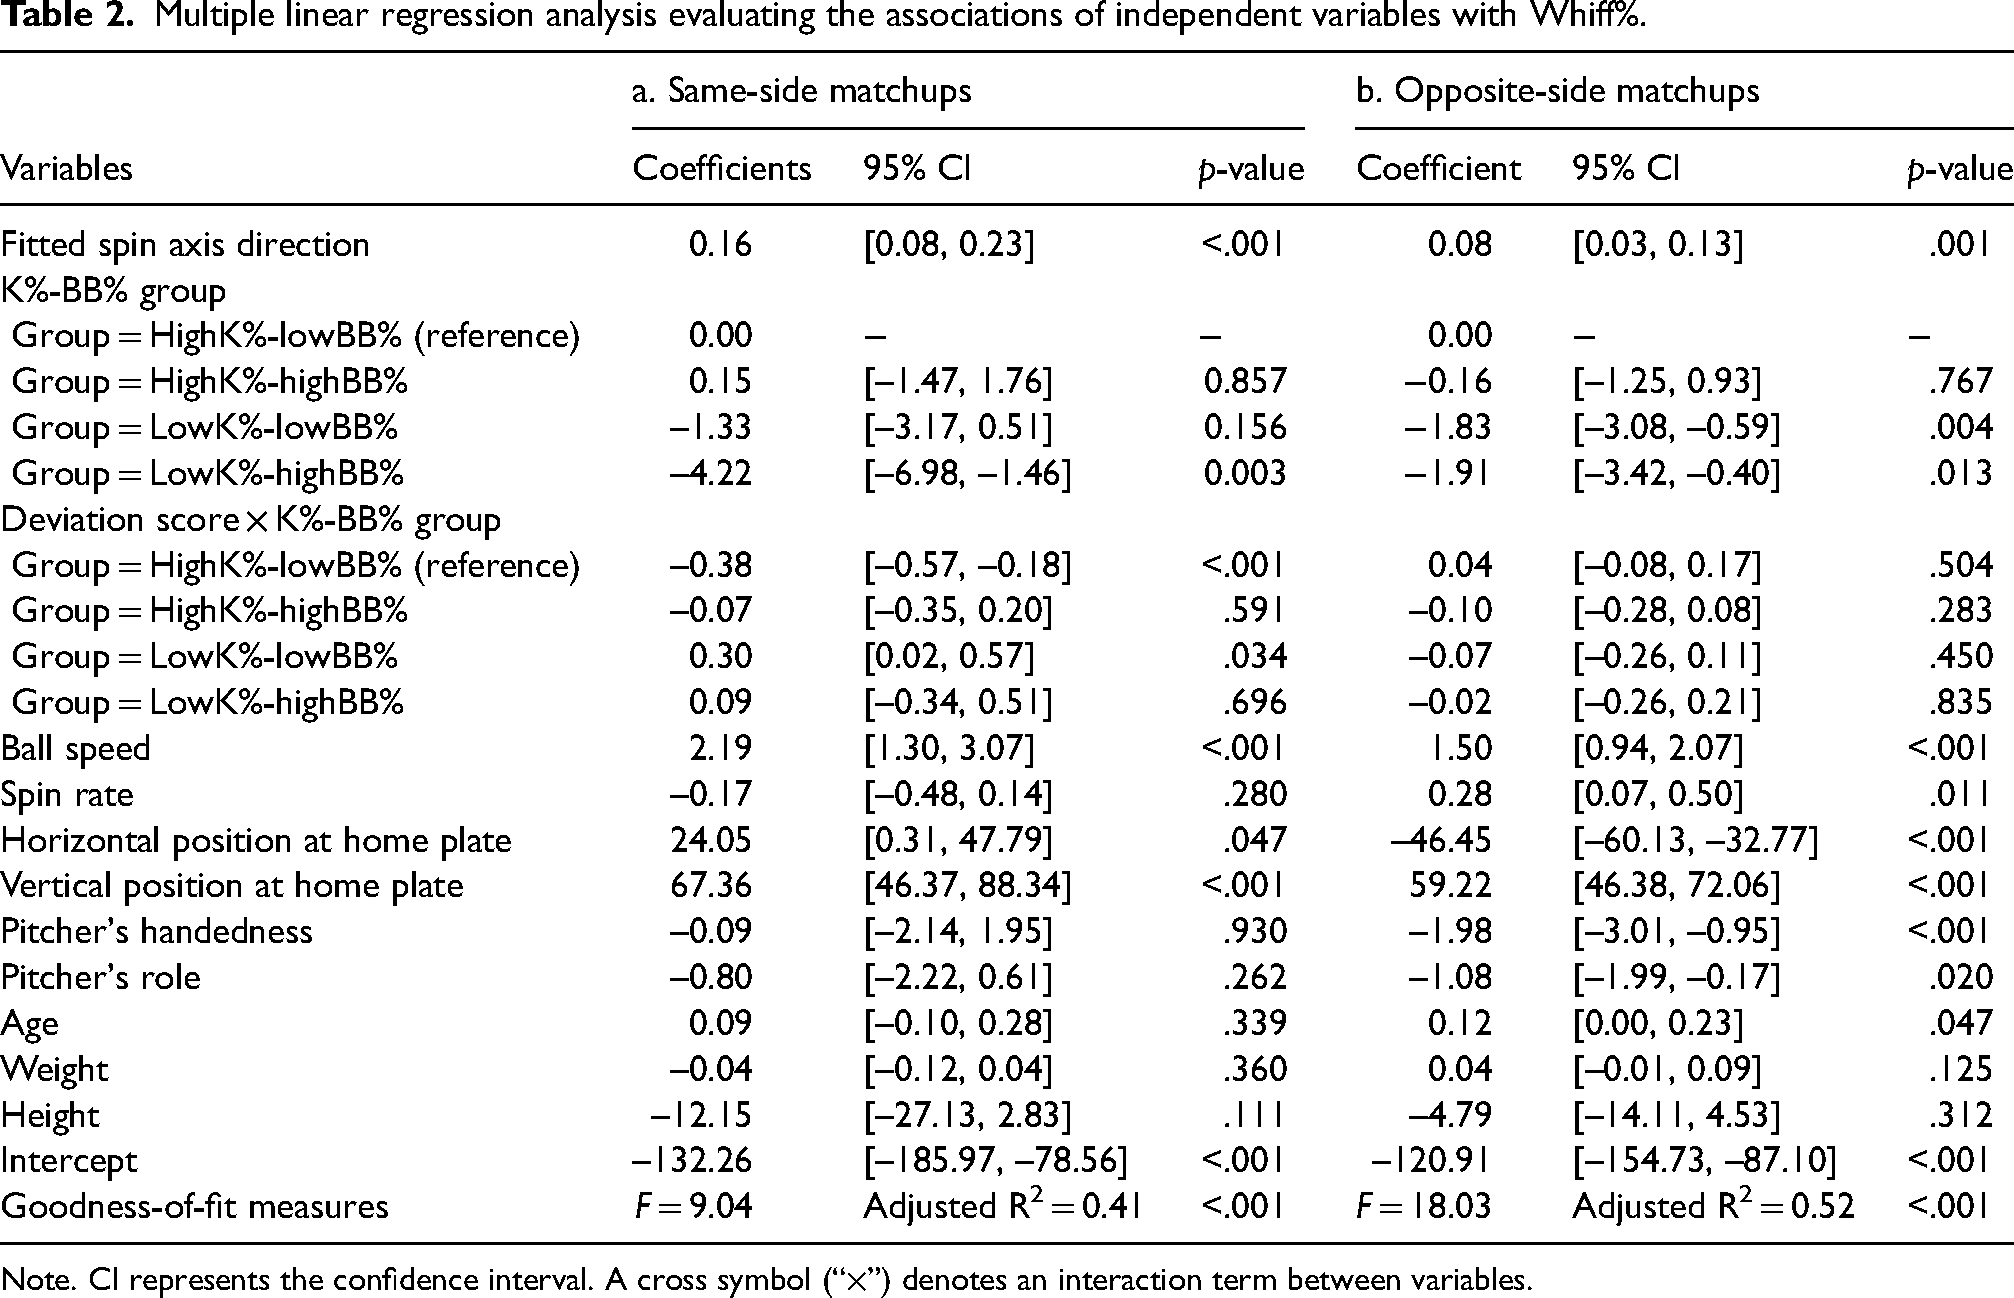
Note. CI represents the confidence interval. A cross symbol (“×”) denotes an interaction term between variables.
In same-side matchups, using the highK%-lowBB% group as the reference, the interaction between the deviation score and K%-BB% group was significant for the lowK%-lowBB% group (β = 0.30; p = .034) but not for the highK%-highBB% group (β = −0.07; p = .591) and the lowK%-highBB% group (β = 0.09; p = .696), after accounting for other covariates (Table 2a). The estimated simple slope for the highK%-lowBB% group was −0.38 (p < .001; Figure 2), which was significantly greater than that for the lowK%-lowBB% group (slope = −0.08) but not significantly different from those for the highK%-highBB% group (slope = −0.45) and the lowK%-highBB% group (slope = −0.29). A post hoc test showed that the slope for the lowK%-lowBB% group was not significantly different from zero (p = .480). These results indicate that, after adjusting for covariates, pitchers whose fastballs had a spin axis 3° more inclined toward horizontal than expected for a given throwing arm angle achieved a 1.1% higher Whiff% in the highK%-lowBB% group, a 1.4% higher Whiff% in the highK%-highBB% group, and a 0.9% higher Whiff% in the lowK%-highBB% group. In contrast, no significant interactions were found in opposite-side matchups (range of p-values = .283–.835; Table 2b).
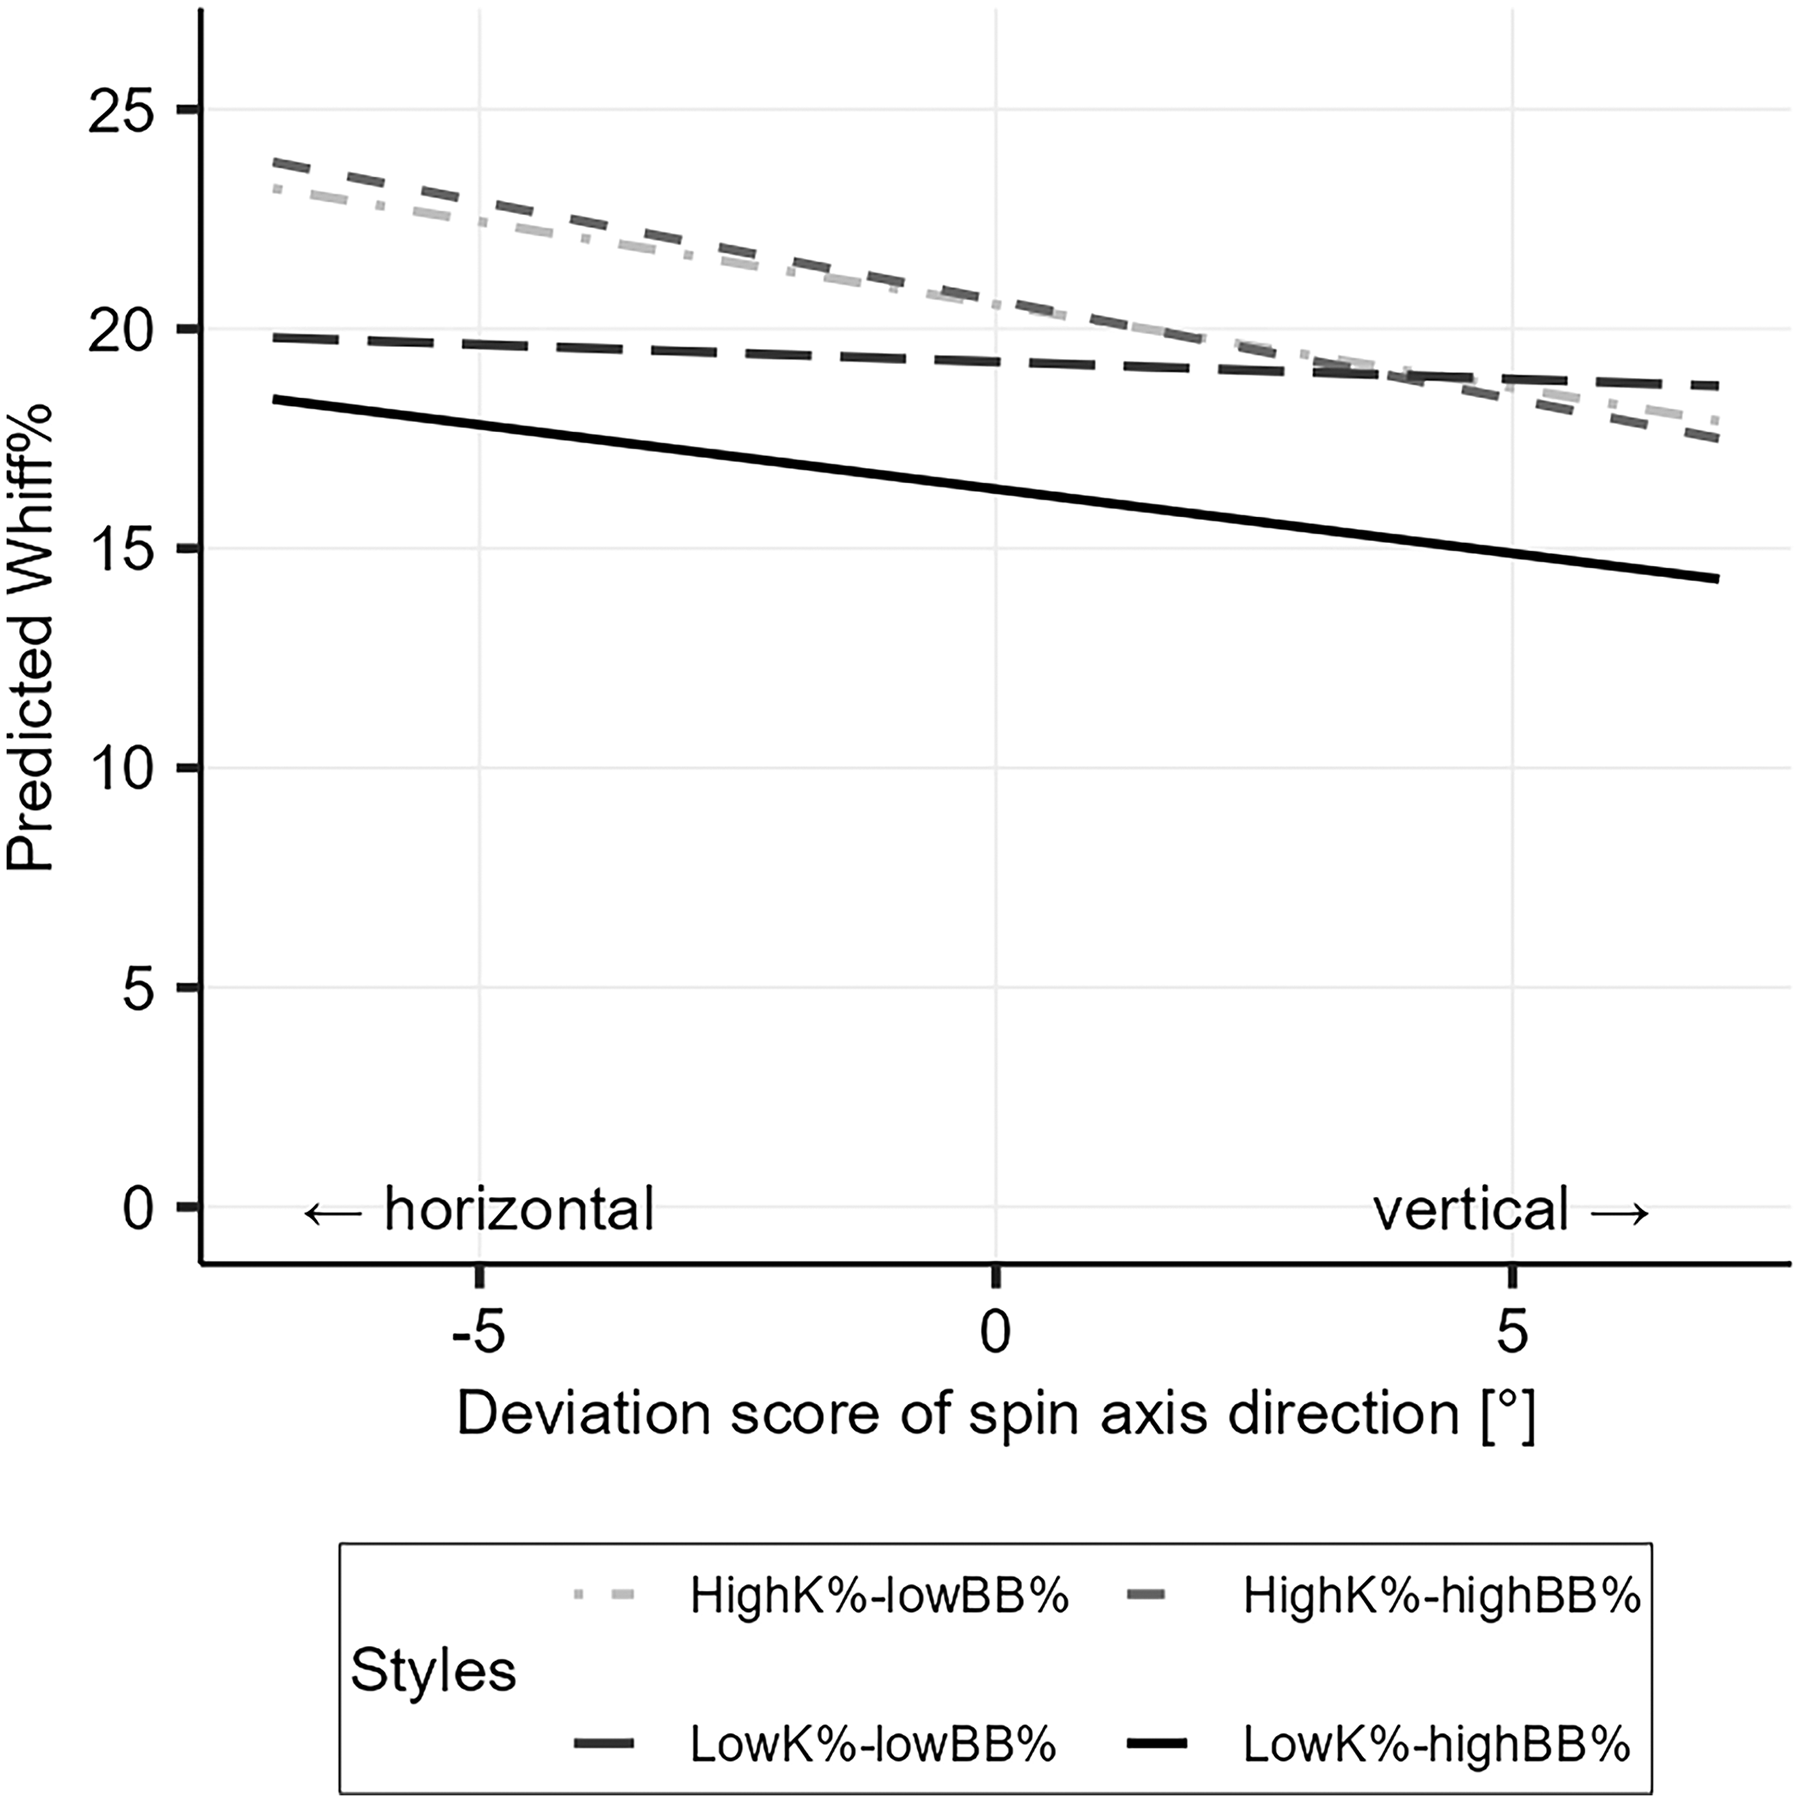
Estimated effect of the deviation score on Whiff% for each K%-BB% group, adjusted for other covariates at their mean values.
The fitted spin axis direction was significant in both same-side (β = 0.16; p < .001) and opposite-side matchups (β = 0.08; p = .001). Interestingly, the sign of the coefficient for the fitted spin axis direction was opposite to that for the deviation score of spin axis direction. After accounting for the covariates, pitchers with a fitted spin axis direction 6° more inclined toward vertical had a 1.0% higher Whiff% in same-side matchups and a 0.5% higher Whiff% in opposite-side matchups.
Discussion
The aim of this study was to test three hypotheses: (1) throwing arm angle is associated with spin axis direction, (2) pitchers whose fastballs have typical kinematics (i.e., spin axis direction) for a given throwing arm angle have a lower Whiff% compared with those with atypical values, and (3) the magnitude of this influence differs across pitcher playing styles. The results of regression analyses showed that throwing arm angle explained 67% of the variance in spin axis direction, supporting the first hypothesis. In addition, after accounting for given covariates, no significant quadratic relationship was found between the deviation score and Whiff% in either matchup type, thus rejecting the second hypothesis. Moreover, in same-side matchups, the results indicate that pitchers in the highK%-lowBB%, highK%-highBB%, and lowK%-highBB% groups whose fastballs had an axis more inclined toward horizontal for a given throwing arm angle achieved a higher Whiff%, whereas pitchers in the lowK%-lowBB% group did not. In opposite-side matchups, no significant interaction was found. Thus, the third hypothesis was partially supported, applying only to same-side matchups. Interestingly, the fitted spin axis direction was positively associated with Whiff% in both matchups, indicating that pitchers whose fastballs had an axis more inclined toward vertical had a higher Whiff%, after accounting for given covariates. Given that an axis more inclined toward horizontal can increase the upward vertical break of fastballs, this finding appears to contradict the prevailing assumption that fastballs with greater upward vertical break induce more missed swings.
The present results showed that throwing arm angle explained 67% of the variance in spin axis direction. This is consistent with previous reports showing how throwing arm orientation and motion relate to pitched ball kinematics and flight trajectory, such as the relationships between forearm pronation motion and vertical break of the fastballs in collegiate pitchers, 16 between finger force on the ball and spin rate, 30 and between hand orientation just before ball release and fastball spin axis direction in collegiate pitchers. 15 In addition, this study found that accounting for throwing arm angle reduced the inter-pitcher variance in spin axis direction from 12° to 6°, indicating that throwing arm angle accounted for much of the variance. Taken together, these findings suggest that throwing arm angle is one of the determinants of fastball kinematics in MLB pitchers, and throwing arm angle may be important visual information for batter's spatial and temporal predictions.
The results of the multiple linear regression analysis indicate that pitchers whose fastballs had a spin axis closer to vertical had a higher Whiff% in both matchups, after adjusting for covariates. Because the spin axis direction is one of the determinants of the magnitude of vertical break, the finding can be interpreted as meaning that pitchers whose fastballs have a greater upward vertical break do not necessarily achieve a higher Whiff% in the recent MLB games. This interpretation is not consistent with the prevailing assumption that pitchers whose fastballs have greater upward vertical break are likely to induce missed swings. 17 This apparent contradiction might have been attributed to a lack of differentiation between within-pitcher variance, which refers to differences in kinematics and trajectory among fastballs thrown by the same pitcher, and between-pitcher variance, which refers to differences in average fastball kinematics across pitchers, when analyzing the association with pitching results. To examine this, we analyzed pitch-by-pitch fastball data for the 2021–2024 seasons and decomposed values of vertical break as well as horizontal break, ball speed, and spin rate into a pitcher-level mean (representing between-pitcher effects) and a deviation from that mean for each pitch (representing within-pitcher effects). 31 Generalized additive mixed models were used to examine how these within-pitcher and between-pitcher variances are associated with pitching results, defined as a missed swing (1) or contact (0), for each season, while adjusting relevant covariates (see Appendix for details). The results showed that within-pitcher variance in vertical break was positively associated with missed swings across all seasons in both matchups (p < .001), indicating that, for a given pitcher, fastballs with greater vertical break were more likely to result in missed swings (Figure 3(b)). Interestingly, however, the between-pitcher variance in vertical break was consistently negatively associated with the pitching result across all seasons in same-side matchups. In opposite-side matchups, between-pitcher variance in vertical break was positively associated with pitching results in 2021 (p < .001), but it has shifted to a negative association since 2023 (p = .035; Figure 3(a)). This finding indicates that pitchers with a greater vertical break were less likely to induce missed swings in recent seasons for both matchups. This additional analysis supported the interpretation that the pitchers whose fastballs have greater vertical break do not necessarily achieve a higher Whiff% in recent MLB seasons. Instead, for a given pitcher, fastballs with greater vertical break were more likely to result in missed swings. These findings indicate that the relationship between fastball vertical break and Whiff% differs by the level of analysis (i.e., between-pitcher vs. within-pitcher variances) and changes over time, suggesting that the hierarchical structure of the data and longitudinal change should be considered when analyzing the relationship between pitched ball kinematics and pitching results.
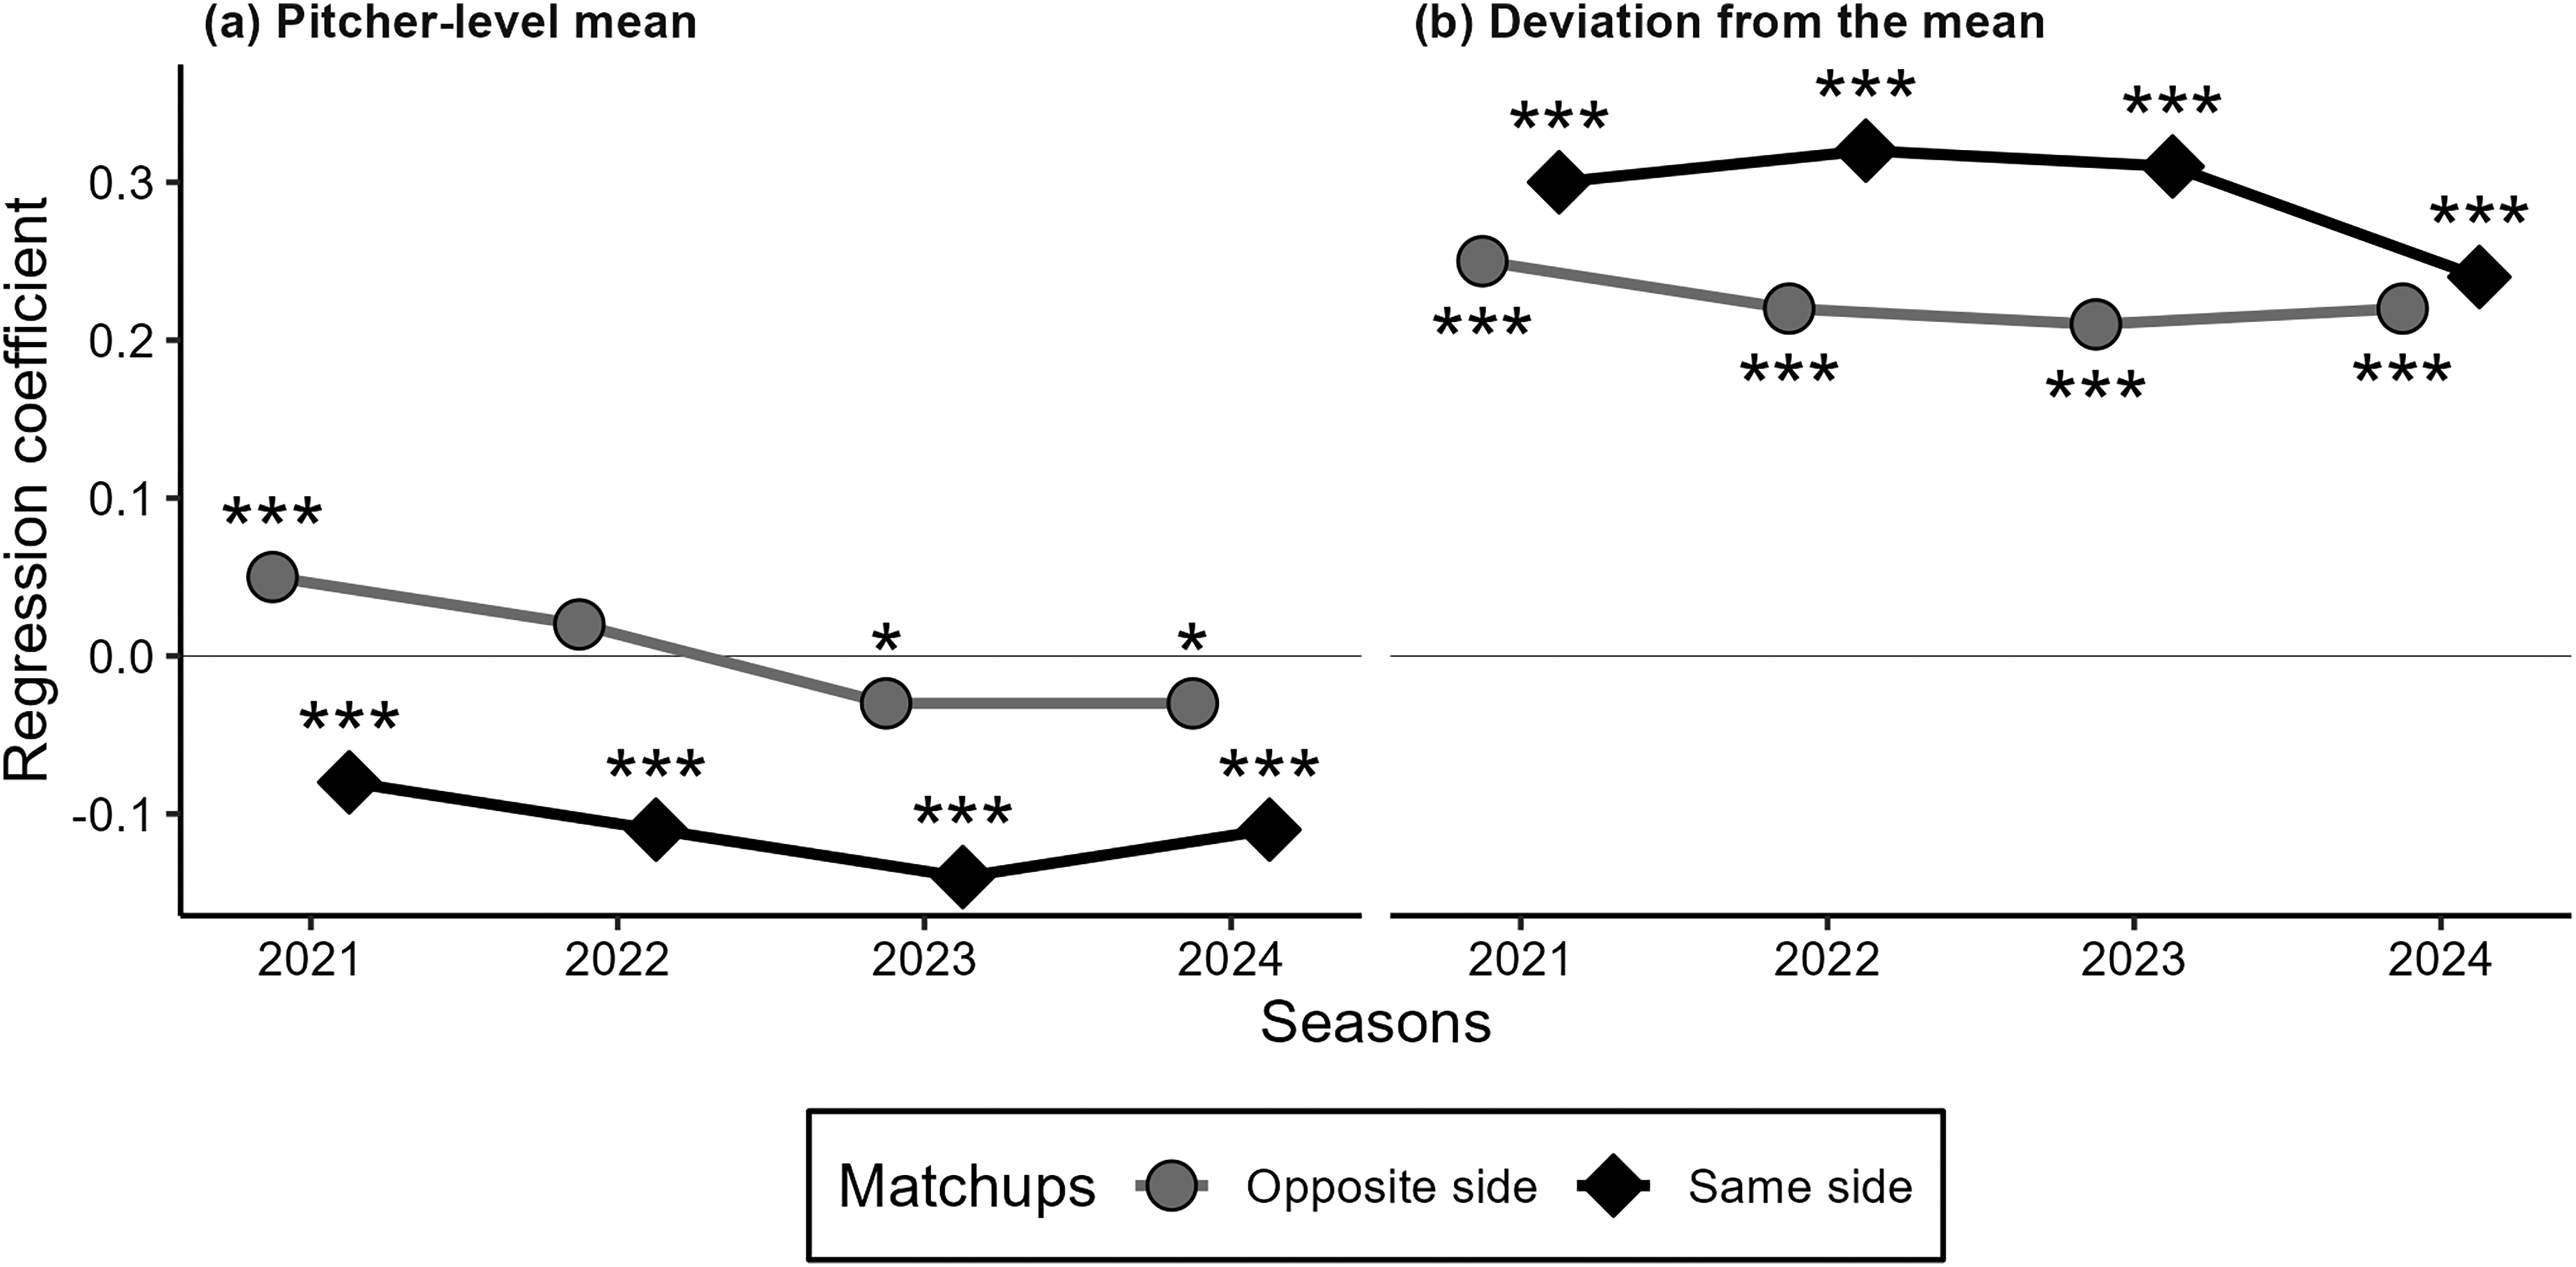
Regression coefficients for (a) pitcher-level mean (representing between-pitcher variance) and (b) deviation from the mean (representing within-pitcher variance) for vertical break across the 2021–2024 seasons. Significance in regression coefficients: ***p < .001, **p < .010, *p < .050.
The present study found that the influence of spin axis direction on Whiff% varied by a pitcher's throwing arm angle, pitcher playing styles (i.e., K%-BB% group), and handedness matchups. Interpretation was complicated by opposing coefficient signs between spin axis direction and its deviation score, varying effect sizes, and differences in data ranges. To better understand the combined influence of spin axis direction and throwing arm angle, we conducted simulations of Whiff% across systematically varied arm angles (25°–55°) and spin axis deviations (±7° from the regression-predicted mean) based on the 10th–90th percentiles of their observed ranges, while holding other covariates constant at their mean values. The simulation indicated pitchers who throw fastballs with smaller arm angles (25°), which tend to make the fastball spin axis more inclined toward vertical, lower the release position, increase lateral break, and reduce rise, are likely to consistently achieve higher Whiff% (range: 15.7%–25.2%) than those with larger arm angles (55°; range: 11.8%–21.3%) across handedness matchups (Figure 4). However, pitchers in the high-K% groups whose fastballs have a spin axis atypically inclined toward horizontal for a given arm angle (deviation score = −7°) would lead to a Whiff% of ≥20.7% in same-side matchups, above the overall mean (20.5%) across the range of throwing arm angle (Figure 4(a)(i) & (ii)). Based on these results, smaller arm angles would be consistently advantageous for inducing missed swings across pitcher playing styles and handedness matchups, whereas strikeout-focused pitchers would gain a greater advantage by throwing fastballs with an axis atypically inclined toward horizontal for a given arm angle, particularly against same-handed batters.
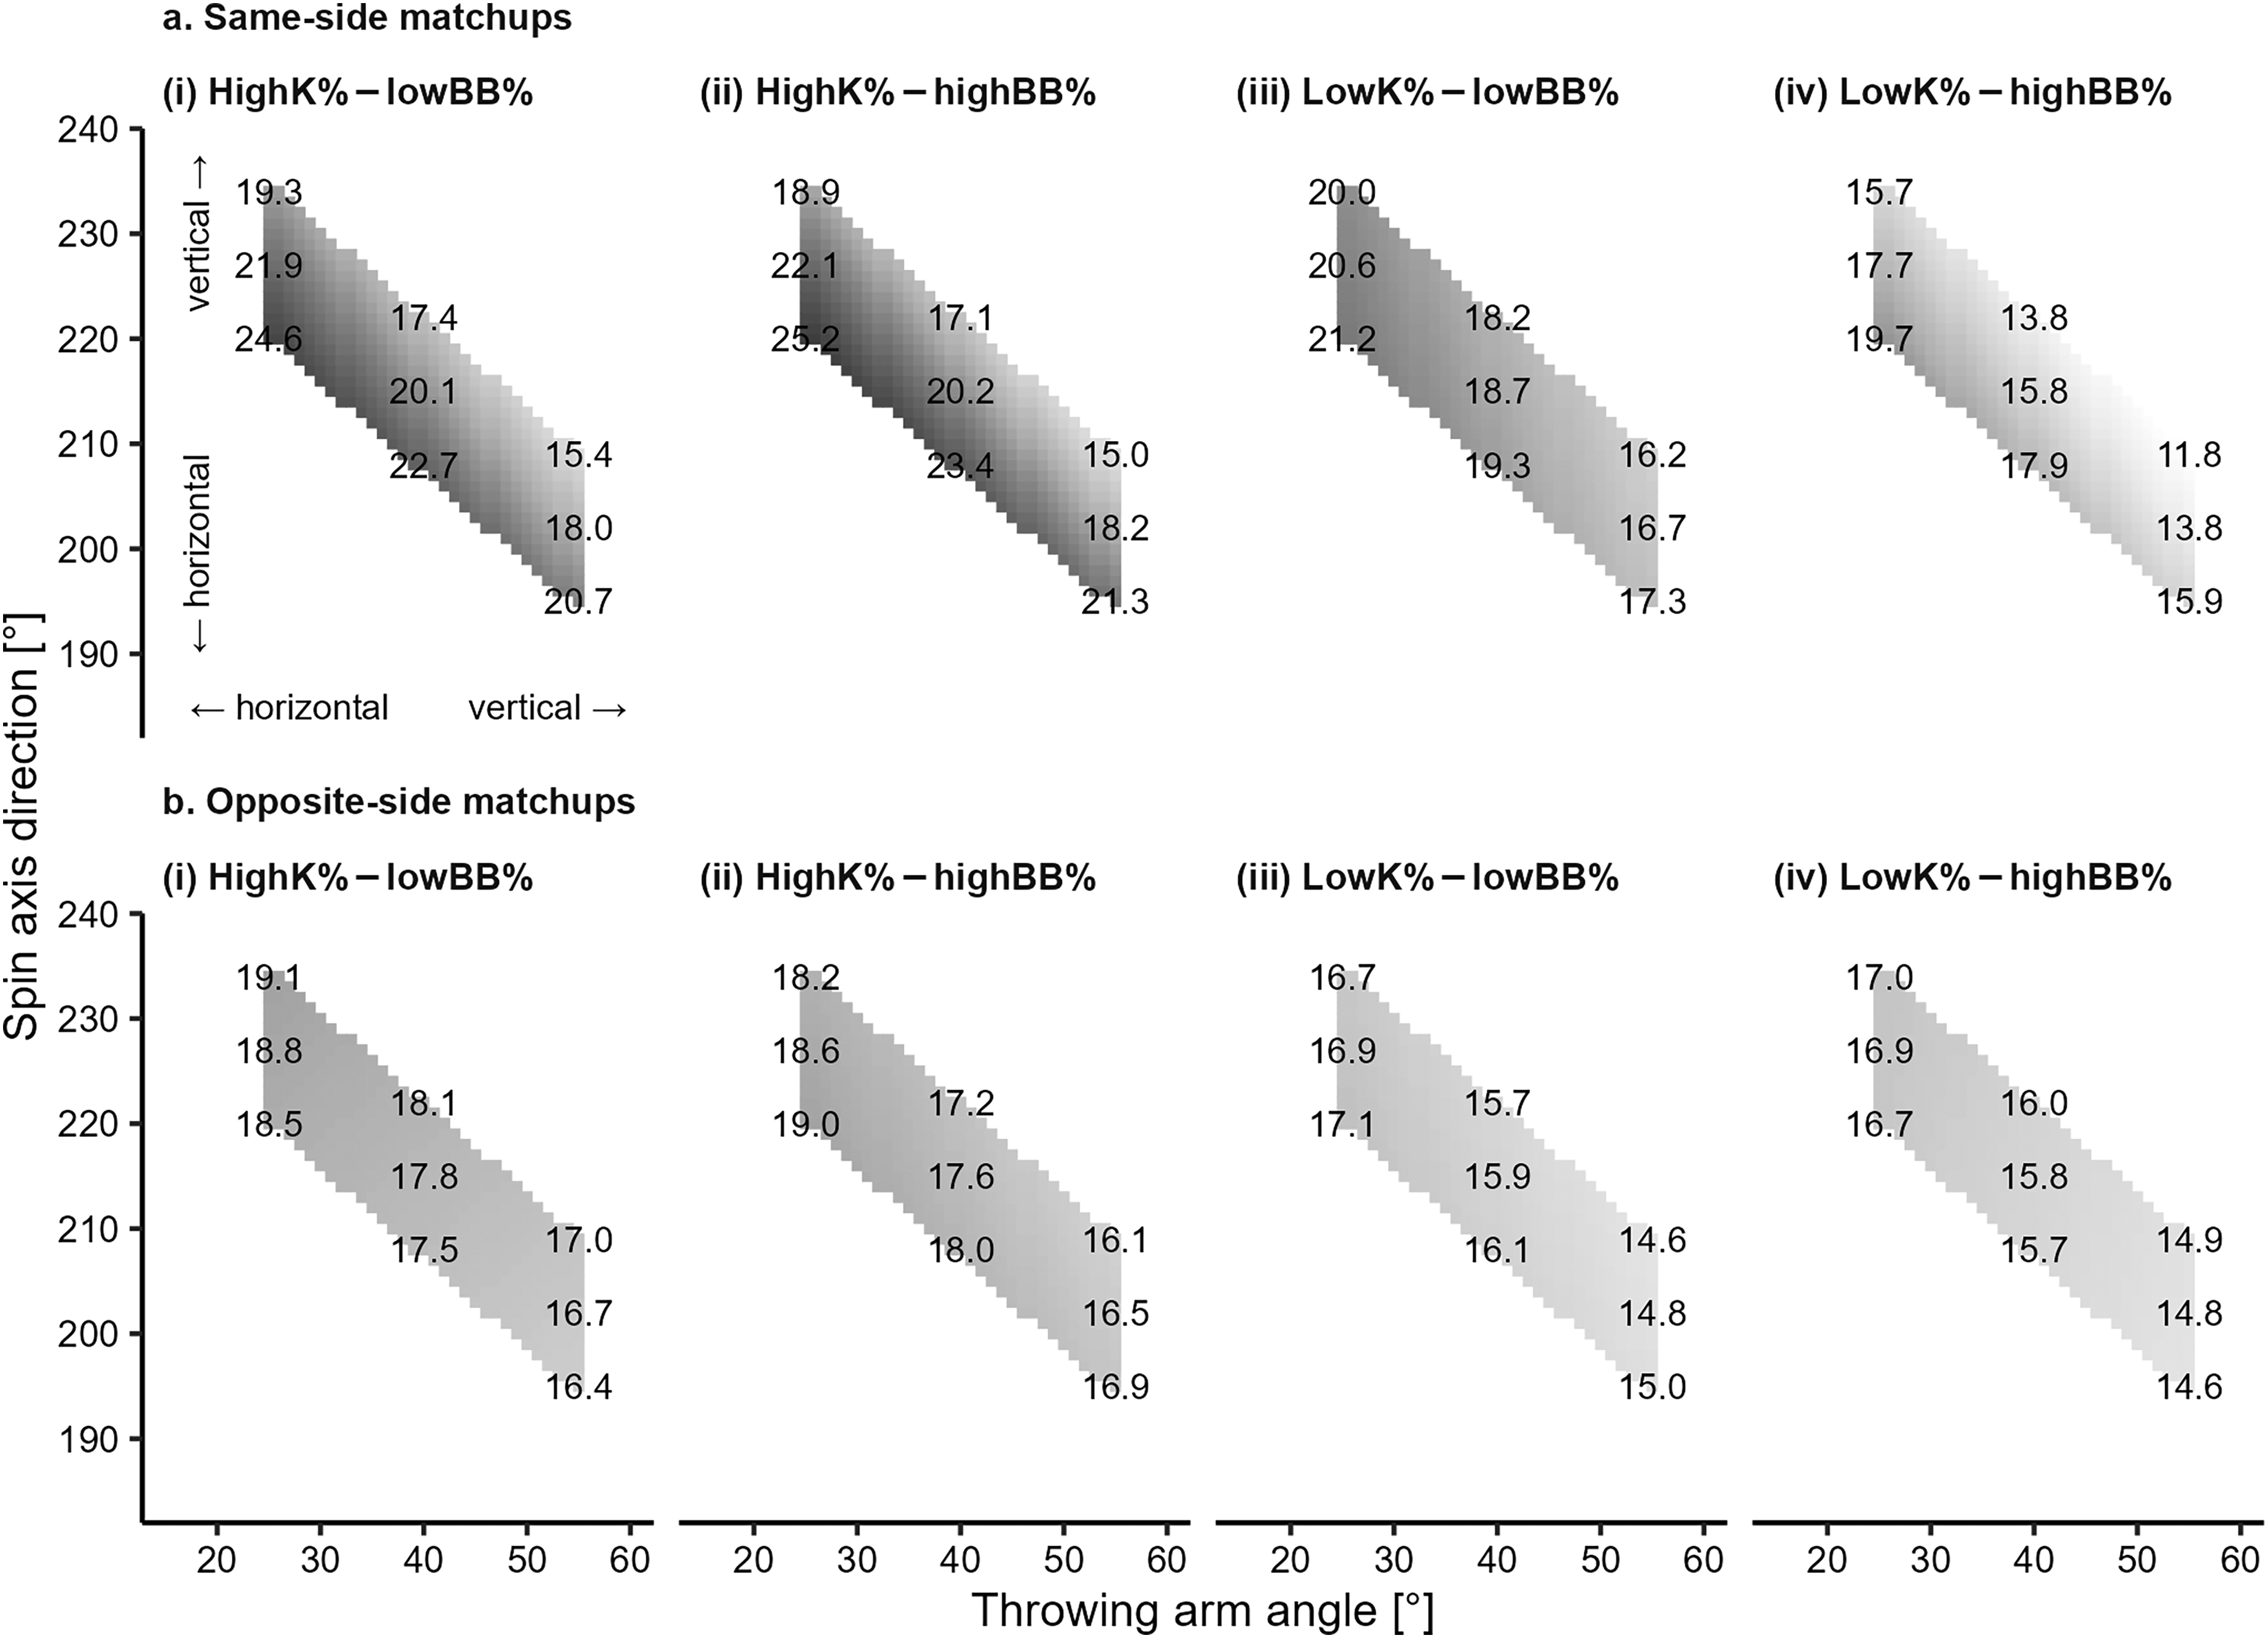
Predicted Whiff% for different combinations of throwing arm angle and spin axis direction for (i) the highK%-lowBB%, (ii) highK%-highBB%, (iii) lowK%-lowBB%, and (iv) lowK%-highBB% groups in (a) same-side and (b) opposite-side matchups. Spin axis direction was predicted using a linear regression model based on throwing arm angle and varied with ±7° at 1° increments from the mean for each angle, with all other covariates held at their mean values. The plotted values represent predicted Whiff% for the deviation scores of −7°, 0° (mean), and +7° across throwing arm angles ranging from 25° to 55°.
Our results demonstrated that the magnitude of the influence of throwing fastballs with a spin axis atypically inclined toward horizontal differed across pitcher playing styles, particularly against same-handed batters, suggesting that the factors contributing to higher Whiff% vary by pitcher playing styles. This interpretation aligns with the case observation of Nagami et al., 4 who described the fastball kinematics of two pitchers with different playing styles: a strikeout-focused collegiate pitcher threw fastballs with greater rise, while a control-focused professional pitcher threw fastballs with a spin axis direction that was different from the others. One possible explanation for the observed variation in the influence of fastballs with a spin axis atypically inclined toward horizontal on Whiff% among different playing styles might be that the influence is enhanced by an interaction with fastball speed. The present study showed that pitchers in high-K% groups threw significantly faster fastballs than those in the low K% groups (p < .001; Table 1). With more restricted time to react, fastballs with a spin axis more inclined toward horizontal, generating atypically greater rise for a given throwing arm angle, could make it more difficult for batters to predict the pitch's location at home plate and hit the ball. In contrast, pitchers in the lowK%-lowBB% group may focus on other aspects, such as pitch's location at home plate and a variety of pitch types. For instance, Dvorocsik et al. 32 reported that the outcomes of fastballs vary across the pitch types that they are paired with. Our findings suggest that the factors contributing to higher Whiff% are not uniform across pitcher playing styles and handedness matchups, so that style-specific kinematic targets should be considered to achieve better outcomes.
The present study showed that the influence of typicality of fastball kinematics on Whiff% varied by matchups. One possible explanation for this might be the difference in the angular displacement of a batter's sightline with respect to the pitched ball during tracking between handedness matchups (Figure 5). Even for fastballs with identical kinematics and trajectory, for instance, lateral movement of a fastball within the batter's field of view tends to be initially faster in same-side matchups (5–9°/s) than in opposite-side matchups (–5°/s to 0°/s; Figure 5(b)). However, at a later stage in the trajectory (5 m in front of home plate), the same fastball is projected onto the batter's field of view with a similar or greater lateral velocity in opposite-side matchups (–79°/s to −23°/s) than in same-side matchups (19–74°/s). Given these inherent differences in available visual information about fastball trajectory in each matchup type, their influence on batter performance may have varied by handedness matchups. Further research is needed to understand how the inherent differences in visual information influence batter's perception and performance.
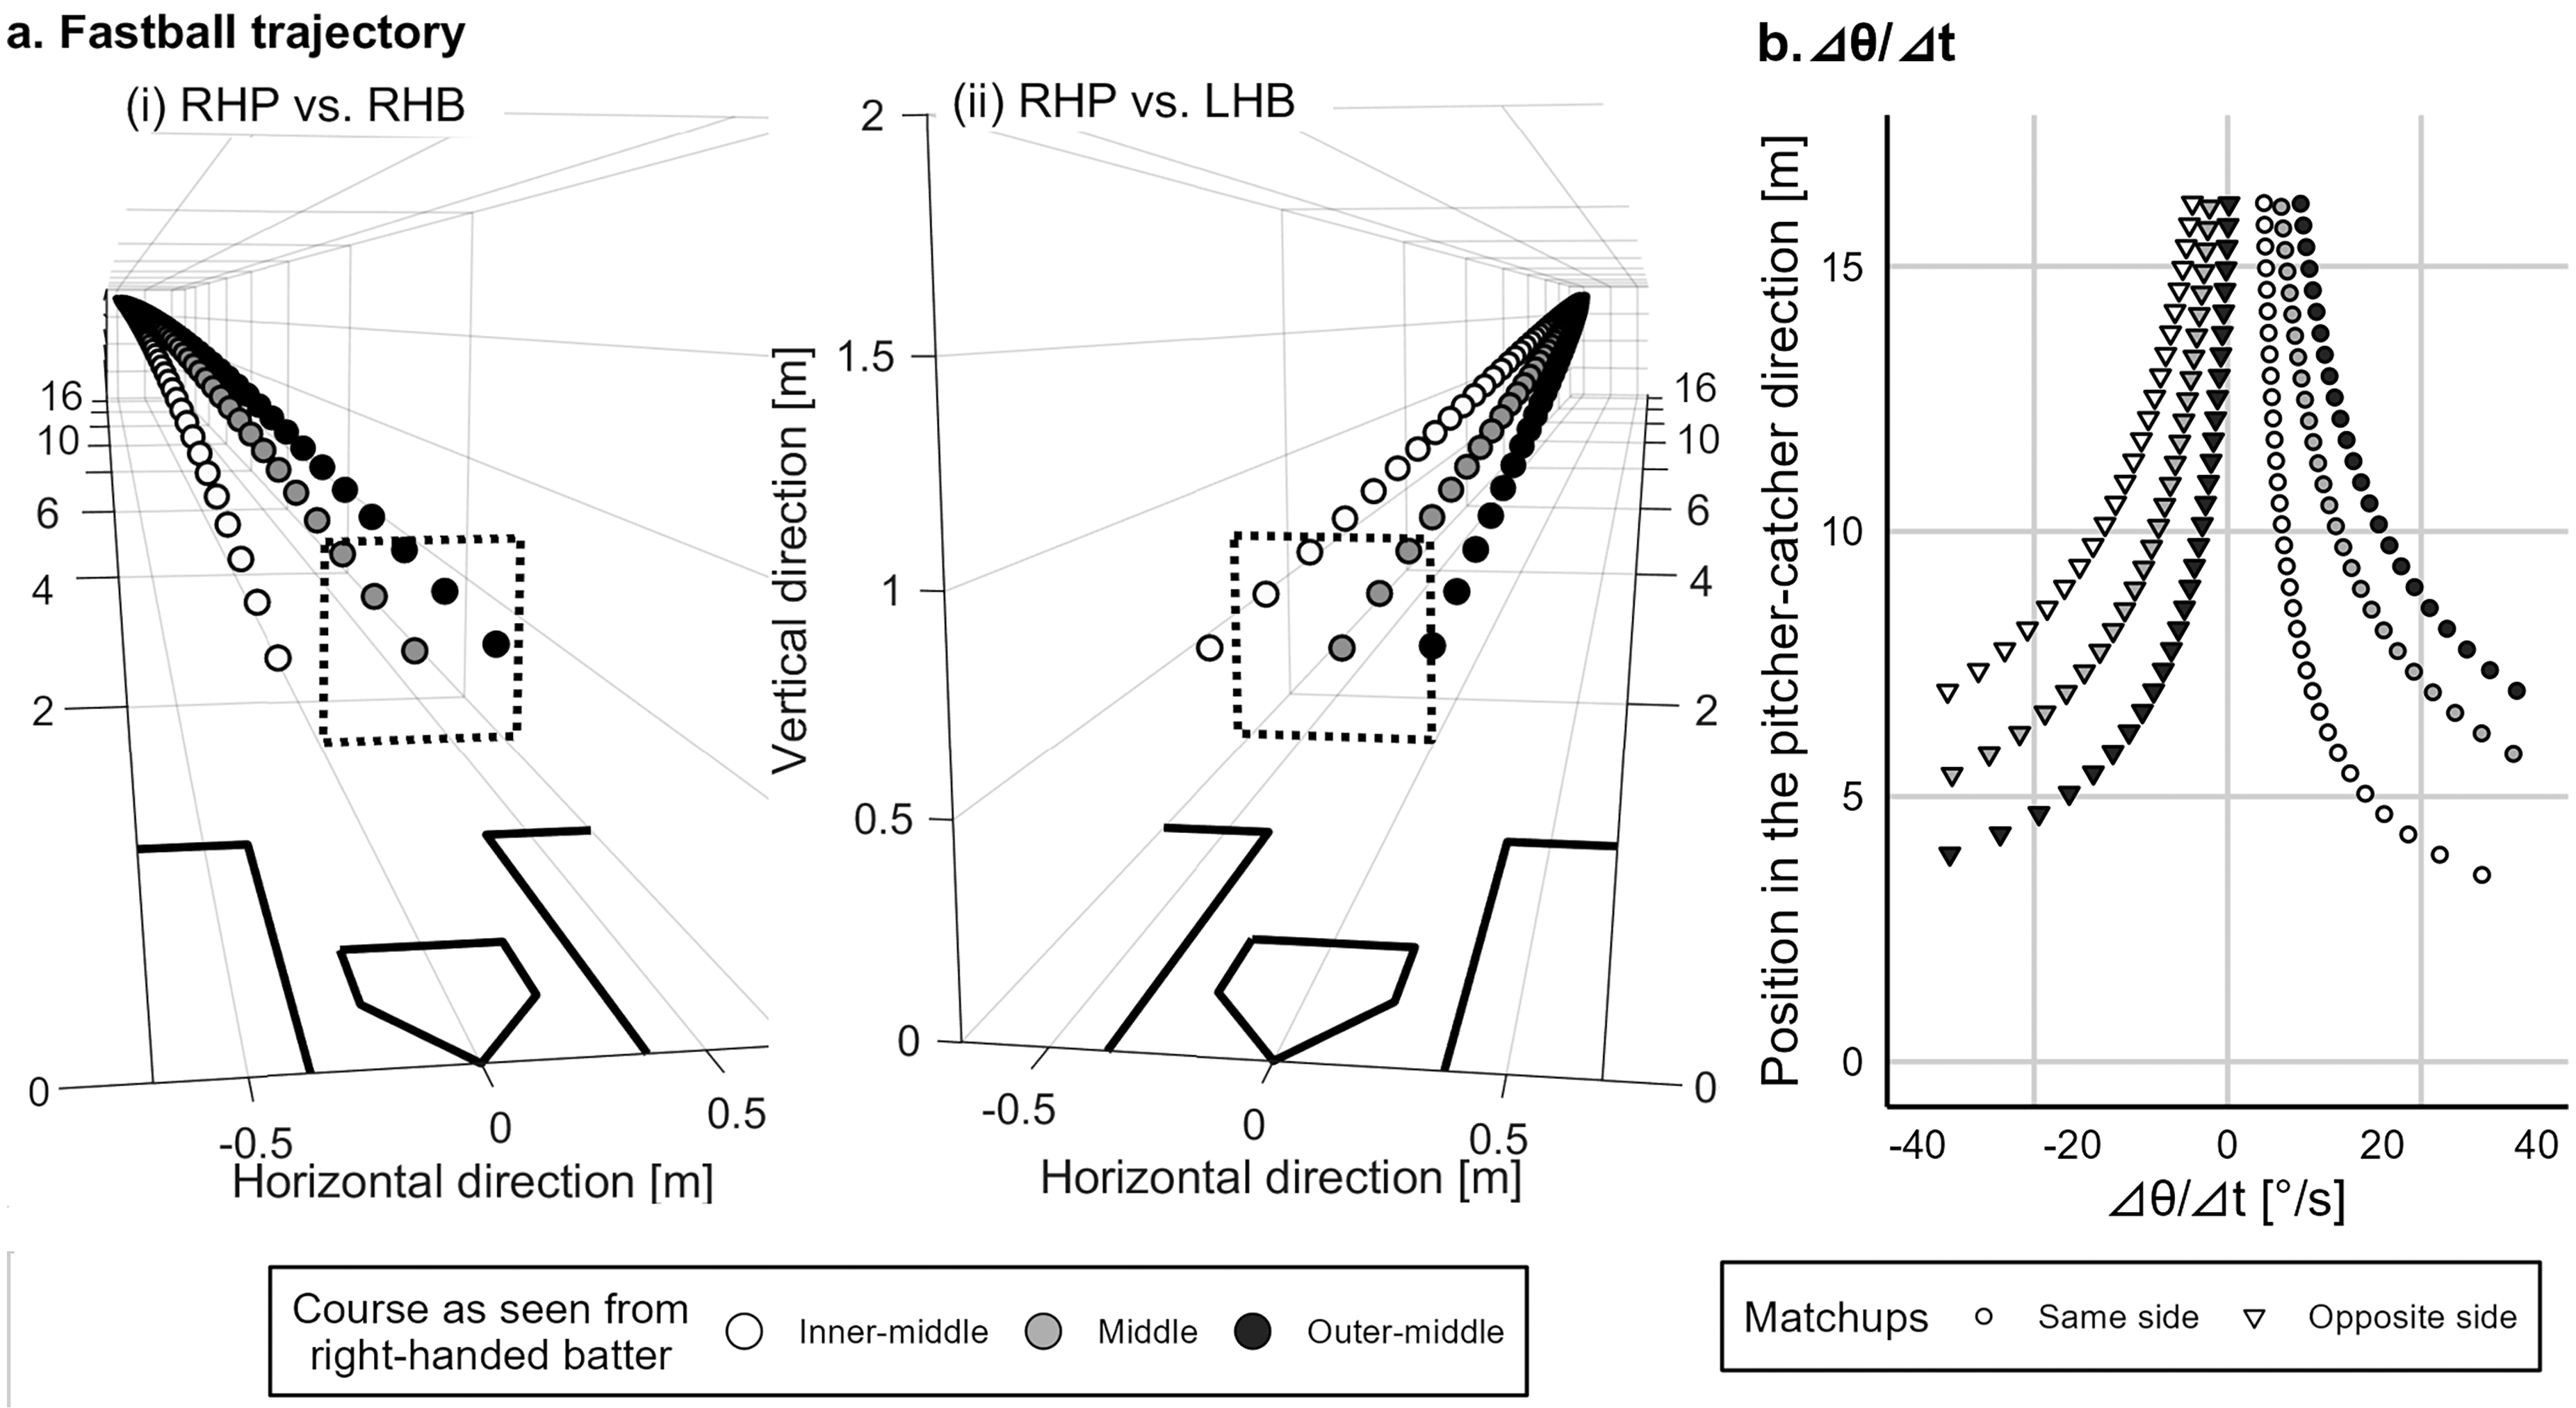
Reconstructed fastball trajectories (a) thrown by a randomly selected right-handed pitcher (RHP), as seen from (i) a right-handed batter (RHB) and (ii) a left-handed batter (LHB) and (b) the time derivative of lateral angular displacement of the batter's sightline (⊿θ/⊿t) for each pitching course in each matchup type. Fastballs arriving at the inner, middle, and outer courses at the same height as seen from RHB (corresponding to outer, middle, and inner courses for the LHB) were selected for this visualization. A uniform acceleration model was used to reconstruct each fastball trajectory. Lateral angular displacement (⊿θ) was defined as the shifts in the batter's sightline with respect to the pitched ball, and its time derivative (⊿θ/⊿t) was calculated. In panel (a), a square outlined by a dotted line represents the strike zone.
In this study, we selected the pitchers who threw at least 150 fastballs that were swung at during the 2023–2024 seasons to compute a reasonably reliable Whiff% of fastballs. The sample included 297 pitchers who threw 1,815 pitches on average per season (range: 668–3,281) and threw fastballs at a mean frequency of 41%. The inclusion criteria might have selected pitchers who played consistently throughout the seasons and often used fastballs, which may limit the generalizability of our findings. To evaluate this potential selection bias and characterize the pitchers in our analysis, we identified a reference group of 263 pitchers who threw at least 668 pitches in a season (the minimum in the selected pitchers) but were not included in the primary analysis. K% and earned run average (ERA; the average number of earned runs that a pitcher allows per nine innings pitched) were compared between the groups using Welch's t-test. The result showed that the pitchers in our analysis had significantly higher K% (24.1% vs. 22.5%; p < .001; Hedges’ g = 0.30) compared with the reference group, while no significant difference was observed in ERA (3.97 vs. 4.16; p = .067; g = 0.16). These results suggest that the findings in the present study are applicable to pitchers who often use fastballs and achieve higher K% but might not generalize to pitchers with different profiles in MLB.
This study has several limitations that might have affected the results and interpretations. First, although all regression models were statistically significant, approximately half or more of the variance in Whiff% was not explained by variables included in the study. Therefore, fastball kinematics and their typicality for a given throwing angle should not be considered as predominant determinants of Whiff% in MLB games. Nevertheless, this study focuses on a topic that has received attention among baseball professionals and media. A recent article on the MLB website featured the relationship between throwing arm angle, ball kinematics, and vertical and horizontal break, 33 but it has mainly been discussed based on limited examples. By analyzing data from a large number of pitchers, this study provides quantitative evidence and new insights on how ball kinematics and its typicality for a given throwing arm angle influence Whiff% and whether these effects generalize across MLB pitchers. Second, there are few submarine pitchers in MLB, which limits the generalizability of the findings to this subgroup. Third, various relevant factors, such as variability of pitching motion,34,35 fastball kinematics, and trajectory as well as an opposing batter's prior knowledge (e.g., pitcher's pitch type repertoire and ball kinematics), anticipatory skills, 8 and aims (e.g., hitting fly balls or ground balls) likely differ across leagues, limiting the generalizability of the results beyond MLB. Fourth, pitch-by-pitch data on a throwing arm angle were not available. Future studies should consider within-pitcher variability in throwing arm angle and its relationship with fastball kinematics to understand how a pitcher creates atypicality of fastball kinematics and trajectory for a given throwing arm angle. Finally, the current study evaluated the spin axis direction in only the vertical plane (i.e., the elevation angle of the angular velocity from the horizontal plane). However, variation in vertical and horizontal break may also be influenced by the azimuth angle. Including the azimuth angle may clarify the relationship between fastball kinematic typicality and resulting trajectory and will help identify more precise spin-related targets for pitchers.
Conclusions
This study demonstrated that throwing arm angle is one of the determinants of fastball kinematics for MLB pitchers and may provide important advanced cues for batters’ spatial and temporal predictions. Contrary to our hypothesis, however, there was no significant non-linear relationship between the typicality of spin axis direction for a given arm angle and Whiff% across any pitcher-batter handedness matchup, after controlling for given covariates. This suggests that fastballs having typical kinematics for a given arm angle are not easier for batters to hit than those with atypical kinematics in MLB games. In same-side matchups, pitchers in the highK%-lowBB%, highK%-highBB%, and lowK%-highBB% groups whose fastballs had an axis more inclined toward horizontal for a given throwing arm angle achieved higher Whiff%, whereas pitchers in the lowK%-lowBB% group did not. In addition, neither this interaction effect nor the main effect of spin axis deviation was found in opposite-side matchups, suggesting that the factors contributing to a higher Whiff% differ by pitcher playing styles and handedness matchups. Notably, pitchers whose fastballs had an axis more inclined toward vertical achieved higher Whiff% in both matchups, contradicting the prevailing assumption that fastballs with greater rise would lead to higher Whiff%. These findings suggest that, in recent MLB games, fastballs thrown by strikeout-focused pitchers with an axis atypically inclined toward horizontal, potentially generating greater rise, are likely to induce more missed swings than fastballs that merely have greater rise.
Footnotes
Acknowledgements
This study was supported by a Grant-in-Aid for Early-Career Scientists (KAKENHI; Grant No. 24K20576) from the Japan Society for the Promotion of Science.
Consent to participate
Not applicable.
Consent for publication
Not applicable.
Data availability
Not applicable.
Declaration of conflicting interests
The authors declared no potential conflicts of interest with respect to the research, authorship, and/or publication of this article.
Ethical considerations
Not applicable because the data used for this study are publicly available on MLB website for non-commercial use.
Funding
The authors disclosed receipt of the following financial support for the research, authorship, and/or publication of this article: This work was supported by the Japan Society for the Promotion of Science, (grant number 24K20576).
Appendix
To examine the associations between within- and between-pitcher variances in vertical break and pitching results (missed swing vs. contact), we analyzed pitch-by-pitch fastball data from the 2021–2024 seasons. Of all fastballs, those having spin axis direction ranging from 180° to 270°, and pitchers who threw >100 fastballs swung at were selected for this analysis. The number of fastballs ranged from 28,100 to 34,399 for same-side matchups and 46,922–48,789 for opposite-side matchups across seasons. After all continuous variables were standardized within each season, the observed values of vertical break, horizontal break, ball speed, and spin rate were decomposed into a pitcher-level mean (representing between-pitcher effects) and deviations from that mean for each pitch (representing within-pitcher effects). 31 Generalized additive mixed models were fitted to assess how these within- and between-pitcher variances related to pitching results, defined as whether the swing was a miss (1) or contacted (0), while adjusting for relevant covariates. Covariates included ball kinematics (ball position at home plate), pitcher information (role and handedness), and game-context variables (ball-strike count and outs), entered as fixed effects. Pitcher ID was included as a random effect. Nonlinear effects of ball position in horizontal and vertical directions at home plate on pitching results were modeled using penalized thin-plate regression splines. 36 The model's goodness-of-fit was assessed using marginal and conditional R2 values. 37 The results showed that marginal R2, representing variance explained by fixed effects, ranged from 7%–8% in same-side matchups and 7%–9% in opposite-side matchups across the seasons. The conditional R2, representing variance explained by fixed and random effects, ranged from 9%–11% in both matchups. Regression coefficients of linear terms entered as fixed effects in the 2024 season are presented in Table A.