
Abstract
The purpose of this study was to quantify load across an entire season for professional youth football players and assess the effects of stage of season, playing position and training day relative to match day (MD). Data from ratings of perceived exertion and seven global positioning system (GPS) derived measures of external training load were collected from 20 players across a 47-week season. Mixed linear models were used to assess the effects of stage of season, training proximity to match day (e.g. MD-1, MD-2) and position across each dependent variable. Training proximity to match day was found to have the most substantive effect with effect sizes ranging from small (
Introduction
Exposing athletes to an appropriate training stimulus can create diverse physiological adaptations of the cardiovascular, muscular and aerobic systems, specific to the nature of their competition. 1 Practitioners plan and monitor the load of athletes to achieve adaptation, maximise fitness, and to mitigate effects of fatigue and injury risk.1,2 Insufficient stimulus may lead to an athlete being underprepared, whilst an excessive stimulus may increase risk of injury or illness.1,3 Practitioners generally monitor prescribed physical work, represented by external load, alongside physiological and biomechanical response that is characterised as the internal load.1,4 Information about both external and internal loads can provide practitioners with information to better tailor the stimulus and enhance adaptive response. 5
Due to advances in technology a range of load monitoring approaches are currently used.6,7 A survey of 41 professional clubs reported that all organisations collected heart-rate and global positioning system (GPS) data from every field-training session and a large proportion collected rating of perceived exertion (RPE) or other subjective ratings of load. 6 Highlighting variables measured during both training and match play, it was shown that the most popular variables for measuring external load were total distance covered, acceleration and metabolic power measures and distance covered at various speed thresholds. 6 The growth in capacity to collect data has also led to an increased body of research investigating load technology. 8 This has led to increased interest in longitudinal load monitoring data, and insights have been provided into training regimes in the English Premier League 9,10 and the Dutch Eredivisie League. 11 It has also allowed comparisons between teams from different national leagues to provide understanding of differences in training methodology employed. 12 Previous research has assessed the effect of stage of the season, training day relative to match day and player position on the average loads measured.9,10,13
It has been highlighted in Premier League players that the only consistent variation in training load occurred on MD-1. 9 A similar pattern was reported by Clemente et al. 12 who investigated training load across a 7-week in-season block with football players from professional Portuguese and Dutch teams. The authors reported that total distance and meterage covered per minute on MD-1 was significantly less than covered on MD + 2, MD-5. MD-3 and MD-2. 12 More recent research in the English Premier League showed a similar tapering strategy used, but characterised by a reduction in load two days before matchday (e.g. MD-1, MD-2). 10 Therefore, whilst a tapering strategy within the weekly microcycle may be common, it is likely that the exact structure of this is coach dependent. Limited variations in load between mesocycles also appears to be common in senior professional football.9,10,13 The overall lack of variation in loading days, alongside a lack of variation across the mesocycles of training, arguably points to a monotonous training schedule. However there does appear to be a consistent theme of de-loading in the approach to MD, with the magnitude of this dependent on periodisation models employed by coaches.
Mediating factors which may affect load, such as playing position, have been assessed in professional football.10,13,14 When comparing load profiles of players from different positions, it was found that there were significant differences in daily training loads experienced. 14 Generally this was characterised by wide, or offensive players, completing more high-speed running and sprinting distance than central, or defensive players.10,14 Additionally, when comparing the activity profiles of starting, non-starting and fringe players, whilst little differences was found in the volume of activity completed, there were significant differences in load completed within high-intensity zones. 13 This highlights the importance of match-play activities alongside training interventions which emphasise high intensity activity.
Season-long analyses of training load can be problematic due to their large scale, 9 as such reporting of annual training practices in football, and investigation of the effects of factors such as playing position, training days and stage of season are limited in the literature. Previous research has not included load from match play, which will influence the overall load recorded, particularly during the in-season phase where competition is regular. Additionally, inclusion of load experienced during match play provides an additional reference to investigate distribution across the training week and insights into the effectiveness of overall management. There is a growing body of longitudinal evidence regarding load distribution in professional senior players,9,10,13,14 however less is known about professional youth, or reserve, players. This is surprising given a key aim of many elite football clubs is to enhance the progression of talented players through youth academies into senior squads.15–17 Increased knowledge of the seasonal training load of young professional players will enable comparisons with senior players, which may facilitate improved transition into senior squads. Additionally, the inclusion of match data will enhance the understanding of the overall load experienced, rather than being restricted to training load. This context of data is important as it may allow practitioners and coaches to better plan and prescribe training, whilst accounting for reasonable mediating factors. Therefore, the purpose of this study was to investigate load across an entire season for professional youth football players, assessing the effects of stage of season, playing position and training day relative to MD.
Methods
Experimental approach to the problem
This study employed a prospective longitudinal design across a 47-week season with Scottish professional youth footballers. The data collection period comprised a 6-week pre-season and two competitive phases (Comp1: 20 weeks, Comp2: 19 weeks) split by a 2-week break. Subjective measures of training load were collected via RPE, whereas objective measures of training load were collected via GPS units worn during training and matches. Data collected and the prospective nature of the study conformed to University of Glasgow research policies and were in accordance with the Declaration of Helsinki.
Participants
Twenty male professional youth footballers (age 17.4 ± 1.3 yrs, height 178.0 ± 8.1 cm, mass 71.8 ± 7.2 kg) were recruited during the 2018/19 season. A total of 3324 individual recordings comprising training and matches were recorded across the season. The group included multiple positions (central defender, wide defender, central midfielder, wide-midfielder, attacker) with data collected from goalkeepers removed from the final analyses. In accordance with previous research, 9 data recorded from a small selection of non-representative training sessions were removed to limit the influence of outliers. As such, only data recorded from team training (defined as sessions comprising both starting and non-starting players) were included in the analysis, with post-match training for non-starters (top-ups), rehabilitation training and non-pitch-based sessions such as gym-based recovery or resistance training sessions excluded. For this study, sessions completed during the winter break were removed, as these were minimal and only completed by certain players. This left a total of 3162 individual recordings.
Procedures
Each player’s RPE was collected, in isolation, approximately 30 minutes after each training session using a scale previously used with football players (Borg CR10). 18 All players had previous experience using the scale as part of their training monitoring. Each RPE score was multiplied by session duration to calculate subjective load. 18 During training and match-play, players wore commercially available GPS Units (Optimeye X4, Catapult Sports, Melbourne, Australia, Firmware version 7.27) previously used in research conducted in team sports.19–21 The units included a GPS receiver and a triaxial accelerometer collecting data at 10 Hz and 100 Hz, with velocity and acceleration dwell times set at 0.6 s and 0.4 s, respectively. Each player wore the same device for each session. 22 After recording, data were downloaded and analysed via the software package Openfield (Software version 1.19, Catapult Sports, Melbourne, Australia). To minimise differences in data processing, the same software version was used to export training load data. 8 Raw training files were processed to split training sessions by drill to ensure dependent variables reflected the actual load. Data collected from matches were processed to remove the half-time period. The average satellite count was 10.6 ± 1.7, the average horizontal dilution of precision (HDOP) was 0.79 ± 0.20. The variables selected to quantify external load were total distance (m); PlayerLoad™ (au); low-speed running (< 14.4 km.h−1, m), high-speed running (19.8 - 24.98 km.h−1, m); sprinting (> 24.98 km.h−1, m); accelerations (>2 m.s−2 count); and decelerations (<-2 m.s−2, count). Variables were included for analysis due to their wide-spread usage in both practice and research. 6
To assess whether there were systematic effects of weekly training structure, sessions were categorised relative to their proximity to MD (e.g. “MD-1”, “MD-2”). Sessions that did not meet these criteria were assigned “MDOther” to allow their inclusion in the analyses. Sessions performed on MD + 1 were removed from the analysis as they did not include both starters and non-starters. The standard weekly training schedule employed throughout the season with a single match was to train two days later (“MD + 2”), followed by four consecutive days (“MD-4”, “MD-3”, “MD-2”, “MD-1”). To assess the effect of position, during the pre-season period a technical coach assigned a category to each player (Central Defender (CD), Wide Defender (WD), Central Midfielder (CM), Wide Midfielder (WM), or Attacker (ATT)).
Statistical analysis
Data were analysed in the statistical environment R (v.4.0.3). Where data were missing, these were treated as missing at random (primarily due to technical errors such as battery failure) and imputed using the MICE package.
23
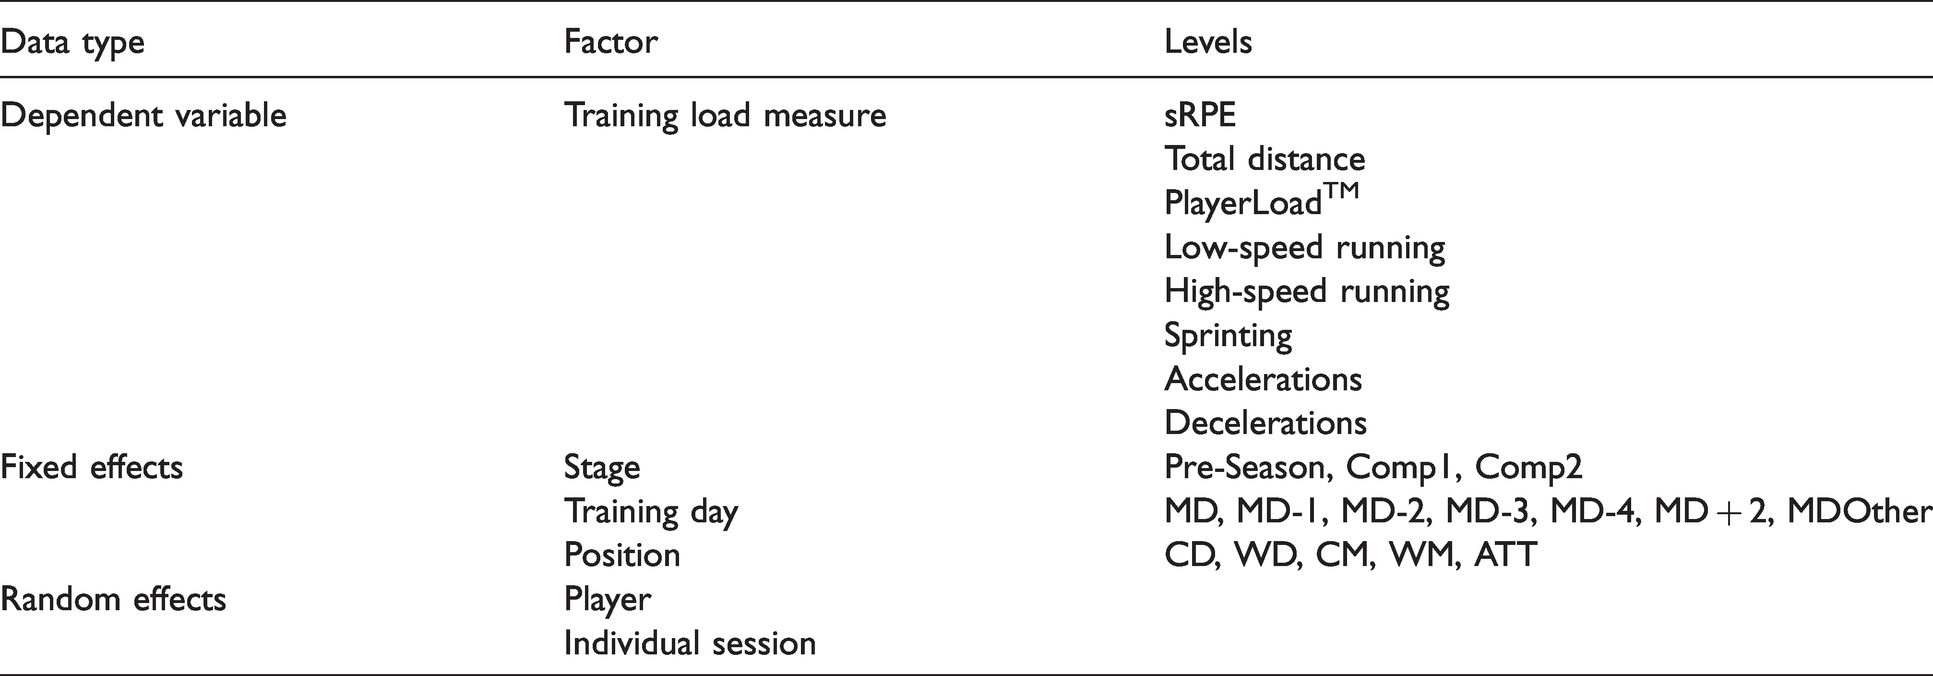
Data were analysed using mixed linear modelling as a flexible approach to account primarily for the unbalanced repeated measures nature of the data. The fixed effects of the model included stage of the season (Comp1, Comp2, Pre-Season), player position (CD, WD, CM, WM, ATT) and training day relative to match day (MD, MD-1, MD-2, MD-3, MD-4, MD + 2 and MDOther). Random effects were associated with individual players and single training sessions (Table 1). Generalized likelihood ratio tests were conducted with models fit using the restricted maximum likelihood approach to test for statistical significance of each fixed effect. Due to the repeated measures design, effect sizes were obtained by calculating generalized eta squared values (
Covariates included in model specification.
Results
Overall, 110 matches and 222 training sessions were included in the analyses. The 3162 individual recordings included in the analysis were comprised of 2467 individual training recordings (Pre-season = 470, Comp1 = 1068 and Comp2 = 929) and 695 match recordings (Pre-season = 84, Comp1 = 297 and Comp2 = 314). Distributions of the 8 dependent variables are presented in Figures 1 to 3 according to the stage of season, training day and playing position.
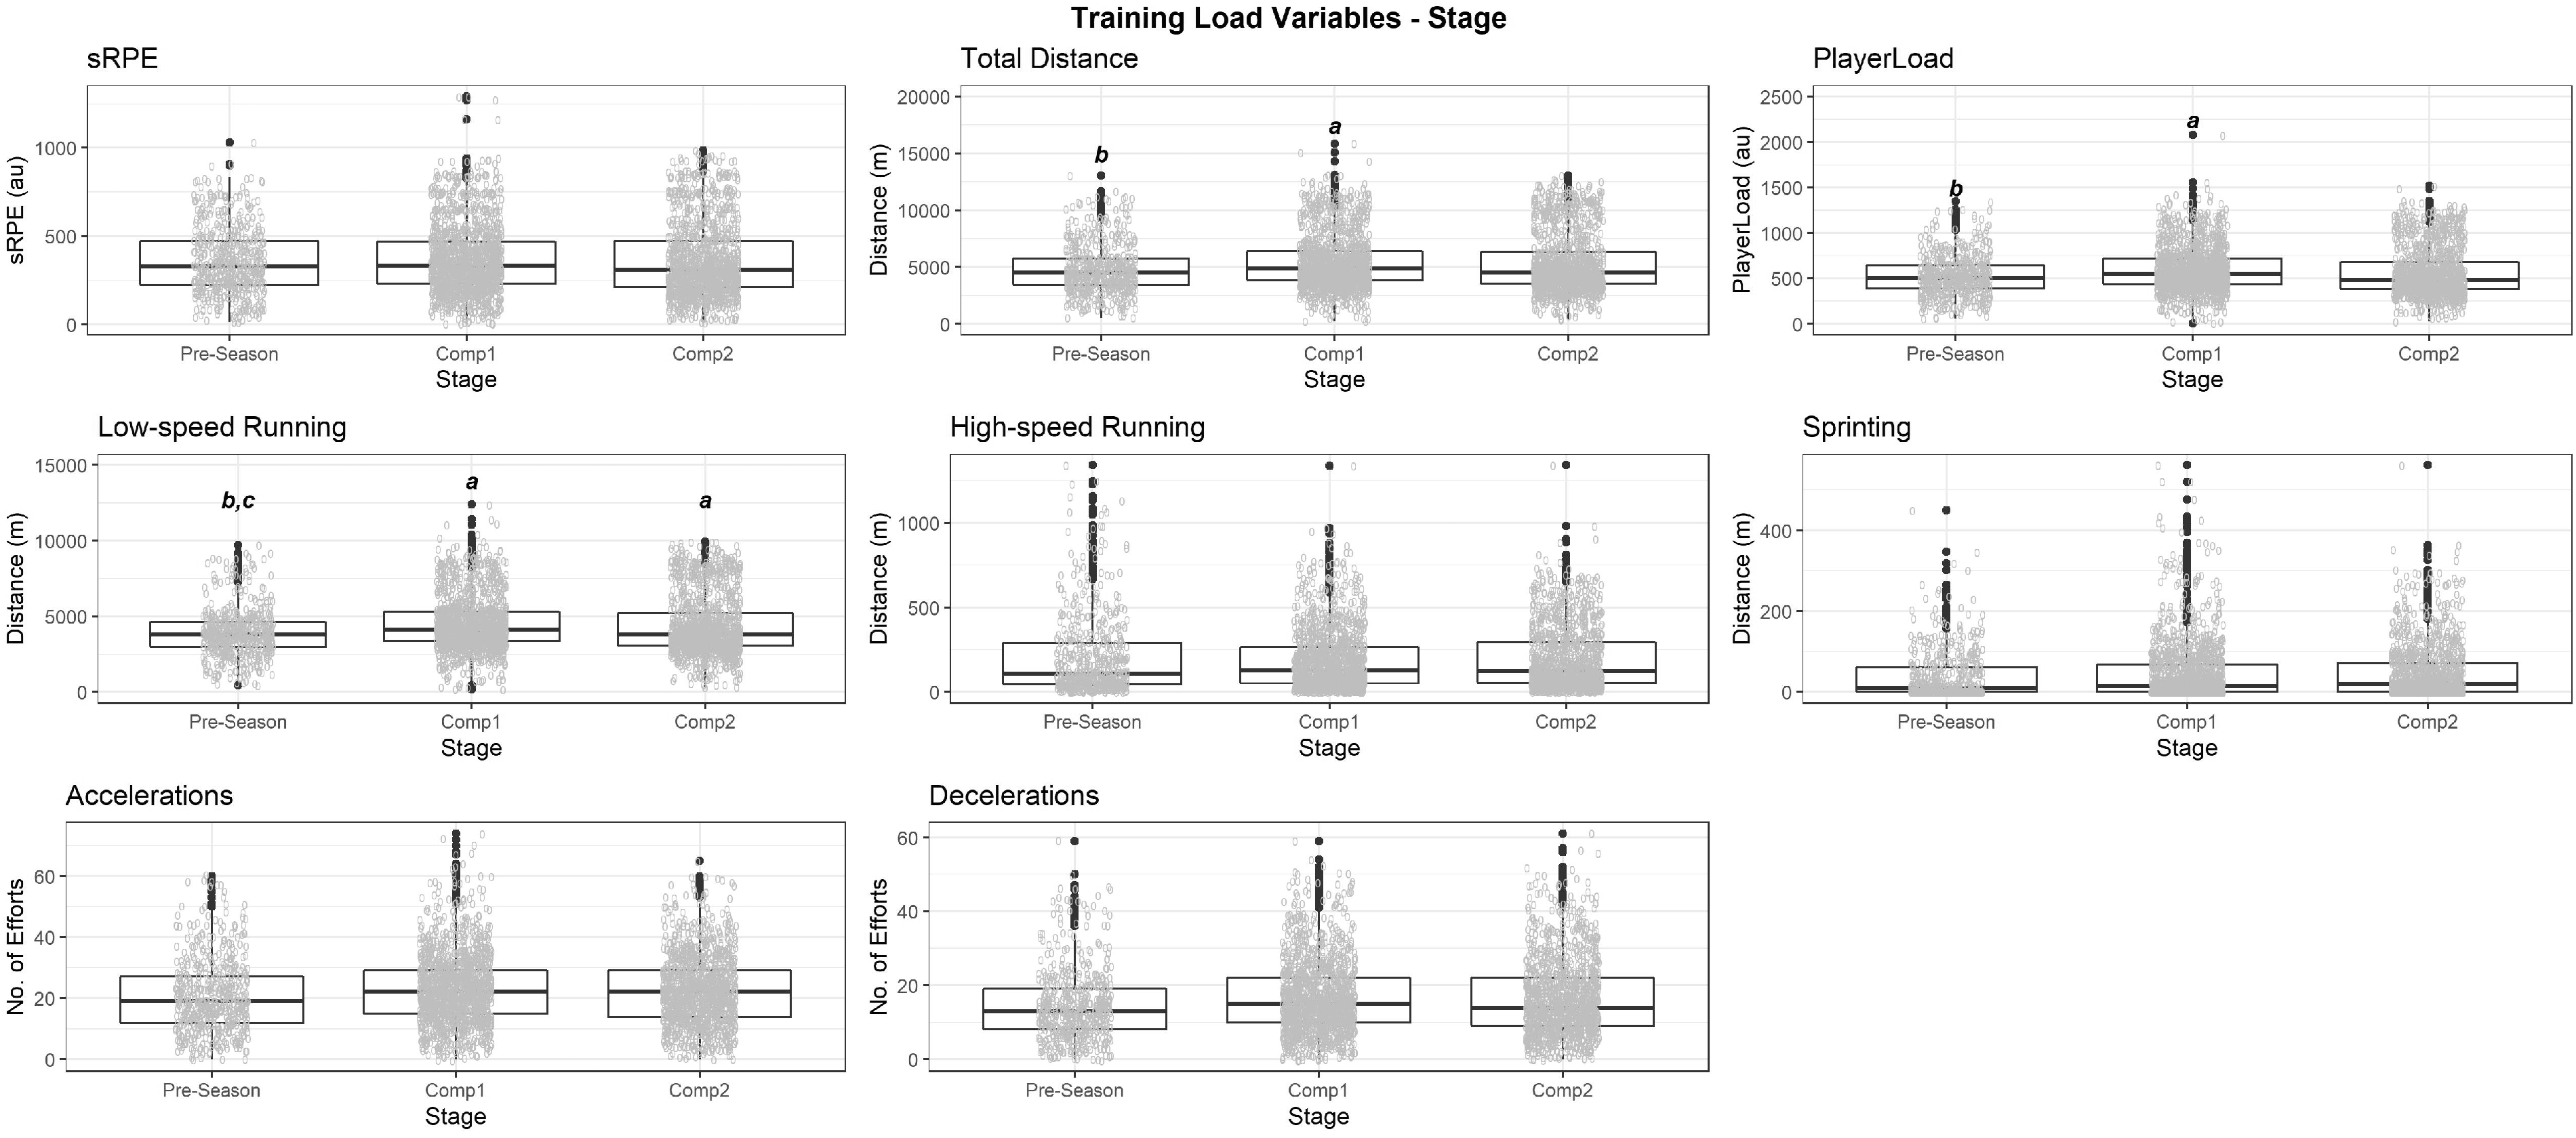
Load values across stage of season; (a) sig different (p < 0.05) to Pre-Season, (b) sig. different (p < 0.05) to Comp1, (c) sig. different (p < 0.05) to Comp2.
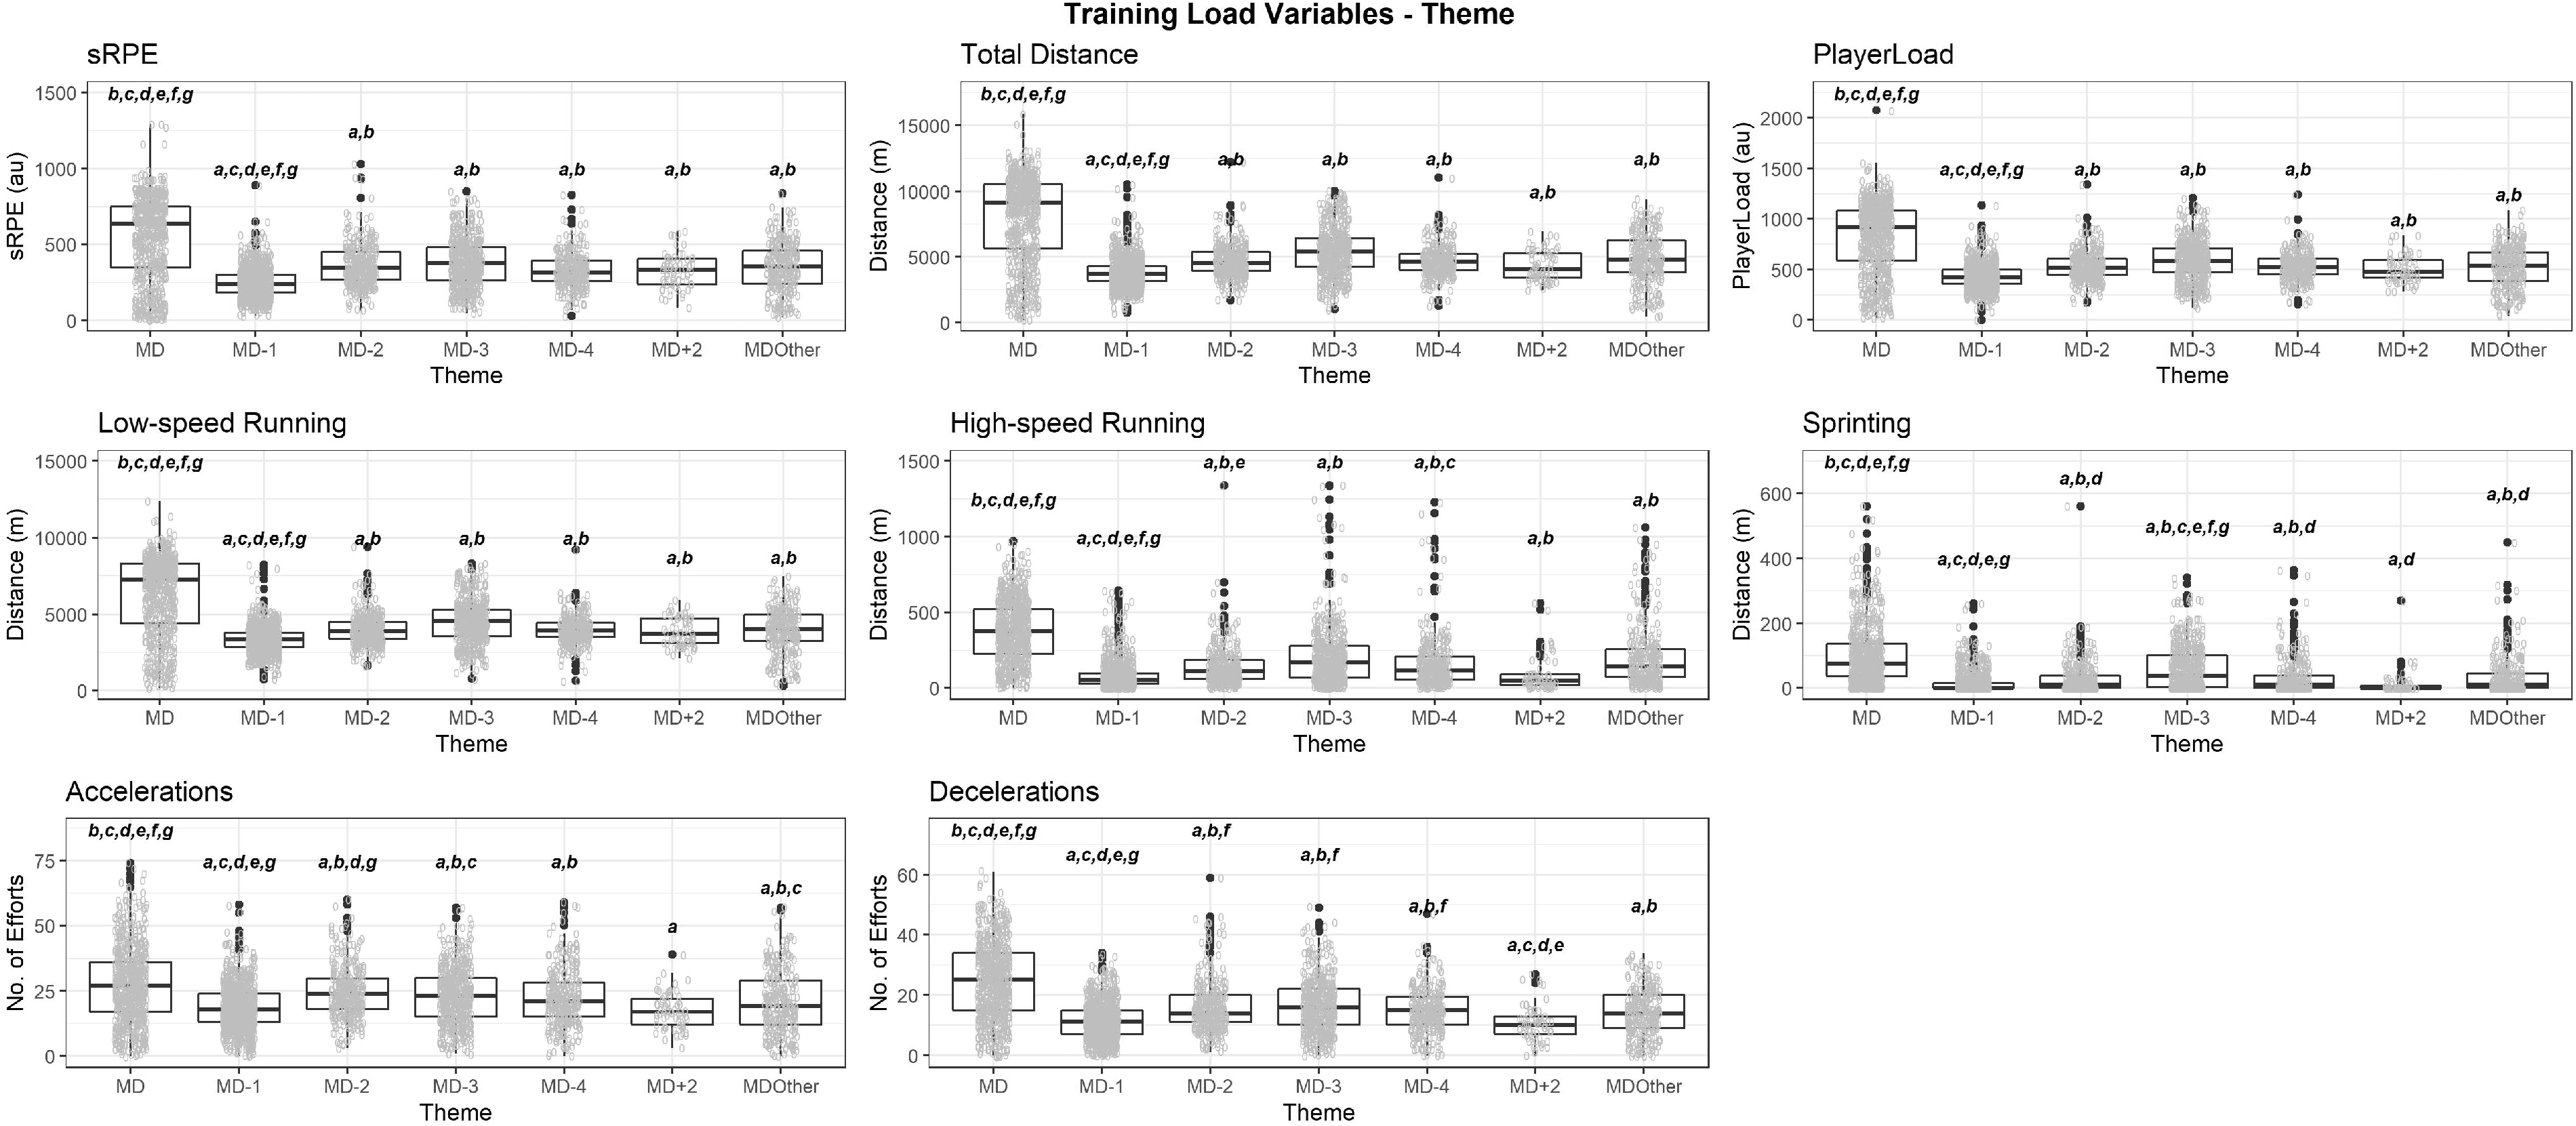
Load values across MD relative training; (a) sig different (p < 0.05) to MD, (b) sig different (p < 0.05) to MD-1, (c) sig. different (p < 0.05) to MD-2, (d) sig different (p < 0.05) to MD-3, (e) sig different (p < 0.05) to MD-4, (f) sig different (p < 0.05) to MD + 2, (g) sig. different (p < 0.05) to MDOther.
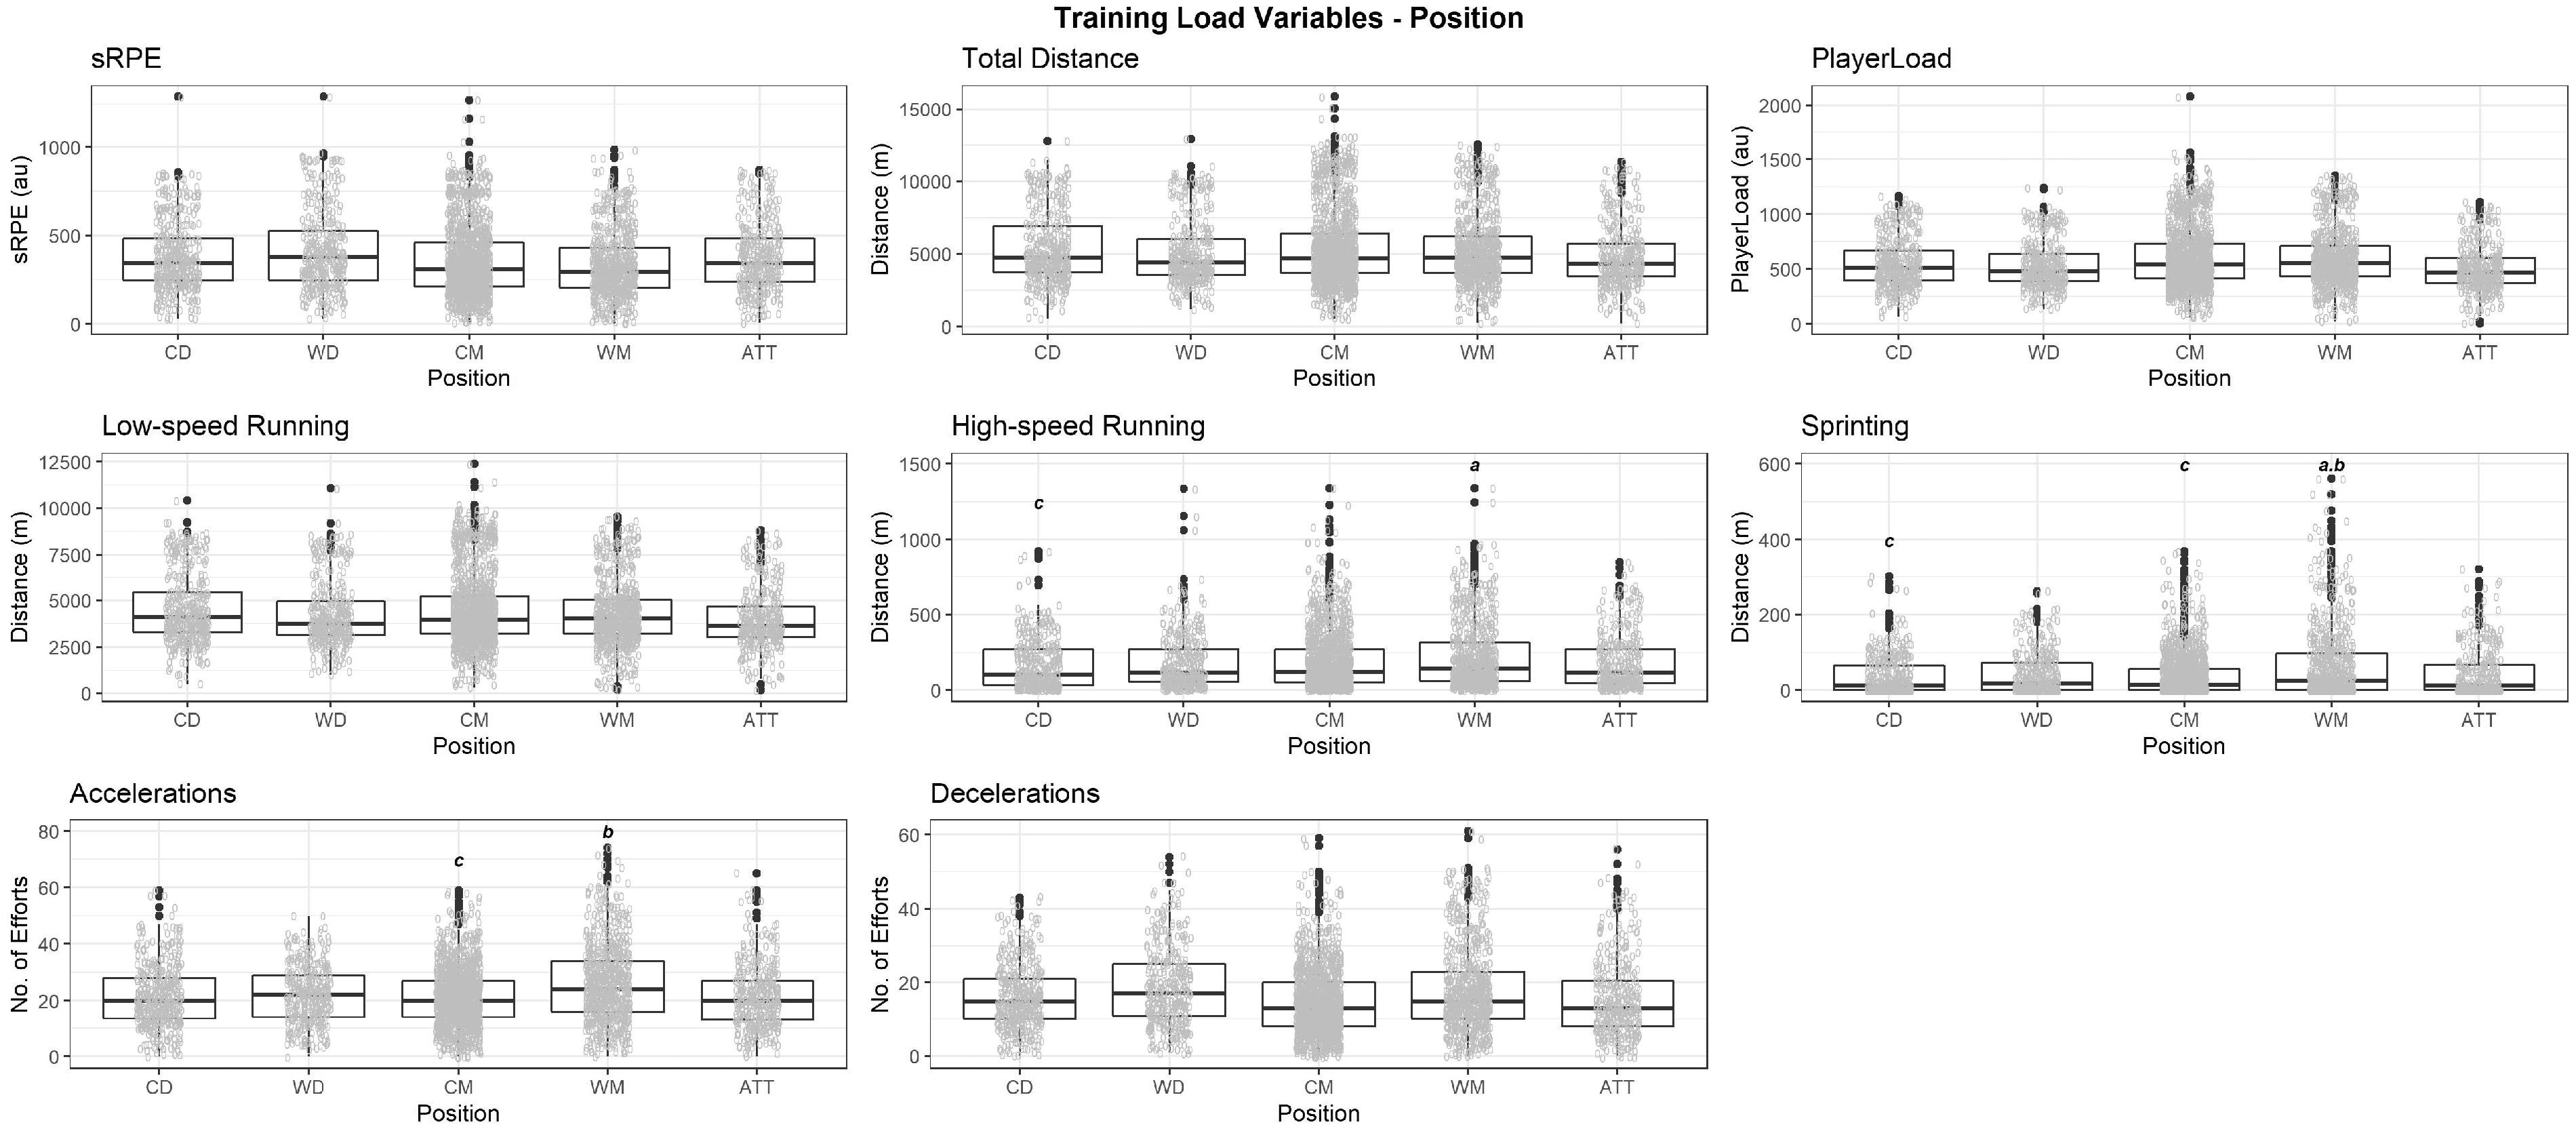
Load values across Position; (a) sig different (p < 0.05) to CD, (b) sig different (p < 0.05) to CM, (c) sig different (p < 0.05) to WM.
Proximity to MD was identified as the most influential factor, with likelihood ratio test indicating significance (p < 0.001) for all dependent variables (sRPE (
Regression coefficients for each load variable for training proximity to match day (MD).
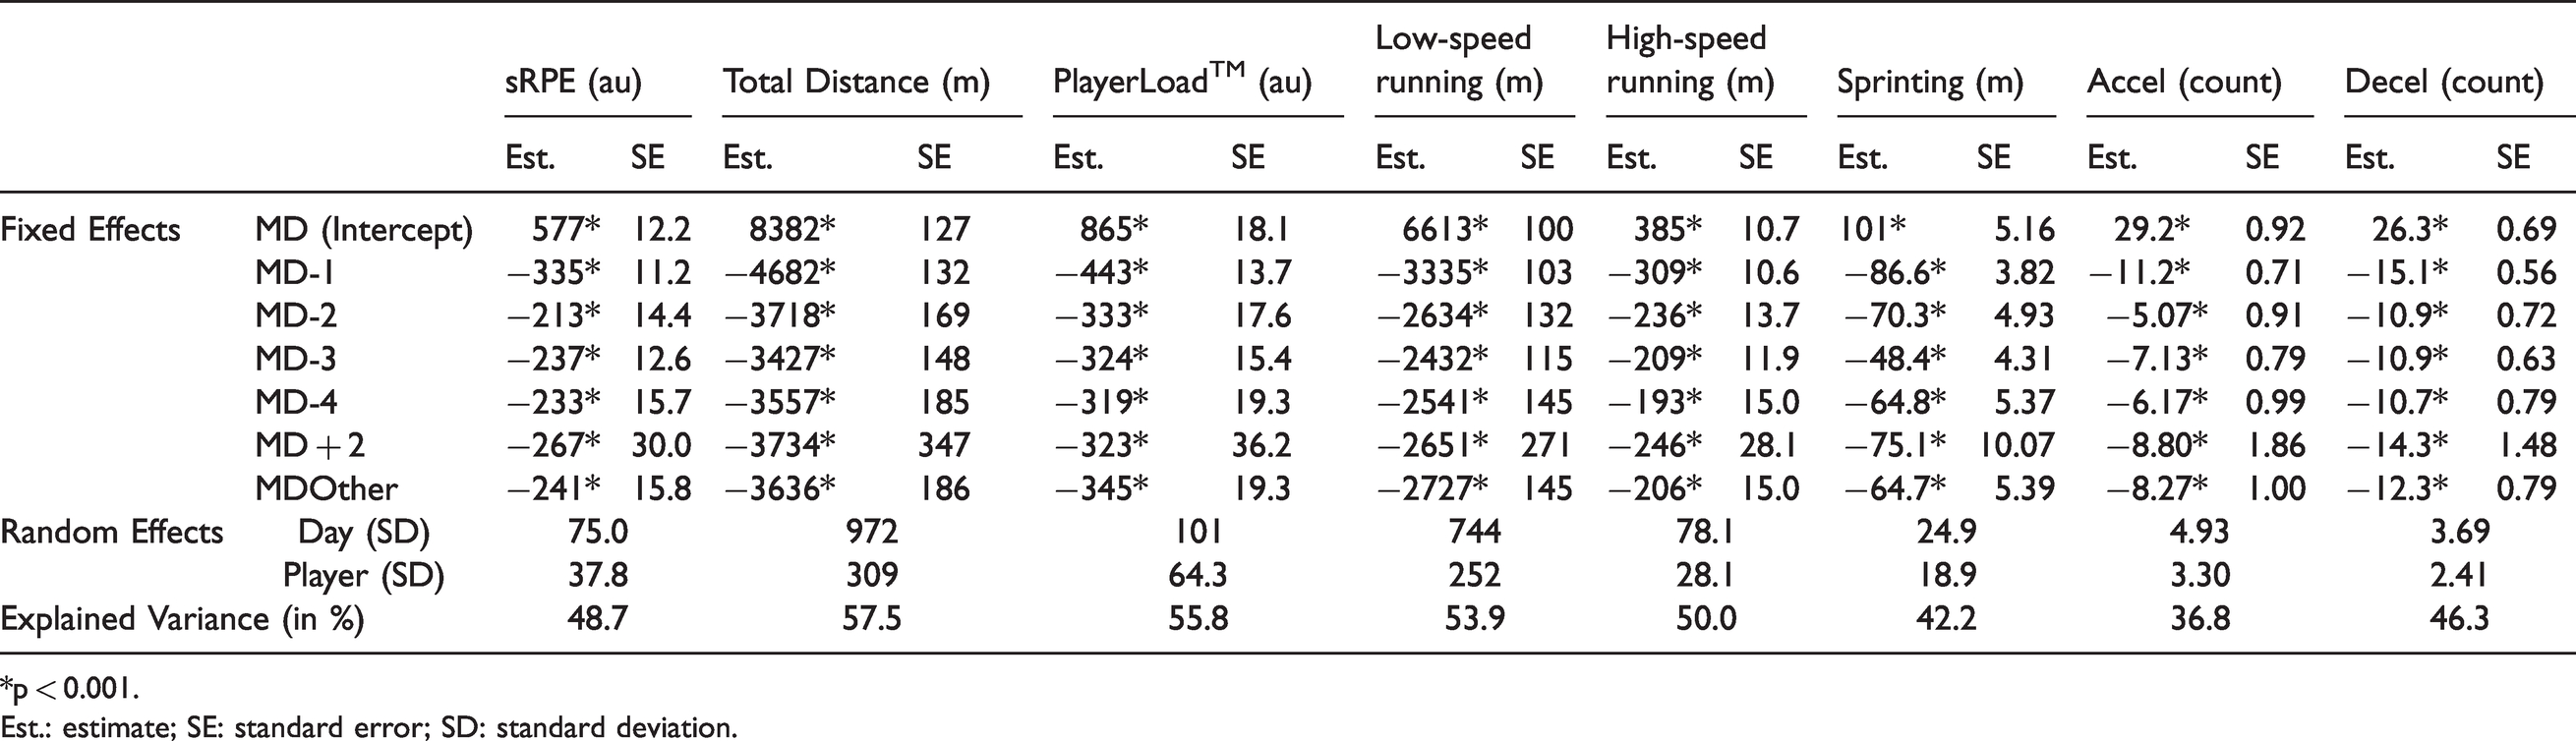
*p < 0.001.
Est.: estimate; SE: standard error; SD: standard deviation.
Likelihood ratio tests investigating effects of stage of season indicated significance for all dependent variables (p < 0.049). However, effect sizes for all were equal to 0. Analysis of individual regression coefficients for stage of season demonstrated that Pre-Season values were lower than Comp1 for total distance (p = 0.03), PlayerLoad™ (p = 0.02) and low-speed running (p = 0.002). Pre-Season values were also lower than Comp 2 for low-speed running (p = 0.03).
Likelihood ratio tests investigating the effects of playing position also indicated significant differences for all dependent variables (p < 0.003). Again, however, effect sizes for all were equal to 0. Analysis of individual regression coefficients demonstrated that WM covered greater high-speed running distances than CD (p = 0.02). WM covered greater sprinting distances than CD (p = 0.02) and CM (p = 0.01). Finally, WM reported more accelerations than CM (p = 0.02).
Discussion
The aim of this study was to investigate load across an entire season for professional youth football players, and assess influence of training structure, season structure, and playing position on load experienced by players. The primary finding was that proximity of training to MD was the most influential factor explaining variation in training load. In contrast, there appeared to be limited differences in the mean load across stages of the season and across position. The analyses demonstrated that load was significantly (p < 0.001) higher on MD than training days for all load variables. Relative to MD, the largest difference in sRPE was on MD-1 (55.1%), with the lowest being on MD-3 (30.7%). For objective measurements of load, relative to MD, the largest difference was for sprinting distance on MD + 2 (87.3%) and the lowest on MD-2 (10.0%) for accelerations. The day before a match (MD-1) was characterised by significantly less load, acting as a taper for competition. Distribution of training load was found to be relatively consistent during mid-week training sessions (MD-4, MD-3, MD-2). These findings indicate a relatively rigid structure across a range of dependent variables, quantifying both the internal and external loads experienced.
A reduction of load on MD-1 has been shown in players from the English Premier League,9,10 and senior-professional Dutch and Portuguese teams. 12 However there does appear to be some differences across the training week. In comparison to findings by Clemente et al., 12 the average total distance covered on MD-1 by the players assessed in the current study (3817 m) was 16.7% lower than reported in professional Dutch and Portuguese players (4584 m). Clemente et al. 12 reported a decrease in load from the middle of the week to MD-1. For total distance, players covered 24.6% less on MD-1 than MD-4, and 33.7% and 19.6% less than on MD-3 and MD-2 respectively. Our players covered 18.4% less on MD-1 than MD-4, and 29.3% less and 18.6% less than on MD-3 and MD-2 respectively. Similarly, Clemente et al. 12 reported distance covered at >20km.h−1 of 19.2%, 42.4% and 41.9% less on MD-1 than MD-4, MD-3 and MD-2 respectively. We observed a similar unloading pattern in high-speed running and sprinting. For high-speed running we showed 50.5%, 60.0% and 42.9% less distance covered on MD-1 than MD-4, MD-3 and MD-2 respectively. Whilst for sprinting distance, we observed 50.9%, 75.7% and 49.8% less distance covered on MD-1 than MD-4, MD-3 and MD-2. This pattern was also observed by Malone et al. 9 in English Premier League players, with MD-1 load values being significantly lower than those reported on MD-2, MD-3 and MD-5. For total distance they reported 1914 m less distance covered on MD-1 than MD-2, and 2260 m and 2116 m less on MD-1 than for MD-3 and MD-5. Whilst there was no significant difference for high-speed distance between MD-1 and MD-2, they recorded significantly greater values on MD-3 (82 m) and MD-5 (135 m). The differences in loading values between studies may be explained by our players being younger professional players. A recent analysis comparing the external load performed by U19 and full-time professional Dutch players found that younger players generally covered more total distance, but this was at a lower intensity. 25 Regarding the tapering of load, similar finding have also been shown in reserve level Spanish players. 26 It appears that, regardless of level, professional teams will embrace some form of de-loading strategy to increase player readiness for matches, however the training methodology employed by individual clubs, and the level of player within a professional football setting, will influence differences between days.
The finding that mean training loads remain similar across the difference stages of the season agree with results from previous research and support conclusions regarding the potentially monotonous nature of training load experienced by players. 9 For the players presented in the current study, a key aim of pre-season training was to complete a large amount of physical preparation to develop physical qualities and prepare players for the competitive season. 27 In contrast, during the in-season phases, increases in match-play load was believed to reduce the need for training load to maintain or enhance physical development. Thus, focus was turned to technical and tactical development in training, whilst maintaining previously developed physical qualities.9,27 However, this strategy does not seem to be reflected in the mean load values presented. As has previously been suggested, 9 the load associated with training and match play will be dependent on the training methodology and match schedules employed. The lack of differences between pre-season and both competitive stages in the current study suggest that there may be opportunities to increase the load during pre-season. This increase in pre-season load may lead to players being better physically prepared for the demands of the competitive season.
Evidence of limited variation was identified within the weekly structure of training and match load. The findings above show that main days for ‘loading’ are MD-4, MD-3, and MD-2, likely due to their distance from competitive match-play. MD-3 had the highest average total distance covered (5398 ± 2581 m) and sprinting distance (60.5 ± 39.2 m) outside of match-play. MD-3 had the highest amount of running distance (204 ± 175 m). These findings were also observed in studies by Malone et al. 9 and Clemente et al., 12 with limited variation in the midweek and a gradual taper towards MD. Future investigations may be warranted to better understand the use of variation in load experienced through the training week. Further understanding of the dose-response nature of training may assist practitioners in enhancing time within the loading phase of the microcycle to promote adaptation, particularly during the in-season phase.
Our results also demonstrated limited differences in mean training and match load between player position. Where differences were observed, these were characterised by very small effects and between central and wide positions, showing that wide midfielders tended to experience a greater load. Comparison of the random effects standard deviation also highlighted greater variation between training sessions in comparison with variation between players (Table 2). Previous research by Gallo et al. 28 found that playing position explained 69% of the variance in sRPE load in Australian Footballers, indicating that the nature of a given sport may play a large role in distribution of load across players. Whilst the effects of player position were not as large in our analysis as that demonstrated by Gallo et al., 28 previous research with professional football players has identified significant differences in a range of internal and external load measures across playing position. 29 However, similar to the results presented here, a previous analysis with amateur youth football players reported consistent load measures across player position. 30 These differences are likely to be influenced by a range of factors including the sport, level of the players, training load metrics selected, and the training methodology. For example, it is possible that focus on small-sided games in training could lead to training loads that are less position specific. In contrast, training that employs large-sided games or technical drills which are position specific may lead to greater disparities in training load.
There are limitations to this study that should be considered. Whilst the large data set alongside access to professional players provide useful insights, it is difficult to establish the generalisation of the findings to a wider athletic population. The physical strategies particular to the football team may be dissimilar to others and there is the potential that larger variations in load may be planned and as a result experienced by players across the factors investigated. Additionally, the present study only included on-pitch sessions and there is the potential that inclusion of load data during for example gym-based strength and power sessions may have influenced findings. The prospective inclusion of additional independent variables such as detailed categorisation of individual training sessions and increased sub-phases within the competitive season may have explained greater variation. Finally, the categorisation of players as starters or non-starters with respect to match involvement, may have given additional insight to this study. Differences in load patterns between these groups may have highlighted considerations when structuring additional training to replicate the volume and intensity demands of match play. 13
Conclusions
This study provides insight to the professional training and match play environment undertaken by professional youth football players and suggests similarities in the weekly load structure to elite professional players. The results show that the largest load experienced during the week is on MD. The largest effect of training load is proximity to match day. There was limited variation in the training week between MD-4, MD-3, and MD-2. Increased variation in training may provide opportunities to generate further physical adaptions. Whilst the results show substantial overall variation in training loads reported, consistency in mean values reported between player position and stage of season indicate relatively uniform practices. These results, which highlight the potentially monotonous nature of load experienced by players indicate potential scope to augment practice. Use of periodisation methods which create more variety within training, and assessment of the physical response to these methods is warranted.
Footnotes
Acknowledgements
The authors would like to thank Aberdeen Football Club Development Squad players and staff for their support and consideration during the period of this study.
Declaration of Conflicting Interests
The author(s) declared no potential conflicts of interest with respect to the research, authorship, and/or publication of this article.
Funding
The author(s) received no financial support for the research, authorship, and/or publication of this article.