
Abstract
The isometric mid-thigh pull (IMTP) is widely used for assessing maximal force production due to its minimal fatigue impact compared to dynamic strength tests. However, variations in testing protocols, equipment, and athlete characteristics may influence the reproducibility of IMTP-derived variables. Understanding its reliability in youth athletes is crucial for monitoring physical development and optimizing training programs. This systematic review followed PRISMA guidelines. A literature search in four databases (PubMed, SPORTDiscus, Scopus, Web of Science) identified studies on the test-retest reliability of IMTP in youth athletes (≤21 years). Extracted data included participant characteristics, testing protocols, and reliability metrics (intraclass correlation coefficients [ICCs], coefficient of variation [CVs], and standard error of measurement [SEM]). Twenty studies met inclusion criteria (2095 athletes). Peak force reliability was high (ICCs = 0.72–0.99, CVs = 2.0%–8.3%). Early phase force outputs (e.g., force at 50 and 100 ms) showed greater variability (ICCs = 0.73–0.95, CVs = 5.5%–23.3%). IMTP exhibits good-to-excellent reliability for peak force in youth athletes but higher variability in early force measures. Standardizing testing protocols may enhance reliability. Despite methodological differences, IMTP remains a valuable tool for strength monitoring and talent identification in youth athletes.
Introduction
The test–retest reliability of assessments shows the reproducibility of measured variables over time (i.e., consistency of the assessment) and is fundamental in sports and exercise science, particularly for evaluating strength and neuromuscular performance. The isometric mid-thigh pull (IMTP) is a test that replicates the start of the second pull of an Olympic lift and is the point where the highest force is generated during the lift. The IMTP has become a widely used method to measure maximal force production owing to its high reliability and low risk of fatigue compared to dynamic strength tests. For practitioners, understanding the reliability of this test is crucial to effectively monitoring physical development and training adaptations. 1 Despite their frequent use in research and applied settings, variations in testing protocols, equipment, and athlete characteristics may affect the reproducibility of IMTP-derived variables.2,3 Establishing robust reliability measures for this test in youth populations is necessary to ensure consistent and meaningful evaluation of strength development.
In this review, the term youth athletes is used consistently to refer to individuals aged ≤21 years, following established classifications in youth sport literature.4,5 This definition clarifies the scope of the review and supports comparability across studies. Given that both chronological age and biological maturation can influence IMTP-derived outcomes, these factors are acknowledged as potential sources of variability, and age ranges are explicitly highlighted in the synthesis of results.
Previous research on IMTP reliability has primarily focused on adult and elite athletes, demonstrating good-to-excellent test-retest reliability across different variables such as peak force and rate of force development.6–8 Studies have shown that IMTP measures correlate strongly with dynamic performance metrics such as sprinting and jumping ability.9–13 Furthermore, systematic reviews have reinforced the consistency of IMTP-derived parameters with high intraclass correlation coefficients (ICCs) and acceptable coefficients of variation (CVs) across multiple studies. 8 However, these findings have largely been established in adult populations, and there is still a need for research that focuses on adolescent athletes.14,15
Despite the growing body of literature on the reliability of IMTP to measure force-related outcomes, gaps remain regarding its applicability in youth populations, particularly concerning age-related differences in strength expression, gender differences, and the impact of biological maturation6,13 as well as variations in movement competency and strength measures across different maturity stages.16,17 While previous studies have explored peak force as the primary reliability measure, recent work has highlighted the importance of assessing additional force-time variables such as impulse and rate of force development. 18 Furthermore, there is a limited understanding of how different onset thresholds and methodological variations influence test outcomes in adolescent athletes. 19 Research examining these aspects is critical for refining protocols and improving the accuracy of strength assessment in young athletes.
Gaining further insight into the reliability of IMTP-derived outcome measures in youth athletes is essential for practitioners and researchers aiming to optimize training interventions and track athletic development. 20 Accurate and consistent strength assessments can enhance talent identification processes, inform strength and conditioning programs and contribute to injury prevention strategies.21,22 Recent evidence suggests that isometric and dynamic strength assessments provide complementary insights into athletes’ physical capabilities, reinforcing the importance of integrating both approaches in performance monitoring. 23 By addressing methodological inconsistencies and expanding the scope of the variables analyzed, researchers can provide more comprehensive guidelines for IMTP testing in youth populations. 24 Additionally, sex-specific differences in neuromuscular performance may allow for more equitable and effective monitoring of both male and female athletes. 25
Therefore, this systematic review aimed to synthesize available literature on the test-retest reliability of the IMTP-derived outcome measures in youth athletes, examining key force-time variables such as peak force, impulse, and rate of force development while accounting for methodological variations and sex differences. By synthesizing findings from previous studies and addressing existing gaps, this research seeks to provide evidence-based recommendations for the use of the IMTP as a strength assessment tool in youth athletic populations.
Material and methods
Search strategy
The Preferred Reporting Items for Systematic Reviews and Meta-Analyses (PRISMA) guidelines were followed.26,27 The following search syntax was used to identify studies examining the test-retest reliability of maximal strength assessment using the IMTP test, specifically in youth athletes: (“mid-thigh pull” OR “mid-thigh pull” OR “Mid-Thigh pull” OR “mid-thigh clean” OR “mid-thigh clean” OR “Mid-Thigh clean”) AND (reliability OR repeatability OR reproducibility) AND (youth OR Child* OR Young OR adolescent* OR “young athlete*” OR “youth athletes*”). The search was conducted using four electronic bibliographic databases: PubMed, SPORTDiscus, Scopus, and Web of Science (all databases). The search period covered studies published from their inception until 8th February 8, 2025. In addition to the primary search, a secondary search was performed using both backward and forward citation tracking of all included studies to identify additional relevant publications.
Inclusion criteria
We included studies that satisfied the following criteria: (a) published in a peer-reviewed journal and in English; (b) examined the test-retest reliability of relative or absolute peak force, as well as other force-time variable (e.g., force at 50, 100, and 150 ms) in unilateral or bilateral IMTP exercise among youth athletes aged ≤21 years; and (c) reported intraclass correlation coefficient (ICC), coefficient of variation (CV), and standard error of measurement (SEM). The search and study selection according to the eligibility criteria were concluded on February 4th, 2025. The initial screening was conducted independently by two authors (JB and HS) based on titles and abstracts. Subsequently, full-text articles were assessed to determine their eligibility. Any disagreements between the reviewers were resolved through consensus, and when necessary, a third independent reviewer (RMB) was consulted.
Data extraction
We extracted the following data from each of the included studies: (a) participant characteristics, (b) time between testing sessions, (c) familiarization with the test and warm-up protocol, (d) hip and knee angles used for the test, and (e) ICC, CV, and SEM values for peak force as well as other force-time variables. Data extraction was performed independently by two authors [JB and HS]. Upon completion of the data extraction process, discrepancies between the datasets of the authors were systematically reviewed, critically analyzed, and reconciled to ensure consistency and accuracy in the final dataset.
Reliability data interpretation
The ICC values were interpreted based on the thresholds outlined by Koo and Li. 28 According to these guidelines, ICC values were categorized as follows: values below 0.50 indicated “poor reliability,” values between 0.50 and 0.75 denoted “moderate reliability,” values ranging from 0.76 to 0.90 reflected “good reliability,” and values exceeding 0.90 were indicative of “excellent reliability.” Although there is no universally standardized criterion for interpreting CV values, in the context of medical and health-related research, CVs equal to or less than 5% are commonly regarded as indicative of excellent reliability.3,20,29 The standard error of measurement [SEM] was included as an additional index to quantify the precision of individual test scores, offering a complementary perspective to the ICC. SEM provides an absolute measure of the consistency of repeated assessments, with lower values indicating higher precision and reduced measurement error. This approach aligns with established methodologies that emphasize the importance of combining ICC and SEM to deliver a more comprehensive assessment of test-retest reliability.30,31
Methodological quality
The methodological quality of the included studies was assessed using Box B of the Consensus-based Standards for the Selection of Health Measurement Instruments (COSMIN) checklist. 32 This box comprises 11 items evaluating critical methodological aspects, including the number of testing sessions, intervals between sessions, test administration procedures, data reporting standards, identification of methodological limitations, and adequacy of the sample size. The scores for the individual studies on all items of the COSMIN checklist are presented in Table 2.
Methodological evaluation was conducted independently by two authors [JB and HS]. Following independent assessments, any discrepancies were thoroughly reviewed, deliberated, and resolved to ensure consensus and uniformity in the evaluation outcomes.
Results
Search results
The study selection process was documented using a PRISMA 2020 flow diagram generated using the PRISMA2020 R package and the Shiny app. 33 A total of 885 records were identified through database searches (Figure 1). After removing 117 duplicate records, 768 unique records remained for screening. Of these, 745 were excluded based on the title, abstract, or full-text review. The remaining 23 studies were assessed for eligibility, and none of the studies required retrieval. After further assessment, five studies were excluded because they did not contain relevant data on ICC, CV, or SEM.17,19,34–36 Additionally, two studies were identified through a reference list search, both of which met the eligibility criteria. Consequently, only 20 studies were included in the final review.7,14,37–54
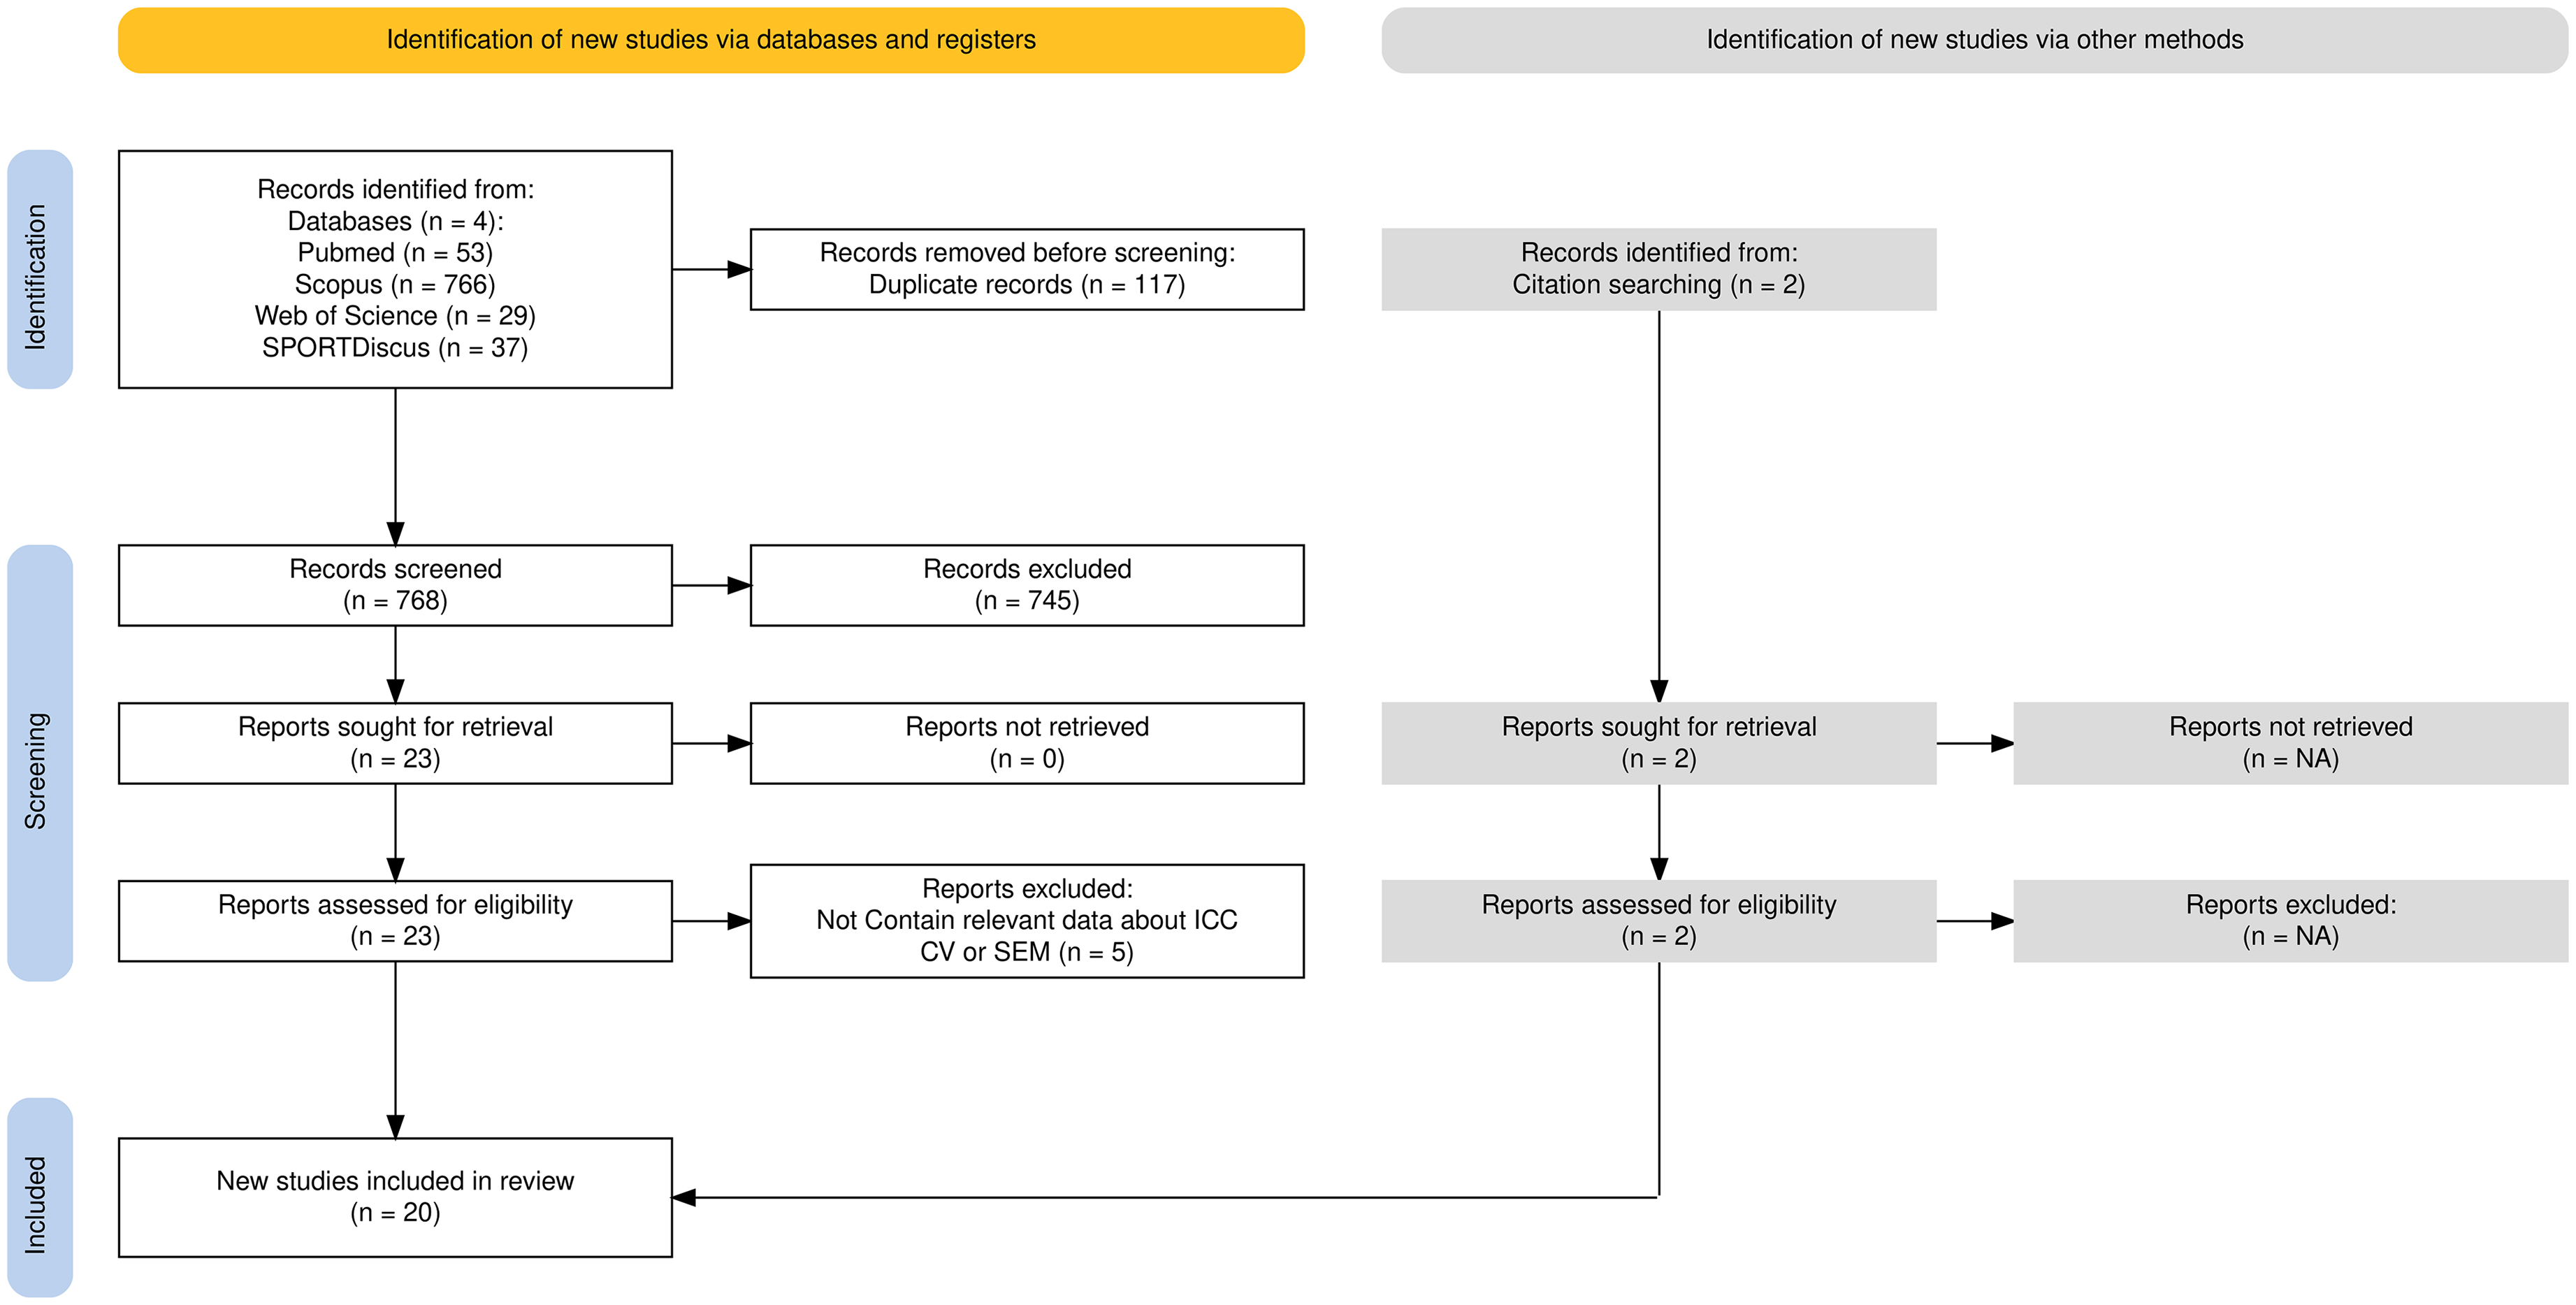
PRISMA flow diagram.
Study characteristics
The sample sizes ranged from 13 to 654 participants (median = 35), totaling 2095 athletes. The studies included athletes from a variety of sports such as soccer, rugby, netball, volleyball, dance, basketball, and golf. The time between testing sessions varied from same-day assessments to seven days apart. The familiarization protocols included prior experience, structured practice sessions, or integration into regular training. Warm-ups commonly involve dynamic stretching and submaximal pulls at 50% and 75% of the perceived effort, respectively. The sampling rates of the force platforms ranged from 100 Hz to 1000 Hz, with hip and knee angles typically between 120°and 160°. Seventeen studies reported ICCs (0.72 to 0.99) and 16 studies provided CVs (2.0% to 19.0%). SEM has only been reported in a few studies (see Table 1).7,49,51,53,54
Summary of included studies.
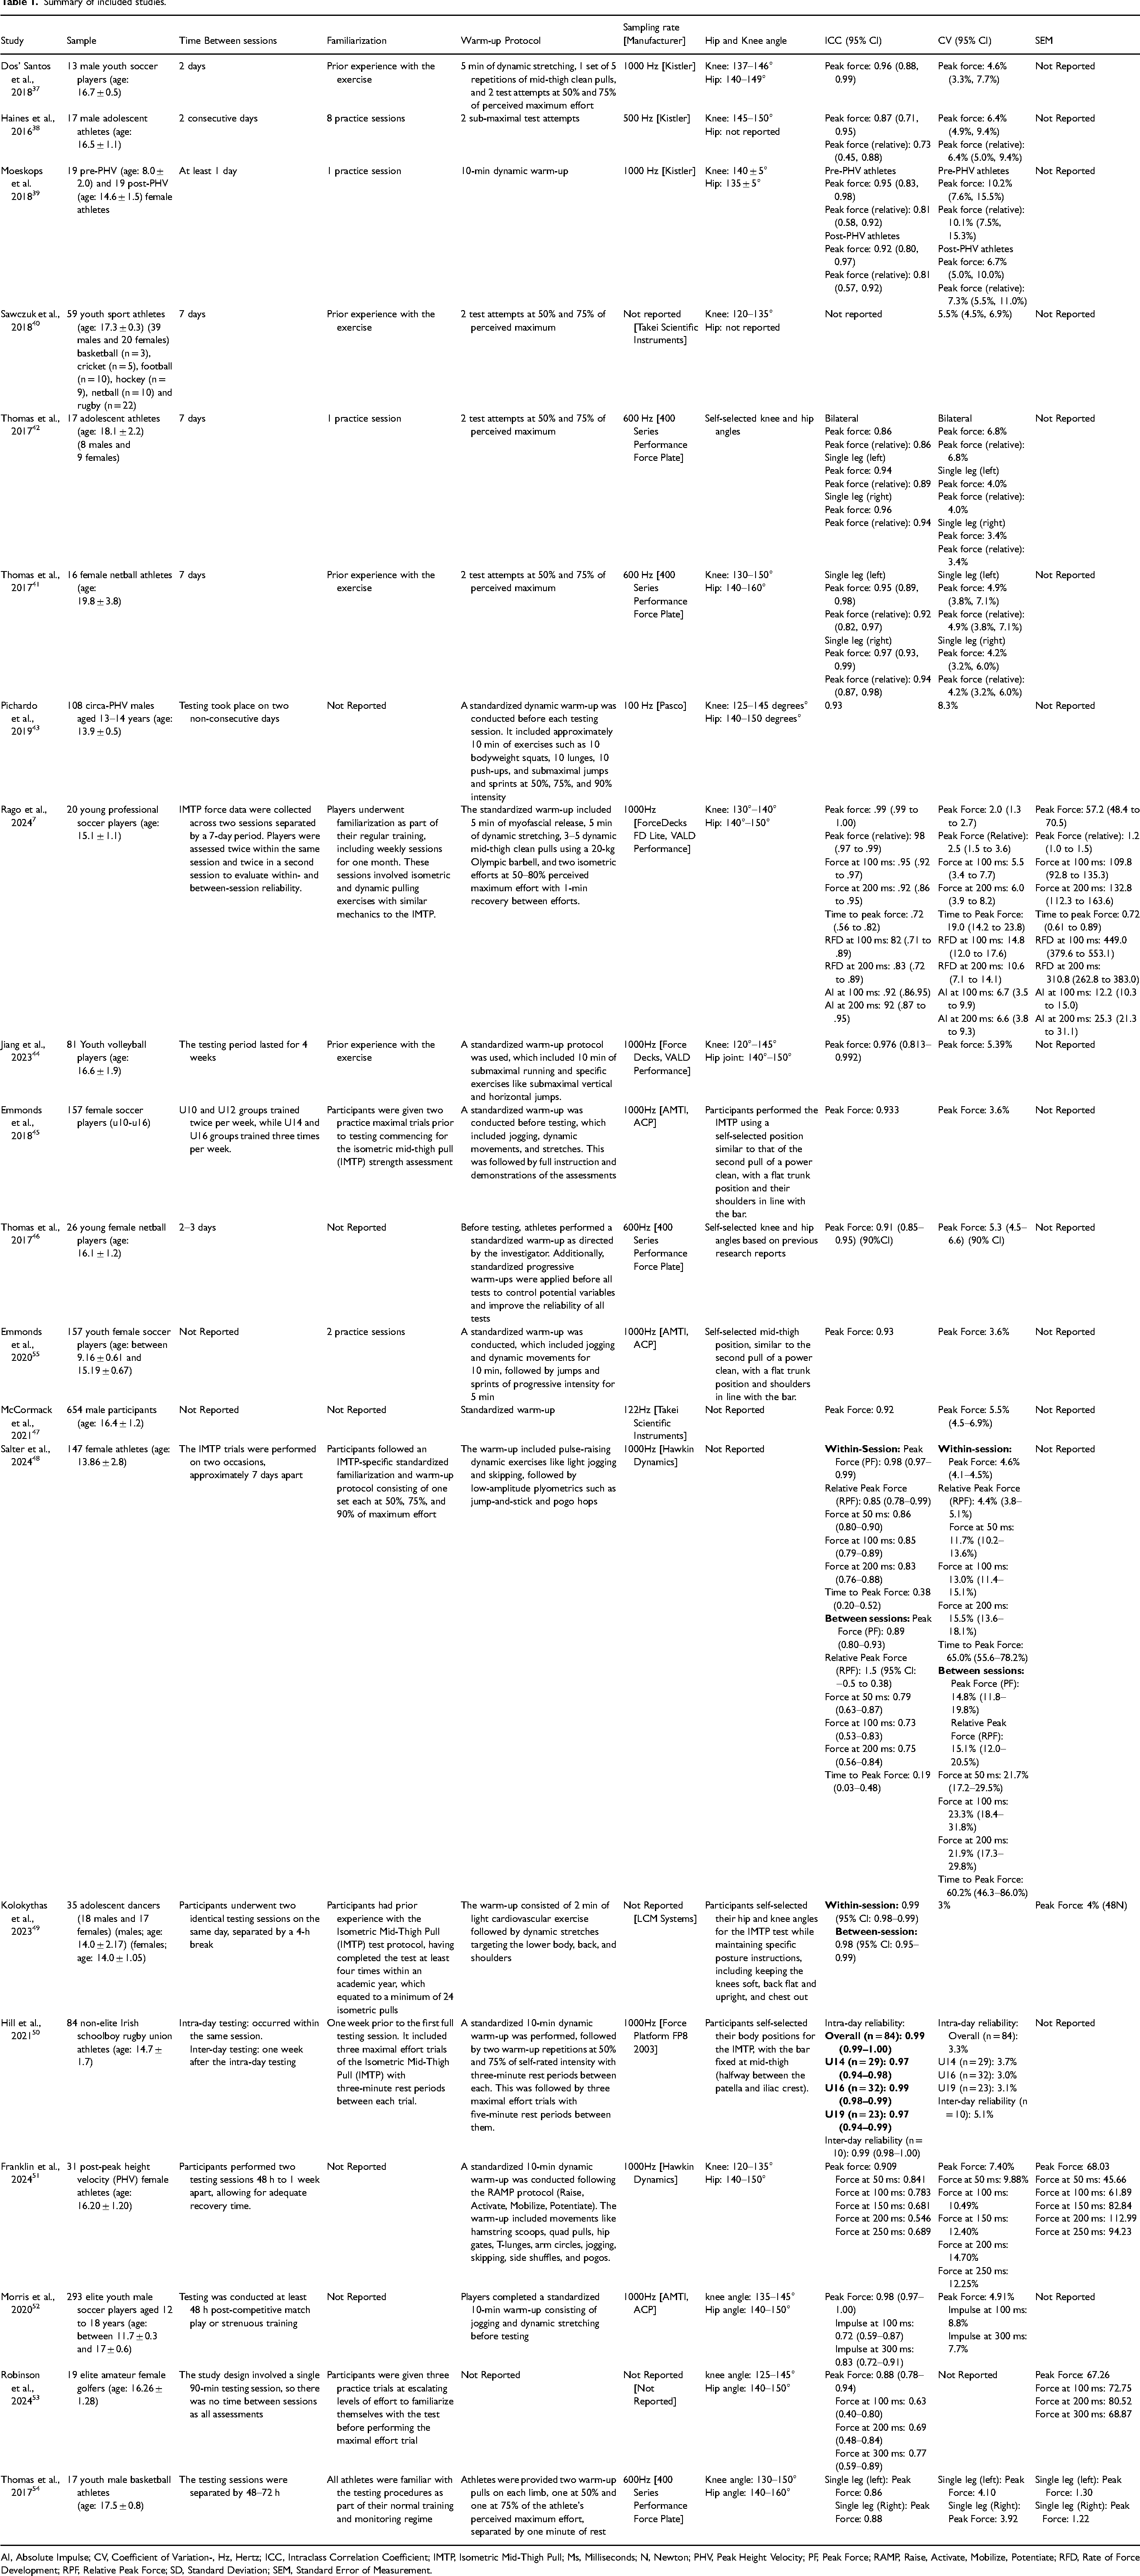
AI, Absolute Impulse; CV, Coefficient of Variation-, Hz, Hertz; ICC, Intraclass Correlation Coefficient; IMTP, Isometric Mid-Thigh Pull; Ms, Milliseconds; N, Newton; PHV, Peak Height Velocity; PF, Peak Force; RAMP, Raise, Activate, Mobilize, Potentiate; RFD, Rate of Force Development; RPF, Relative Peak Force; SD, Standard Deviation; SEM, Standard Error of Measurement.
Methodological quality
Based on the COSMIN checklist evaluation, three studies were classified as having excellent methodological quality, scoring nine out of 11. Fourteen studies were rated as having good methodological quality, with scores ranging from eight to ten (out of 11). One study was classified as having moderate methodological quality, scoring seven (out of 11). Additionally, two studies were categorized as having poor methodological quality, scoring five and four (out of 11). The scores for the individual studies on all items of the COSMIN checklist are presented in Table 2.
Methodological quality assessment of the included studies using the cOnsensus-based standards for the selection of health measurement instruments (COSMIN) checklist.
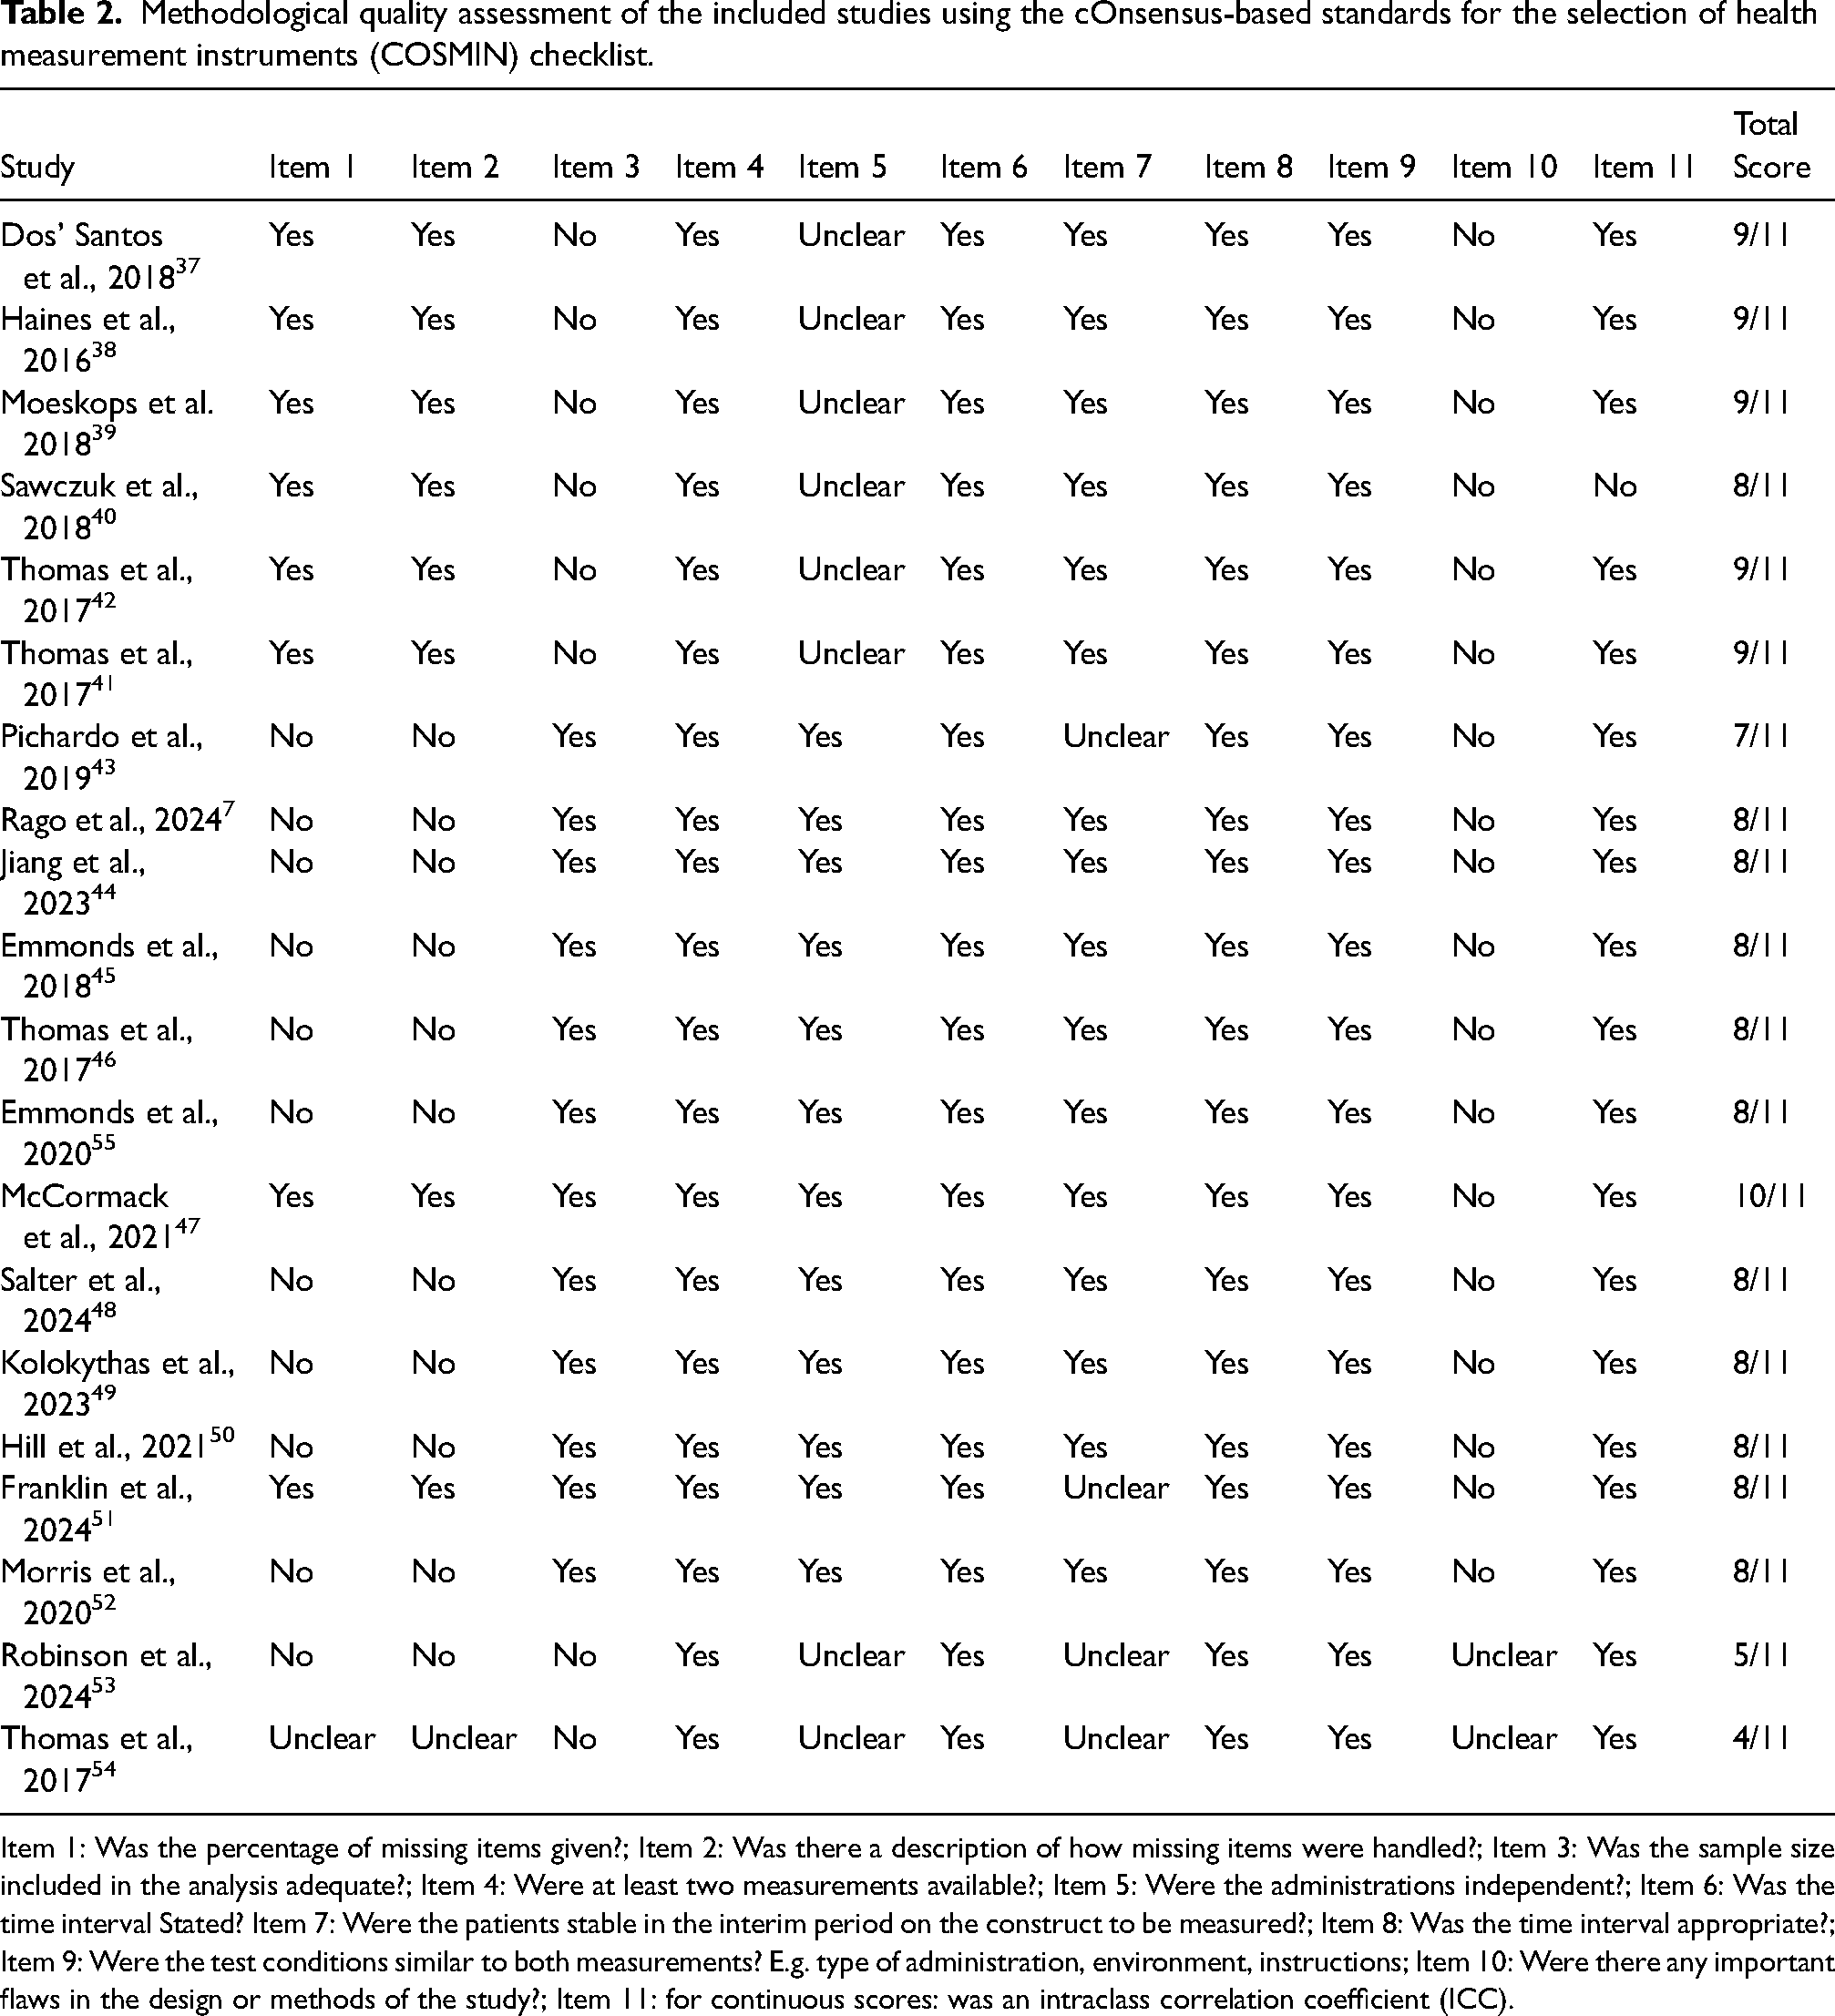
Item 1: Was the percentage of missing items given?; Item 2: Was there a description of how missing items were handled?; Item 3: Was the sample size included in the analysis adequate?; Item 4: Were at least two measurements available?; Item 5: Were the administrations independent?; Item 6: Was the time interval Stated? Item 7: Were the patients stable in the interim period on the construct to be measured?; Item 8: Was the time interval appropriate?; Item 9: Were the test conditions similar to both measurements? E.g. type of administration, environment, instructions; Item 10: Were there any important flaws in the design or methods of the study?; Item 11: for continuous scores: was an intraclass correlation coefficient (ICC).
Overall quality
Across all included studies, ICCs ranged from 0.72 to 0.99 (median ICC = 0.95), with 80% of ICCs ≥ 0.90 and 96% ≥ 0.75. The reported CVs ranged from 2.0% to 19.0% (median CV = 5.5%), with 57% of the CVs being ≤5%.
Reliability of all parameters of isometric mid-thigh pull [IMTP]
Twelve studies assessed the reliability of peak force in the bilateral IMTP, with ICCs ranging from 0.86 to 0.99 (median ICC = 0.96), where 84% of ICCs were ≥0.90 and all were ≥0.75. The CVs for bilateral peak force ranged from 2.0% to 8.3% (median CV = 5.0%), with 60% of CVs ≤ 5%. Four studies examined the reliability of peak force in the unilateral IMTP, reporting ICCs between 0.89 and 0.97 (median ICC = 0.95), with 91% of ICCs ≥ 0.90. CVs ranged from 3.4% to 4.9% (median CV = 4.0%), with all CVs ≤ 5%. In total, 19 studies explored the reliability of absolute peak force, with ICCs ranging from 0.84 to 0.99 (median ICC = 0.97), where 89% of ICCs were ≥0.90. The CVs for absolute peak force ranged from 2.0% to 8.3% (median CV = 4.9%), with 67% of the CVs ≤ 5%. Ten studies investigated the reliability of relative peak force, reporting ICCs from 0.73 to 0.98 (median ICC = 0.89), with 52% of ICCs ≥ 0.90 and 90% ≥ 0.75. The CVs for the relative peak force ranged from 2.5% to 10.1% (median CV = 5.3%), with 57% of the CVs ≤ 5%.
Regarding time-specific force outputs, five studies reported the reliability of force at 50 ms, with ICCs ranging from 0.79 to 0.86 (median ICC = 0.83), where 27% of ICCs were ≥0.90. CVs for force at 50 ms ranged from 11.7% to 21.7% (median CV = 16.7%), with no CVs ≤ 5%. Eight studies assessed force at 100 ms, with ICCs ranging from 0.73 to 0.95 (median ICC = 0.85), where 45% of the ICCs were ≥0.90, and 87% were ≥0.75. CVs for force at 100 ms ranged from 5.5% to 23.3% (median CV = 12.0%), with no CVs ≤ 5%. Three studies evaluated force at 150 ms, reporting ICCs between 0.68 and 0.72 (median ICC = 0.70), while CVs ranged from 12.4% to 19.0% (median CV = 15.7%), with no CVs ≤ 5%. Seven studies examined force at 200 ms, with ICCs ranging from 0.75 to 0.92 (median ICC = 0.83), where 35% of ICCs were ≥0.90. CVs for force at 200 ms ranged from 6.0% to 21.9% (median CV = 13.1%), with no CVs ≤ 5%. One study reported the reliability of force at 250 ms, with ICCs ranging from 0.55 to 0.69 (median ICC = 0.62) and CVs between 12.2% and 14.7%, with no CVs ≤ 5%.
For impulse measurements, four studies assessed reliability at 100 ms and 300 ms, reporting ICCs from 0.72 to 0.83 (median ICC = 0.78). CVs for impulse ranged from 7.7% to 8.8% (median CV = 8.2%), with no CVs ≤ 5%.Time to peak force was explored in six studies, with ICCs ranging from 0.19 to 0.72 (median ICC = 0.38), indicating poor to moderate reliability. CVs for time to peak force ranged from 19.0% to 65.0% (median CV = 40.1%), with no CVs ≤ 5%.
Systematic changes in results between repeated measurements
Eight studies examined whether systematic changes occurred between repeated IMTP sessions. Most of these studies reported consistent results across sessions, indicating stable performance in key IMTP variables. Two studies5,50 reported no significant differences in peak force or relative peak force between sessions, with both studies demonstrating low coefficients of variation (CVs) of 2.0% and 5.1%, respectively. This suggests a strong consistency in maximal strength measures across repeated tests in both young soccer players and rugby athletes.
Similarly, two studies41,49 found no systematic differences in unilateral and bilateral IMTP performance between sessions. Kolokythas et al. 49 reported high between-session reliability with ICCs of 0.98 and minimal CVs of 3%, indicating stable strength outputs in adolescent dancers. Conversely, one study 48 observed significant differences in several IMTP parameters between the sessions. Higher peak force and relative peak force values were recorded in the first session, with between-session CVs values of 14.8% and 15.1%, respectively. Additionally, early phase force outputs (e.g., force at 50 ms and 100 ms) exhibited higher variability, suggesting that learning effects or fatigue may have influenced performance consistency. One study 51 also identified systematic changes in post-peak height velocity (PHV) between sessions in female athletes. Higher values were reported in the second session for early force measures (e.g., force at 50 and 100 ms), with CVs ranging from 9.88% to 14.70%. This indicates a possible adaptation or increased familiarity with the testing protocol over time. Overall, five studies7,41,45,49,50 reported no significant differences between testing sessions, while two studies48,51 identified systematic changes, highlighting the influence of testing protocols, athlete experience, and measurement sensitivity on IMTP performance consistency.
Discussion
This systematic review aimed to consolidate the available literature on the test-retest reliability of IMTP-derived outcome measures in youth athletes. The main finding of this review is that the IMTP-derived peak force output shows good-to-excellent test-retest reliability across studies involving youth athletes. Furthermore, both absolute and relative peak forces demonstrated high reliability, with median ICCs of 0.97 and 0.89, respectively, and the majority of the CVs were ≤5%. Bilateral and unilateral IMTP tests were similarly reliable, with median ICCs of 0.96 and 0.95, respectively. Most studies reported no significant differences in peak force between sessions, indicating stable performance over time. However, some studies reported variability in early-phase force outputs (e.g., force at 50 ms and 100 ms), with ICCs ranging from 0.73 to 0.95, suggesting sensitivity to learning effects or developmental factors common in youth populations.
Sample size and characteristics
The sample sizes across the included studies exhibited substantial heterogeneity, ranging from 13 to 654 participants with a median sample size of 35. Although smaller sample sizes did not appear to exert a significant influence on ICC outcomes for peak force, previous literature underscores the necessity of rigorous sample size estimation to ensure the generalization of research findings, particularly in studies employing ICCs [9–12]. For instance, studies with limited sample sizes, such as that by Dos’ Santos et al. 37 reported an ICC of 0.96 with a sample size of 13 male youth soccer players, which is comparable to that reported by Morris et al. 52 (ICC = 0.98), with a substantially larger sample size of 293 participants. Similarly, large-scale investigations such as those by McCormack et al. 47 which incorporated 654 participants, demonstrated high reliability (ICC = 0.92), mirroring the consistency observed in smaller sample sizes.
Despite the general robustness of ICCs across different sample sizes, notable discrepancies were observed in the CVs, particularly for the force-time outcome measures. Some studies, including female participants, such as Salter et al. 48 (n = 147), exhibited greater variability in early phase force production metrics (e.g., CV = 21.7% at 50 ms), whereas studies with larger cohorts, such as McCormack et al. 47 reported a substantially more stable CV (approximately 5.5%). This pattern suggests that, while maximal strength measures (e.g., peak force) remain highly reliable across sample sizes, force production indices that are temporally sensitive may be more susceptible to variability, particularly in studies with limited sample sizes involving female participants.
Furthermore, the diversity of sports disciplines of participants (e.g., soccer, rugby, netball, dance, basketball, and golf) did not appear to compromise the reliability of IMTP-derived outcomes, indicating the broad applicability of this testing modality across various athletic populations. However, it is pertinent to note that studies involving samples from homogenous cohorts (e.g., elite athletes within a singular sport) tend to demonstrate reduced variability,37–39,41,43,44,52,53 likely attributable to uniform training backgrounds. In contrast, studies integrating heterogeneous populations may introduce additional variability,40,47–49 potentially influenced by disparities in training history and familiarity with strength-testing protocols.
In conclusion, the IMTP demonstrated exceptional reliability across a broad spectrum of sample sizes and athletic cohorts. Although the sample size does not appear to critically influence peak force reliability, time-sensitive force parameters exhibit greater variability in studies with female cohorts. Consequently, researchers should consider the influence of sample characteristics (e.g., adolescent females) when interpreting IMTP-derived outcomes, particularly in investigations that emphasize temporal force metrics.
Age as a confounding factor
An important consideration emerging from this review is the role of age as a potential confounding factor influencing IMTP-derived outcomes. The included studies encompassed a wide age range among youth athletes (e.g., from 8 to 21 years), which introduces heterogeneity in neuromuscular development, training experience, and biological maturation.4,5 These factors can significantly affect both maximal and rapid force production capabilities, potentially influencing reliability metrics such as ICC and CV.7,48 For instance, younger or less mature athletes may display greater variability in early-phase force outputs due to ongoing neuromuscular adaptations. 37 Future research should consider stratifying samples by age groups or maturity status to better account for developmental differences. Subgroup analyses based on maturation indicators could help clarify whether variability in IMTP reliability is attributable to age-related neuromuscular changes, thereby enhancing the interpretability and applicability of findings across youth athletic populations.
Time between testing sessions
The time intervals between testing sessions in the included studies ranged from same-day assessments to intervals extending up to seven days. This variability did not significantly affect the reliability of the peak force measurements in the IMTP, as consistently high ICCs have been reported across diverse temporal intervals. For instance, studies employing shorter intervals, such as that by Dos’ Santos et al. 37 (two-day gap), documented an ICC of 0.96 for peak force, closely comparable to that reported by Rago et al. 7 that employed a seven-day interval and reported an ICC of 0.99. In a similar manner, Thomas et al. 41 and Thomas et al. 54 demonstrated good to excellent reliability (ICC = 0.86–0.96 and 0.92–0.97, respectively) over a seven-day interval, indicating that peak force remains a stable parameter independent of session spacing.
Conversely, early phase force outputs (e.g., force at 50 and 100 ms) exhibited greater sensitivity to inter-session intervals. Studies incorporating longer gaps, such as that by Kolokythas et al. 49 (seven-day interval) reported increased CVs, exceeding 20% for early phase measures. However, Hill et al. 50 conducted two sessions within a single day, separated by four hours, and observed lower variability (CV = 3–4%) and exceptional between-session reliability (ICC = 0.98). In a similar manner, Thomas et al. 54 reported that shorter testing intervals corresponded to reduced variability in force-time characteristics, suggesting that condensed testing schedules may mitigate learning effects and optimize neuromuscular consistency.
Moreover, the influence of inter-session duration may be further modulated by familiarization protocols. Studies incorporating familiarization into regular training regimens or integrating multiple practice sessions have tended to yield reliable outcomes, even over extended testing intervals. For example, Rago et al. 7 implemented comprehensive familiarization procedures and documented minimal variability across a seven-day interval. In a similar manner, Thomas et al. 41 reported that structured familiarization protocols mitigated test variability, underscoring the importance of preparatory measures in stabilizing session-timing effects.
In conclusion, while the duration between sessions does not appear to critically influence the reliability of the peak force in IMTP assessments, shorter intervals may enhance the consistency of early phase force outputs. Furthermore, structured familiarization protocols contribute to stabilizing the results, suggesting that both session timing and preparatory training should be carefully considered in the design of IMTP testing protocols.
Familiarization
Familiarization protocols varied across the included studies, ranging from no-reported familiarization to multiple structured practice sessions. Despite these differences, peak force measurements in the IMTP consistently demonstrated good to excellent reliability, suggesting that familiarization has a limited impact on peak force outcomes. For example, studies involving participants with prior experience or integrated familiarization into regular training reported high ICCs of 0.96 and 0.99.7,37 Conversely, studies that included only a single practice session 41 or had a limited familiarization period 53 also reported good to excellent reliability (ICC = 0.86–0.96 and 0.92–0.97, respectively), indicating that minimal familiarization may be sufficient for reliable peak force assessment in adolescent athletes.
However, the influence of familiarization was more pronounced in the measures of strength and early phase force outputs. Studies with extensive familiarization protocols 7 demonstrated lower CVs for time-sensitive measures, such as force at 100 ms (CV = 5.5%), which falls within the acceptable threshold (<5%). However, the RFD at 100 ms (CV = 14.8%) exceeded this threshold, indicating higher variability in rate-related measures despite familiarization. In contrast, studies following standardized familiarization but testing athletes under different measurement conditions 43 reported higher variability in early phase outputs, with CVs exceeding 20% for force at 50 and 100 ms. 48 Further evidence 53 supports the idea that structured familiarization reduces variability in rapid force measures, reinforcing the need for consistency in testing protocols. This suggests that, while peak force is robust to variations in familiarization, early phase force metrics may benefit from more comprehensive familiarization to reduce variability.
Studies with participants who had extensive prior experience with the IMTP, such as adolescent dancers familiar with the test protocol, 49 reported excellent between-session reliability (ICC = 0.98) and low variability (CV = 3–4%). Similarly, studies in which athletes underwent familiarization through three maximal effort trials before Testing 50 demonstrated excellent reliability for peak force (ICC = 0.99) and low CVs (3.3%). Additionally, structured familiarization across multiple sessions 41 contributed to more consistent outcomes, which is consistent with findings from other studies.
In conclusion, while familiarization protocols do not appear to significantly influence the reliability of the peak force in IMTP testing, they play a more critical role in stabilizing early phase force outputs and strength measures. Ensuring that athletes are adequately familiarized with the test protocol, particularly when assessing rapid force production, may enhance the consistency and accuracy of the IMTP outcomes.
Warm-up protocol
Warm-up protocols varied considerably across the included studies, ranging from simple dynamic stretching routines to more comprehensive protocols involving submaximal isometric pulls and sport-specific exercises. Despite these differences, peak force measurements in the IMTP consistently showed good to excellent reliability, suggesting that variations in warm-up routines have a limited impact on maximal strength outcomes. For instance, studies with basic warm-ups, which included dynamic stretching and mid-thigh clean pulls, reported excellent ICCs of 0.96 for peak force. 37 Similarly, studies implementing more elaborate warm-ups involving myofascial release, dynamic stretching, and submaximal pulls demonstrated an ICC of 0.99 7 indicating that both simple and complex warm-ups can yield reliable peak force results. Further confirmation of this trend showed that regardless of warm-up complexity, the peak force remained highly consistent across repeated trials (ICC = 0.92–0.97). 53
However, the influence of the warm-up protocols appeared to be more significant in early phase force outputs and measures of strength. Studies incorporating dynamic progressive warm-ups with specific activation exercises reported lower CVs for force at 100 ms (CV = 5.5%) and single-leg peak force (CV = 3.4–4.0%)7,41 in contrast, studies with less detailed warm-up protocols, which included general dynamic exercises and plyometrics, exhibited higher variability in early phase outputs, with CVs exceeding 20% for force at 50 ms and 100 ms. 49 Additionally, inadequate warm-up routines contributed to greater fluctuations in early phase force measures, reinforcing the importance of structured preparatory exercise. 53 This suggests that, while peak force remains robust regardless of warm-up complexity, force-time output measures such as RFD and force at 50 ms may benefit from more structured and specific warm-up routines.
Moreover, warm-ups that closely mimic the biomechanics of the IMTP test, such as mid-thigh clean pulls and isometric holds at test-specific joint angles, appeared to enhance the reliability of the force-time characteristics. For example, dynamic stretches targeting key muscle groups and emphasizing posture alignment during warm-up reported excellent between-session reliability (ICC = 0.98) and low CVs (3–4%). 49 Incorporating activation drills specific to IMTP testing also reduced the variability in early phase force metrics, aligning with the benefits of sport-specific warm-ups observed in other studies. 41
In summary, while variations in warm-up protocols do not significantly affect the reliability of the peak force in IMTP testing, they play a more critical role in stabilizing early phase force outputs and strength measures. Incorporating dynamic, progressive, and test-specific warm-up exercises can enhance the consistency of force-time metrics, particularly in assessments of rapid force production.
Sampling rate
The sampling rates used across the included studies varied from 100 Hz to 1000 Hz, with most studies adopting higher rates for increased measurement precision. Despite this variability, peak force measurements in the isometric mid-thigh pull (IMTP) consistently demonstrated good to excellent reliability, suggesting that the sampling rate has a limited impact on the assessment of maximal strength. For example, studies using a sampling rate of 1000 Hz reported intraclass correlation coefficients (ICCs) as high as 0.99, 7 reinforcing the robustness of peak force measurements.
Conversely, studies using a lower sampling rate of 100 Hz still achieved a high ICC (0.93 for peak force, indicating reliable measurement consistency despite the reduced data acquisition frequency. 41 Similarly, studies employing moderate sampling rates between 500 and 600 Hz demonstrated consistent ICC values for peak force (ICC = 0.86–0.94),39,40 reinforcing the trend that maximal strength reliability is largely unaffected by sampling rate selection.
However, the influence of the sampling rate was more pronounced in the time-sensitive force outputs and measures of rapid force production. Early phase force characteristics, such as force at 50 ms and 100 ms, require a higher temporal resolution to accurately capture rapid changes in force production. Studies employing higher sampling rates (e.g., 1000 Hz) reported more stable results for these variables, with relatively low coefficients of variation (CVs) observed for force at 100 ms (5.5%) and the rate of force development (RFD) at 100 ms (14.8%). 7 In contrast, studies utilizing lower sampling rates (100 Hz) reported higher CVs (8.3%) for peak force and lacked detailed data on early phase metrics, likely reflecting the limitations in capturing rapid force fluctuations at lower frequencies. 41 Similarly, increased variability in early phase force measures was observed at moderate sampling rates, suggesting that the ability to detect subtle changes in force may be compromised by lower-frequency data acquisition. 51
Furthermore, studies with intermediate sampling rates of 500 Hz and 600 Hz demonstrated moderate reliability for both the peak force and early phase outputs.39,40 While the peak force remained relatively stable (ICC = 0.86–0.94), the early phase force characteristics exhibited greater variability, suggesting that higher sampling rates improve the precision of force-time measurements. Additionally, variability in force-time characteristics was minimized with higher-frequency sampling, reinforcing the importance of selecting appropriate acquisition rates for detailed force-time analyses. 39
In summary, although the sampling rate does not significantly affect the reliability of the peak force in IMTP testing, higher rates are crucial for accurately capturing early phase force outputs and measures of rapid force production. For practitioners and researchers focusing on these metrics, employing a sampling rate of at least 1000 Hz is recommended to enhance measurement accuracy and reliability.
Hip and knee angle
The hip and knee angles used during IMTP testing varied across the included studies, with some studies prescribing specific joint angles and others allowing self-selected positions. Despite these variations, peak force measurements consistently demonstrated good-to-excellent reliability, indicating that hip and knee angle adjustments had a limited impact on maximal strength outcomes. For instance, studies with standardized joint angles, knee angles of 137–146°, and hip angles of 140–149°, reported excellent ICCs of 0.96 for peak force. 37 Similarly, studies allowing self-selected angles achieved good-to-excellent reliability (ICC = 0.86–0.96 and 0.92–0.97, respectively),41,53 suggesting that athletes can produce consistent maximal force regardless of fixed or self-determined positioning.
However, the influence of the hip and knee angles becomes more evident in the time-sensitive force outputs and strength measures. Studies on standardized joint angles have reported lower variability in early phase force metrics. For example, using knee angles of 130–140° and hip angles of 140–150° demonstrated low CVs for force at 100 ms (5.5%) but high at RFD at 100 ms (14.8%). 7 In contrast, studies with self-selected positions showed slightly lower variability in peak force (CV = 3.6% and 3.8%, respectively) and did not consistently report early phase outputs, such as coefficient of variation (CV) or intraclass correlation coefficient (ICC) for force-time metrics, potentially reflecting lower biomechanical variability among participants.45,53
Additionally, more extreme joint angles, such as knee angles of 120–145° and hip angles of 140–150°, may influence force generation, particularly in rapid force production phases. 44 While peak force reliability remained excellent (ICC = 0.976), the CVs for peak force were slightly elevated (5.39%), suggesting that extreme joint angles could introduce variability, especially when assessing strength. Deviations from optimal positioning also increased variability in force-time characteristics, reinforcing the importance of joint angle standardization when assessing rapid force production. 41
In summary, while variations in hip and knee angles do not significantly affect peak force reliability in IMTP testing, standardized joint positioning may enhance consistency in early phase force outputs and measures of strength. Allowing self-selected angles does not compromise peak force assessments but may introduce variability in force-time metrics, emphasizing the importance of consistent positioning protocols when assessing rapid force production.
ICC (95% CI)
The ICCs reported across the included studies ranged from 0.72 to 0.99, consistently demonstrating good-to-excellent reliability for IMTP measurements [e.g., Peak Force]. Regardless of variations in participant demographics, testing protocols, or equipment, peak force ICCs were generally high, indicating strong test-retest reliability. For example, studies reported ICCs of 0.99 and 0.98, reflecting near-perfect consistency in peak force outputs.7,49 Even studies with good-to-excellent ICCs, at 0.87 and 0.92–0.97, still fell within the range of acceptable reliability for performance assessments.38,53
The confidence intervals (CIs) associated with ICC values also provided insight into the precision and consistency of these estimates. Studies with narrower CIs, such as ICC = 0.96 (0.88–0.99) and ICC = 0.99 (0.99–1.00), indicated greater measurement stability across sessions, likely due to consistent protocols and athlete familiarity.7,37 Conversely, studies with wider CIs, such as ICC = 0.87 (0.71–0.95) and ICC = 0.92 (0.83–0.98), suggested greater variability between participants or testing conditions, although reliability remained within acceptable limits.38,53
For force-time outputs, ICCs tended to be lower and more variable. For example, early-phase force measures like force at 100 ms showed ICCs ranging from 0.73 to 0.95 across studies. Moderate reliability was reported for force at 100 ms, with ICC = 0.73 (0.53–0.83), 48 while higher reliability for the same parameter was observed in another study, 7 ICC = 0.95 (0.92–0.97), highlighting how protocol consistency and participant experience can influence the reliability of early phase force measurements. Further evidence reinforced this trend, observing that inconsistencies in warm-up and joint positioning protocols contributed to ICC variability in early phase outputs. 53
In summary, ICCs across IMTP studies consistently demonstrated high reliability for peak force, with narrower confidence intervals reflecting greater consistency in testing protocols. While early phase force outputs displayed more variability in ICC values, the majority still indicated acceptable reliability, emphasizing the robustness of the IMTP as a tool for assessing both maximal and rapid strength measures.
CV (95% CI)
The CVs reported across the included studies ranged from 2.0% to 21.9%, reflecting varying levels of consistency in the IMTP performance metrics. The CVs were generally low for peak force measurements, indicating high test-retest reliability. Studies have reported CVs of 2.0% (95% CI: 1.3–2.7%) and 3% (95% CI: not reported), suggesting minimal variability in peak force assessments 5,49. Similarly, a CV of 4.6% (95% CI: 3.3–7.7%) for peak force further supported the consistency of this measure across different athletic populations. 37 Low variability in peak force measurements was also observed (CV = 3.8%), reinforcing the reliability of this parameter, regardless of the testing conditions 53
However, greater variability was observed in the early phase force outputs and measures of strength. For instance, the forces at 50 and 100 ms exhibited higher CVs across multiple studies. CVs values of 21.7% (95% CI: 17.2–29.5%) for force at 50 ms and 23.3% (95% CI: 18.4–31.8%) for force at 100 ms indicated substantial variability in rapid force production. 48 In contrast, lower CVs for these same metrics—5.5% (95% CI: 3.4–7.7%) at 100 ms—highlighted the role of standardized protocols and athlete familiarization in reducing variability 5. Further emphasis was placed on inconsistencies in warm-up routines and body positioning contributing to increased CVs in early phase force measures, reinforcing the importance of controlled testing conditions. 53
Confidence intervals associated with CVs provided additional insights into the reliability of IMTP measurements. Narrower CIs, as seen in studies where CV = 3.6%, suggest stable testing conditions and consistent athlete Performance. 45 Conversely, wider CIs, such as those reported for force at 200 ms [CV = 14.70%], indicated greater session-to-session variability, particularly for time-sensitive force outputs. 51
In summary, CVs across IMTP studies were generally low for peak force, confirming the reliability of maximal strength assessment. However, early phase force outputs exhibited higher variability, as reflected in broader confidence intervals, underscoring the need for standardized testing protocols and sufficient familiarization to enhance the consistency of strength measures.
SEM
SEM was inconsistently reported across the included studies, limiting direct comparisons of this parameter in assessing the reliability of IMTP performance metrics. SEM provides valuable insights into the absolute precision of measurements, reflecting the degree of error associated with repeated testing. 56 While many studies have reported ICCs and CVs to assess reliability, fewer have provided SEM values, which could have enhanced the understanding of measurement precision.
In studies where SEM was reported, it typically aligned with findings from ICC and CV data, indicating a high reliability for peak force measurements. For example, SEM values for peak force in the IMTP demonstrated minimal error (57.2 N, 95% CI: 48.4–70.5 N), aligned with a high ICC of 0.99 and a low CV of 2.0%, confirming the consistency of maximal strength assessments. 7 Similarly, SEM values for time-sensitive force measures such as force at 100 ms (109.8 N, 95% CI: 92.8–135.3 N) reflected slightly greater variability, consistent with higher CVs (5.5%) and lower ICCs (0.95) for these parameters. 7 The SEM values for the peak force (62.5 N) and early phase force outputs further reinforced the trend that rapid force measures exhibit greater absolute error compared to maximal strength assessments. 53
In contrast, the absence of SEM data in several studies has limited the ability to fully assess the precision of their IMTP measurements. Although high ICCs and acceptable CVs have been reported, the inclusion of SEM would have provided a more comprehensive understanding of absolute measurement error, particularly for early phase force outputs, where greater variability is often observed.37,41 Similarly, the exclusion of SEM in certain studies restricted the direct comparisons of reliability across different testing protocols. 53
When SEM data were provided for strength metrics, higher values reflected the inherent variability in rapid force production. For instance, an SEM of 68.03 N for peak force and progressively higher SEMs for time-sensitive outputs like force at 200 ms (112.99 N) corresponded with moderate reliability indicators (ICC = 0.546) and higher CVs (14.70%). 51
In summary, while SEM was not universally reported across studies, the available data corroborated findings from ICCs and CVs, reinforcing the high reliability of peak force measures in IMTP testing. The inclusion of SEM in future research would enhance the assessment of absolute measurement precision, particularly for force metrics where variability tends to be higher.
Limitations
The included studies on the reliability of the IMTP present several methodological and reporting limitations that may affect the interpretation and generalizability of their findings. A consistent issue across multiple studies is the small sample size, which reduces statistical power and limits the applicability to broader athletic populations.57–60 Prior research highlights the importance of optimizing the sample size and design to balance cost, efficiency, and statistical precision in reliability studies.61,62 For example, studies included only 13 and 17 participants, respectively, making it difficult to generalize the findings beyond these cohorts.37,41 Gender bias is also prevalent, with several studies focusing exclusively on male athletes or female athletes, restricting the extrapolation of results to mixed or opposite-gender groups.37,38,41,48 Additionally, the lack of diverse athletic populations and sports-specific contexts limits the broader application of IMTP results.
Inconsistencies in the reporting of reliability metrics such as ICCs, CVs, and SEMs are evident across studies. While most studies have reported ICCs, the precision of these estimates varied considerably. ICCs are widely used to assess test-retest reliability, but their interpretation depends on sample variability, methodological consistency, and statistical assumptions.28,29,63,64 For instance, moderate ICCs for peak force and relative peak force were reported without SEM data, limiting insights into the measurement error and absolute reliability. 38 Furthermore, ICC values should be interpreted alongside confidence intervals to ensure their robustness, as ICCs alone do not account for systematic bias or heteroscedasticity. 64 High CVs for early phase force outputs, such as the force at 50 ms (21.7%) and 100 ms (23.3%), indicate substantial variability in strength measurements. 48 This undermines the sensitivity of the IMTP in detecting subtle performance changes, particularly in adolescent populations where neuromuscular control is still developing.
Previous systematic reviews have primarily focused on the peak force as the primary outcome. While peak force is a critical measure of maximal strength, this narrow focus overlooks other essential biomechanical variables, such as RFD, force at specific time intervals (e.g., 50 ms, 100 ms), and time to peak force, which are key indicators of strength and neuromuscular performance. 8 In contrast, a broader evaluation of biomechanical variables beyond peak force highlights additional limitations in IMTP research, particularly the inconsistent reporting and lower reliability of time-sensitive force measures compared peak force, suggesting that methodological refinements are needed when assessing strength. 18
Methodological variability further complicates the cross-study comparisons. Differences in familiarization protocols, warm-up procedures, and sampling rates (ranging from 100 Hz to 1000 Hz) can influence the reliability of IMTP measures. 65 For example, a sampling rate of 500 Hz may be insufficient to accurately capture rapid force fluctuations. 38 Discrepancies in hip and knee angles, ranging from self-selected to fixed positions, introduce biomechanical variability that affects the force outputs. The need for standardized protocols in joint positioning and testing procedures to ensure consistency across studies has been emphasized. 18 Additionally, the lack of long-term reliability data limits the understanding of IMTP's utility in monitoring performance over time, while few studies address external factors, such as environmental conditions or psychological influences, which can significantly affect test-retest reliability, particularly in younger athletes. Collectively, these limitations underscore the need for standardized methodologies, diverse participant samples, and comprehensive reporting of biomechanical variables to enhance the robustness and applicability of IMTP research.
Conclusions
The IMTP shows good-to-excellent test-retest reliability in youth athletes, with peak force displaying high consistency (ICCs ≥ 0.90) and low variability. However, early phase force measures (e.g., force at 50 ms and 100 ms) exhibit greater variability and are influenced by neuromuscular factors and testing protocols. Methodological differences include familiarization, warm-up routines, sampling rates, and impact reliability, particularly for strength measures. Overall, the IMTP remains a reliable tool for assessing absolute and relative peak forces in youth athletes, with minimal systematic changes between repeated measures, making it suitable for monitoring strength development.
Footnotes
Acknowledgment
The authors would like to thank the research institutions and databases used for the extraction of the analyzed studies. We also express our gratitude to all researchers who contributed to this systematic review.
Author contribution
All the authors contributed significantly to the conception and development of this study. João Bruno and Hugo Sarmento designed the study and the methodology. Raynier Montoro-Bombú and Rohit Kumar Thapa were responsible for literature review and data analysis. All the authors participated in the writing and critical revision of the manuscript and contributed equally to its final approval.
Data availability
The data used in this systematic review were obtained from articles published in scientific databases, as described in the Methods section. The extracted and analyzed datasets are available upon request from the corresponding author.
Declaration of conflicting interests
The authors declared no potential conflicts of interest with respect to the research, authorship, and/or publication of this article.
Funding
The authors received no financial support for the research, authorship, and/or publication of this article.
Protocol registration
The study protocol was registered in the International Prospective Register of Systematic Reviews (PROPERO) under ID number CRD42025637205.