
Abstract
The present study aimed to investigate the changes in the physical profile of the England women's cricket team over a 13-year period. Physical profiles of 45 female players were retrospectively analysed from 2010 to 2022. Mixed linear modelling was employed to examine changes in various physical parameters including 10 m and 20 m sprints, countermovement jump (CMJ) height, aerobic fitness (measured through the Yo-Yo intermittent recovery test level 1, Yo-Yo-IR1), and push and pull strength endurance across time. There was a significant increase in Yo-Yo IR1 performance over time (P < 0.001), with the distance covered improving from 1077 metres in 2011 to 1666 metres in 2014. Both 10 m (P < 0.001) and 20 m (P < 0.001) sprint times significantly improved up to 2014. Furthermore, there were significant increases in push (P < 0.001) and pull (P < 0.001) strength endurance across time. However, no significant changes were observed in run-2 performance. Although there were significant changes (P < 0.001) in CMJ height across time, no clear trends were evident for year-to-year changes. Overall, the study demonstrated a significant physical evolution of the England Women's Cricket Team over 13 years, characterised by high aerobic fitness and upper body strength endurance. Future physical development should therefore focus on developing speed and change of direction qualities.
Introduction
Female and male international cricketers compete in three different formats: Twenty20, One-Day, and Multiday (Test matches). In comparison to men, women participate in a greater number of Twenty20 and One-Day matches relative to Test matches. The physical demands and profiles of professional male cricketers have been extensively studied,1,2 while there is a scarcity of information regarding the demands on female cricketers. Female players cover an average of 5250 m during international cricket matches, a distance greater than that observed at lower levels of competition. 3 In a simulated “The Hundred” batting protocol, research has indicated that the physiological responses of female batters may be at higher relative intensities than their male counterparts due to physiological differences. 4
Describing the physical profile of female athletes across different sports is a crucial tool in talent identification. Presenting only a discrete point in time is limited, given the possibility of fluctuations in physical profiles from year-to-year. Presenting profiles across several years allows for a more accurate picture and provides governing bodies and teams with the information to predict or target specific physical developments. This is particularly important in female team sports, where there has been an increase in investment and participation in recent years.5,6 For example, in 2022, the England and Wales Cricket Board increased funding for the regional game by £3.5 million. The increase in investment may be one explanation for the increase in demands and improvement in physical attributes that have been shown within international female rugby players. Woodhouse et al. 7 demonstrated that over a 5-year period, international women rugby players had an increase in strength, power, and running acceleration. Conversely, no change in aerobic fitness has been reported in female competitive soccer players across an 18-year period, 8 suggesting that improvements are not guaranteed, despite the increase in investment. One study 9 investigated changes in physical qualities across ages in elite cricketers, finding that strength and speed generally improved with age in both male and female Australian pace bowlers. While valuable, this study focused on pace bowlers as they aged and across different phases of the season, offering limited insight into the broader evolution of physical characteristics in female cricketers. Only in recent years have there been any studies that have presented normative data on the physical profile of high-level female cricketers.10,11 These studies generally conclude that faster pace bowlers generally possess greater lower-body strength and power. Playing standard and position also influence physical profiles in female cricketers, with professionals showing better aerobic fitness and speed qualities. 11
Previously, we investigated the evolution of physical capacity in male international cricketers. 12 Our findings indicated an increase in aerobic fitness with no change in 20 m sprint times across a 7-year period. With the increase in funding for women's cricket, 5 it is hypothesised that this will have a positive impact on the physical profile of female cricketers. Therefore, the aim of this current study is to retrospectively investigate the changes in physical profiles of the England Women's Cricket team over a 13-year period, from 2010 to 2022.
Methods
The retrospective analysis consisted of 45 senior England International Women cricketers. Physical profile data was retrospectively analysed from 2010 to 2022. There was no minimum number of caps required to participate in the study. Players who took part in the routine senior women's physical profile testing were included in the dataset. Ethical approval was sought retrospectively from the institutional ethics committee.
Physical preparation overview 2010–2022
During this period, the emphasis was placed on enhancing players’ capacity for consistent performance in training and matches. Training regimens incorporated speed drills, but there was a strategic prioritisation of high-intensity running and strength development. This approach aimed to elevate the players’ chronic workloads during matches, optimising their physical preparedness and resilience in competitive scenarios.
Procedures
Over a period of 13 years, spanning from 2010 to 2022, several physical tests were administered on the England Women's Cricket Team, indoors at the National Cricket Performance Centre (Loughborough, UK). The battery of tests included 10 m and 20 m sprints, run-2, countermovement jump (CMJ), aerobic fitness measured using the Yo-Yo Intermittent Recovery Test Level 1 (Yo-Yo-IR1), as well as push and pull strength endurance. However, due to scheduling conflicts, fixtures, and changes in preference with physical tests over time, not all tests were performed every year. Verbal encouragement was provided to all participants throughout all tests, and any modifications to the test procedures are detailed in the specific test methods below. Furthermore, some players underwent assessment multiple times within a single year, and in line with our prior research, 12 if this occurred, the results were averaged across the year to produce a single result for analysis. Prior to the tests, a standard warm-up was conducted by the National Strength and Conditioning Lead for the England Women's Cricket Team.
Sprints
Three 20 m maximal sprints were conducted with a 5-min rest period interval observed between each sprint. Timed 20 m maximal sprints have previously been shown to possess excellent test-retest reliability (intraclass correlation coefficient (ICC) = 0.90; coefficient of variation (CV%) = 1.5%) in elite female handball players. 13 Sprints were timed using dual beam timing lights (Brower TC, Brower Timing System, Utah, USA), which were positioned at 0 m, 10 m, and 20 m to capture 10 m and 20 m splits. All timing lights were placed on tripods, with the first gate positioned 1 m above the ground and the remaining gates set at 1.3 m. The cricketers assumed a two-point split stance position, 1 m behind the first set of timing gates. However, following the 2016 data collection, this distance was reduced to 0.5 m. The fastest time was recorded and used for further analysis.
Run-2
To simulate running between the wickets in a real match, a run-2 test was conducted. The run-2 test has been shown to have excellent test-retest reliability (ICC = 0.99; standard error measurement = 0.048 s). 14 The cricketers were timed while running between two lines positioned 17.68 m apart (the distance between the two creases). Dual beam timing gates (Brower TC, Brower Timing System, Utah, USA) were placed at the start line/crease at a height of 0.6 m. The test was performed with a cricket bat and the cricketers were instructed to perform the turn off both their right and left sides. They wore batting pads but not a helmet during the test. The cricketers began in a two-point split stance position, standing 0.5 m behind the timing gates with the cricket bat in their hand. They were required to slide the bat over the crease mark at the turn and start/finish as they would do in a competitive match. Cricketers performed two trials off each their right and left side, and the best trial from each side was used to calculate the average run-2.
Counter movement jumps
The CMJ was performed in a strictly vertical direction on a jump mat, which measured flight time (KMS, Fitness Technology, Australia). The CMJ test have previously been shown to possess good test-retest reliability (ICC = 0.85; CV% = 8.1%) in elite female handball players(13). Cricketers were instructed to place their hands on their hips and jump as high as possible from a stationary standing position, using their normal technique. No restrictions were placed on the depth or strategy of the counter-movement. Each cricketer performed three jumps, with a 1-min rest period between each jump. The highest jump was recorded and used for analysis.
Yo-Yo intermittent recovery test level-1
Yo-Yo-IR1 15 was used to assess aerobic fitness, having previously been shown to have excellent test-retest reliability regardless of population (ICC = >0.90; CV% < 10%). 16 The test is an incremental shuttle test (between two 20 m lines) with speed controlled through an audio beep. The test ceased when the cricketer failed to complete two individual shuttles in the required time or withdrew themselves from the test. Two lines were set 20 m apart with a cone placed 5 m back from the start-finish line. The 5 m cone was used for the cricketers to walk to during the 10 s active recovery between shuttles.
Push and pull strength endurance test
The push and pull tests utilised by the England and Wales Cricket Board have been previously described in the literature, with Scott et al. 12 reporting in-house test-retest reliability for international male cricket players, demonstrating CV% of 7.6% and 5.7% for the push and pull variants, respectively. The push strength endurance test consists of the cricketer lying face down with their hands by their sides. Using a metronome, the cricketers performed continuous maximum press-ups while maintaining a tempo of 1 Hz for both the concentric and eccentric phases of the movement. Cricketers extended their elbows fully at the top of the press-up before lowering their chest to the floor at the bottom. The test was stopped if the cricketer failed to reach the bottom part of the press-up, did not fully extend their elbows, lost trunk position, or could not keep time with the metronome. This was determined by the team's strength and conditioning coach.
The pull strength endurance test consisted of the cricketer lying on their back underneath a loaded Olympic bar in a rack. The bar was set at a height where the cricketer can reach it with their shoulders flexed to 90 degrees and elbows fully extended. The cricketer grasped the bar and extended their hips so that their pelvis and lower back were off the ground. One tester observed the upper body and arm position, while another observer watched the lower back and trunk position. The cricketer then performed a maximum number of repetitions for supine rows while keeping time with a metronome set at 1 Hz for both the concentric and eccentric phases of the movement. For repetitions to count, players needed to touch the bar with their chest at the top of the row and fully extend their elbows at the bottom of the movement. If players failed to keep time (1 Hz), perform the movement to a full range of motion, or were unable to maintain the required posture, then the test was stopped.
Statistical analyses
Mixed linear modelling (MLM) was employed to examine variations in the dependent variables over time (represented as the fixed factor), with individual cricketers considered as random factors in the model. In case of a significant fixed factor across time (years), Bonferroni adjusted pairwise comparisons were used to determine the differences between seasons. Due to a change in testing procedures in sprint times, separate analysis was performed for 2010 to 2014 and 2016 to 2022. The results are presented as estimated marginal means ± standard deviation. All data was analysed using SPSS (version 27.0, Chicago, Illinois, USA) with significance set at 0.05.
Results
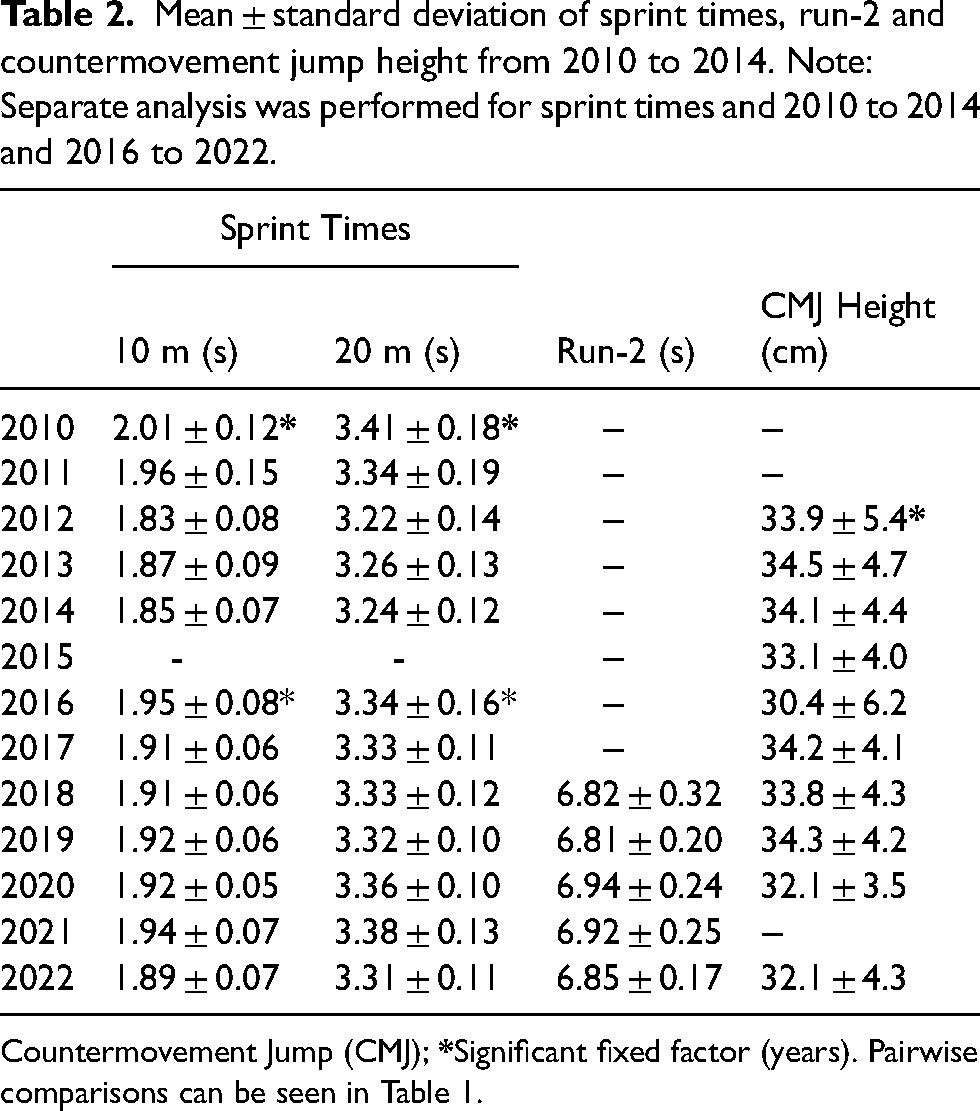
Table 1 presents pairwise comparisons between years for all dependent variables, following a significant (P < 0.05) fixed effect. There was a significant increase in Yo-Yo-IR1 distance across time (F(10) = 15.0; P < 0.001; Figure 1, Panel A). The number of push ups (F(8) = 7.8; P < 0.001; Figure 1, Panel B) and supine rows repetitions (F(8) = 11.5; P < 0.001; Figure 1, Panel C) both showed significant increases across time.
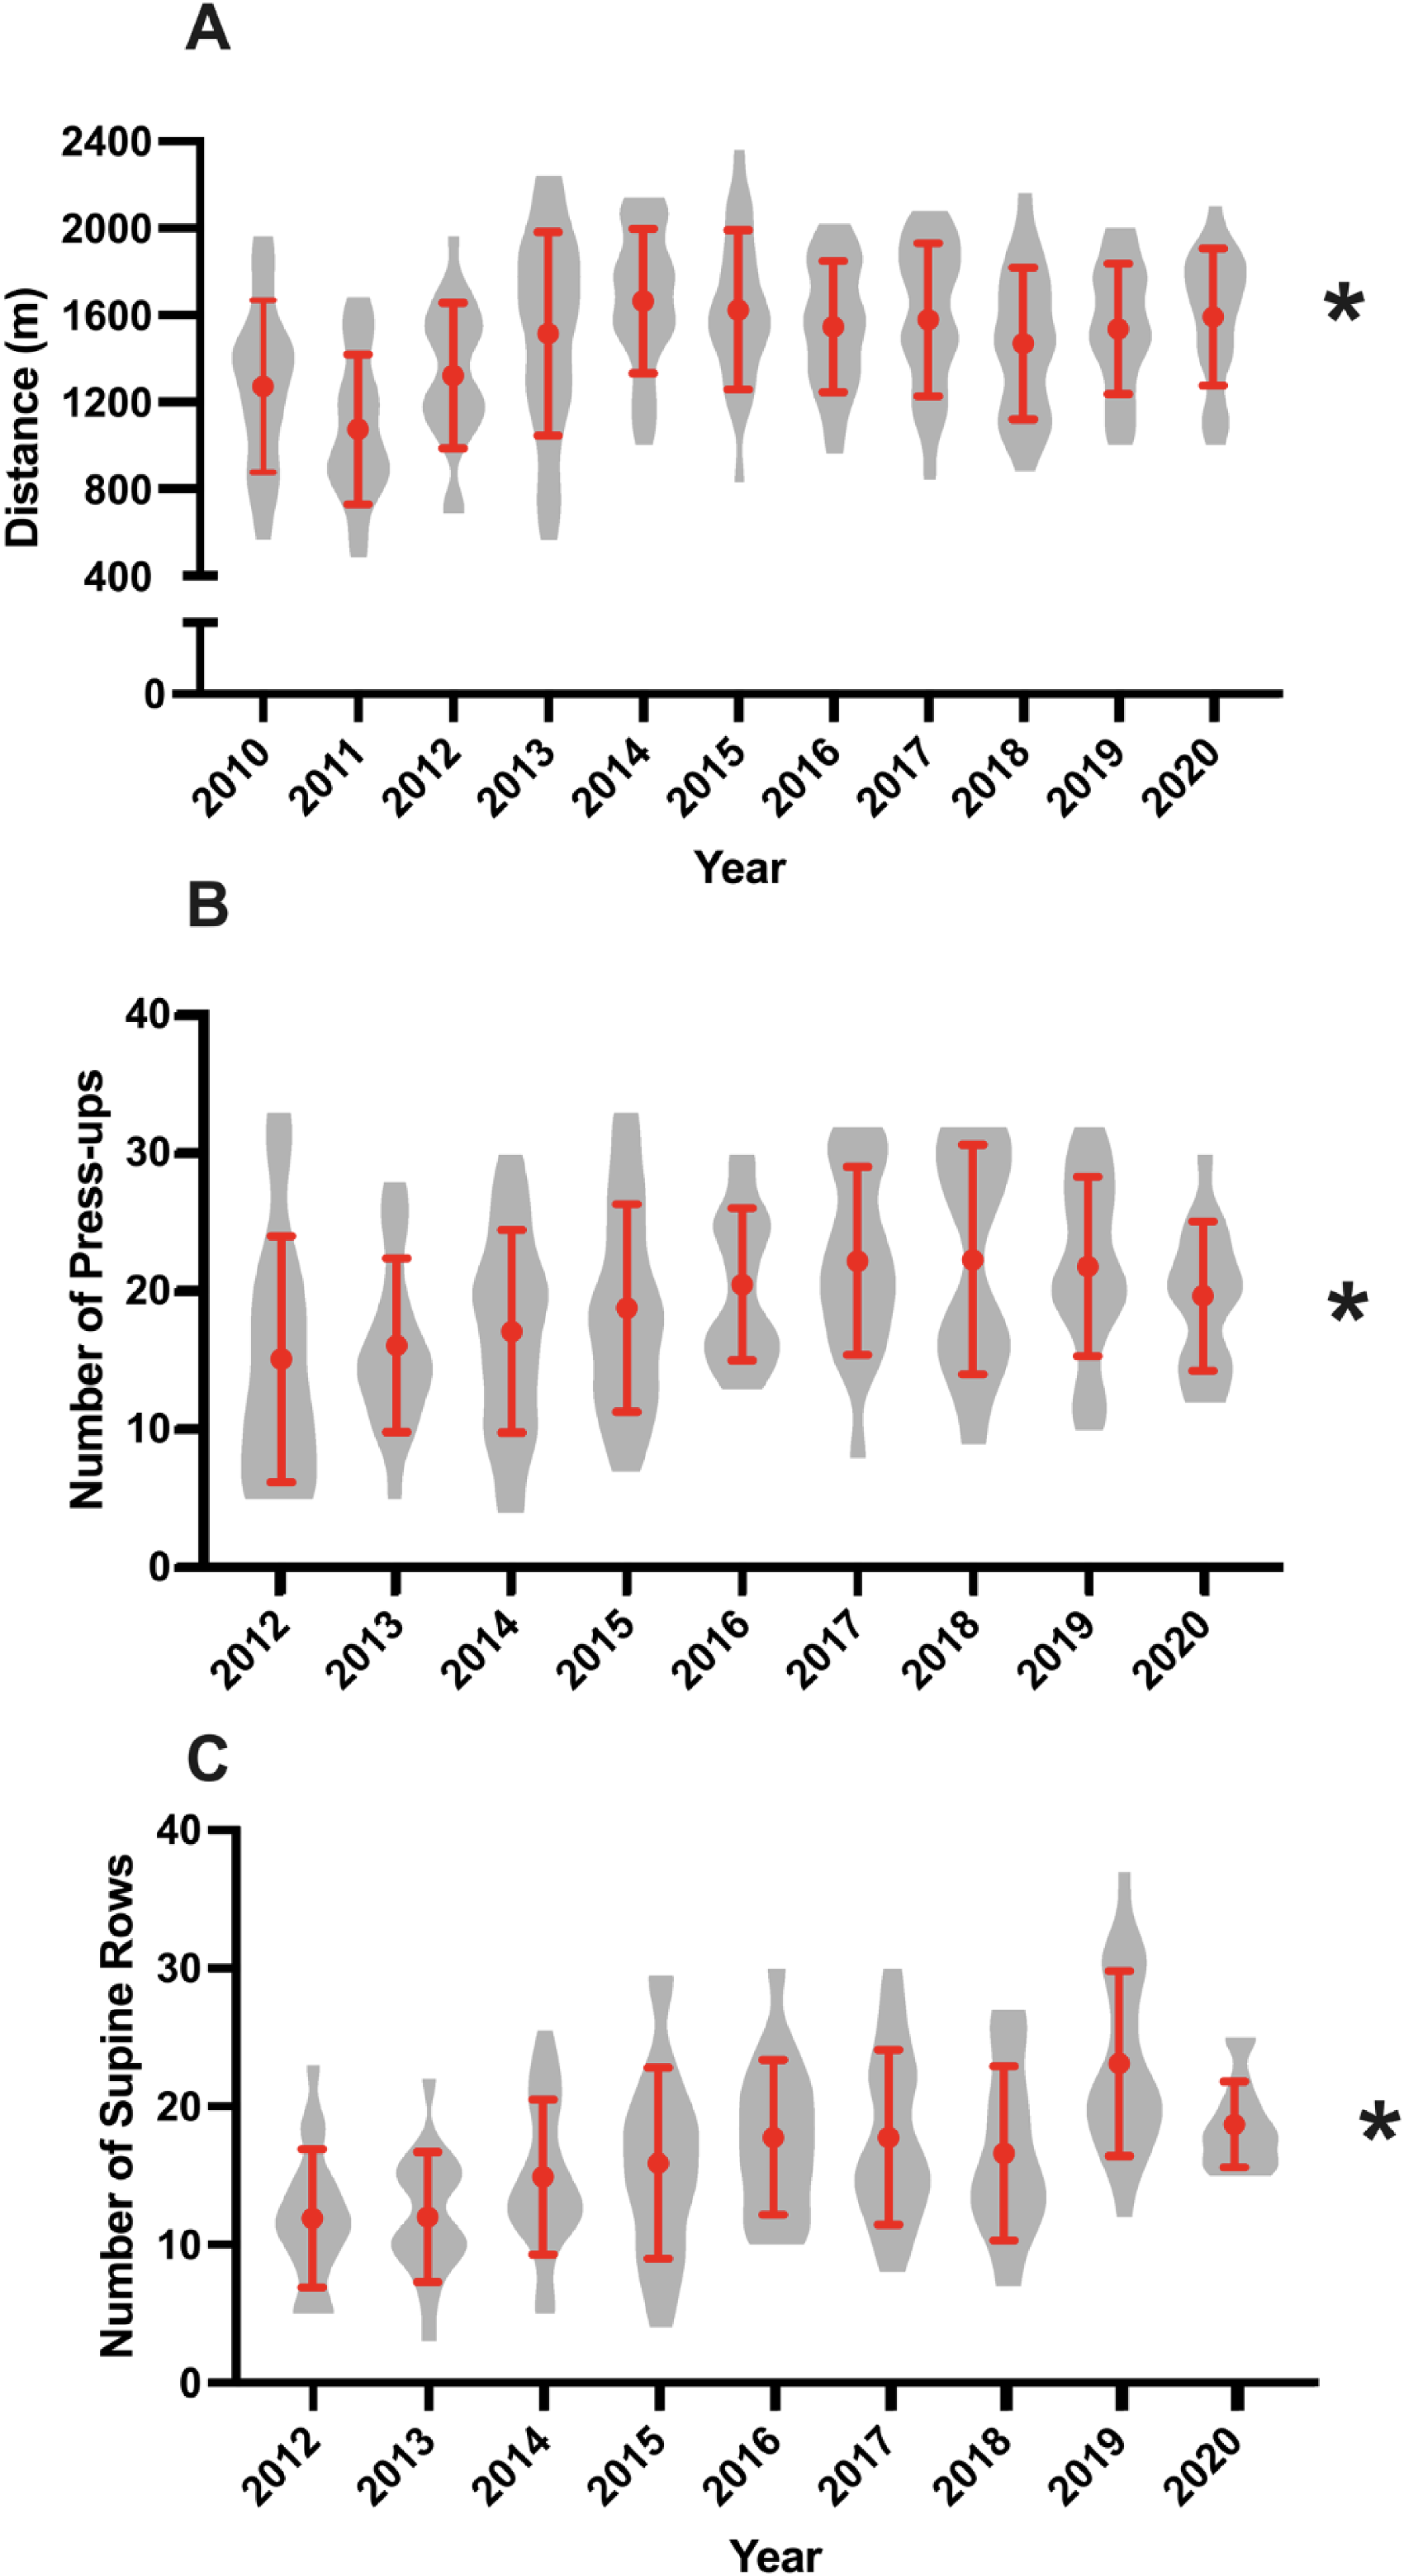
Data are presented as mean ± standard deviation, with the distribution shown using grey violin plots. Yo-Yo Intermittent Recovery Test Level-1 (A), Number of Press-ups (B), Number of Supine Rows (C) across years.
Pairwise comparisons following a significant (P < 0.05) fixed effect across years. Note: Separate analysis was performed for sprint times and 2010 to 2014 and 2016 to 2022.
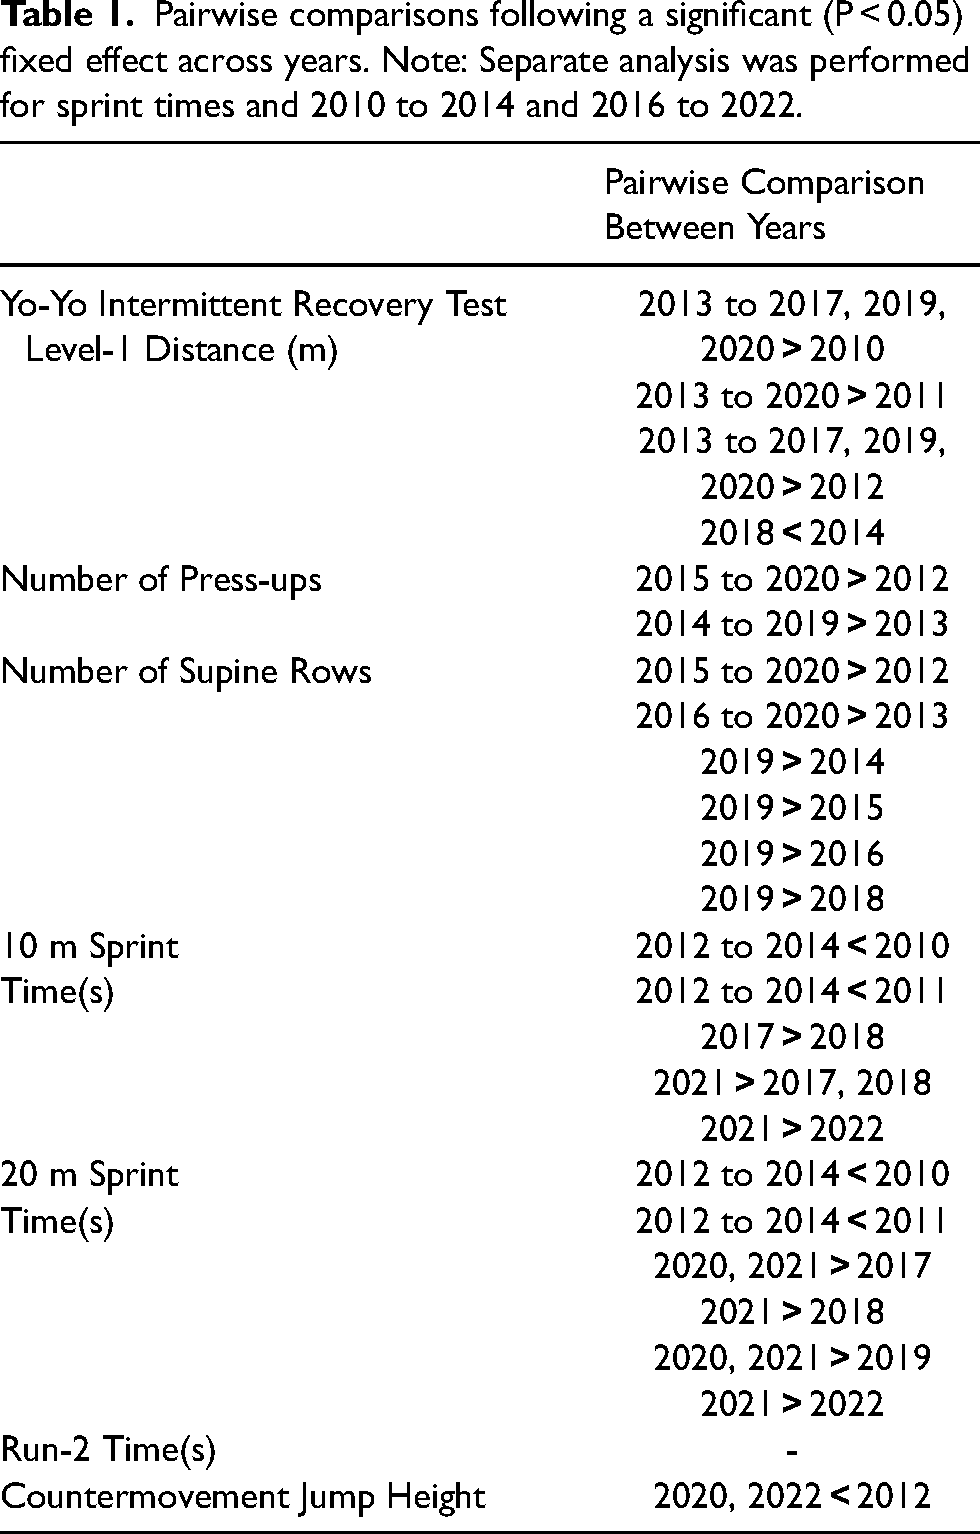
Table 2 shows 10 m, 20 m, run-2 and CMJ height from 2010 to 2022 with pairwise comparisons presented in Table 1. From 2010 to 2014 there was a significant improvement in 10 m (F(4) = 20.1; P < 0.001) and 20 m (F(4) = 18.0; P < 0.001) performance. Significant changes were also found from 2016 to 2022 for 10 m (F(6) = 4.9; P < 0.001) an 20 m (F(6) = 6.3; P < 0.001) sprint times. No significant (P = 0.07) change across years was found for run-2 time. Finally, there was also a significant change in CMJ height across years (F(9) = 10.7; P < 0.001).
Mean ± standard deviation of sprint times, run-2 and countermovement jump height from 2010 to 2014. Note: Separate analysis was performed for sprint times and 2010 to 2014 and 2016 to 2022.
Countermovement Jump (CMJ);
Discussion
The aim of this study was to explore the evolution of physical performance profiles in the England Women's Cricket team from 2010–2022. Overall, there was an increase in Yo-Yo-IR1 distance, and an increase in strength endurance across the years. Sprint times (10 m and 20 m) decreased from 2010 to 2014 and then fluctuated until 2022. The data demonstrates a notable shift in the physical characteristics of international female cricketers.
The Yo-Yo-IRI distance reached a plateau of approximately 1600 m, which is higher than previously reported values in domestic cricket 17 as well as reported values (1051 m) in female soccer. 18 The Yo-Yo-IRI distance (∼1600 m) found in the current study is also higher than the minimal standards reported (1440 m) for an international men's team in the media. 19 The 23% increase in Yo-Yo-IRI distance from 2010 to a peak in 2014 represents a substantial change in aerobic fitness in this group of international cricketers. The increase in Yo-Yo-IRI distance is likely due to the transition of the England Women's Cricket Team to full-time professional status in 2014. This shift allowed the players to focus entirely on cricket, providing more time to develop their aerobic fitness without the constraints of balancing other jobs. Previous data is limited on longitudinal changes in aerobic fitness within elite female athletes. Haugen et al. 8 showed no change in aerobic fitness across 18 years in elite female soccer. Similarly, Woodhouse et al. 7 found no change in aerobic running fitness in elite international rugby players across a 5-year period. Therefore, the 23% increase observed in our study seems to be on the higher side, although this finding is based on a very small sample of studies.
There was a significant increase in upper-body strength endurance across years. This improvement is true for both the number of push-ups and supine rows performed. The improvement is upper-body strength endurance follows a similar trend to that previously seen within England Men's Cricket Team, 12 and may represent a wider England Cricket focus on developing upper-body strength performance. Nonetheless, the presented data set provides the first insights into international female cricketers upper-body strength capacities with the potential to inform practitioners regarding benchmarks for this elite population. One cricket study examined changes in physical qualities over time 9 and found that strength and speed generally improved with age in both male and female Australian pace bowlers. While this study provides valuable insights, its comparison between age groups limits its relevance for understanding the broader evolution of physical characteristics in female cricketers.
Sprint times improved until 2014 and then appeared to fluctuate until 2022. The improvement in sprint times up to 2014 was largely also accompanied by an increase in aerobic fitness. In simulated cricket matches, researchers have demonstrated it as a significant aerobic component. 4 An aerobic endurance stimulus more than 30 min per day has been shown to reduce explosive power in concurrent training paradigms. 20 With the frequent scheduling of multiple matches per week in cricket, the repeated aerobic endurance demands may have hindered the development of explosive power and speed adaptations. The parallel increase in sprint performance and aerobic fitness is a substantial achievement within international sport given the largely contradictory physiological mechanisms associated with both. The lack of improvements post-2014 or even decrease in sprint performance is equivalent to what we have reported in men's international cricketers. It is likely that, in addition to the endurance demands of competing in cricket, the COVID-19 pandemic may have had a negative impact on developing the physical qualities of athletes. During large parts of the 2020 to 2022, athletes within the study were only exposed to home training, which would have limited their physical development. These restrictions and demands of cricket matches may also explain the lack of changes in run-2 times and lower CMJ height in 2020 and 2022 compared to 2012. We also present, for the first time, normative sprint times for international female cricketers. The sprint times in this study appear quicker than what is previously reported in sub-elite cricketers in recent years 21 and similar to male grade cricketers in Australia. 22
It should be acknowledged that this is a unique longitudinal data set in an international cricket team. However, there are limitations that are associated with this data. There was a change in the sprinting protocol in 2016, consequently comparisons between later and early years were not possible. As previously described, the data set are from a single international team, and therefore reflect the training structures and philosophies within this international team.
Conclusions
There has been a substantial evolution in the physical profile of the England Women's cricket team from 2010 to 2022. Improvements in aerobic fitness were reported through an increase Yo-Yo-IR1 distance (∼23%) across the years which were largely accompanied with an increase in strength endurance. Speed (10 m an 20 m) improved up to 2014 but no changes were seen in run-2 times across the years.
Footnotes
Declaration of conflicting interests
The authors declared no potential conflicts of interest with respect to the research, authorship, and/or publication of this article.
Funding
The authors received no financial support for the research, authorship, and/or publication of this article.