
Abstract
This study aimed to quantify the cardiovascular demands of the two predominant techniques within international Olympic windsurf competition. Three male (23 ± 3 y, 73.0 ± 1.4 kg, 181.3 ± 5.3 cm) and 3 female (26 ± 9, 60.1 ± 1.7 kg, 169.8 ± 3.2 cm) elite windsurfers competing at two international regattas were recruited. Windsurfers wore a heart rate (HR) monitor, whilst global positioning system data was gathered from an online website (SAP® Analytics). Races were categorised as either pumping or planing. Both average (88 ± 3 vs. 83 ± 4%) and peak (95 ± 2 vs. 91 ± 4%) HR was higher (P < 0.001) in pumping. Furthermore, the time spent in zone 5 was greater (44 ± 27 vs. 9 ± 11%, P < 0.001) in pumping. Furthermore, planing covered more distance (+ 4875 m, P < 0.001) at greater speeds (+ 9.3 knots, P < 0.001). Whilst pumping resulted in longer race times (+ 07:56 mm:ss, P < 0.001). These findings support the optimisation of training prescription and development of performance testing for Olympic windsurfers. Furthermore, the study design has demonstrated a practical approach to understanding the cardiovascular demands across different Olympic sailing classes.
Introduction
Gaining a detailed knowledge of the internal (heart rate [HR]) and external (global positioning system [GPS]) workload estimates from sporting competition is crucial for understanding the physical demands within both endurance and team based sports, enabling coaches and sport scientists to improve the effectiveness of specific acute and chronic interventions. 1 GPS data in combination with HR has previously been used extensively to gain understanding of the physical demands within team sports2–4 and more recently, a domestic Laser sailing regatta. 5
Generally, data are collected via commercially available GPS devices that are synchronised with a HR monitor. However, within Olympic windsurfing there is a dearth of literature available on the physical demands from international competition. This is due to several key factors; nations withholding data to maintain a competitive advantage, the variability in the performance environment and the racing rules, whereby personal GPS devices are often prohibited from competition.
Environmental conditions (i.e., wind speed and sea state) dictate the physical demands of Olympic Sailing and can have a profound influence on the race outcome.6, 7 Specifically within the Olympic windsurfing class, pumping is particularly effective in light and moderate wind conditions 8 and entails high metabolic and cardiorespiratory requirements.9–11 Pumping is defined as a manoeuvre in which a windsurfer voluntarily pulls the sail rhythmically so that it acts as a wing, which in turn provides the board with additional propulsion. 11 As such, this places a huge emphasis on windsurfers possessing the necessary physical capabilities to meet the demands required for pumping to succeed in competition.
Studies have demonstrated the increased cardiorespiratory requirements associated with pumping compared with the other main windsurfing technique of planing, particularly when windsurfing upwind.9–11 However, actual Neil Pryde RS:X (RS:X) windsurfing international racing data have not been reported with existing data predominately from simulations conducted on-water.9–11 Neil Pryde RS:X was chosen as the Olympic class equipment to represent windsurfing at the Olympic Games between 2008 and 2020. There are also likely to be noticeable differences between a race and simulated environments, which might alter the physical demands of a technical skill like pumping. Mainly, race tactics and strategy and the action of a competitor will require a windsurfer to adapt their technique during a race.10, 12, 13
There has been an advancement of GPS data available from sailing competition through an online platform (SAP® Analytics) which provides GPS data from sailing competition. Furthermore, internal memory of HR monitor belts in commercially available models has resulted in the collection of data without the requirement of a watch or additional GPS unit. This provides an opportunity to combine and collect both HR and GPS data through retrospective synchronisation to gain insight into the physical demands of sailing international competition, and specifically within an Olympic class with such high physiological requirements.
Therefore, the aim of this study was to describe the heart rate responses and, with the aid of GPS-derived parameters elucidate the physical demands of Olympic windsurfing during international competitions, specifically comparing the two predominant techniques of pumping and planing. It was hypothesised that during Olympic windsurfing (RS:X) international competition, pumping races would elicit a greater heart rate response when compared to planing races.
Materials & methods
Subjects
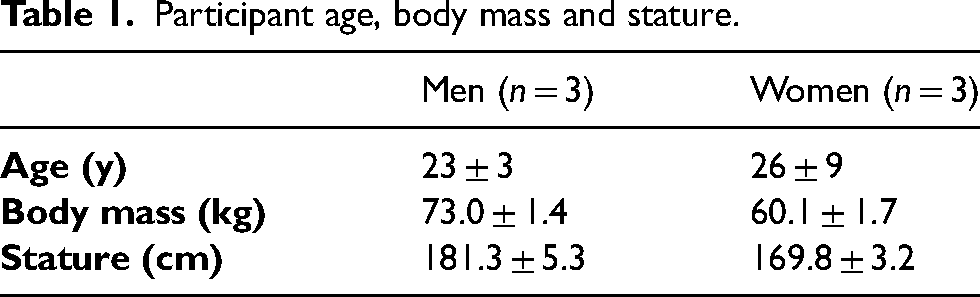
Six elite (World Sailing ranking within top 50) windsurfers (Table 1) provided written informed consent and were deemed healthy by the team doctor and a physical activity readiness questionnaire. Ethical approval was granted prior to the start of all procedures by the Northumbria University Faculty of Research Ethics Committee, in accordance with the Declaration of Helsinki.
Participant age, body mass and stature.
Study design
Two World Sailing World Cup regattas during the 2018–2019 season were identified (Enoshima & Marseille – 2020 and 2024 Olympic venues) where both HR and GPS data (via the online SAP-Sailing® platform: https://www.sapsailing.com and provided by TracTrac, Lyngby, Denmark) would be collected. Each windsurfer was provided with a HR monitor (Polar H10, Polar, Kempele, Finland). The device had an internal memory which enables storage of a single session, in which the start/stop function was controlled through a mobile app (Polar Beat, Polar, Kempele, Finland). Each racing day was exported for an individual windsurfer as a .csv file for analysis. This device was used for several reasons; (1) compliance with World Sailing rules on the use of personal equipment (2) the windsurfers did not need to wear a watch whilst racing (3) practical data collection method which did not require a sport scientist to operate or be present and (4) starting the HR monitor through the mobile app meant that an accurate timestamp was provided prior to racing. This enabled retrospective synchronisation with the GPS platform timestamp.
A total of 56 races were collected. Twelve races were discarded for analysis for either failure of HR monitor to record (data loss), race disqualification or unavailable GPS data from the SAP platform. Therefore, a total of 44 races were analysed for both HR and GPS sampled at 1 Hz. Within each race, legs were categorised based on the windsurfer's orientation to the wind: sailing into the wind (upwind), with the wind (downwind), or across the wind (reach). Each leg was navigated between two specific waypoints, such as start buoys and a windward mark [WWM] buoy. The race and race leg GPS metrics were time (s), distance (m), average board speed (knots) and number of manoeuvres. Manoeuvres are defined as intentional changes in the board's direction. These include tacking (upwind — turning the front of the board through the wind) and gybing (downwind — turning the back of the board through the wind). From the online SAP® platform, timestamps were taken for each windsurfer at the start, mark rounding (WWM & leeward mark [LWM]) and finish. Race legs were then grouped into either upwind, downwind or reach. Race leg time were summed for each race upwind, downwind and reach. Figure 1. highlights the two racecourse layouts used at the international World Cup regattas. A python (.py file) script was created to automate the segmentation of HR data based on timestamps provided from the SAP® platform.
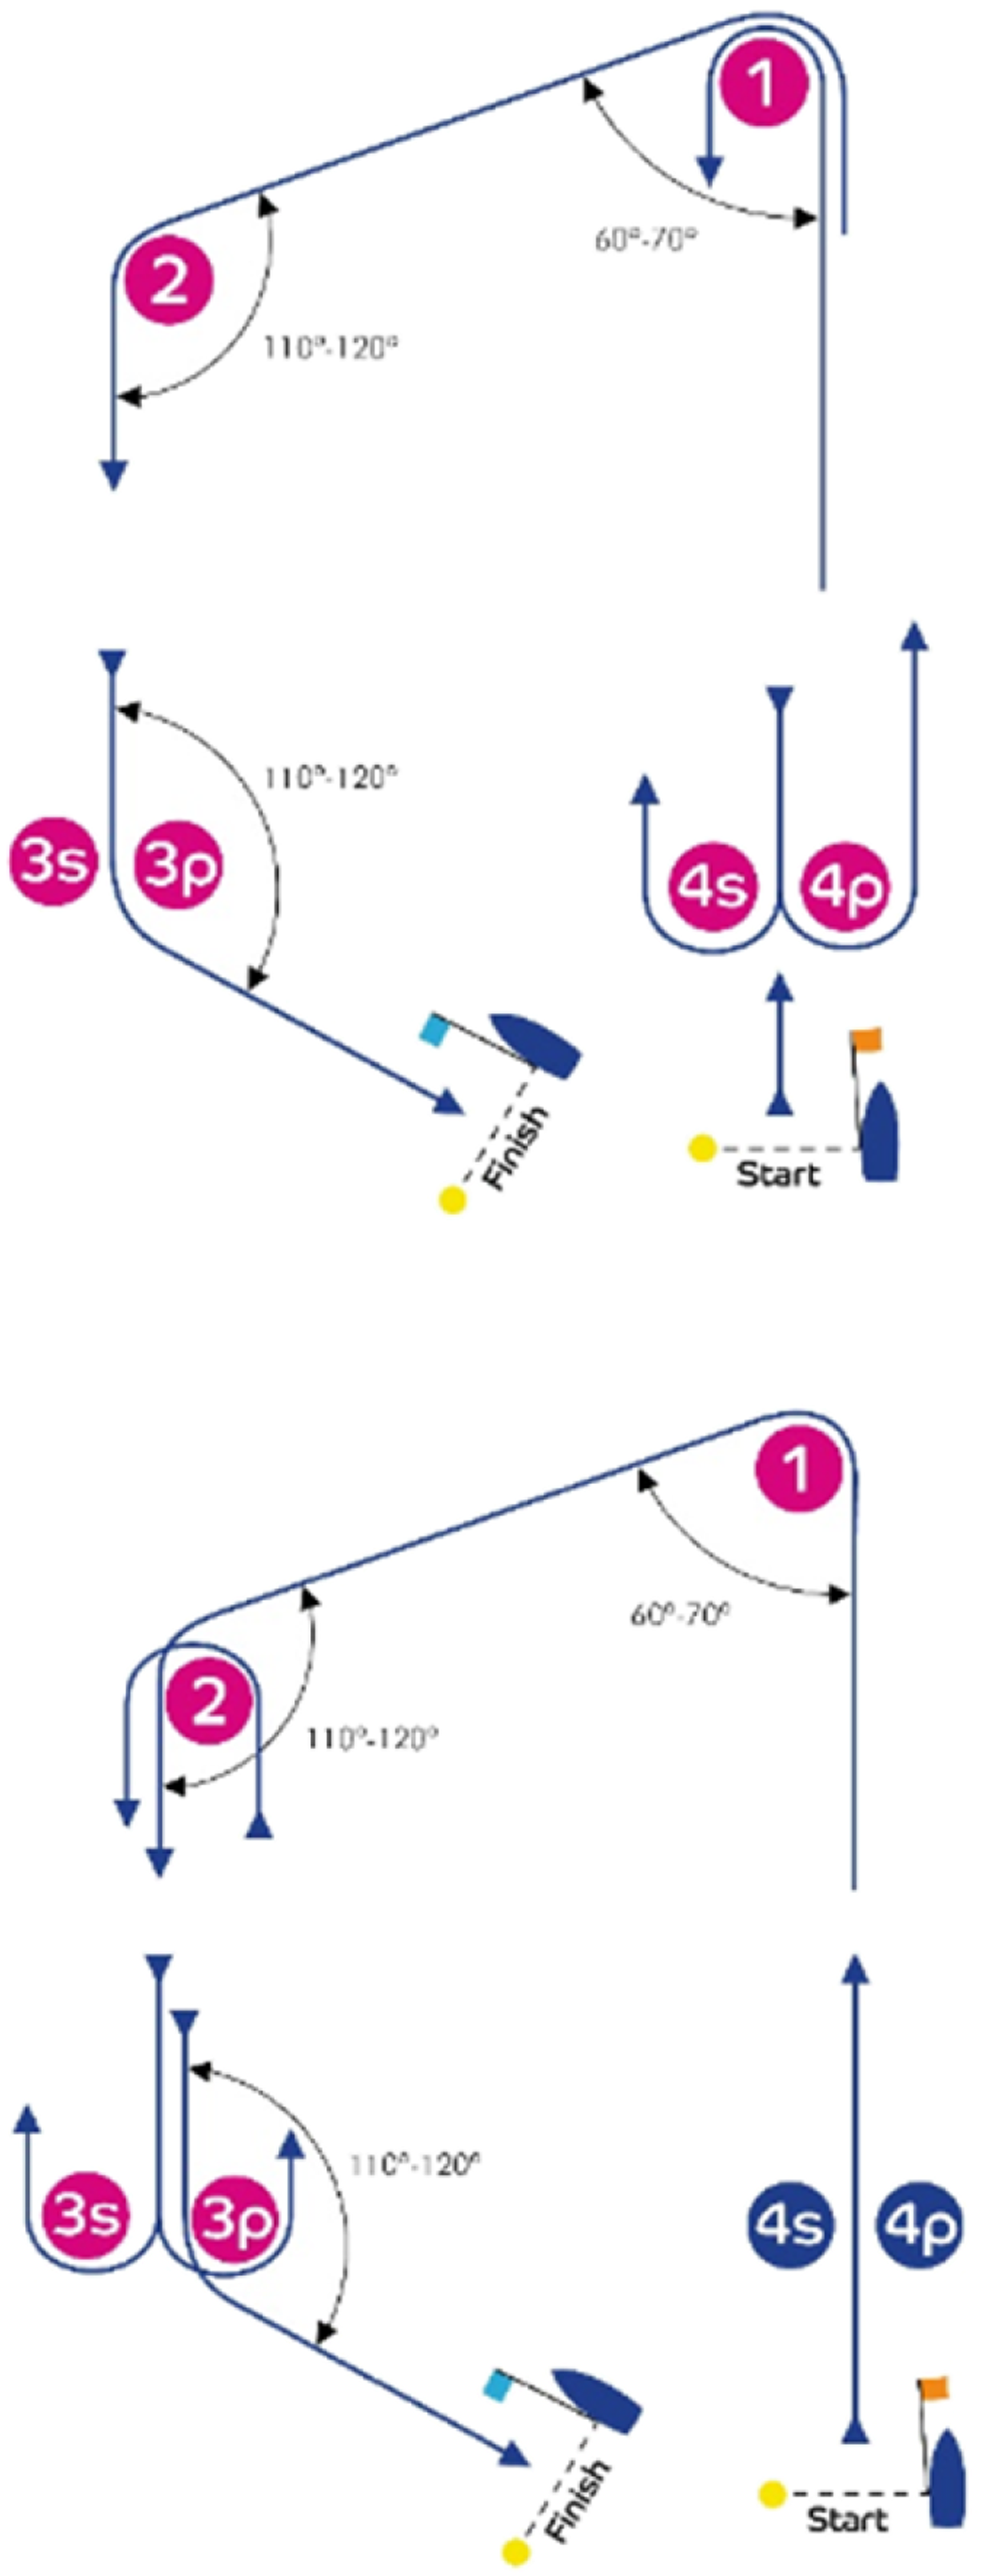
The inner (top) and outer (bottom) trapezoid sailing courses used during both regattas. Inner Course – Start, 1, 4 s/4p (gate), 1, 2, 3p (gate), Finish. Outer Course – Start, 1, 2, 3 s/3p (gate), 2, 3p (gate), Finish. Diagram from a notice of race for World Sailing World Cup regattas.
For HR analysis, a HR max (b·min−1) was defined as the highest value achieved within a three-month period prior to the competition either from an incremental ramp test to exhaustion on a cycle ergometer as part of a windsurfers testing battery or the highest value recorded in training. The reason for this approach was threefold; (1) familiarity of testing protocols, (2) HR max could be compared to historical data to provide confidence in maximum value and (3) avoided unnecessary disruptions to the windsurfers typical training schedule. Average and peak HR was defined relative to HR max. Furthermore, HR zone bands were defined based on previous work14, 15:
Zone 1 (Z1) = 51–60% HR max Zone 2 (Z2) = 61–70% HR max Zone 3 (Z3) = 71–80% HR max Zone 4 (Z4) = 81–90% HR max Zone 5 (Z5) = 91–100% HR max
Race technique categorisation
If the wind speed is above a certain threshold (∼10 knots), the RS:X board will begin to plane (board lifts partially out of the water reducing drag and allow it to ‘glide’ over the water at much higher speeds [> 11 knots]). Below this wind speed threshold, the board will not plane, and board speed is restricted to less than 8 knots. 16 As stated previously, at lighter wind speeds, pumping is utilised to effectively generate additional propulsion.
Therefore, races with average board speeds below 8 knots were categorised as using pumping as the predominant technique. Races with average board speeds exceeding 11 knots were categorised as using planing as the predominant technique.
Statistical analysis
For overall races and race legs, the normality of the distribution for HR and GPS variables were assessed using Shapiro-Wilks tests and visually inspected using Q-Q plots. For race HR and GPS variables, the data were not normally distributed (P > 0.05) Therefore, initial natural log transformation was performed on race leg GPS characteristics and HR variables and then analysed using linear mixed model (LMM) analyses. The models analysed differences between the three race legs (upwind, downwind and reach) and between demand categories (pumping and planing). Linear mixed model analyses were selected to account for the uneven distribution of pumping and planing races as well as any missing data points. For GPS characteristics and HR variables the LMMs were constructed with the variable being analysed as the dependent variable, demand category and race legs as factors, and race number as the cluster variable. Model fit was established using the r2 conditional from the LMM. The package General Analysis for Linear Models in jamovi was used to fit the LMMs and P values were calculated using Satterwaite approximations. Bonferroni post-hoc analyses were conducted on significant differences in either the main effect (race leg) or interaction effect (race leg x demand category). All data were processed with jamovi 1.2. 17 Confidence intervals for the mean was set at 90%. 18 Data are displayed as mean ± SD unless stated otherwise. Statistical significance was set as P ≤ 0.05.
Results
Figure 2. highlights the race board speed groupings categorised as either below 8 knots or above 11 knots. Of the 44 races analysed, 16 were categorised as pumping (< 8 knots) and 28 as planing (> 11 knots). No races had an average board speed between 8 and 11 knots.
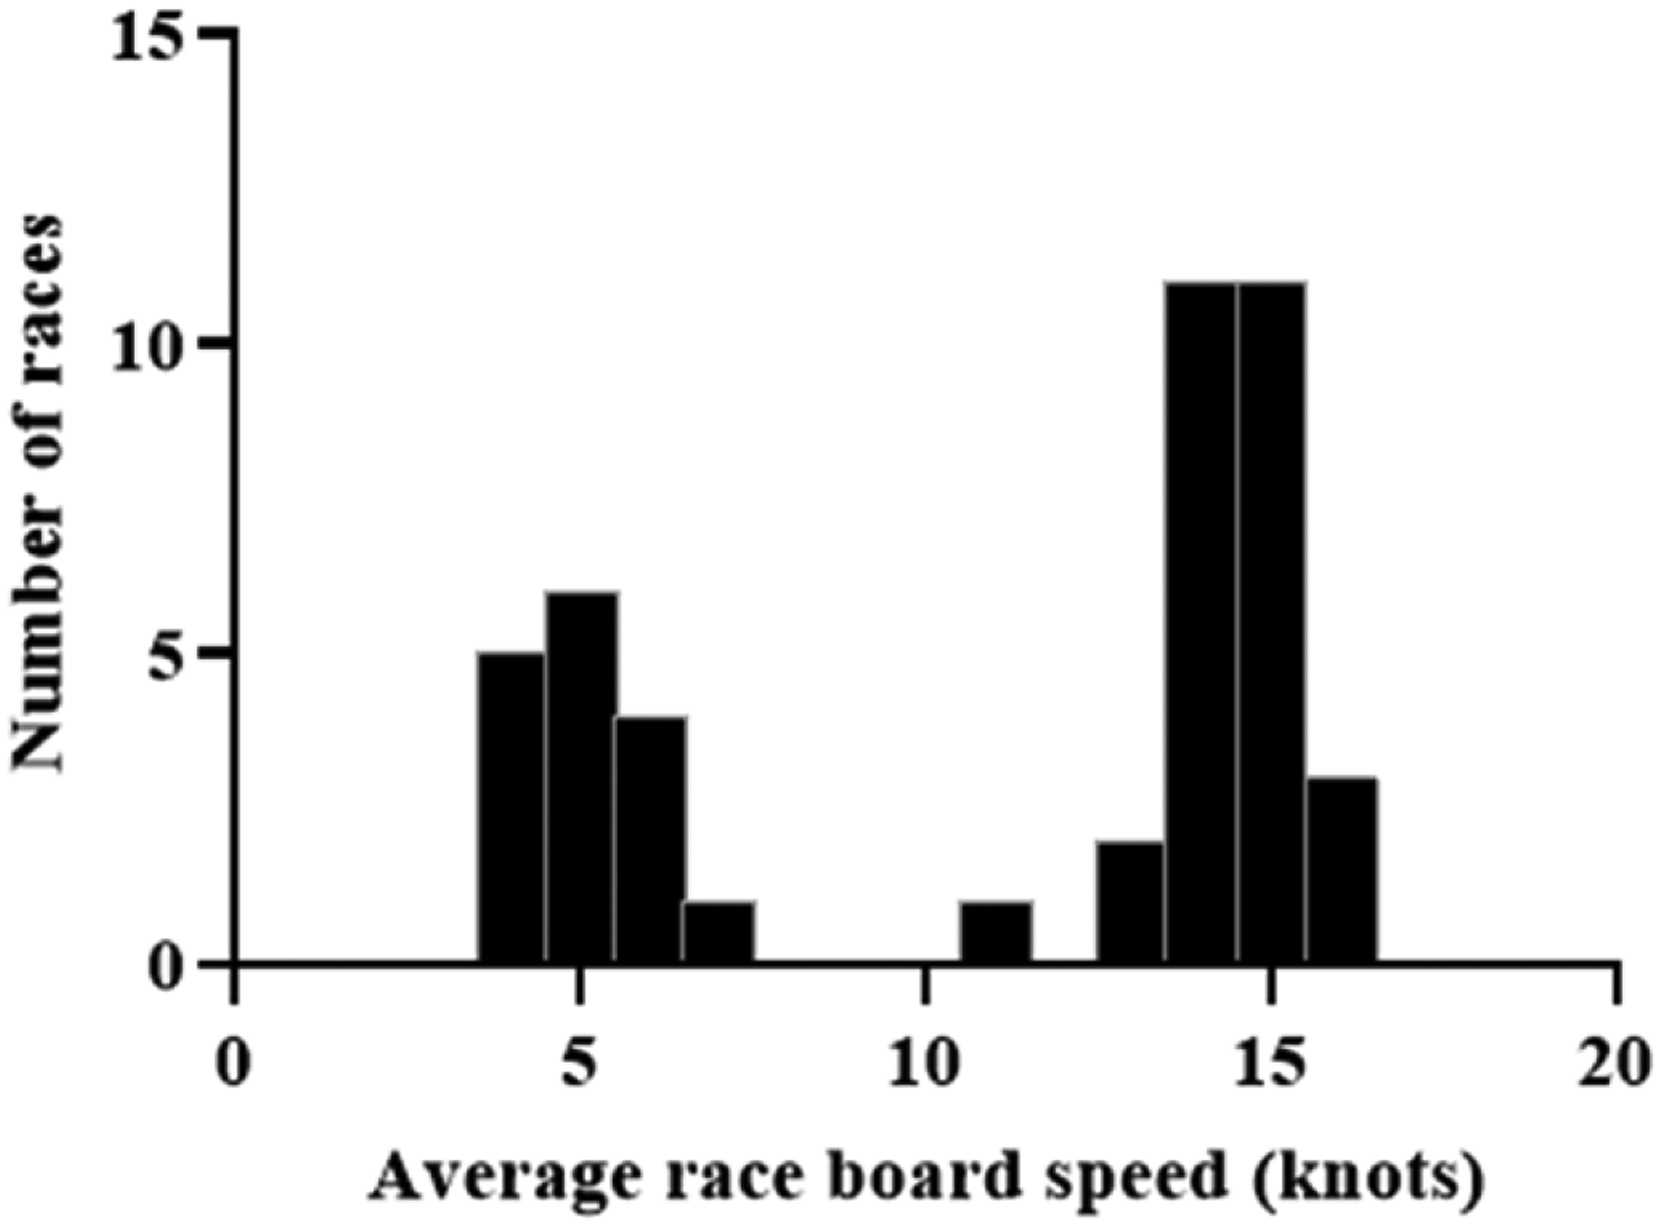
Distribution of average race board speed from the 44 races during both regattas. One knot bins were created across the 4 to 16 knot board speed range.
GPS variables
Model fit (R2), effect statistic (F), degrees of freedom and significance are presented alongside Mean and SD (unless stated) in Table 2. Pumping race times were longer than planing races. Due to the difference in race times, time spent in HR zones were made relative to total race time. There was a main effect of race leg type on time, as well as an interaction effect (demand category x race leg) for time. Post hoc analysis revealed, upwind legs were longer than both downwind (t(84) = 8.67; P < 0.001) and (t(84) = 25.50; P < 0.001) reach legs, whilst downwind legs were longer (t(84) = 16.83; P < 0.001) than reach legs.
GPS characteristics for both pumping and planing. Model fit (R2), effect statistic (F), degrees of freedom and significance are reported for interaction effect, demand category and race leg. Data presented as mean ± SD (90% CI) apart from total manoeuvres which are presented as median ± IQR (1st – 3rd quartiles).
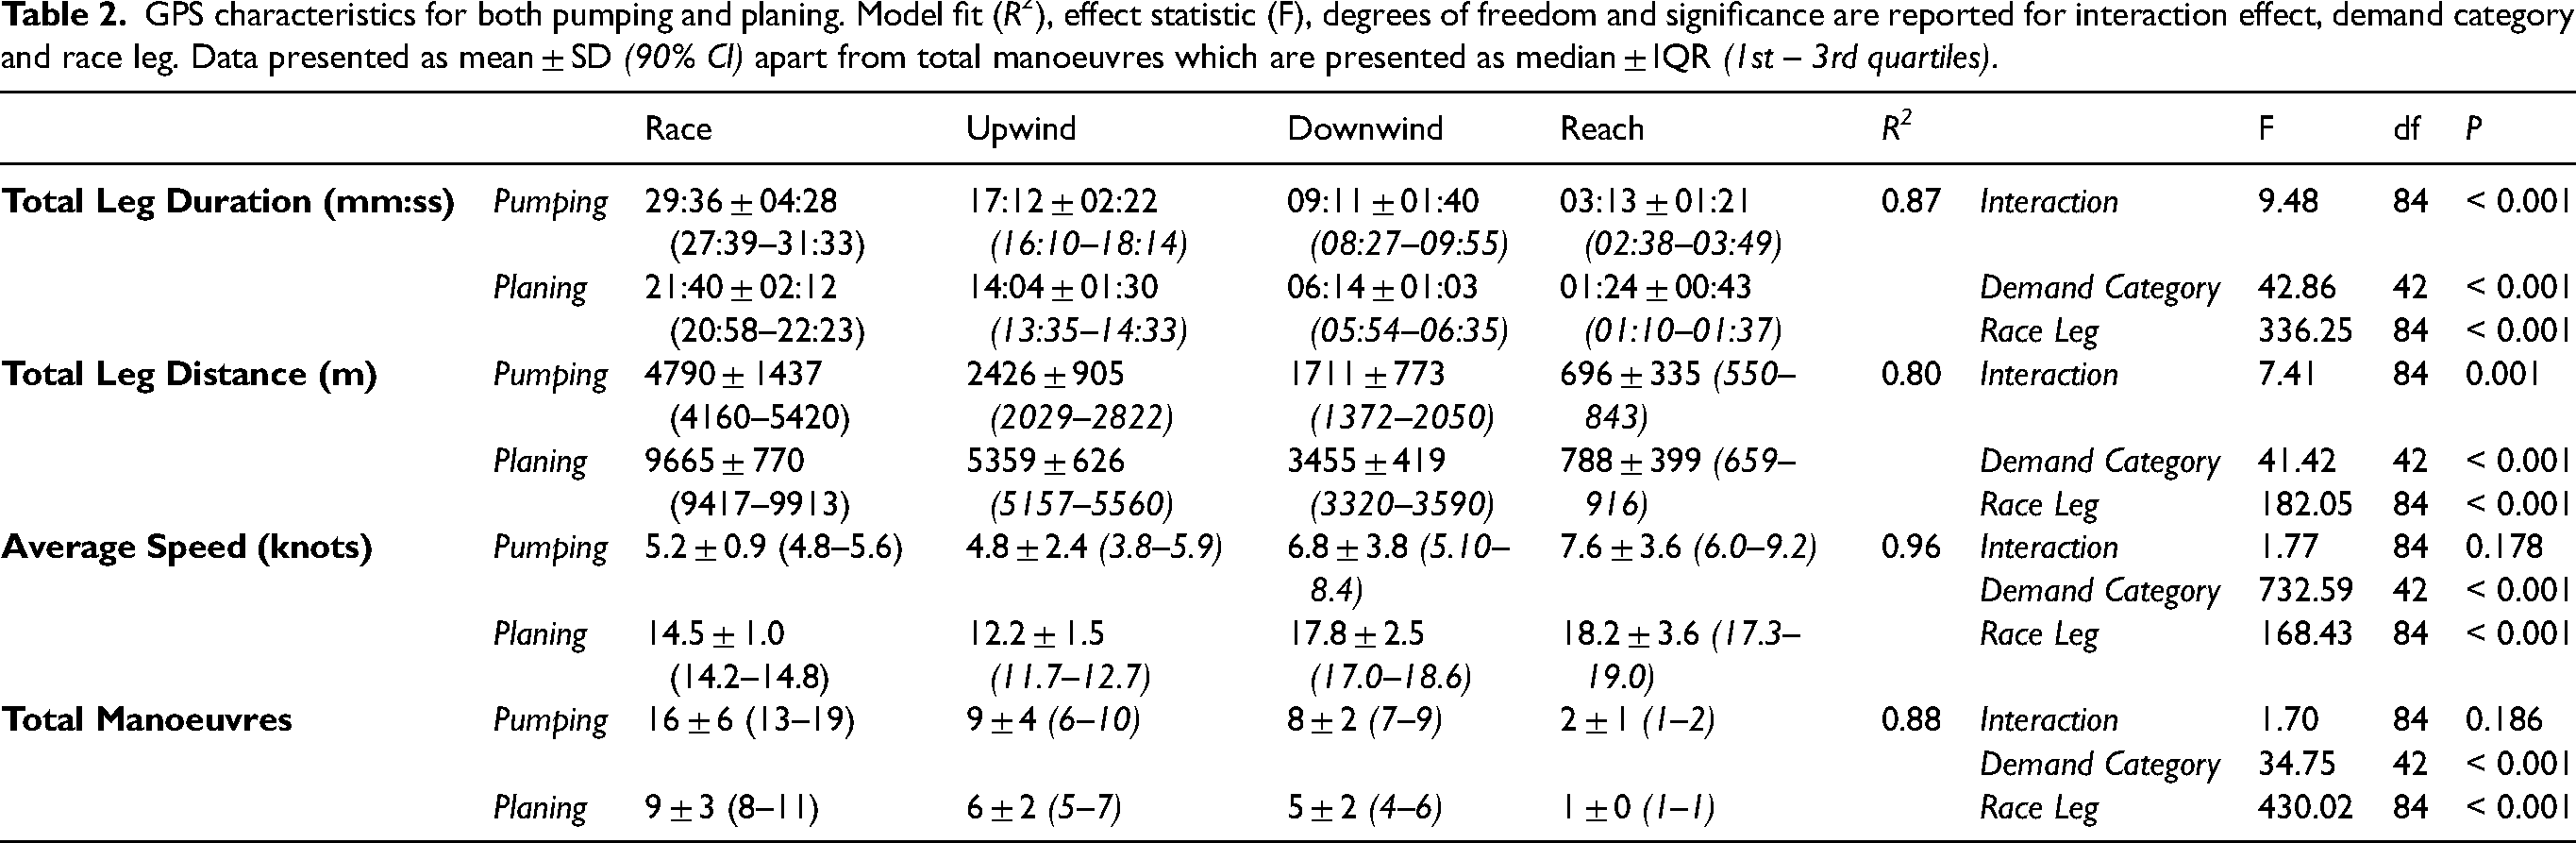
Greater distance and average board speeds were reported in the planing races compared to pumping. There was also a main effect of race leg type on both distance and speed. There was an interaction effect (demand category x race leg) for distance sailed, however, no interaction effect between for speed. Post hoc analysis revealed windsurfers travelled further upwind compared to downwind (t(84) = 4.25, P < 0.001) and reach (t(84) = 18.24, P < 0.001). Whilst downwind legs were faster than both upwind (t(84) = -14.22, P < 0.001) and reach (t(84) = 2.95, P = 0.012) legs.
Furthermore, number of manoeuvres was higher in pumping compared to planing races. There was a main effect of race leg on number of manoeuvres. There was no interaction effect between race demand and leg for number of manoeuvres. Post hoc analysis revealed windsurfers completed more manoeuvres on upwind (t(84) = 26.37; P < 0.001) and downwind (t(84) = 24.30; P < 0.001) legs compared to reach legs, however, no difference between upwind and downwind (t(84) = 2.08; P < 0.001).
HR variables
Average & peak HR
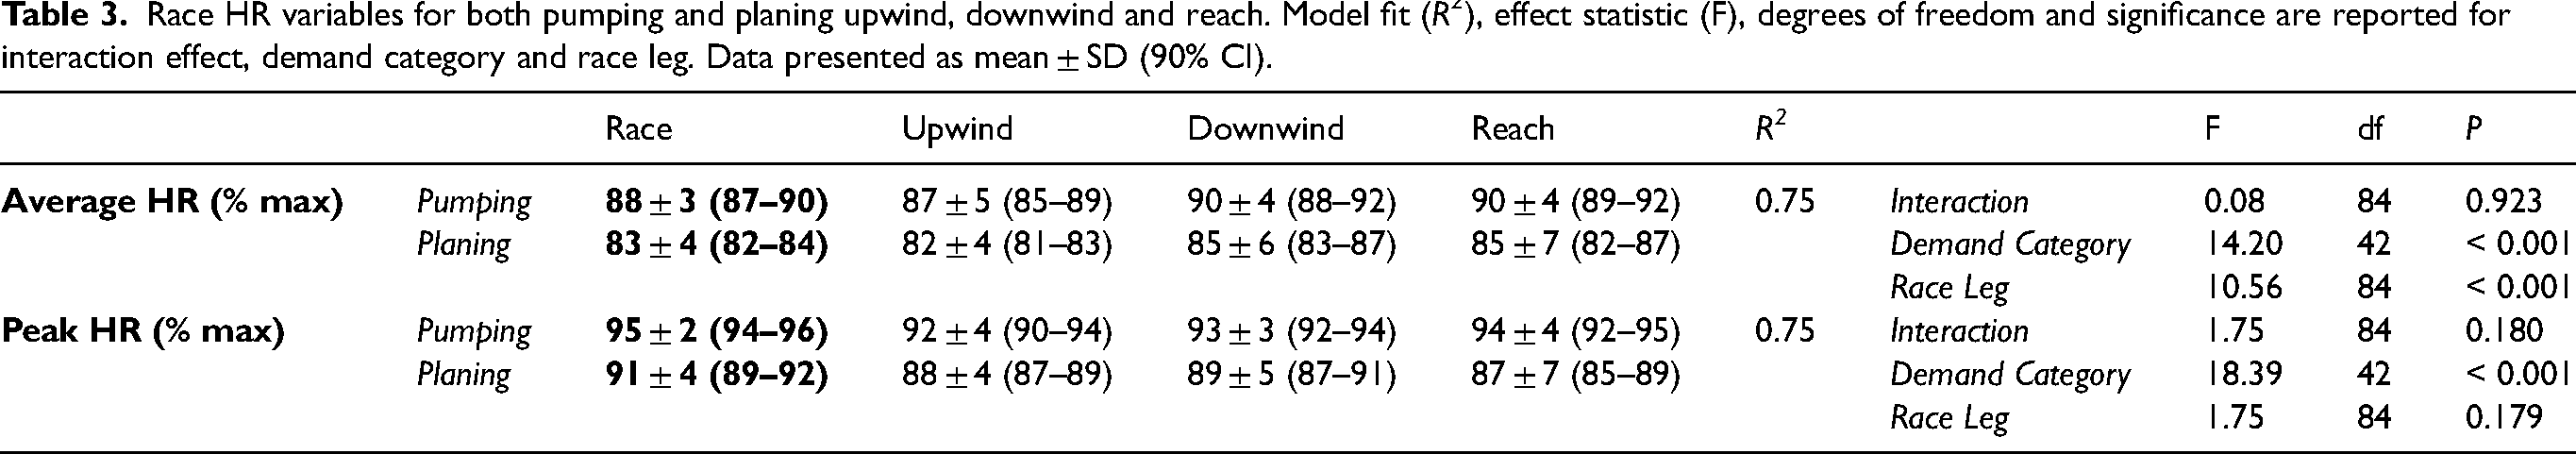
Model fit (R2), effect statistic (F), degrees of freedom and significance are presented alongside Mean and SD in Table 3. Average and peak HR were higher in pumping races compared to planing races. There was a main effect of race leg on average HR but not peak HR. Pairwise comparisons revealed average HR for downwind (87 ± 6%) legs was greater (t(84) = 4.08; P < 0.001) than upwind (84 ± 5%) legs. There was also no interaction effect for either average or peak HR.
Race HR variables for both pumping and planing upwind, downwind and reach. Model fit (R2), effect statistic (F), degrees of freedom and significance are reported for interaction effect, demand category and race leg. Data presented as mean ± SD (90% CI).
Time in zones
There was no difference in relative time in zone for Z1 (F(1,42) = 0.52, P = 0.475), Z2 (F(1,42) = 0.65, P = 0.426) and Z4 (F(1,42) = 1.76, P = 0.192) between pumping and planing races. Time in Z3 (F(1,42) = 7.50, P = 0.009) was greater in planing races than pumping, whilst Z5 (F(1,42) = 38.01, P < 0.001) was greater in pumping races compared to planing (Figure 3).
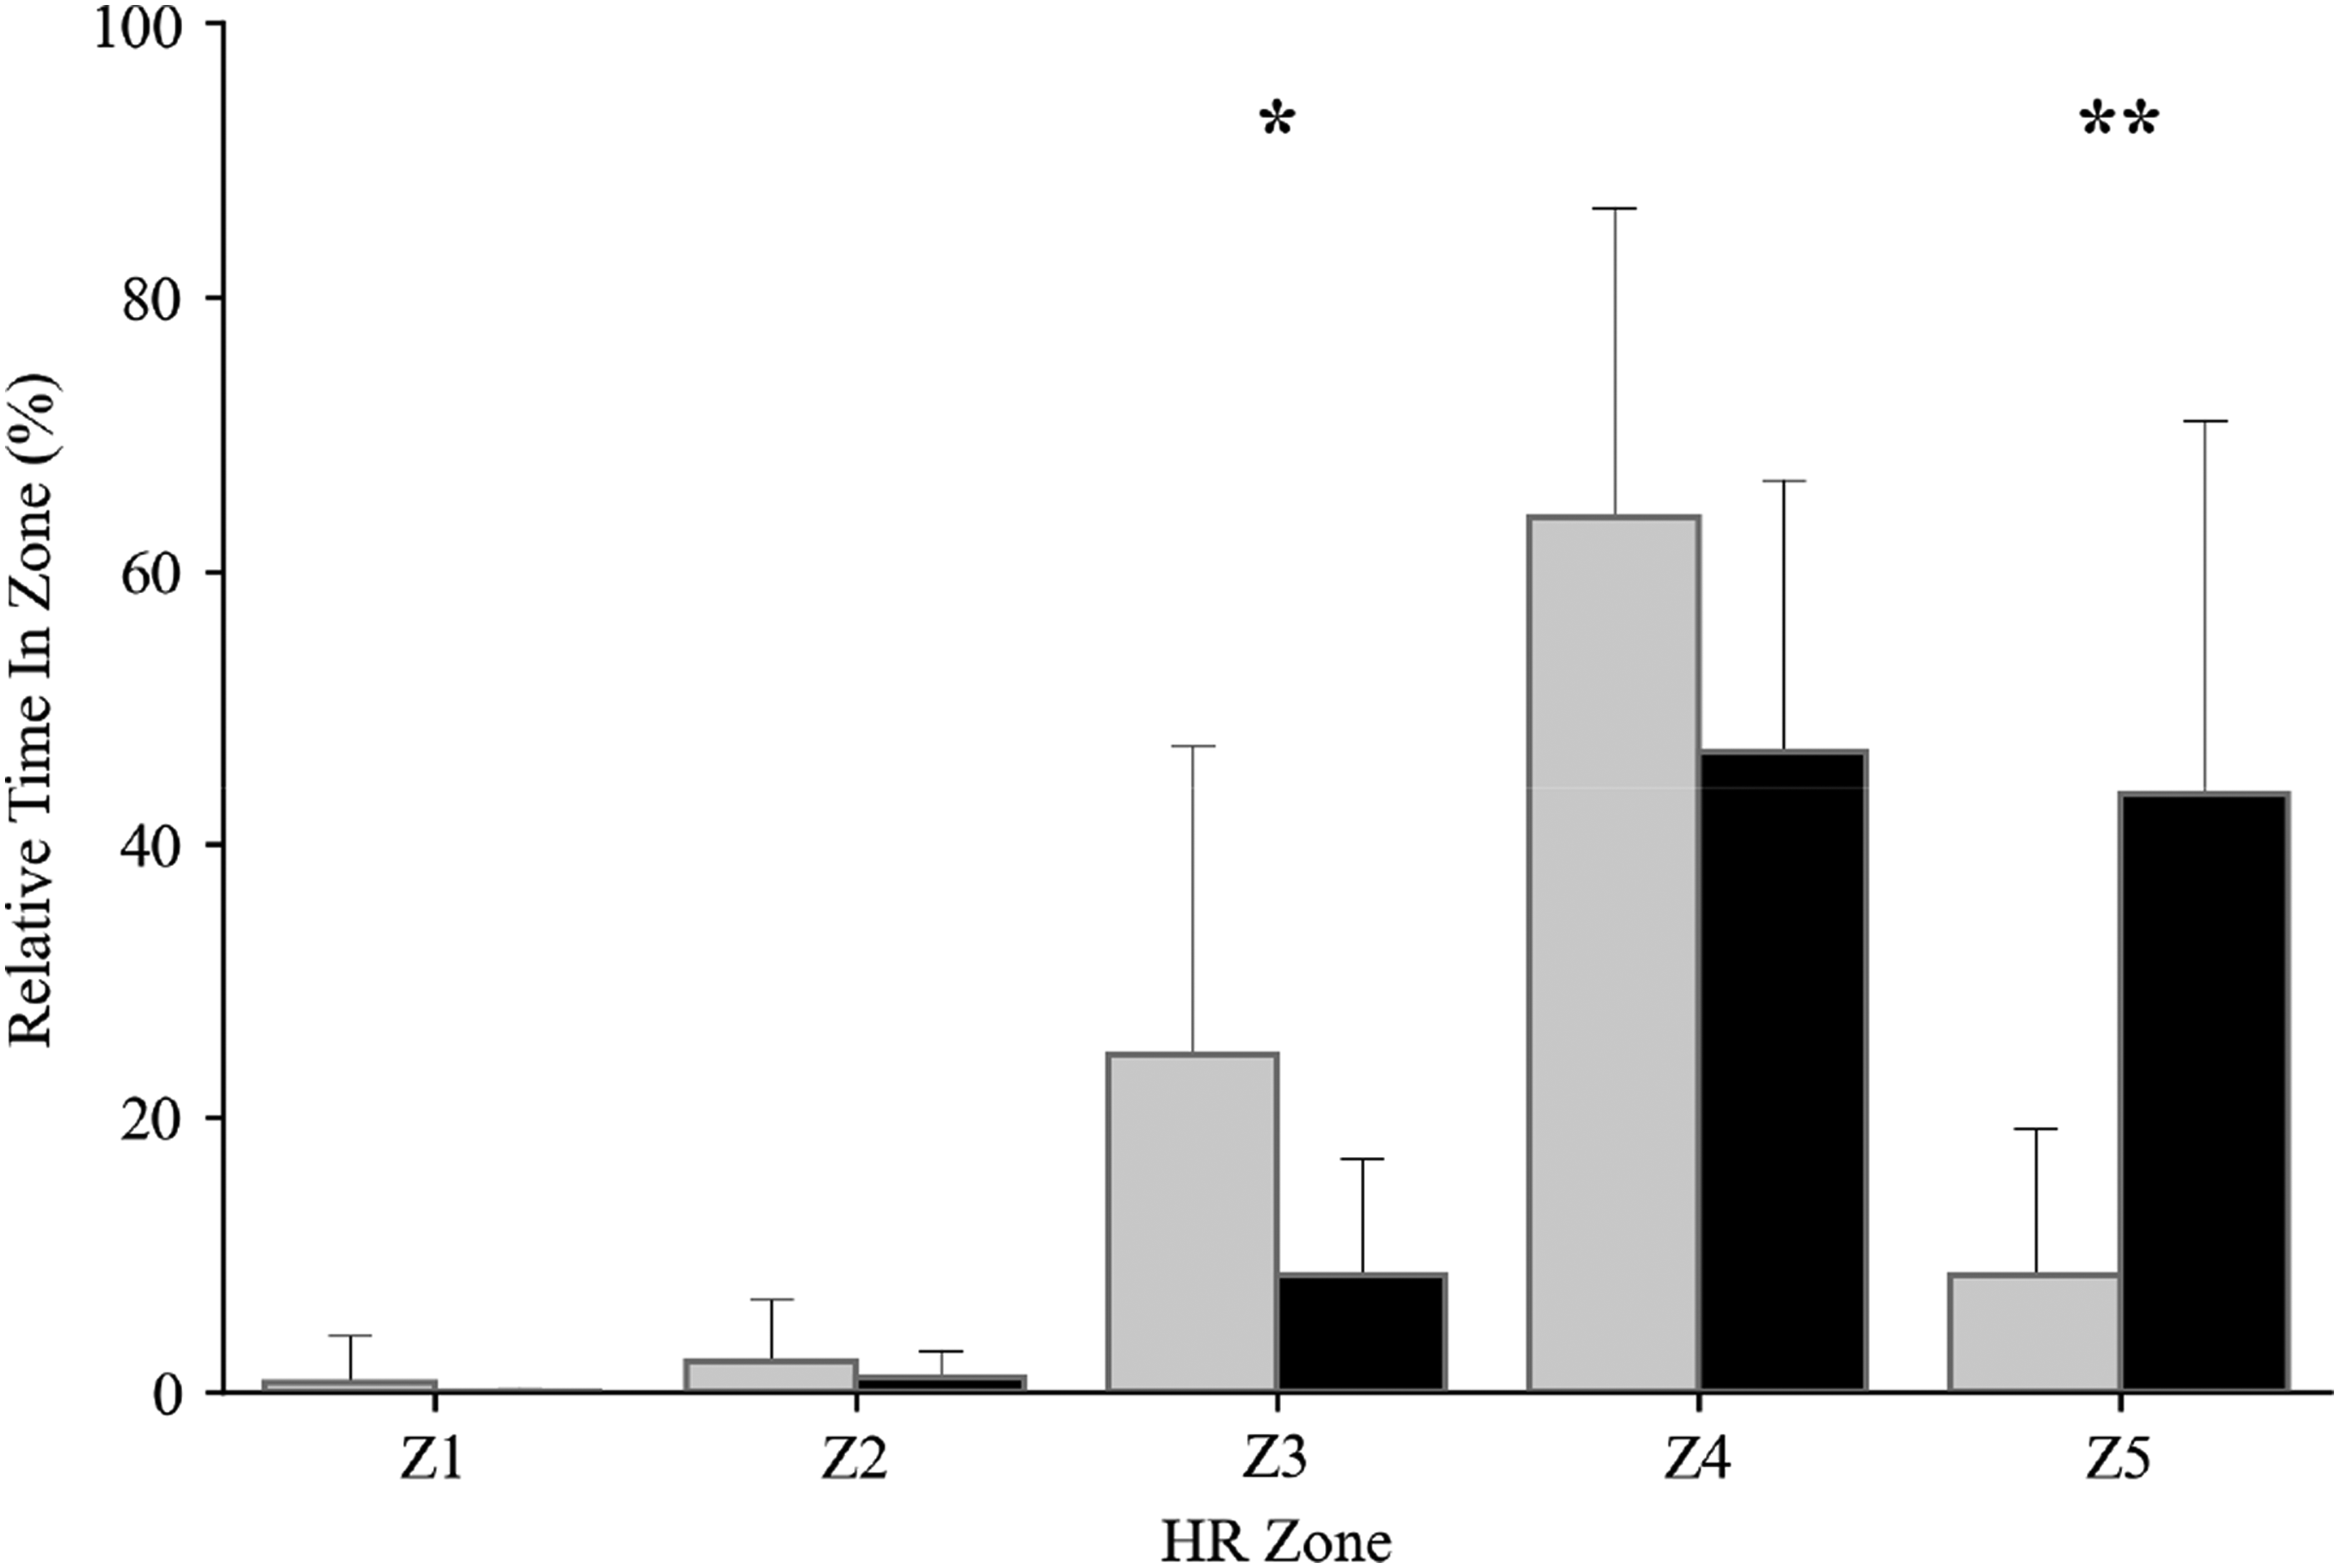
Relative time (% of total race time) in HR zones for both pumping and planing races. Pumping = black bars, Planing = grey bars. * Greater time in Z3 for planing compared to pumping races. ** Greater time in Z5 for pumping compared to planing races.
Regardless of race technique categorisation, there was a main effect of race leg on time in zone (Figure 4) for Z2 (F(2,84) = 7.40, P < 0.001), Z3 (F(2,84) = 71.66, P < 0.001), Z4 (F(2,84) = 165.51, P < 0.001) and Z5 (F(2,84) = 17.744, P < 0.001) but not Z1 (F(2,84) = 0.35, P = 0.706). Pairwise comparisons revealed Time in Z5 was greater for downwind than upwind legs (t(84) = -3.90; P < 0.001).
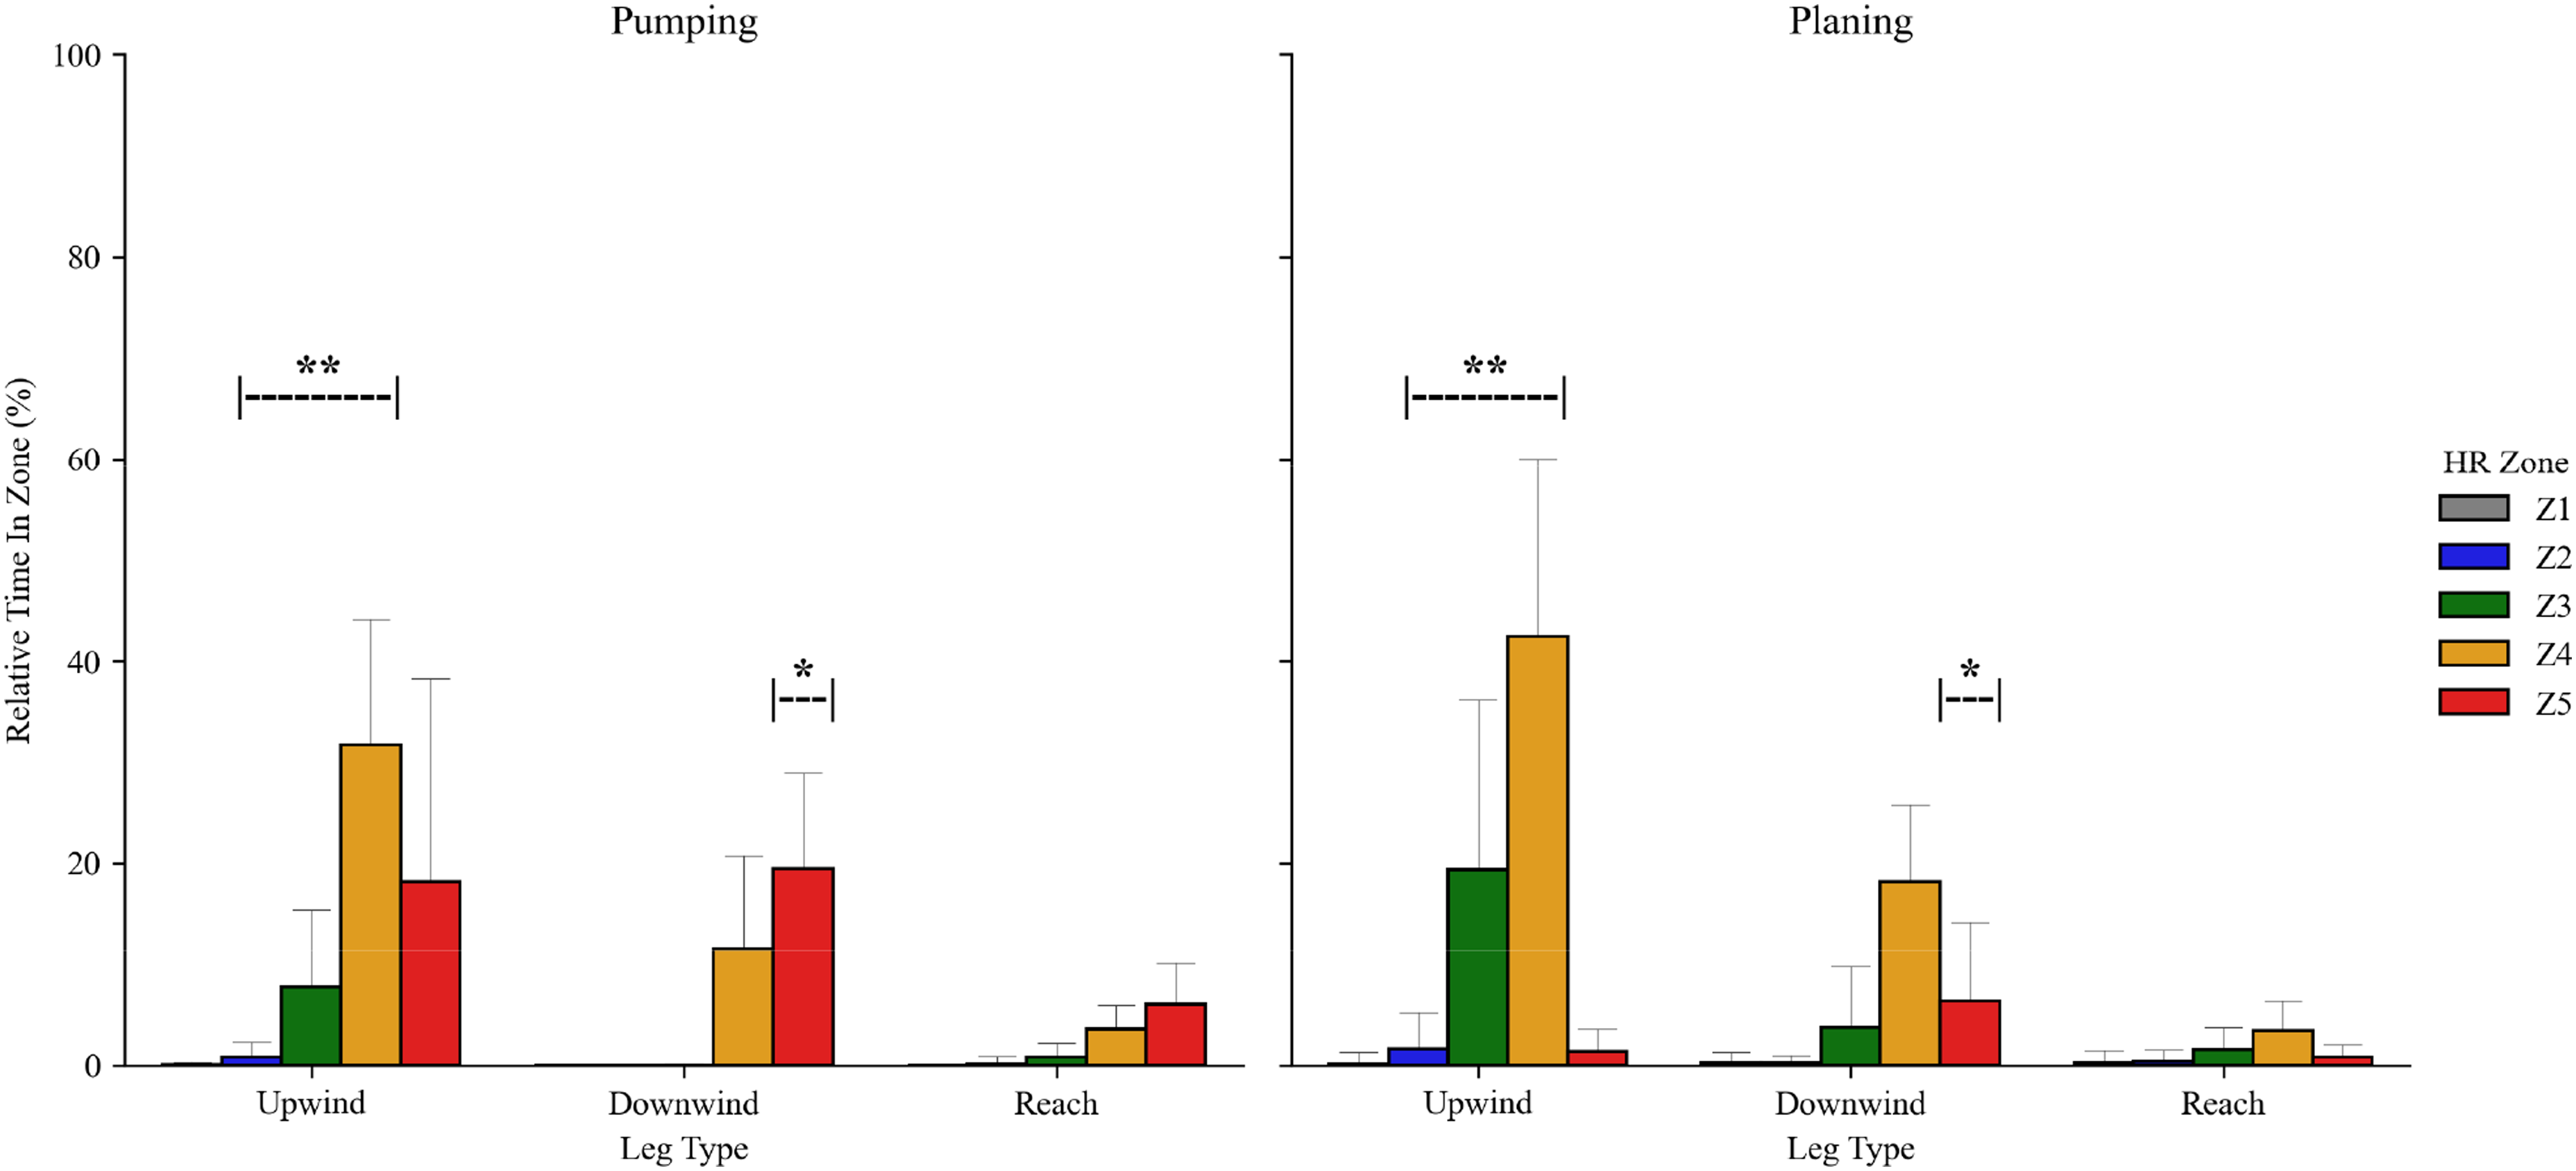
Time in HR zones for demand category and race legs. * Time in Z5 greater downwind vs. both upwind and reach (P < 0.001). ** Time in Z2, Z3 and Z4 greater upwind vs. both downwind and reach (P < 0.001).
There was no significant interaction effect for Z1 (F(2,84) = 1.378, P = 0.258), Z2 (F(2,84) = 0.0827, P = 0.921), Z3 (F(2,84) = 2.93, P = 0.059), or Z5 (F(2,84) = 0.803, P = 0.451).
However, there was an interaction effect (demand cat x leg type) on time in Z4 (F(2,84) = 5.20, P = 0.007). Pumping upwind resulted in greater time in Z4 compared to pumping downwind (t(84) = 6.322; P < 0.001) and reach (t(84) = 10.538; P < 0.001). Whilst planing upwind resulted in greater time in Z4 compared to planing downwind (t(84) = 5.283; P < 0.001) and reach (t(84) = 16.187; P < 0.001) as well as pumping downwind (t(83.1) = 5.924; P < 0.001) and reach (t(83.1) = 9.259; P < 0.001). Figure 5. displays an exemplar HR response to a three-race day, in which all races were categorised as pumping.
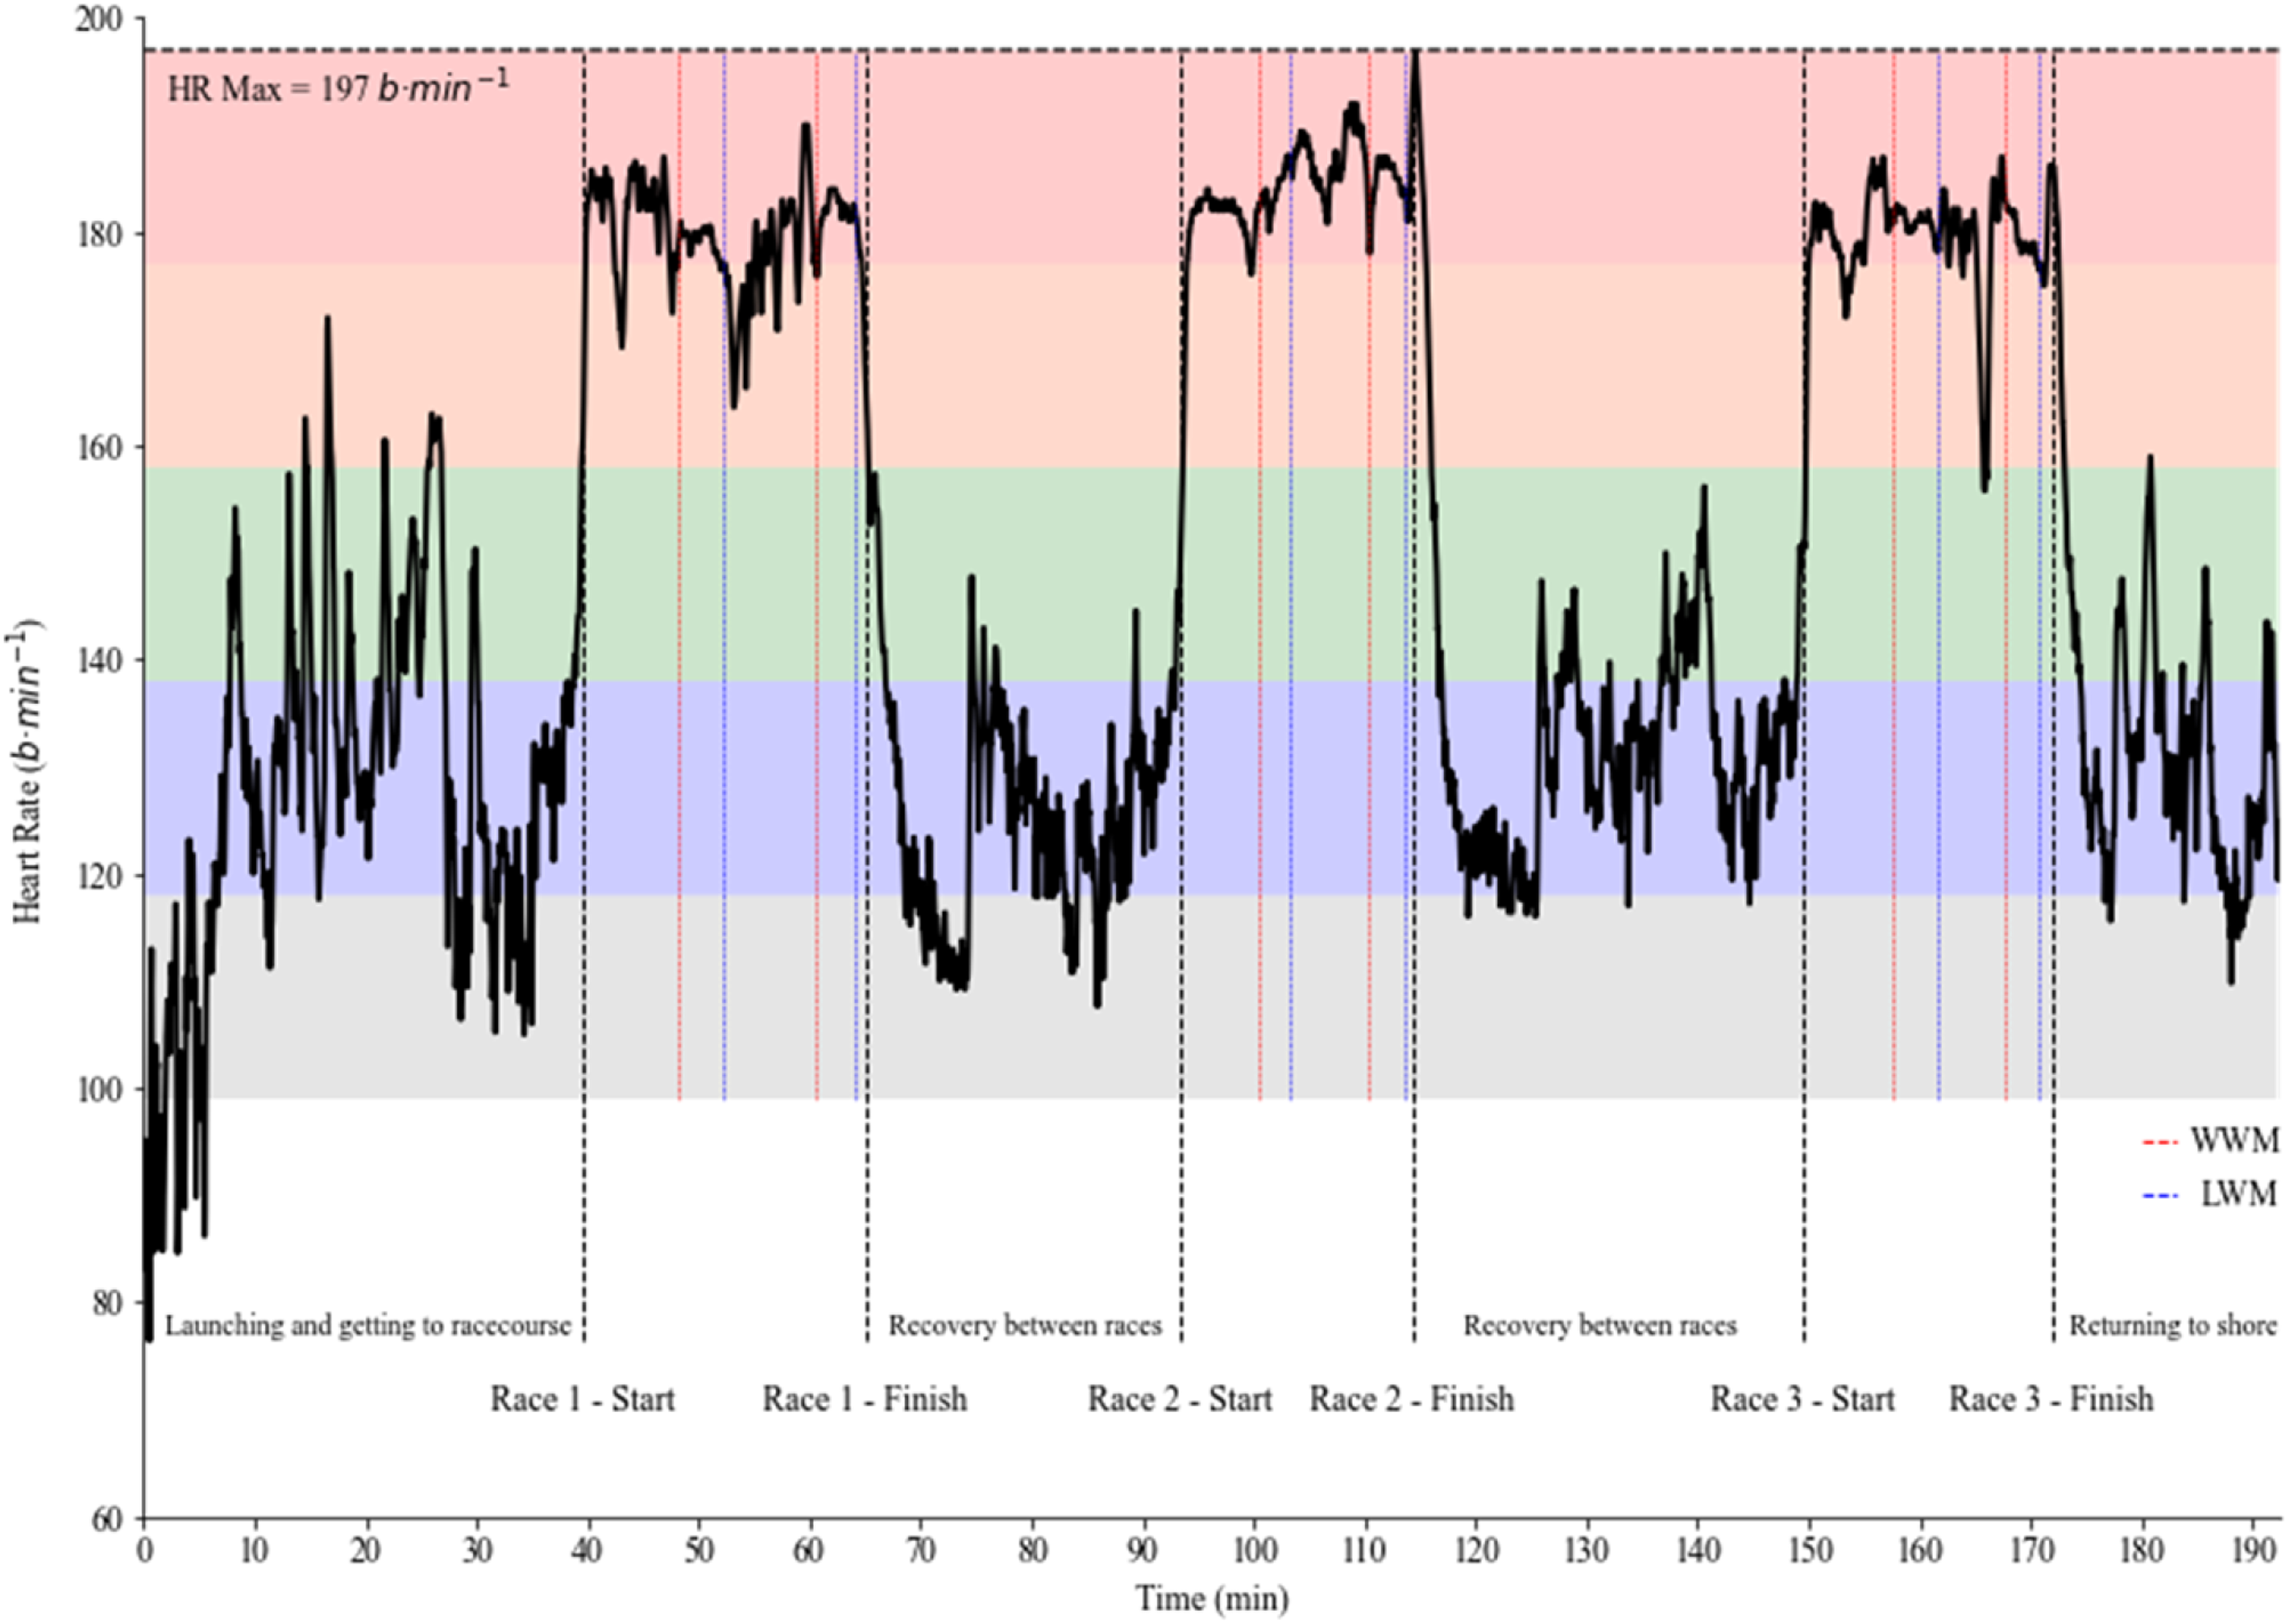
Exemplar HR response to a race day. Three races were completed on this day. Races 1, 2 and 3 were all categorised as pumping races. The different colour bands represent the individual's defined HR zones relative to their HR max. Grey = Z1, blue = Z2, green = Z3, orange = Z4 and red = Z5. WWM = Windward mark & LWM = Leeward mark.
Discussion
The aim of this study was to describe the physical demands of Olympic class windsurfing international competition through the HR response and GPS derived parameters. To our knowledge, this is the first study to present HR data of elite windsurfers during international Olympic (RS:X) windsurfing class competition for both pumping and planing techniques.
Pumping races resulted in a greater heart rate response when compared to planing races. These findings are in agreement with previous research that has assessed the energetic demand of Olympic windsurf pumping.9–11 Considering the intense nature of pumping (∼80% of V˙O2 max) and the whole body muscle activity required, 10 it is teleologically sensible that windsurfers are required to maintain 88% of HR max for the entirety of a light wind race (∼29 min).
Exercise intensity can be broadly categorised into four discrete intensity domains.19, 20 These domains are typically defined from physiological anchor points (i.e., V˙O2 kinetics and BLa response). To aid in the practical application of these domains, HR is often included when referencing. 21 This approach has also been used to quantify exercise intensity during time trial competition in professional road cycling where there are also difficulties in determining V˙O2 and BLa concentrations. 22 For example, 80–82% of HR max has been referenced as typical values between the moderate and heavy domain, with 87–90% of HR max for the heavy and severe domain.21, 23–25 Using these values, pumping races within the current study sit on the heavy-severe domain boundary, with time in Z5 potentially suggesting on average ∼12 min of a race spent within the severe domain. This insight on pumping is useful for coaches and sport scientists both in terms of the prescription of training and the designing of performance testing. Within the severe-intensity domain, steady state is not attainable, which often drives attainment of V˙O2 max. 26 Furthermore, as well as glycogen depletion and hyperthermia being primary causes of fatigue in the heavy domain, depletion of finite energy stores and/or accumulation of fatiguing metabolites (i.e., H+, calcium handling, Pi accumulation) could also contribute to fatigue in the severe domain.26–28 As an example, training regimes could focus on enhancing a windsurfer's maximal aerobic capacity and tolerance to high intensity exercise through increased buffering capacity.8, 10
During simulated upwind legs in winds categorised as either ‘light’ or ‘strong’, pumping occurred 66–69% of total leg time. During simulated downwind legs in winds categorised as ‘strong’, pumping still occurred 64% of the time. However, in upwind legs, this reduced to 37% of total leg time. 9 Thus, the additional time windsurfers can pump downwind in both pumping (‘light’) and planing ('strong’) conditions might explain the greater time in Z5 in downwind legs when compared to upwind legs. Furthermore, in pumping races, upwind and downwind average HR were similar to simulated RS:X legs, whilst planing upwind average HR was far greater; 83 vs 67% HR max.9, 10 There are several likely reasons for this difference including the heightened arousal of competition, the pre-competition adrenaline response and windsurfers engaging in a pre-start phase in which they compete for positional advantage on the start line.29–32 Furthermore, windsurfers were instructed to sail in a controlled, random order for an upwind and downwind leg, there was sufficient recovery between legs. However, during competition there is an instant transition from rounding the LWM after the first downwind to then head upwind again.
With regards to the development of performance tests applicable to RS:X pumping performance, there is
When wind speeds exceed a certain threshold an RS:X board is able to plane without pumping and travels at much greater speeds. 9 When reporting the distribution of average race board speeds (Figure 1), the two distinct groups offer evidence of such a threshold. This provided confidence that within the slower board speeds, the RS:X board is unlikely to be planing and as such, the windsurfers are required to pump to either generate additional propulsion or get the board to plane. 8 Furthermore, windsurfers also undertook more manoeuvres in pumping races compared to planing. This might be explained by the reluctance of windsurfers to take additional tacks and gybes in planing races as it results in a substantial decrease in board speed. Moreover, windsurfers are required to complete only one or two manoeuvres per leg (∼10 manoeuvres per race). However, data from the present study highlighted that most cases in light wind races, windsurfers were undertaking more (16 ± 6) manoeuvres throughout a race than required. This suggests the influence of factors such as environmental changes (i.e., wind shifts), tactical decisions or competitor actions during RS:X competition.29, 38, 39
Limitations
Whilst 10% HR bands were able to be derived, they do not account for where an individual's boundary between exercise intensity domains could occur. Furthermore, due to the variability in performance environment, some controlled research limitations exist. This includes unequal group sizes between pumping and planing races and the lack of measurement of other environmental conditions, such as sea state.
However, the protocols in this study have demonstrated the potential to ‘upscale’ processes and effectively capture the heart rate response to competition across any Olympic class regatta by which the SAP analytics platform is available (assuming sailor or windsurf is willing to wear a HR belt). This will enable those working within Olympic sailing to investigate a greater number of regatta events, with different environmental conditions, across different Olympic disciplines without the need of a sport scientist to be present. This process is particularly appealing for a sport like sailing, whereby competition venues are located across the world, with high travel costs associated for travelling sport scientists. Furthermore, with individual Olympic class associations organising their own events (i.e., World Championships) it is not uncommon for multiple sailing events to be hosted at different venues at similar time periods. This becomes problematic for sport scientists who wish to capture the heart rate response of Olympic sailing competition from multiple classes.
Conclusion
This is the first study to report the heart rate response to Olympic RS:X windsurfing during an international regatta. The results from the study demonstrate that windsurfing competition elicits a high heart response, especially when windsurfers are required to pump, with the potential for a considerable proportion of a race either at or above the boundary between the heavy and severe domain. This is likely to have significant implications on the type of training a windsurfer must undertake to meet the demands placed upon them. Furthermore, in the context of developing performance tests there is initial evidence to suggest the benefit of multiple fixed duration trials relevant to different pumping durations.
Footnotes
Acknowledgments
The authors would like to sincerely thank the windsurfers who participated in this study. A.A was supported by a dual funded research programme between the British Sailing Team (Royal Yachting Association) and Northumbria University, with support from the English Institute of Sport.
Declaration of conflicting interests
The authors declared no potential conflicts of interest with respect to the research, authorship, and/or publication of this article.
Funding
The authors received no financial support for the research, authorship, and/or publication of this article.