
Abstract
This single case study compares load peak intensity (LPI) in pre-season training sessions and official matches in professional soccer. This aims to answer the question whether the pre-season training sessions of one selected team adequately prepared for the peak demands of the season. Therefore, spatiotemporal data of 8 professional male soccer players was collected using a radio-based local positioning system in training (KINEXON) and a video-based tracking system in Bundesliga competitions (TRACAB). Load peaks were determined based on the distance covered (DC) during Acceleration, Deceleration and Sprinting phases. For each parameter, our algorithm quantifies the LPI by using the maximum rolling average value for time intervals of 1, 3, and 5 min within a training session or a match. The results on team level indicate that LPI for Acceleration was significantly higher in pre-season training sessions compared to matches (for 3-min interval: DCTR = 22.59 m ± 3.06 m, DCMA = 18.38 m ± 3.08 m, d = 1.97, p < 0.01). In contrast, LPI regarding Deceleration was significantly lower in pre-season training compared to matches (for 3-min interval: DCTR = 20.8 m ± 2.65 m, DCMA = 23.15 m ± 3.17 m, d = −1.29, p < 0.01). This suggests that exercises focused more on acceleration situations and less on deceleration situations. However, analysis on an individual level shows a considerably high variability of load peak intensity between players during both periods. We conclude that individual load monitoring is an essential component of training management. Practitioners are especially advised to carefully examine the worst-case scenarios of Deceleration during pre-season to avoid falling short on load requirements and adequately prepare players for match demands.
Introduction
Performance analysis and its possibilities of monitoring athletes' activity profiles have evolved strongly over the last decade. Today, player tracking is widely used in professional team sports to quantify external load and locomotor demands during training and competition. 1 In combination with other measurements, such as internal load (i.e., heart rate) and questionnaires (i.e., rate of perceived exertion), tracking plays a crucial role in better understanding the physical demands of a sport. 2
For this reason, professional clubs are investing financial and personnel resources to gain a competitive advantage. Numerous studies have described the relevancy of player monitoring to assist decision-making processes on an appropriate training load, thus implicating a supportive function in increasing performance while reducing the risk of injury.3–5 However, beneficial contributions are not enabled by the availability of technologies and collected data per se but rather by an appropriate usage and interpretation from practitioners. 6 To achieve this, the parameters collected must be selected carefully to avoid an overload of information caused by too much data. 4 In this context, total distance, high-speed running, accelerations, and decelerations are among the most commonly used parameters to picture a playeŕs external load. 7 In soccer, this locomotor data is mainly recorded by electronic performance and tracking systems (EPTS), which can track the positions of both the player and the ball. The main technologies used during training are global positioning systems (GPS) and local positioning systems (LPS), while semiautomatic camera systems are primarily used during competition. 6 Hence, players are often measured with different technologies, and literature suggests careful data storage and processing when interpreting comparisons between different systems. 8
In order to adequately cope with the demands of competition, pre-season is considered a crucial phase to prepare players for the upcoming challenges. This includes preparation regarding technical and tactical as well as physical demands. Training sessions should gradually increase in load to allow players to adapt to the physiological demands of the game after coming out of the season break to reduce the risk of injury and increase the availability of players. 9 In this sense, it has already been pointed out that monitoring athletes’ activity profiles is helpful to better understand the physical demands of the sport. On the one hand, monitoring can prevent significantly exceeding loads and consequently reduce fatigue or overuse injuries. 10 On the other hand, monitoring can prevent falling short in specific load requirements, leaving players underprepared for match demands.
wAs the nature of the sport requires players to repeatedly work at high intensities, soccer is an energetically demanding sport. 11 The various changes between the different intensities require practitioners not only to know the average external stress requirements of match-play but also of the most demanding passages in competitive soccer – also referred to as “load peaks” or “worst case scenarios” – to cover the broad range of physical demands.12,13 In this regard, temporary fatigue was reported after the occurrence of peaks with highly reduced values in the following intervals for high-velocity running. 14 as well as for accelerations and decelerations. 15 Moreover, soccer players may experience several peak intensity periods, but the required intensity in the first most demanding passage is significantly greater than that of the second, which in turn is also significantly greater than that of the third. 16 Regardless, the absolute peaks of a game need to be interpreted carefully in terms of subjects, selected time intervals, parameters, and contextual constraints. This is undermined by the high degree of variability in physical and tactical actions not only between players but also within one individual player from match to match. 17 Therefore, looking at single peak values may not be meaningful, underlining the need for a contextual approach involving several matches.
In light of this, several publications previously examined the intensity of load peaks in soccer.18–20 More precisely, they investigated the worst-case scenarios within different training games (small-sided, medium-sided, and large-sided games) compared to soccer matches. Even though certain game formats replicated average competition demands, they could not reproduce all peak competition locomotor demands. Especially regarding high-speed running and sprint distance, authors implied the necessity to prescribe additional training exercises to reach adequate intensities. In general, players demonstrated higher sprinting speeds and distances during sided games if the rules regarding goals, goalkeepers, pitch size, and number of players were closer to match-play situations, while smaller pitches demonstrated increased ball involvement, frequency of changes of direction and speed to evade opposition. 21 Hence, variations within these rules are beneficial, and practitioners should always consider their physical effects when designing training sessions.
However, the monitored training games were recorded during in-season training. In terms of pre-season, where the framework conditions are different from in-season, a thorough search of the relevant literature revealed no current study that has examined load peaks in soccer. During this period, insufficient training can lead to poor performance and an increased injury risk. 22 While pre-season schedules often include multiple friendly games against adequate opponents, current studies reported higher demands regarding the high-intensity passages during official matches compared to friendly matches. 23 Consequently, it cannot be implied that peak values during pre-season automatically reach the intensity pinnacles of in-season competition. To that effect, the high training loads during pre-season could potentially lead to a fatigued state within players, preventing them from reaching the most demanding passages.
Against this background, the present single case study explores whether the pre-season training sessions of one selected professional soccer team of the German Bundesliga adequately prepared for the peak demands of the season. This includes three sub-questions. First (i), we ask how the intensity of load peaks varies from match to match, respectively, from training to training sessions. To quantify load peak intensity, we used the distance covered during acceleration, deceleration, and sprinting phases in the most demanding time interval. We used a rolling window, which overcomes the shortcomings of fixed intervals. 24 Second (ii), we compare the load peaks in the training sessions and official matches at the team level by using different window sizes. The results can be used as a norm for load peaks in men's professional soccer. Third (iii), we repeat this analysis at the individual level while asking whether a specific player overreached or underreached the demands of the competition. We hypothesize that the load peak intensity during competition is higher than in training situations for most players due to the greater relevance of the competitive context, which facilitates the realization of maximum intensities. The results may offer insights that could assist coaches and players in refining load management and training exercises.
Methods
Design
In line with the aim of the study, we conducted a retrospective observational approach. Data was collected from a German professional soccer team using electronic performance and tracking systems during the 2021 pre-season period and 12 official 2021–2022 season matches. Load peaks were acquired using the rolling average method and were compared for training sessions and official matches.
Sample
Eight elite male soccer players of a German Bundesliga team were involved in the study (age: 26.63 ± 3.07 years; weight: 78.63 ± 8.14 kg; height: 182.38 ± 8.05 m). Players were free of injury and participating in practice and competition when data were being collected. The data collection only covered field players; hence, goalkeepers were not included. The German Bundesliga team and KINEXON Sports & Media GmbH provided informed consent and volunteered to participate in the study. Therefore, special approval from an ethics committee for this study was not required. Nevertheless, all procedures performed in the study were in strict accordance with the Declaration of Helsinki as well as with the ethical standards of the local ethics committee. To ensure confidentiality, the team's and the players’ names were anonymized.
Procedure
Examined matches took place within the framework of the Bundesliga schedule, and the first 12 matches (from August 2021 until November 2021) were evaluated due to their proximity to the pre-season period. They were set up within 14 weeks and included equal numbers of home and away games. Position data were collected by Deutsche Fußball Liga using a semi-automatic camera system (25 Hz, TRACAB, ChyronHego, New York, United States), which has been previously validated. 25 Players met competition requirements if they had participated in at least three home games as well as three away games for a minimum of 30 min per match. Pre-Season length was defined by the teams’ coaches. The monitored sessions extended over a period of three and a half weeks (in July 2021) before the competition started. Friendly matches during this time were included as training sessions in the data collection. Overall, 23 sessions were monitored. Cartesian XY coordinates of the players were recorded with a local positioning system (20 Hz, KINEXON, Munich, Germany) using ultra-wideband (UWB) technology during the sessions at the same soccer field, and a global positioning system (10 Hz, KINEXON, Munich, Germany) while on training camp and during friendly matches. The LPS-System has previously been validated. 26 Every recorded session was examined from start to end to adequately depict the pre-season load of players. Thus, all recorded sessions took place on grass turf, and every player wore his allocated tracking equipment throughout the data collection period to prevent inter-unit inaccuracy. 24 Players met pre-season requirements if they had fully participated in more than half of the pre-season sessions and participated in at least two friendly matches for over 30 min each. Players who only met pre-season or competition requirements were excluded from this study. Ultimately, participation ranged from 6 to 11 in official matches and from 13 to 21 in pre-season sessions.
Load peak intensity
Load Peak Intensity (LPI) was quantified with respect to Acceleration, Deceleration, and Sprinting. Therefore, the spatiotemporal raw data of each player was imported into the KINEXON software. Data was reviewed, and extreme outliers on one GPS tracking day during pre-season were removed. The software used the same algorithms for filtering and calculating speed, acceleration, and distance on each dataset. In conclusion, data derived from different tracking systems were congruent and allowed for comparisons. For an overall representation of soccer playerś activity, the three event types, Acceleration, Deceleration, and Sprint, were evaluated. 7 Definitions were stated as follows 27 : (1) An acceleration event is detected if an athlete maintains an acceleration over a threshold of 2.0 m/s-2 for a minimum duration of 0.5 s and a minimum distance of 1 m; (2) a Deceleration event is detected if an athlete maintains a deceleration over a threshold of 1.5 m/s-2 for a minimum duration of 0.5 s; (3) a Sprint requires a player to run over 4.0 m/s during a minimum of 2 s, and during this time he/she has to run over 6.3 m/s for at least 1 s. This Sprint definition was provided by the German Professional Football League (DFL) and has been used in other studies before. 28 For calculating LPI, we first determined the accumulated distance covered by a player during all events of a type within time windows of 1, 3, and 5 min using the rolling average method (i.e., rolling periods of a match for the 1-min interval: 00:00–00:59, 00:01–01:00, 00:02–01:01, 00:03–01:02 … until the end of the match). The performance indicator LPI represents the maximum value of this distance (in m) during one training session or competition for one player.
Statistical analysis
Statistical analysis uses the conditions Matches (MA), Pre-season training (TR#), and Upper quartile pre-season training (TR). The Upper quartile pre-season training condition contains data from only the top 25% most demanding training sessions of each player. For comparing LPI between competition and training (questions ii and iii), we only used the Upper quartile pre-season training condition and excluded the Pre-season training condition.
For analyzing the fluctuation of LPI (question i), we used the coefficient of variation (CV) of each performance indicator per player as a statistical unit (Figure 1). For comparing LPI between competition and training at the team level (question ii), the team average of the performance indicator per competition or training period served as the statistical unit (Figure 2). For comparing LPI between competition and training at the individual level (question iii), we used the performance indicator for one player per competition or training as a statistical unit (Figure 3). Here, we report the bandwidth of LPI between players as the percentage difference of the range of mean values. The following formula was used: Percentage Difference = [(Max. Value – Min. Value) / Min. Value] * 100 (Max = Maximum; Min = Minimum). Additionally, the difference in mean values between conditions was computed for every player, subtracting the match value of the corresponding pre-season value.
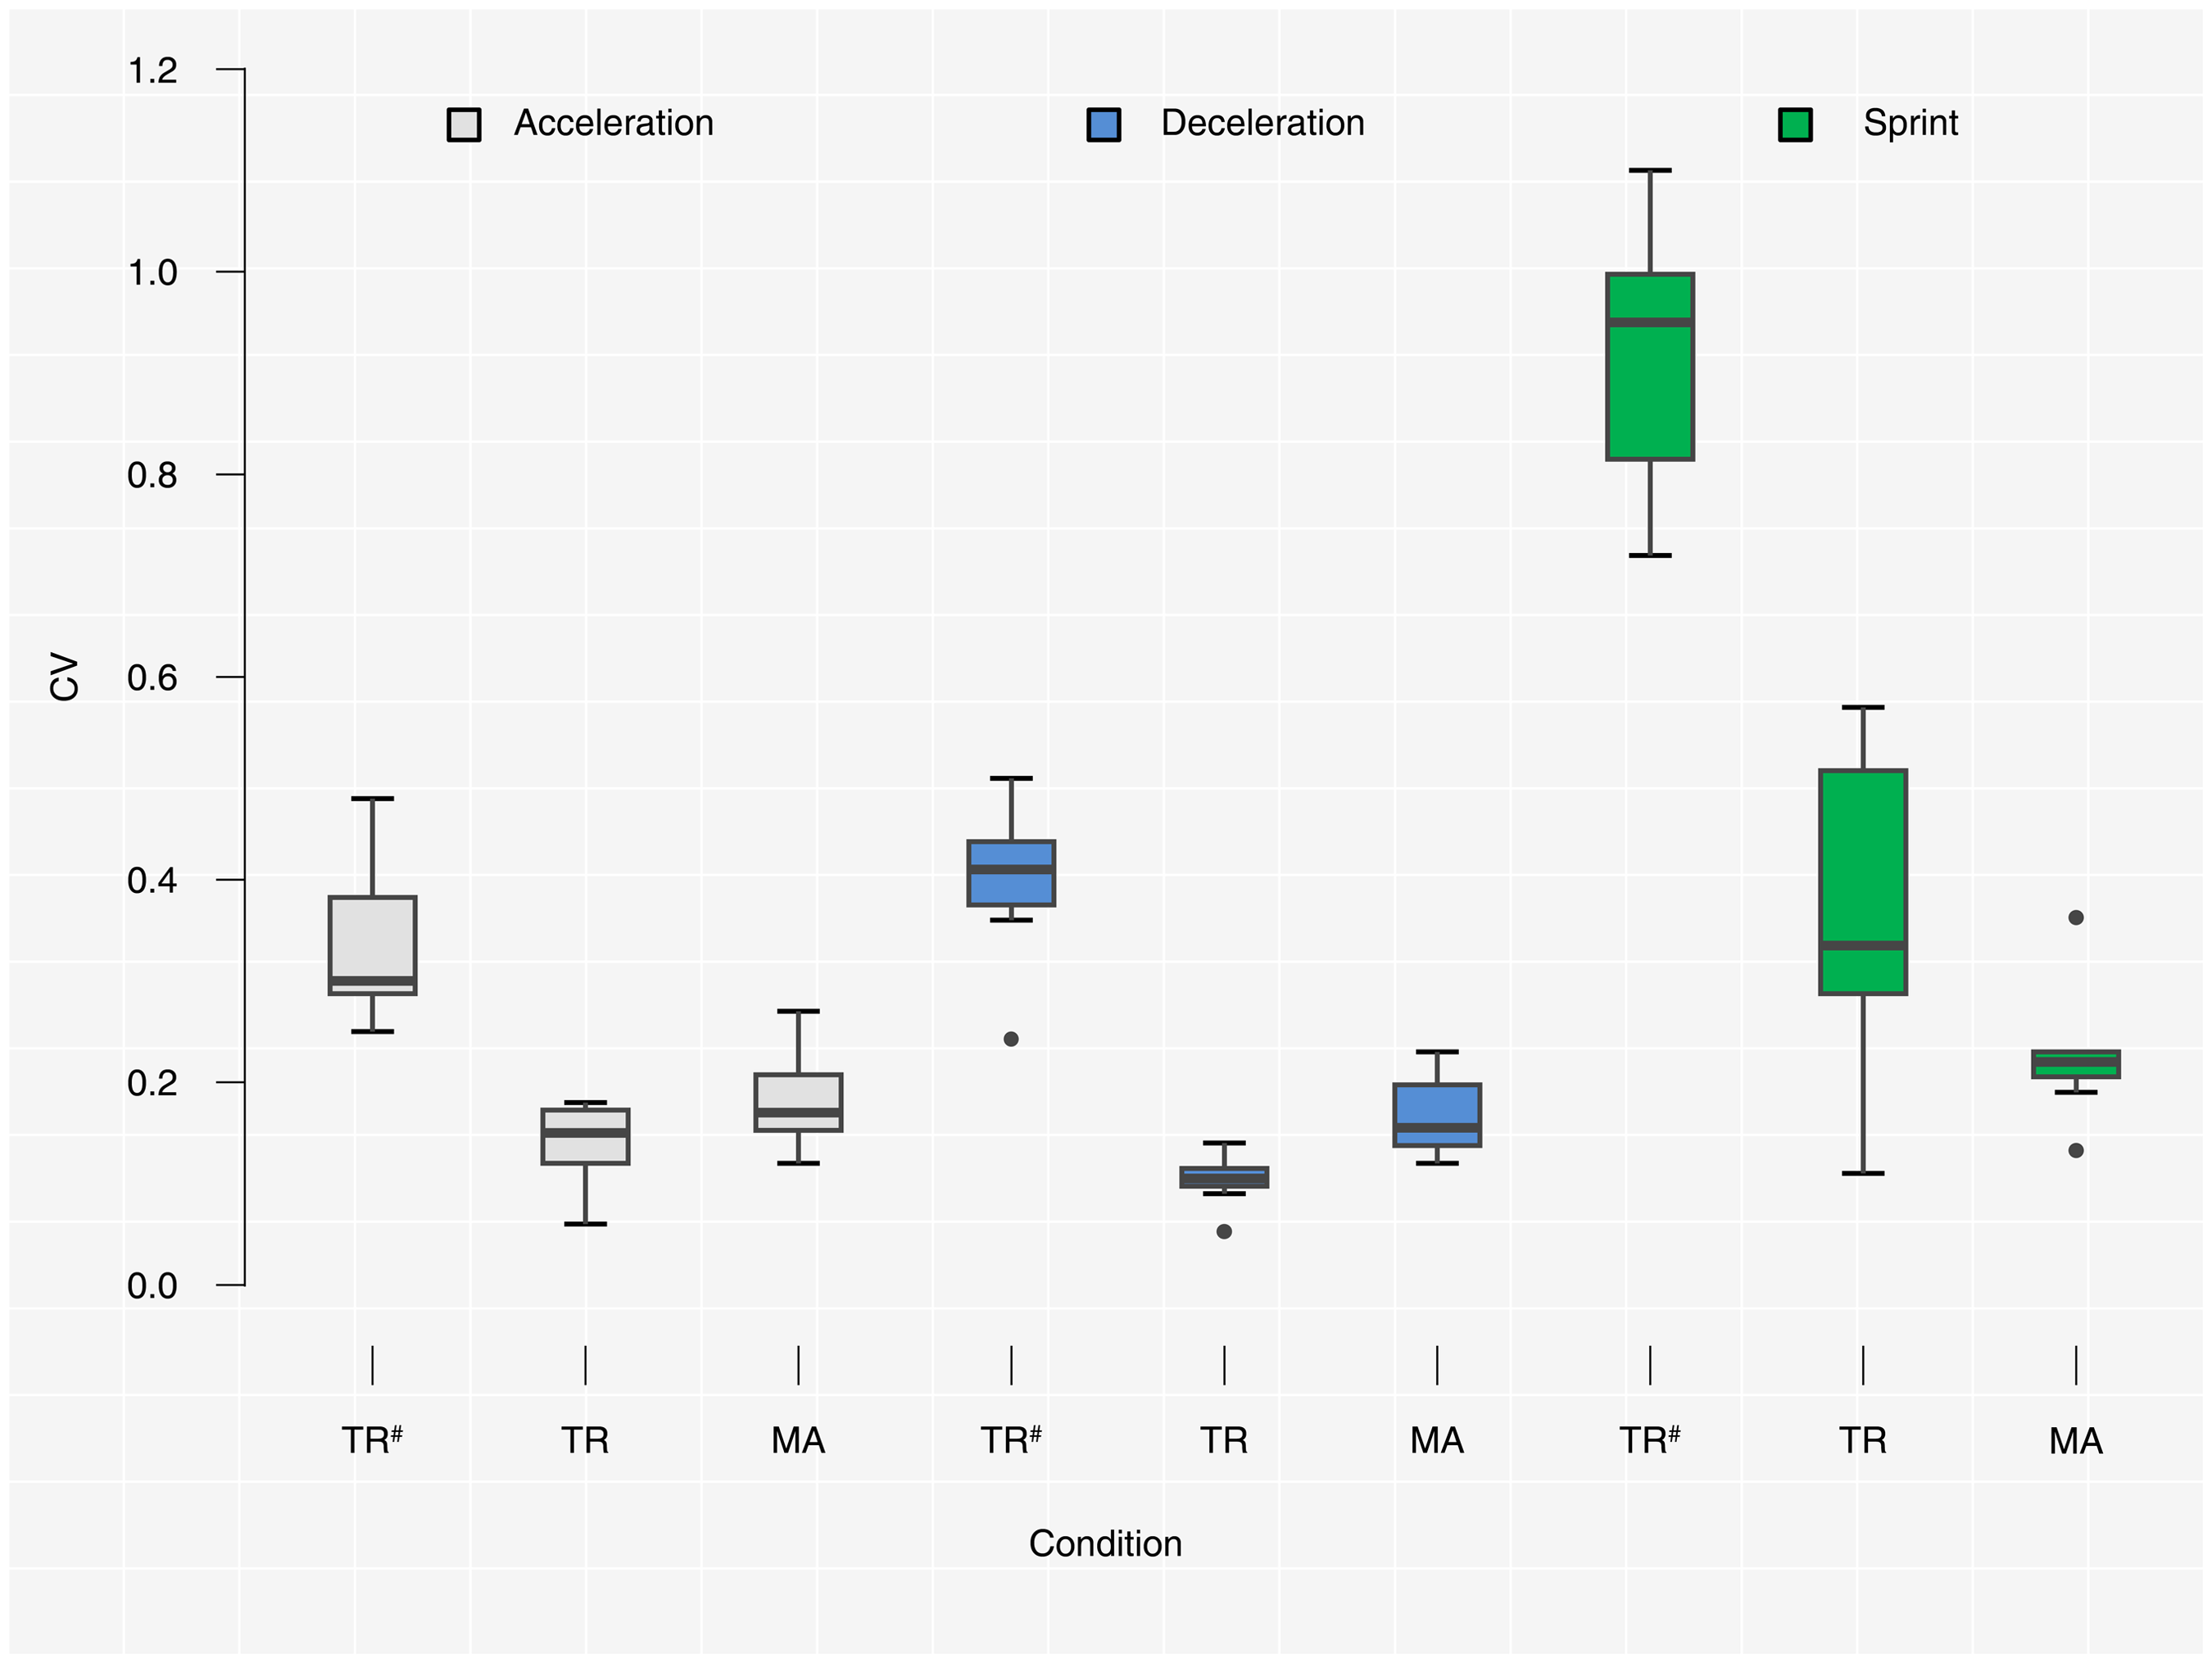
Intra-player fluctuation (n = 8) of the 5-min interval peaks for all three performance variables during pre-season and competition. CV = Coefficient of variation; MA = Matches; TR#=Pre-season training; TR = Upper quartile pre-season training. Load Peak Intensity fluctuated substantially in the complete pre-season training, with Sprint showing the highest variation among performance variables.
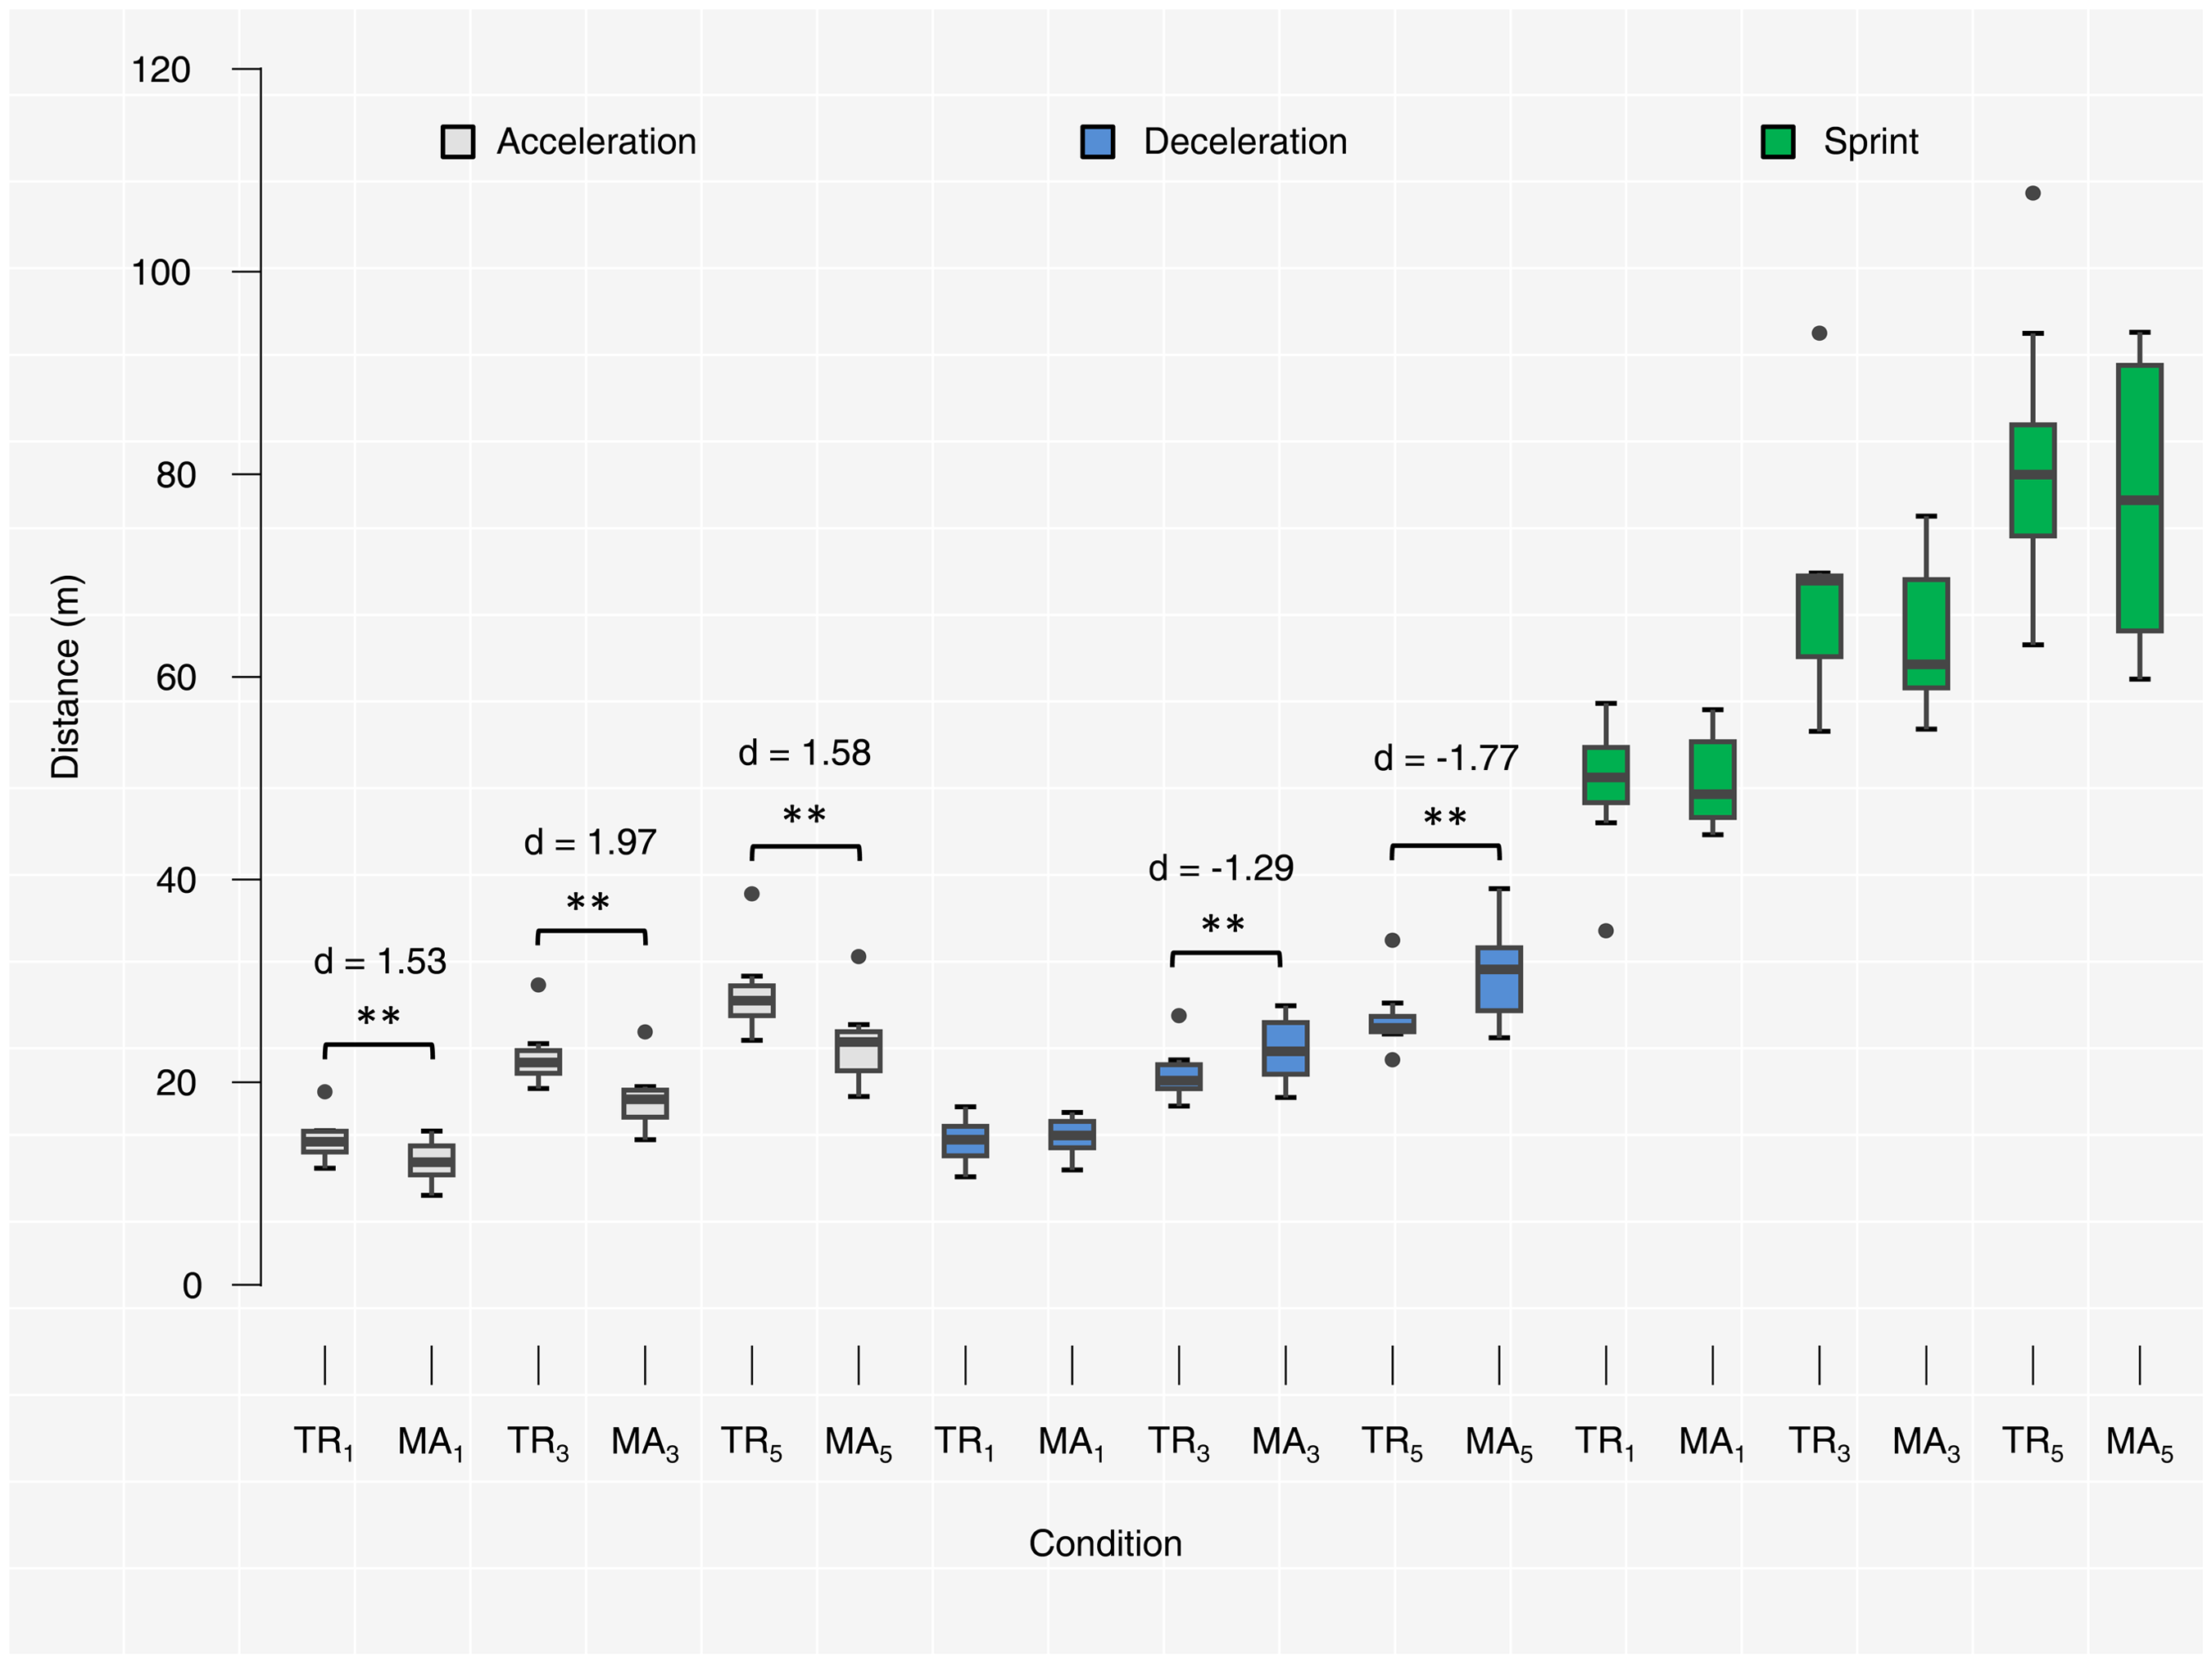
Pre-season (n = 8) and competition (n = 8) averages of the 1-, 3-, and 5-min interval peaks for Acceleration, Deceleration and Sprint. Subscript numbers on the x-axis label the respective time intervals. MA = Matches; TR = Upper quartile pre-season training. Asterisks denote statistically significant differences between pre-season and competition team averages, with *p < 0.05 and **p < 0.01. The magnitude of the absolute effect sizes were calculated using Cohen's d and were considered strong (d ≥ 0.8). At team level, Acceleration exhibited significantly higher pre-season peak values compared to matches across different time intervals, while Deceleration showed lower pre-season values for longer time intervals. Sprint values remained consistent between pre-season and competition.
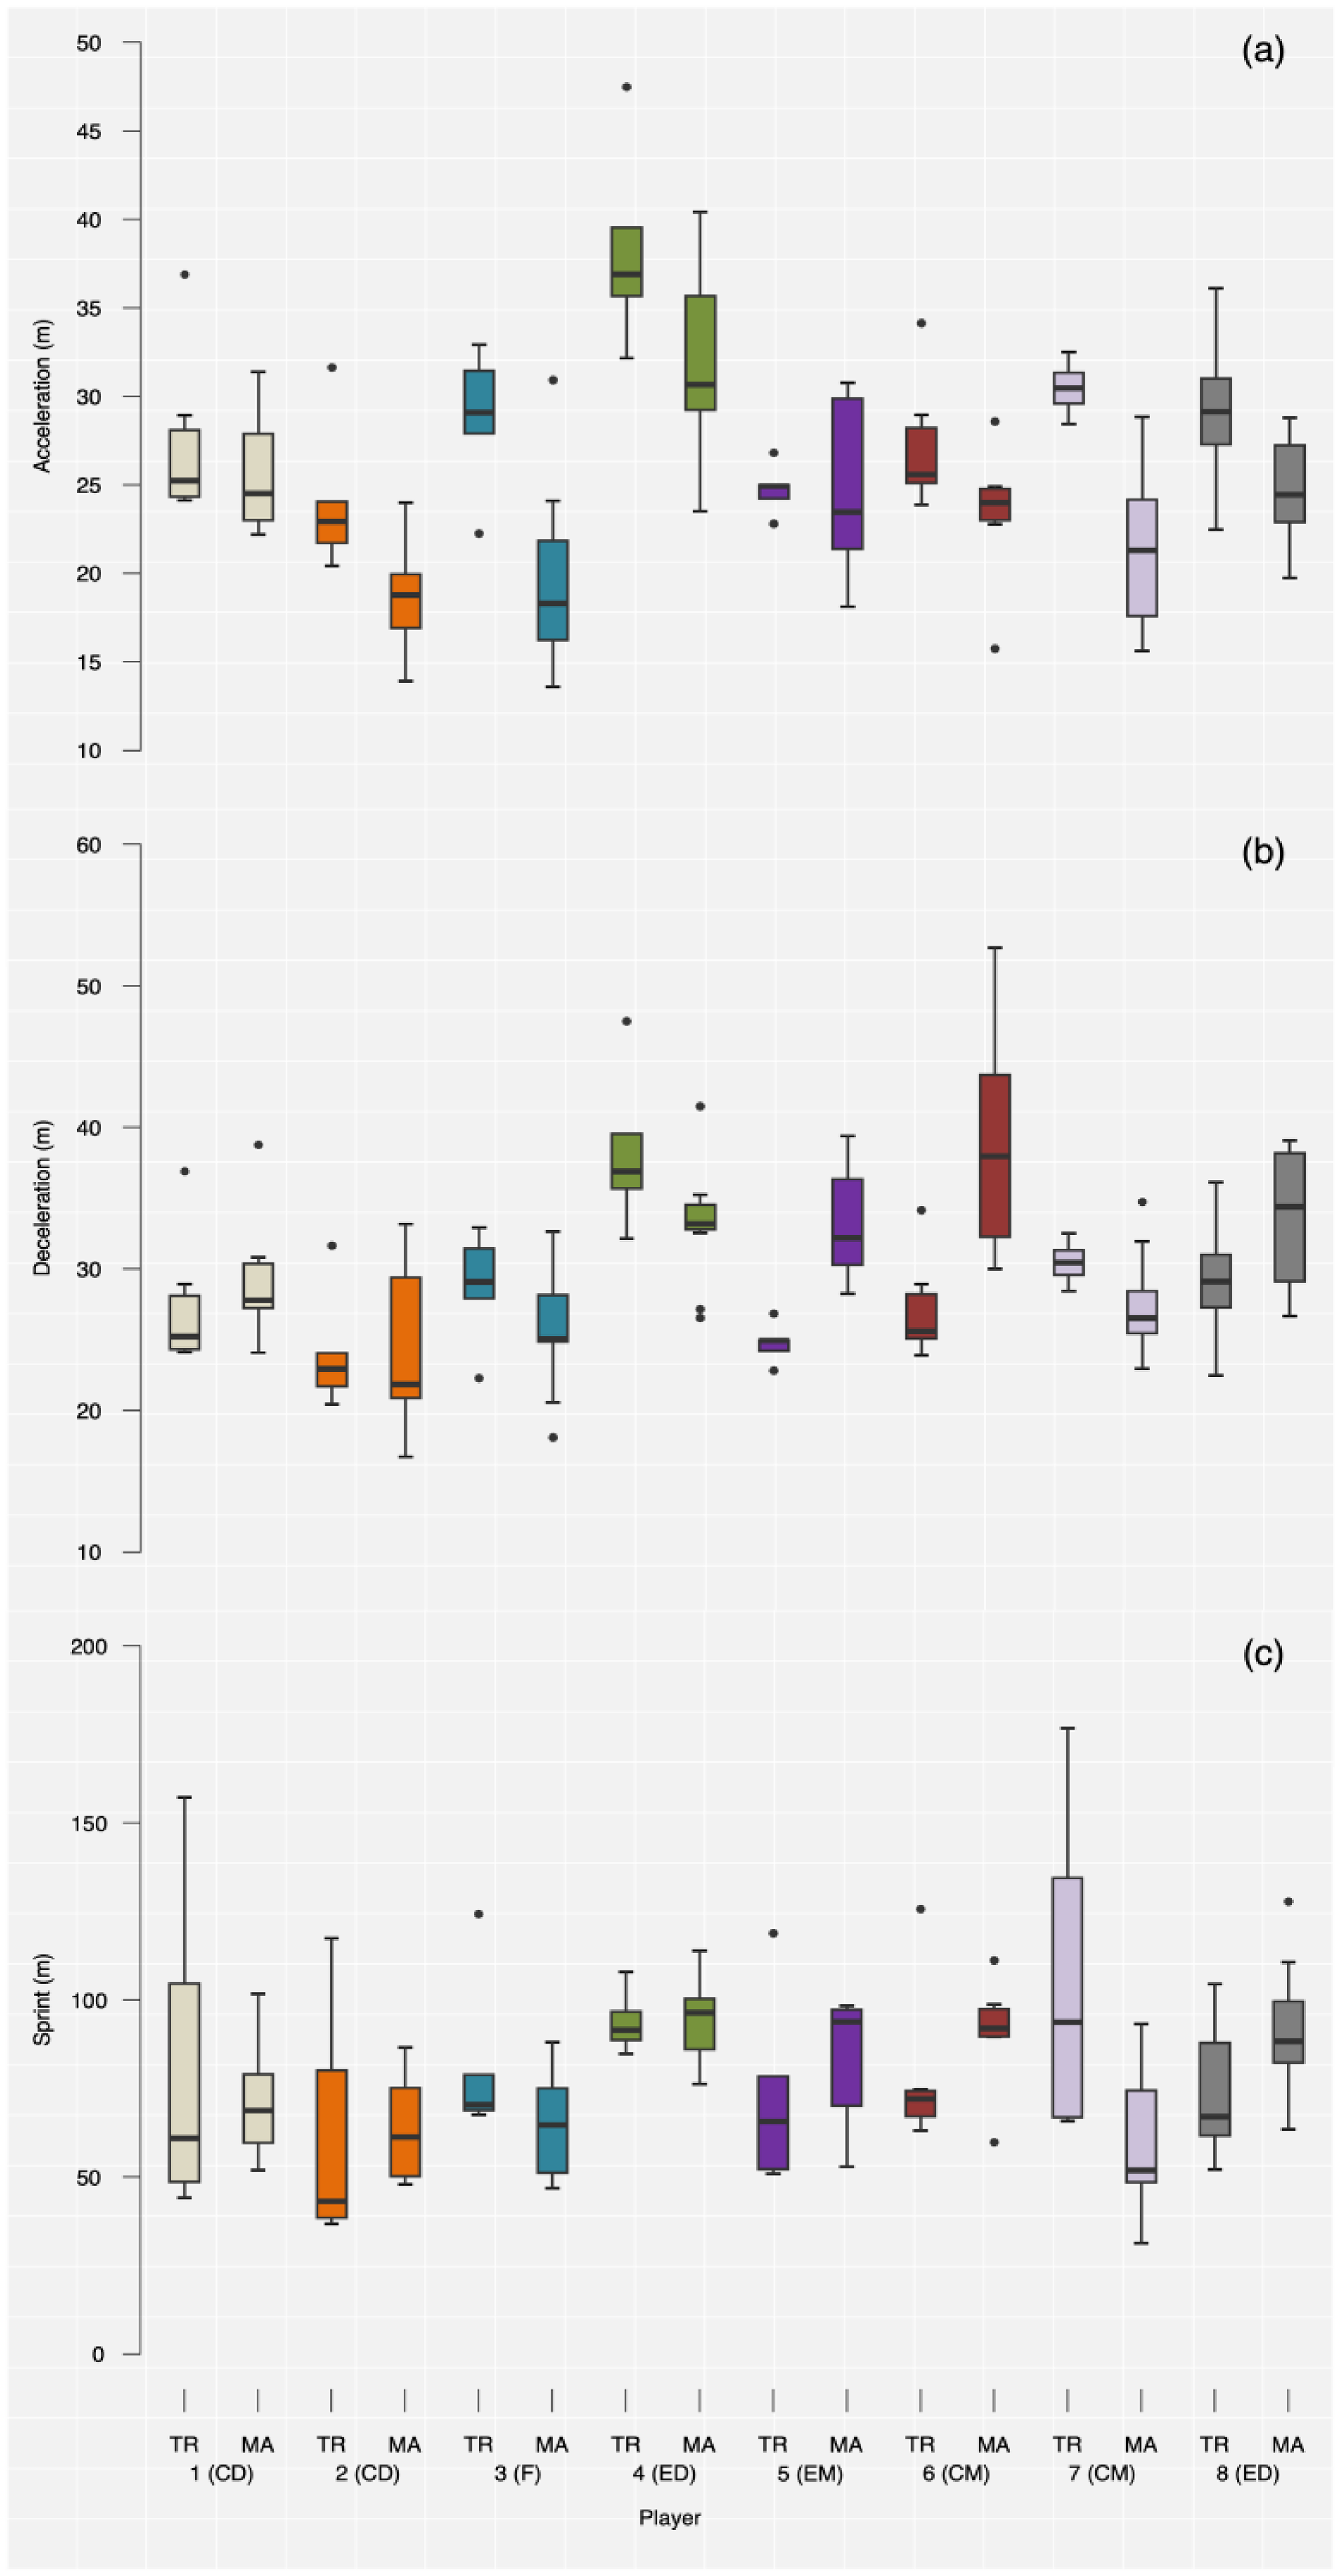
Individual 5-min interval peaks during pre-season (n = 4–6) and matches (n = 6–11) for (a) Acceleration, (b) Deceleration and (c) Sprint. Numbers on the x-axis label players including their playing position. CD = Central Defender; CM = Central Midfield; ED = External Defender; EM = External Midfield; F = Forward; MA = Matches; TR = Upper quartile pre-season training. (a) Acceleration peaks tend to be higher during pre-season than competition, with substantial variation among players. (b) Deceleration showed lower peak loads during pre-season for some players but not all. (c) Sprint displayed variable mean differences between pre-season and competition, with no substantial overall differences in distance covered.
Paired t-tests were applied to detect average team differences between conditions. Effect sizes (Cohen's d) were calculated based on standard deviation in condition TR and classified as follows (always considering absolute values): 0–0.19 = trivial, 0.2–0.49 = small, 0.5–0.79 = medium, ≥0.8 = large. 29 The significance level was set to *p < 0.05 and **p < 0.01 for all tests. Before using parametric statistical test procedures, the assumption of normality was verified using Shapiro-Wilk tests. For running statistical calculations, JASP (version 0.17.1) was used.
Results
Figure 1 shows the fluctuation of Load Peak Intensity across conditions (question i). All three performance variables showed the highest fluctuations during the entire pre-season training sessions. In contrast, the upper quartile of pre-season data showed lower levels of variation and fell within a similar range as the peak match values for all three parameters. Similar results were reported for the 1-min and 3-min time interval. Overall, Sprint displayed the highest variation among all performance variables during the pre-season period. Moreover, the intra-individual differences in the fluctuation of Sprint were relatively larger during pre-season than those of the other two parameters, namely Acceleration and Deceleration.
Figure 2 reports LPI in competition and pre-season training (upper quartile) at the team level for all performance variables for 1-, 3-, and 5-min intervals. On average, Acceleration exhibited significantly higher pre-season peak values compared to official matches with strong effect sizes across all three time intervals. Mean differences in distance were 2.22 m (1 min), 4.20 m (3 min), and 4.97 m (5 min). In contrast, Deceleration demonstrated significantly lower pre-season values than gameplay for the 3-min and 5-min intervals, with strong effect sizes observed, while no significant difference was detected for the 1-min interval. Mean differences in these cases were −0.46 m (1 min), −2.35 m (3 min), and −4.46 m (5 min). Notably, no significant difference was detected between the pre-season and competition periods regarding Sprint. In general, longer time intervals were associated with a higher workload. However, no significant abnormalities or noteworthy findings regarding the differences between time intervals were observed.
Figure 3 presents LPI in pre-season training sessions (upper quartile) and competitions for all performance variables (5-min intervals) at the individual level. Individual peak Acceleration values demonstrated a greater median in every player during the pre-season period compared to the competition period (see Figure 3(a)). The magnitude of mean differences between both periods is highly player-dependent, with a minimum difference of 0.07 m and a maximum difference of 9.01 m. Additionally, the peak values vary greatly between players for both periods. The data spread of the average Acceleration peaks among players was [24.13 m; 38.33 m] during the pre-season, while it ranged from [18.59 m; 32.14 m] in the competition phase, resulting in pre-season and competition percentage differences of 58.85% and 72.89%, respectively. Visual inspection of Deceleration exhibits considerably lower peak Deceleration loads during pre-season compared to matches for Players 5 and 6 (see Figure 3(b)). In contrast, other players did not demonstrate any notable difference between both periods. The differences in the means of both phases for individual players range from −7.96 m to −1.22 m. The range of average Deceleration peaks among players during the pre-season was [21.96 m; 33.75 m], while in the competition phase, it extended from [24.38 m; 39.10 m], resulting in pre-season and competition percentage differences of 53.69% and 60.38%, respectively. Regarding Sprints, mean differences between pre-season and competition range between −17.65 m to 47.71 m. Overall, no substantial differences in the distance covered were observed between the pre-season and matches for the players (see Figure 3(c)). The observed differences between the boxplots in Player 6 are further relativized by the outlier, which exceeds peak match values, given the small number of data points. Considerably high variability in pre-season peaks is displayed for Player 1, Player 2, and Player 7. The data spread of the average Sprint peaks among players was [63.18 m; 107.49 m] during the pre-season, while it ranged from [59.78 m; 94.01 m] in the competition phase, resulting in pre-season and competition percentage differences of 70.13% and 57.26%, respectively.
Discussion
This study aimed to evaluate whether the pre-season training sessions of a selected Bundesliga team adequately prepared for the peak demands of the season. Therefore, we analyzed (i) the fluctuation of Load Peak Intensity (LPI) regarding acceleration, deceleration, and sprinting and compared these parameters between pre-season training sessions and official competitions at (ii) team level and (iii) individual level.
Discussion of research questions
When analyzing the fluctuation of the LPI across all recorded units during pre-season (question i), a high degree of variability was observed (see Figure 1). This can be explained by the fact that not every training unit aims for maximum exertion or peak performance, as training sessions often have diverse objectives, including skill development, endurance building, recovery, and technique refinement. Consequently, the outcomes of these varied training units can range across a broader spectrum, resulting in increased performance fluctuation. Relative to the pre-season values, the variation in peak values was relatively low during competition, suggesting a higher degree of consistency among athletes during matches. This can be attributed to the similar physical demands in official competitions. To account for this issue and provide a more accurate representation of athletes’ capabilities, only the top 25% of pre-season values were selected for analysis.
By focusing on this subset of pre-season data, we can mitigate the influence of performance fluctuation and obtain a more consistent range of performance values similar to those observed during competitions. Moreover, the fluctuations seemed to depend further on the parameters, and higher CV values were reported for Sprint distance during pre-season compared to Acceleration and Deceleration. One possible explanation for this could be our sprint definition, which requires quite a long running distance to reach the speed threshold. This might not have been the case in all training sessions, but only in special sprint drills, where these parameters might have exceeded the usual pre-season training scope. Furthermore, Sprint CV values also showed greater inter-individual differences compared to the other parameters during pre-season, which could result from positional differences during training sessions. In summary, moderate fluctuations of the LPI for players were still present in the pre-season period and the competition period within all collected parameters, which supports the findings that peaks depend on numerous influencing factors. 30 Consequently, relying only on single match peak values for training conception is not advisable, and the fluctuations must be considered when interpreting the stated findings.
Comparing pre-season training sessions with competitions at the team level (question ii), results demonstrated significantly higher acceleration peak values during pre-season than during competition (see Figure 2). Hence, on average, the team absolved greater distances of accelerations in their LPI during pre-season compared to official matches. At this point, one could argue, that players were prepared for the worst-case scenarios in terms of accelerations. While this might be the case for absolute values, previous findings suggest that the evaluation of acceleration peaks might additionally require the collection of the number of passages that may occur. 16 This is due to their findings that the first, second, and third high-intensity periods might not always differ in terms of accelerations. However, these data were not collected in this study. Thus, practitioners are recommended to further consider the number of occurrences of high-intensity accelerations to increase the significance of the collected data. For instance, single results may indicate that players are meeting the competition demands regarding acceleration peaks during pre-season, although similar worst-case scenarios may have occurred twice or more during matches and only once during training sessions.
Deceleration was the only parameter where, at the team level, load peaks reported significantly lower values for pre-season compared to competition. On average, the 3-min and 5-min peak intervals demonstrated lower distances absolved (see Figure 2). This indicates that certain load requirements of Deceleration peaks in matches were not met during pre-season. One could speculate that sprinting drills during training focused more on the acceleration phase and neglected fast break movements. Another possible explanation could be the frequent usage of small playing fields during sided games in training. While these were shown to promote an increased frequency of decelerations and accelerations, the maximum speed values achieved are lower. Subsequently, it likely requires deceleration of a much lower initial velocity compared to official matches. In this regard, larger playing fields, similar to match-play situations, have been found to foster greater distances for kinematic parameters. 21 The current literature outlines that decelerations occurring during soccer-specific actions cause high loads on players and consequently provoke fatigue. 31 Thus, insufficient preparation for the competition demands in terms of deceleration can lead to a decrease in performance and an increased risk of injury. 3 Developing physical qualities, which are also protective against injuries, requires adequately high loads regarding volume as well as intensities. 3 Consequently, these results suggest that the worst-case scenarios regarding deceleration distances should be carefully examined during pre-season sessions to avoid falling short of specific load requirements.
As for the LPI in Sprints, no statistically significant differences were found between the team averages of the pre-season period and competition (see Figure 2). Accordingly, these results implicate that pre-season values did meet match demands in terms of Sprints. In previous literature that compared the LPI of competition to training exercises, the authors warned that the training formats of sided games most likely do not adequately reproduce game demands of high-intensity running distances.18–20 For this reason, they suggested incorporating supplementary exercises to meet match intensities. In reference to these findings, pre-season results seemed to cover these demands. The additional prescription of sprint training may have been a reason for this, which seems to align with current findings that numerous practitioners in professional soccer emphasized that a specific focus on sprinting exercises was perceived as particularly important in preventing injuries. 32 Hence, these results imply that the necessity for adequate sprinting loads seems to be generally accepted and implemented within professional soccer.
The results observed at the player level (question iii) mirrored the team's performance trends for acceleration and sprints. Pre-season acceleration values were consistently higher or at least comparable to match values across all players (see Figure 3(a)), while sprint performance showed no notable differences between pre-season and match conditions for any player (see Figure 3(c)). In contrast, the in-depth analysis of LPI at the player level revealed that team averages for deceleration slightly masked individual-level variations. While some players indeed exhibited significantly lower training loads compared to matches, the majority showed balanced deceleration values across the two periods (see Figure 3(b)). This highlights the importance of individual training monitoring. Previous literature also emphasized the significance of playing positions in influencing running performances. 33 Specifically, when examining high-intensity running, central defenders and central midfielders were found to cover significantly shorter distances in sprints than players in other positions. However, our analysis of the LPI in sprints did not reflect any positional trend, likely due to the insufficient number of players per position, which limited our ability to draw meaningful inferences regarding the differences between playing positions.
Ultimately, the question arises to what extent these results allow conclusions to be drawn as to whether the preseason has adequately prepared the players for the load peaks in competition. The worst-case scenarios are one key component in load management during pre-season, as they enable coaches to prepare athletes for every conceivable scenario, thus the maximal load and all other loads lower than this occurring in matches. 22 Consequently, pre-season is suggested to contain similar, if not (adequately) higher, values for the LPI compared to competition. On the other hand, single load peaks must be distinguished from the total accumulated load of a session or match, as it depicts only a small part of the entire load that players experience. In this context, loads are often mentioned to be too high and consequently harmful during pre-season in professional soccer. 34 Regarding the collected peak values in this study, it is essential to note that the mere surpassing of competition values for specific load peaks may not be interpreted as excessive training loads, as the overall volumes of these sessions need to be taken into account. Nevertheless, applying unnecessarily excessive loads within specific parameters is still putting players at risk, 3 and a reasonable application of upper limits is required to be set by practitioners. Accordingly, the data from this study allow conclusions to be drawn about whether the peak match intensities were achieved during pre-season. In the current literature, no comparable values were found. Therefore, this study is the first that provides a norm value for pre-season Load Peak Intensity in men's professional soccer, which can be used by others in the future.
Discussion of limitations
The results of this study are somehow limited by four main factors. Firstly, the missing documentation of the exact training contents in pre-season. This makes the stated results hardly transferable beyond this framework, as knowledge of these contents would allow practitioners to make more precise inferences on the occurrence of the peak loads in pre-season. Additionally, since the pre-season period contained different requirements for the players depending on the sessions they participated in, no baseline could be set to assure similar framework conditions for included players. For instance, some players might have been absent on training sessions where specific peak intensities were reproduced, distorting the overall picture. A similar irregularity exists for match loads, as it has not been controlled whether players participated in the previous match from which the data was collected, nor has the number of days between consecutive matches been accounted for. Ideally, all players would have absolved the same trainings and matches in order to increase the significance of the collected load peaks during pre-season. However, practitioners must deal with such attendance irregularities in this type of investigation, as they are part of the sport. In this regard, knowledge of the training contents could be used to ensure that included players absolved similar training contents.
Secondly, this study consisted of a small sample size of only eight players. Hence, a higher sample number would provide a more valid and reliable basis for data collection. One possible solution to increase the sample size would be to track competition data over a whole season, as several players fulfilled the pre-season criteria but did not have enough game time within the 12 first matches. Moreover, several teams could be included in order to acquire a higher sample size. However, this approach would require careful analysis and interpretation of results due to the individual differences in technical, tactical, and physical approaches between teams. Documentation and verification of similar training contents and tracking systems would be necessary to compare pre-seasons across teams.
Thirdly, research has shown that running activity in competition is associated with myriads of contextual variables such as the formation of the opponent, 35 playing home or away, 36 red cards, scoreline, 36 environment temperature 37 and seasonal pacing. 28 Since this is a single case study, such factors cannot be controlled and might affect load peak intensity.
Lastly, three different tracking methods were used in this study. Both the semiautomatic camera system (TRACAB) and the LPS (KINEXON) that have been validated in previous research still incorporated slight deviations to their reference systems, and no validation study of the GPS (KINEXON) was available. The different deviations between player tracking systems might also explain the higher CV values detected in this study during pre-season, as both GPS and LPS systems were used during this period. Nevertheless, we think that results were not affected that much. The raw positional data from the different systems were processed in KINEXON's software using the same filters and pre-processing procedures. This should keep the deviations relatively small and not lead to invalid conclusions.
Discussion of practical applications
Based on these findings, practitioners are well advised to integrate targeted drills and scenarios that replicate or surpass the worst-case scenarios observed during matches to better prepare players for these critical demands. In this regard, Deceleration requires special attention, as pre-season values were significantly lower compared to in-season match demands. Due to the variability of load peaks both within and between players, training plans and performance evaluations should not rely on single match peak values but instead incorporate multiple data points to ensure comprehensive and individualized preparation.
Conclusion
The results indicated that pre-season seemed to reach, and in some cases even exceed, the competition demands for the peak intensities in terms of Acceleration for the selected team. Peak deceleration intensity was significantly lower for pre-season training compared to competitions. These are valuable insights in terms of load management, as one primary objective of pre-season training should be the incorporation of similar, if not (adequately) higher, intensities in order to prepare players for the worst-case scenarios of competition. Although the study only deals with one specific team, the results imply that practitioners are especially advised to carefully examine the worst-case scenarios of Deceleration during pre-season to avoid falling short on load requirements. Due to the variability of load peaks within players and between players, practitioners are advised not to rely on single match peak values for training conception and to differentiate the worst-case scenarios regarding playing positions.
Footnotes
Acknowledgements
Acknowledgments go to KINEXON (KINEXON Sports & Media GmbH) esp. Paul Niehaus for providing the data and institutional support.
Author contributions
NL contributed to the study's conception and design, worked on data processing and analysis, and partly wrote the manuscript. DL contributed to the conception and partly wrote the manuscript.
Data availability statement
Raw data were generated at KINEXON (KINEXON Sports & Media GmbH). Derived data supporting the findings of this study are available from the corresponding author on reasonable request.
Declaration of conflicting interests
The authors declared no potential conflicts of interest with respect to the research, authorship, and/or publication of this article.
Ethics approval and consent to participate
All participants agreed to data collection and analysis by signing their contract with the professional football club. Therefore, special approval from an ethics committee for this study was not required. Nevertheless, all procedures performed in the study were in strict accordance with the Declaration of Helsinki as well as with the ethical standards of the local ethics committee. To ensure confidentiality, the team's and the players’ names were anonymized.
Funding
The authors disclosed receipt of the following financial support for the research, authorship, and/or publication of this article: The publication of this study was supported by the German Research Foundation (DFG,