
Abstract
It has recently been identified that the assessment of peak periods of activity better considers the stochastic nature of match-play and the influence that contextual factors have on these peak periods. Limited research exists attempting to link the tactical and physical aspects of performance, especially in female players. Therefore, the current study aimed to assess post-goal locomotor patterns and positional differences on peak match demands in elite female soccer players. Using 10 Hz global positioning system units, a total of 133 player match observations were recorded from 14 matches played by an elite Scottish women's professional soccer team. The total distance (TD), high-speed running distance (>18 km/h) (HSRD) and PlayerLoad™ (PL) were assessed for 1, 3 and 5-minute peak periods using a rolling epoch approach. Playing position and post-goal activity were used as modulating factors. Linear mixed models established a main effect for playing position for the HSRD at peak 1-minute (p<.001), 3-minute (p < .001) and 5-minute (p < .001) epochs. There were also main effects for the playing position for TD at peak 1-minute (p= .001) and PL at peak-3minute (p = .002). Team-level data showed a main effect for condition (score vs. concede) for 3-minute TD data and main effects for time (pre vs. post) for 1,3 and 5-minute epochs for PL data. The average and peak values were shown to differ across playing positions for all variables. Likewise, potentially indicative of tactical adjustments significant differences were observed at both a team and player level following scoring or conceding a goal.
Introduction
There has been an exponential increase in the popularity and professionalism of women's soccer in recent years; however, there remains a lack of scientific evidence regarding elite female players, with the demand for knowledge outpacing the empirical evidence base. 1 An improved understanding of the intermittent physical demands of elite female match-play is fundamental for practitioners and coaches to aid the development of appropriate and specific training strategies, consistent with the ever-changing physical requirements of the match.2,3 To date, physical match-play research within women's soccer has largely focused on describing the volume, intensity and activity patterns of players primarily via a number of external load metrics. 4 Arguably the most frequently cited physical performance metric, total distance (TD) covered, provides a global representation of the volume of activity, with elite senior players typically covering a TD of 9–11 km, which equates to a movement rate of 100–120 m/ minute. 5 Although TD provides a broad estimation of overall movement demands, the ability to perform, repeat and maintain high-intensity activity is deemed to be of greater importance, i.e. the volume of high-speed and/or maximal speed running. 1 High-speed running distance (HSRD) typically accounts for ∼7.5% of total match activity 6 and was positively correlated with team success at the 2019 FIFA Women's World Cup. 7
Match physical performance has traditionally been evaluated in terms of whole match or segmental analyses (i.e. 90, 45 or 15 minutes). However, whilst this approach provides a holistic overview of the physical match demands, it fails to capture the stochastic nature of match-play and may underestimate the true match-play demands. 8 The now widespread use of contemporary technologies such as global positioning system (GPS) and micro-electrical mechanical system (MEMS) devices has enabled researchers and practitioners to more easily analyse short-duration epochs (i.e. < 10 minutes) to identify the peak periods of match-play activity. 8 Peak periods represent the most physically demanding period of a match, for a given variable, across a pre-determined time period. Initially, peak periods were identified using a fixed epoch approach, using discrete pre-determined time periods (e.g. 0–3, 3–6, 6–9 minutes). Recently, however, research has identified a rolling epoch approach (e.g. 0–3, 1–4, 2–5 minutes) provides a more accurate representation of physical performance characteristics.2,9,10 Identifying these peak periods may provide informative data for load monitoring, training prescription and training periodisation 2 as well as talent identification and development. Indeed, peak periods are typically considered in epochs of 1–10 minutes, which promotes the translational value for practitioners as these durations align with those commonly used in conditioning-based drills. 11 However, it is worth noting that when identifying these intense bouts of physical activity, both locomotor variable(s) and accelerometry data should be considered alongside contextual factors in an attempt to estimate the true peak demand. 12
The physical activity profiles of players during match-play are undoubtedly influenced by the surrounding and ever-changing contextual factors. As such, the analysis and evaluation of physical match data should seek to accommodate and develop an improved understanding of the extent to which these contextual factors impact upon high-intensity phases of play, 12 especially in relation to key events, such as goal-scoring. 13 Preliminary research in women's soccer has found the contextual factors of playing position and match half (i.e. 1st versus 2nd half) have an influence on peak match-play demands. 14 However, findings relating to match outcome in both men and women's soccer are unclear.14,15 This could be a result of the match outcome not always being reflective of the whole game, in which the evolving match status (e.g. score line) is likely to influence players’ physical match-play demands. Ultimately, scoring or conceding a goal is a defining moment in a game and therefore identifying the locomotor patterns around this event will provide a more granular depiction of the match. 16 Research using overall match performance data has suggested teams who are winning may reduce their work-rate; however, losing teams may initially increase their work-rate but are then unable to sustain this increase. 17 As yet, post-goal activity has not been considered within the peak match demands literature in either male or female players. To date, few studies have considered peak periods in female match-play and only one study 14 has considered contextual factors beyond that of playing position. Data cannot simply be extrapolated from male soccer and applied to the women's game, 18 due to the unique demands of women's match-play. Therefore, the need for contemporary match-play research among the elite female population is necessary. Consequently, the aims of the study were to investigate: (a) the positional demands and (b) post-goal locomotor patterns, on peak match demands in elite female soccer players.
Materials and methods
Participants
A total of 19 professional female soccer players (age: 23 ± 2 years; stature: 1.66 ± 0.3 m, body mass: 61.3 ± 3.6 kg) participated in the study. All participants played for a Scottish professional soccer team, which competed in the UEFA Women's Champions League and the Scottish Women's Premier League 1 (SWPL1). The team played a 3–4–3 system and participating outfield players were categorised according to playing position: central defenders (CD), central defensive midfielders (CDM), central attacking midfielders (CAM), wide midfielders (WM) and forwards (F). Goalkeepers were excluded from the study due to their differing match-play activity profile. The study received institutional ethical approval, and player and gatekeeper consent was given for the data to be used for research purposes. All data were anonymised prior to analysis to ensure player confidentiality.
Study design
A cohort observational study design was adopted. Physical match-play characteristics were collected using 10 Hz GPS devices with incorporated MEMS technology via 100 Hz triaxial accelerometers (Vector, Catapult Sports, Melbourne, Australia). Data were collected from 14 matches during the 2021–22 domestic SWPL1 season. Match location included home (n = 7) and away (n = 7), match outcomes included wins (n = 11), draws (n = 2) and losses (n = 1). A total of 133 full-match (i.e. 90-minute) player observations were obtained (mean full-match observations per player = 7.4 ± 2.7; range = 3 to 13).
Procedures
According to recommended procedures, 19 GPS devices were harnessed between the scapulae in tight-fitting neoprene garments and each player was assigned their own individual device for the duration of the study. Devices were activated at least 30 minutes prior to commencement of the match to provide sufficient time for satellite connectivity. All matches were preceded by a 30-minute standardised warm-up consisting of dynamic stretching, straight-line and multidirectional running, and technical, possession-based ball-work.
The external load metrics chosen for analysis were relative TD, HSRD (>18 km/h), and PlayerLoad™ (PL). These metrics were chosen to provide a global appreciation of volume, intensity and whole-body mechanical load, respectively. 20 Furthermore, TD and HSRD are two of the most common metrics utilised by practitioners 21 and are commonly conveyed in technical reports from major international competitions.
Thresholds were set in accordance with recent research in elite female soccer players. 22 The minimum effort duration, i.e. the ‘dwell time’ was set at 0.4 seconds.
Despite the known between-game 23 variance in the physical demands of female soccer match-play, the GPS and MEMS technology (Vector, Catapult Sports) have been shown to be reliable and valid when measuring distance, peak velocity and average acceleration during standardised team sport activities. 24 To ensure quality assurance, data were visually inspected to confirm a complete datafile and there were no irregularities (i.e. data spikes) generated from the device itself. 19
Data was downloaded post-match using Openfield software (Catapult Sports, Melbourne, Australia) and then exported to Microsoft Excel for subsequent analysis. For each of the given variables, 1-, 3- and 5-minute peak periods were calculated using a rolling epoch approach. Rolling epochs were calculated using rolling averages from the minute-by-minute 90-minute physical match profiles (e.g. 3-minute splits: 1–3, 2–4, 2–5, etc.). 2 In addition, following the scoring or conceding of a goal, 1-, 3- and 5-minute epochs were also calculated for each variable, with the post-goal epoch starting from the subsequent minute after which the goal was scored. If a goal was scored within 5 minutes of the first goal being scored, the data were removed from the sample.
The contextual factors of interest were playing position and post-goal activity pattern. The data were classified accordingly to allow each contextual factor to be examined separately. Outfield players were categorised according to playing position and in total there were 37 full-match observations for CD, 28 for CDM, 26 for CAM, 28 for WM and 14 for F. For the post-goal analysis, there were 48 instances of a goal being scored and 11 instances of a goal being conceded.
Statistical analysis
To examine the effects of playing position and context of first goal on each dependent variable (DV) across three time epochs, we used the following linear mixed-effects model:

Results
Positional differences: peak values
The time-distribution frequencies for peak values are reported in Figure 1. There was a main effect for position for peak 1-minute HSRD (p< .001) and TD (p = .001) values; however, there was no significant main effect for position for the peak 1-minute PL (p = .05) values (Table 1). Post-hoc analysis revealed that WM and F peak 1-minute HSRD values were significantly greater than CD values, while CAM, WM and F peak 1-minute values were significantly greater than CDM values. In addition, only WM peak 1-minute TD values were significantly greater than both CD and CDM values (Table 1).
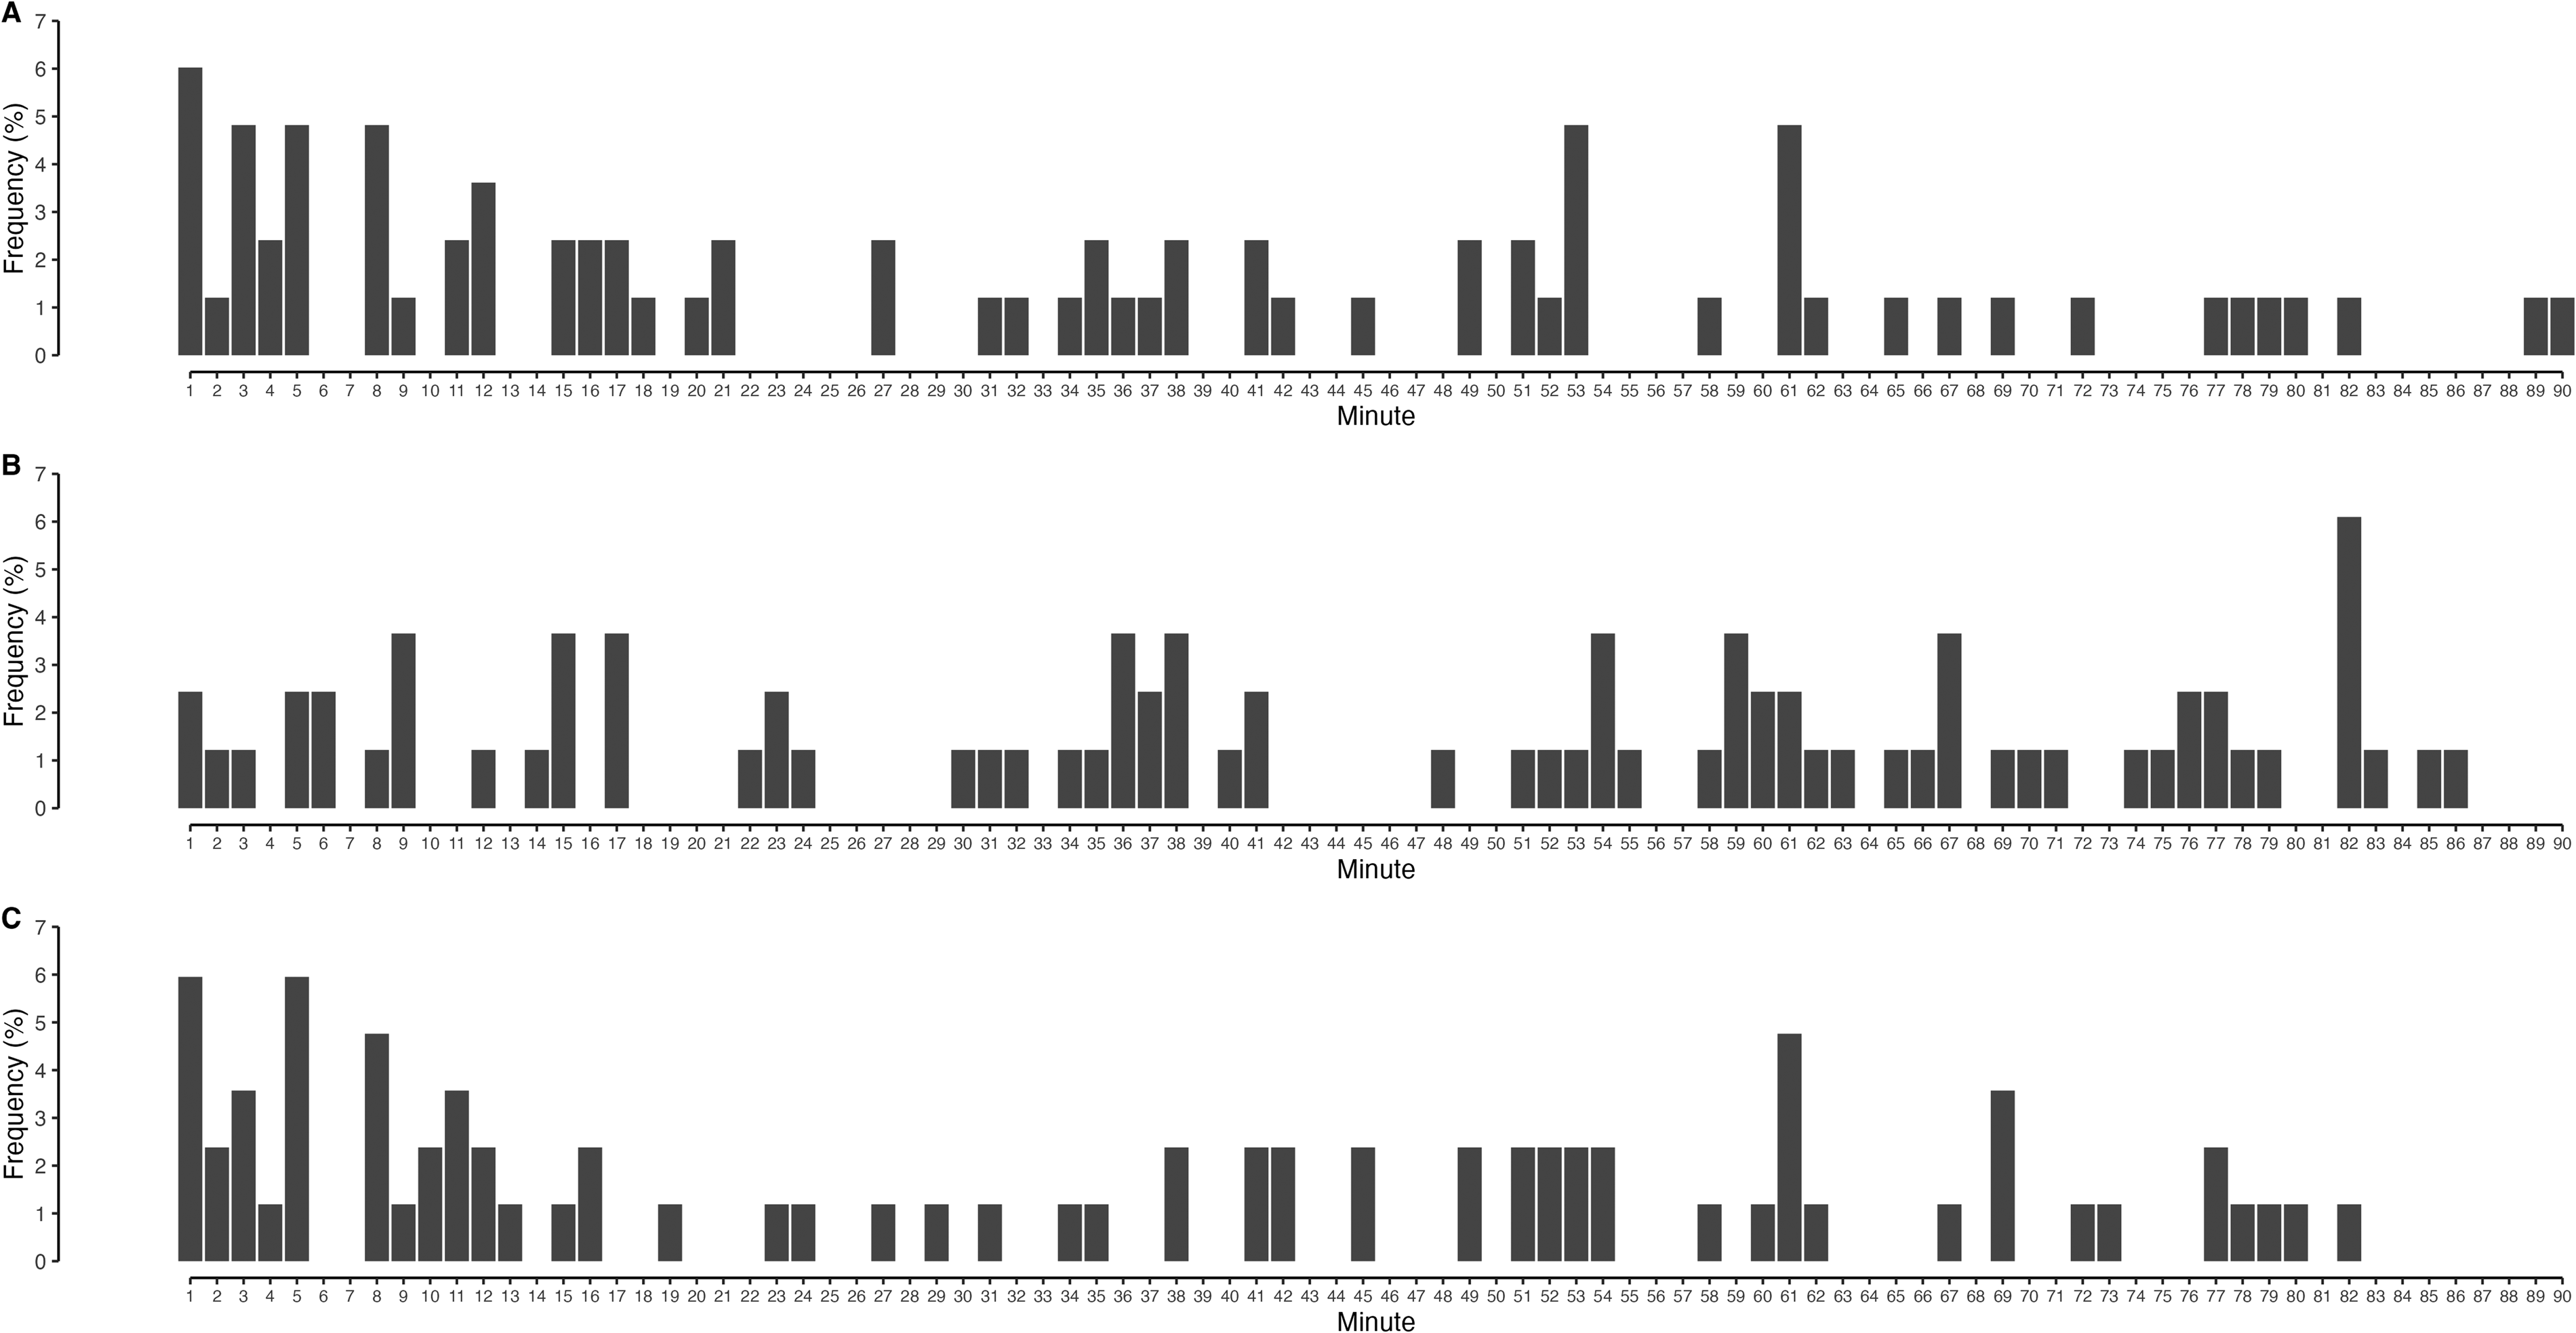
Time-distribution frequencies for the peak occurrences of (a) TD, (b) HSRD and (c) PL.
Position-specific values for TD, HSRD and PL across 1-, 3- and 5-minute epochs: peak values.
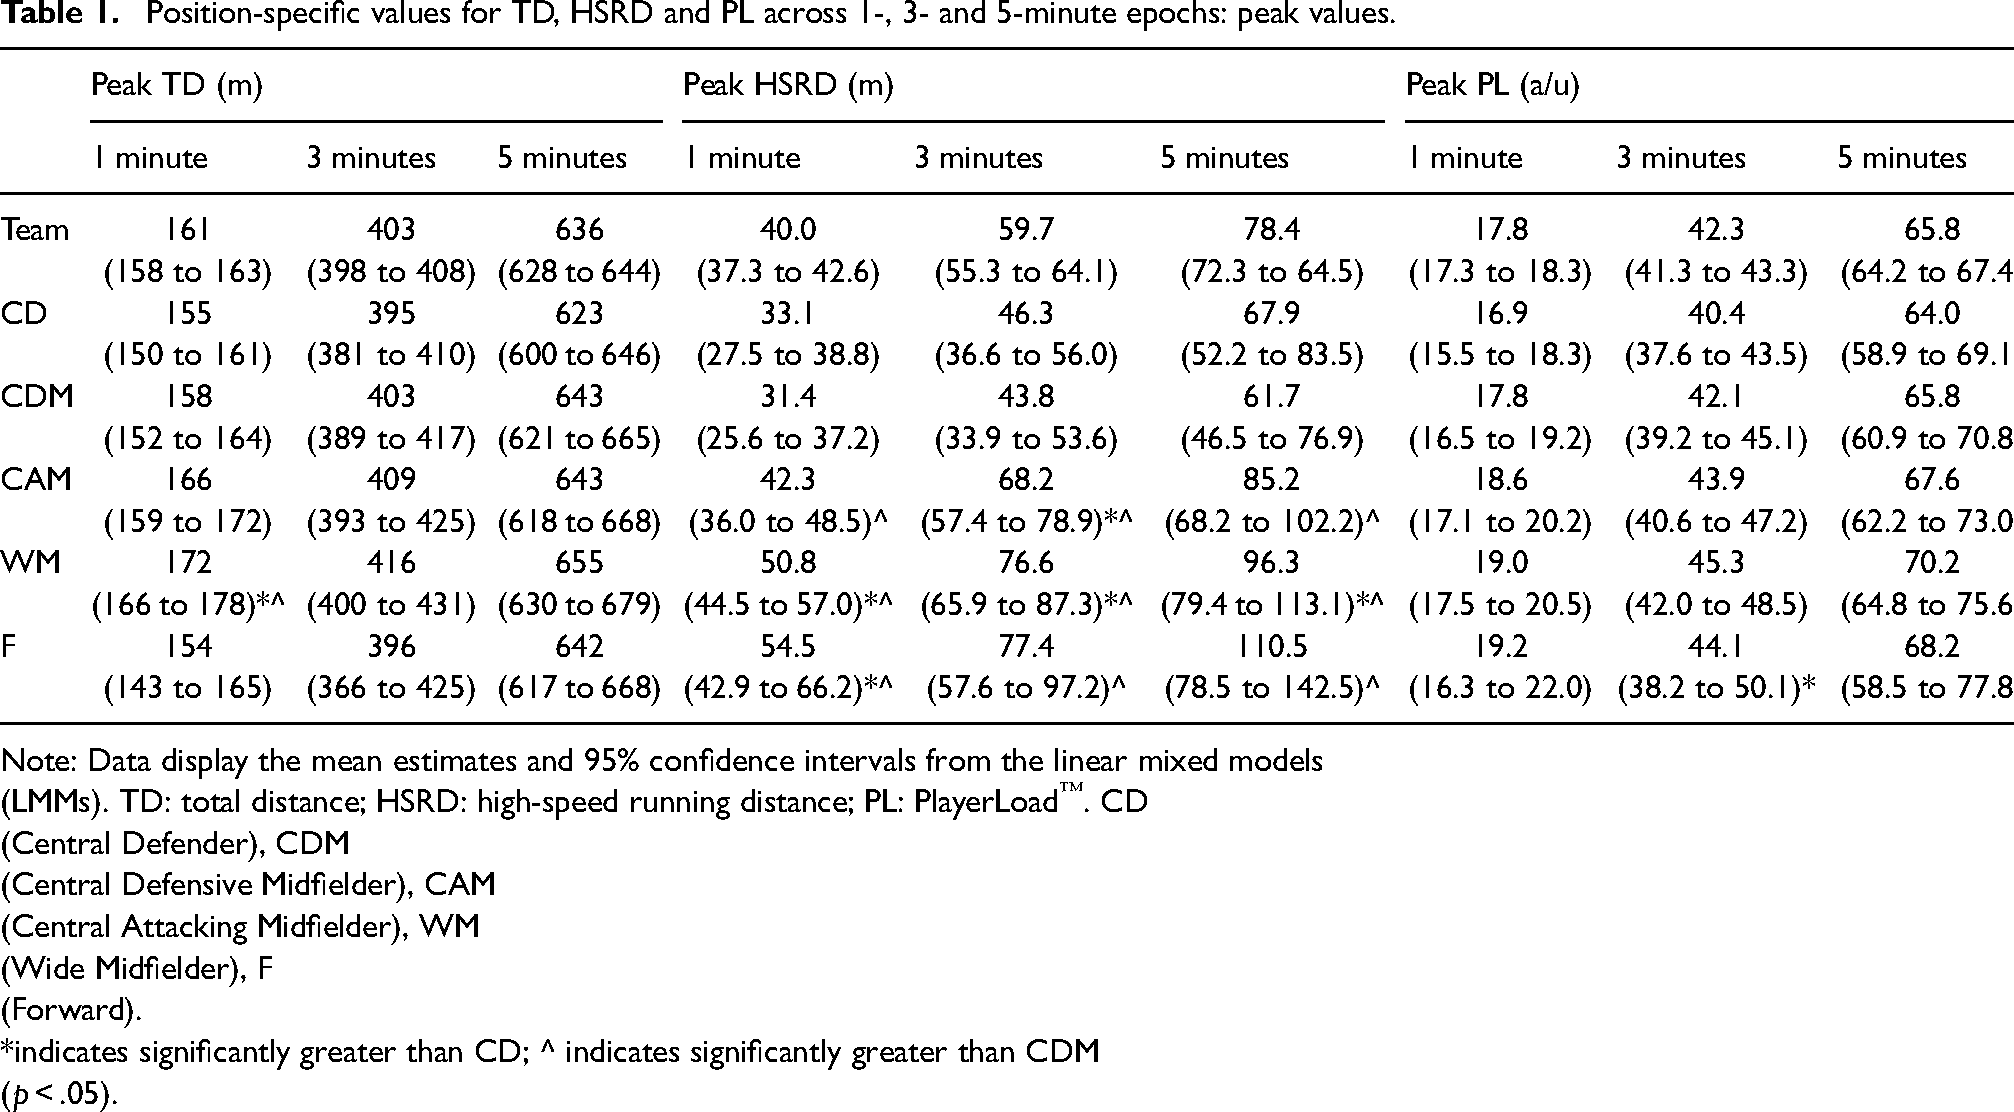
Note: Data display the mean estimates and 95% confidence intervals from the linear mixed models (LMMs). TD: total distance; HSRD: high-speed running distance; PL: PlayerLoad™. CD (Central Defender), CDM (Central Defensive Midfielder), CAM (Central Attacking Midfielder), WM (Wide Midfielder), F (Forward).
*indicates significantly greater than CD; ^ indicates significantly greater than CDM (p < .05).
There was a main effect for position for peak 3-minute HSRD (p < .001) and PL (p = .002) values; however, there was no significant main effect for position for the peak 3-minute TD (p = .124) values (Table 1). Post-hoc analysis revealed that WM and CAM peak 3-minute HSRD values were significantly greater than CD values, while CAM, WM and F peak 3-minute values were significantly greater than CDM values. Post-hoc analysis also revealed that only F peak 3-minute PL values were significantly greater than CD values (Table 1).
There was a main effect for position for peak 5-minute HSRD (p < .001), but there was no significant main effect for position for peak 5-minute TD (p = .095) or PL (p = .091) values (Table 1). Post-hoc analysis revealed that only WM peak 5-minute HSRD values were significantly greater than CD values, while CAM, WM and F peak 5-minute values were significantly greater than CDM values (Table 1).
Positional differences: match average values
There was a main effect for position for match average 1-minute HSRD (p < .001), TD (p = .005) and PL (p = .001) values (Table 2). Post-hoc analysis revealed that WM and CAM match average 1-minute HSRD values were significantly greater than both CD and CDM values, while only WM match average 1-minute TD and PL values were significantly greater than CD values (Table 2)
Position-specific values for TD, HSRD and PL across 1-, 3- and 5-minute epochs: match average values.
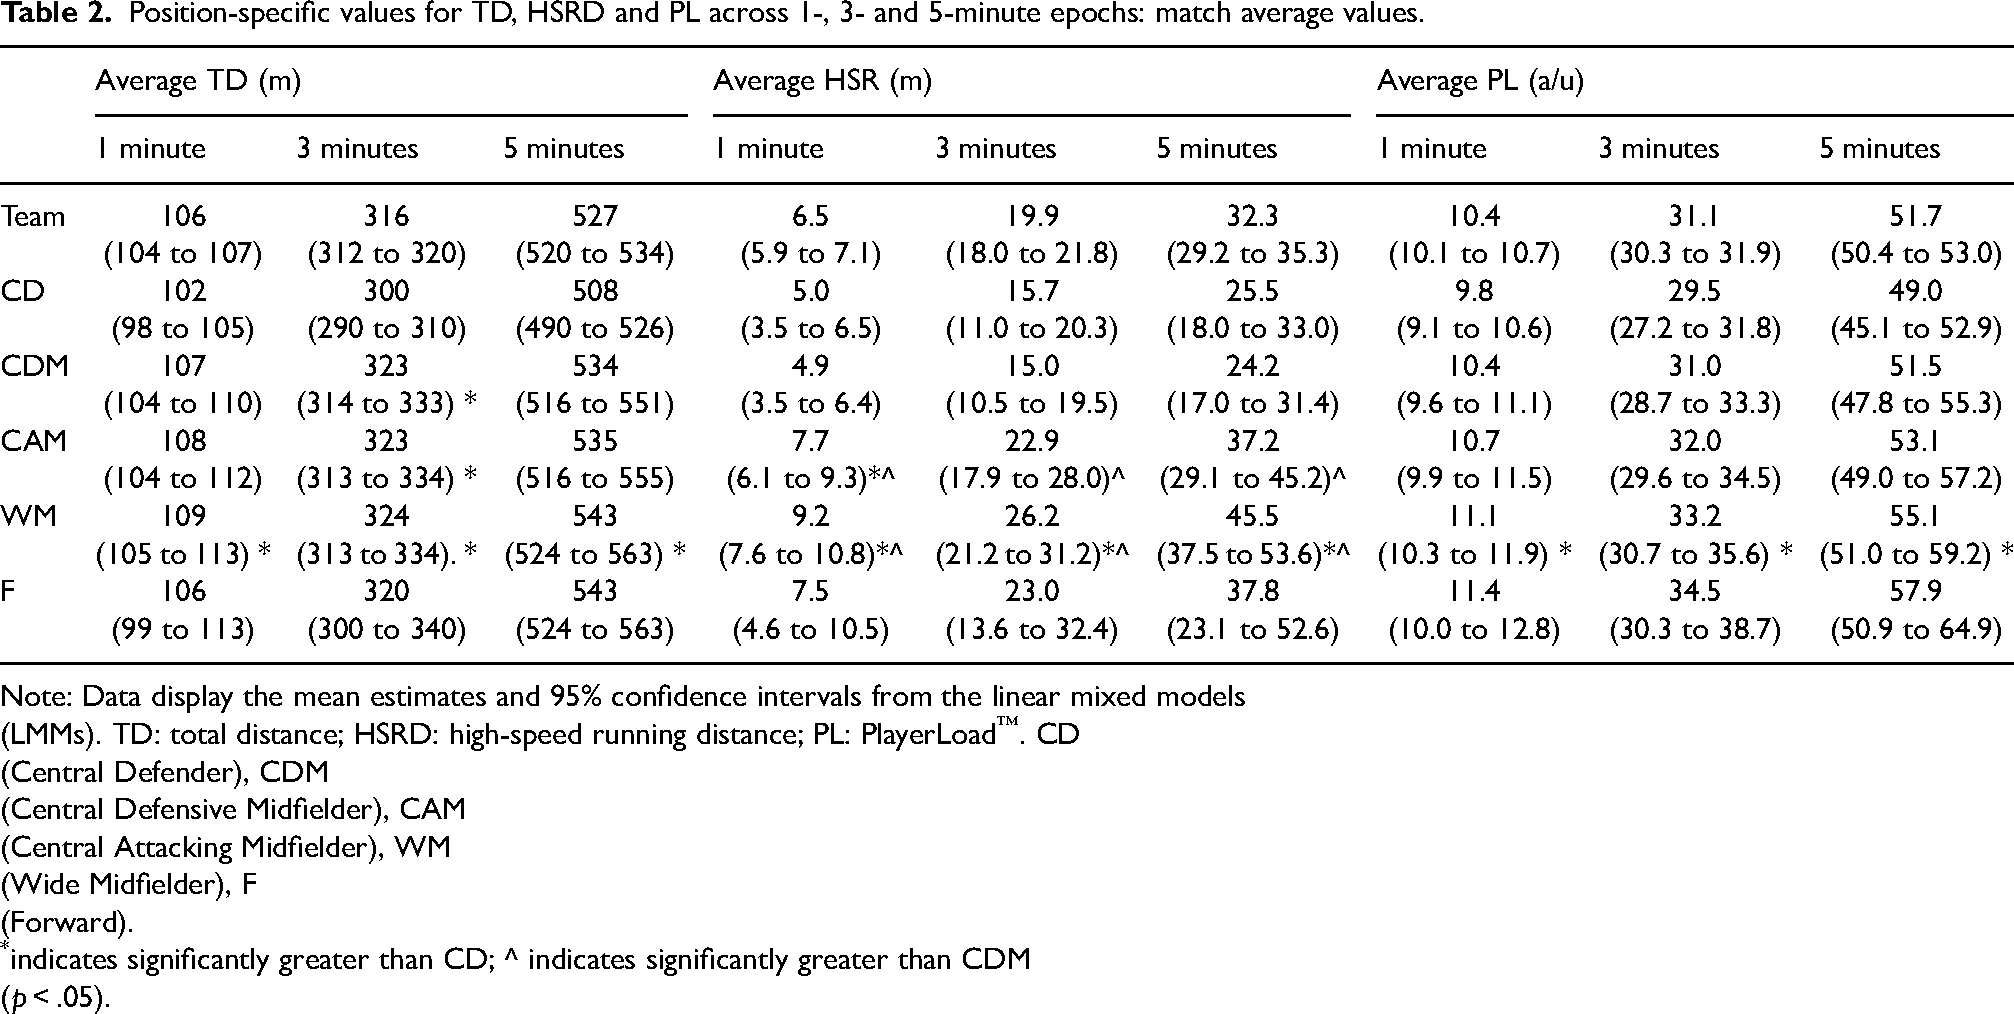
Note: Data display the mean estimates and 95% confidence intervals from the linear mixed models (LMMs). TD: total distance; HSRD: high-speed running distance; PL: PlayerLoad™. CD (Central Defender), CDM (Central Defensive Midfielder), CAM (Central Attacking Midfielder), WM (Wide Midfielder), F (Forward).
indicates significantly greater than CD; ^ indicates significantly greater than CDM (p < .05).
There was a main effect for position for match average 3-minute HSRD (p < .001), TD (p < .001) and PL (p = .002) values (Table 2). Post-hoc analysis revealed that WM match average 3-minute HSRD values were significantly greater than CD values and that both CAM and WM match average 3-minute values were significantly greater than CDM values. Post-hoc analysis of match average 3-minute TD revealed CDM, CAM and WM values to be significantly greater than CD values. In addition, WM match average 3-minute PL values were significantly greater than CD values (Table 2).
There was a main effect for position for match average 5-minute HSRD (p < .001), TD (p = .008) and PL (p = .001) values (Table 2). Post-hoc analysis revealed that WM match average 5-minute HSRD values were significantly greater than CD values, and that both CAM and WM match average 5-minute values were significantly greater than CDM values. In addition, WM match average 5-minute TD and PL values were revealed to be significantly greater than CD values (Table 2).
Post-goal locomotor patterns
The time distribution frequencies for goals scored and conceded are reported in Figure 2. There was a significant position by time (pre vs. post first goal) interaction for the HSRD 1-minute (p = .001) and 5-minute (p = .006) epochs, irrespective of whether a goal was scored or conceded. In addition, team-level data revealed no main effects for time (Tables 3 and 5 and Figure 3(a)). Analysis by position revealed a significant increase, from pre to post, in 1-minute HSRD values for CAM after scoring the first goal, whereas F revealed a significant decrease, from pre to post, for both 1- and 5-minute HSRD values when either scoring or conceding the first goal (Tables 3–5). No significant interactions for the 1-minute, 3-minute or 5-minute TD data were identified (Tables 3–5). Team-level data, however, revealed a main effect for condition (score vs. concede) for 3-minute TD data, with higher TD values recorded after a goal was conceded (Figure 3(b)). Finally, there was a significant position by time (pre vs. post) interaction for the PL 1-minute (p = .036), 3-minute (p = .032) and 5-minute (p = .028) epochs (Tables 3 – 5). In addition, team-level data revealed a main effect for time (pre vs. post) for 1-, 3- and 5-minute epochs, with a significant decrease after the instance of a goal, irrespective of whether they scored or conceded (Tables 3–5). Analysis by position revealed a significant decrease for F, from pre to post, for 1-, 3- and 5-minute PL values, irrespective of scoring or conceding the first goal (Tables 3–5). Overall, for all epochs (1, 3 and 5 minutes) and metrics (TD, HSRD and PL), linear mixed model analysis revealed no interactions for position and time, dependent on whether a goal was scored or conceded.
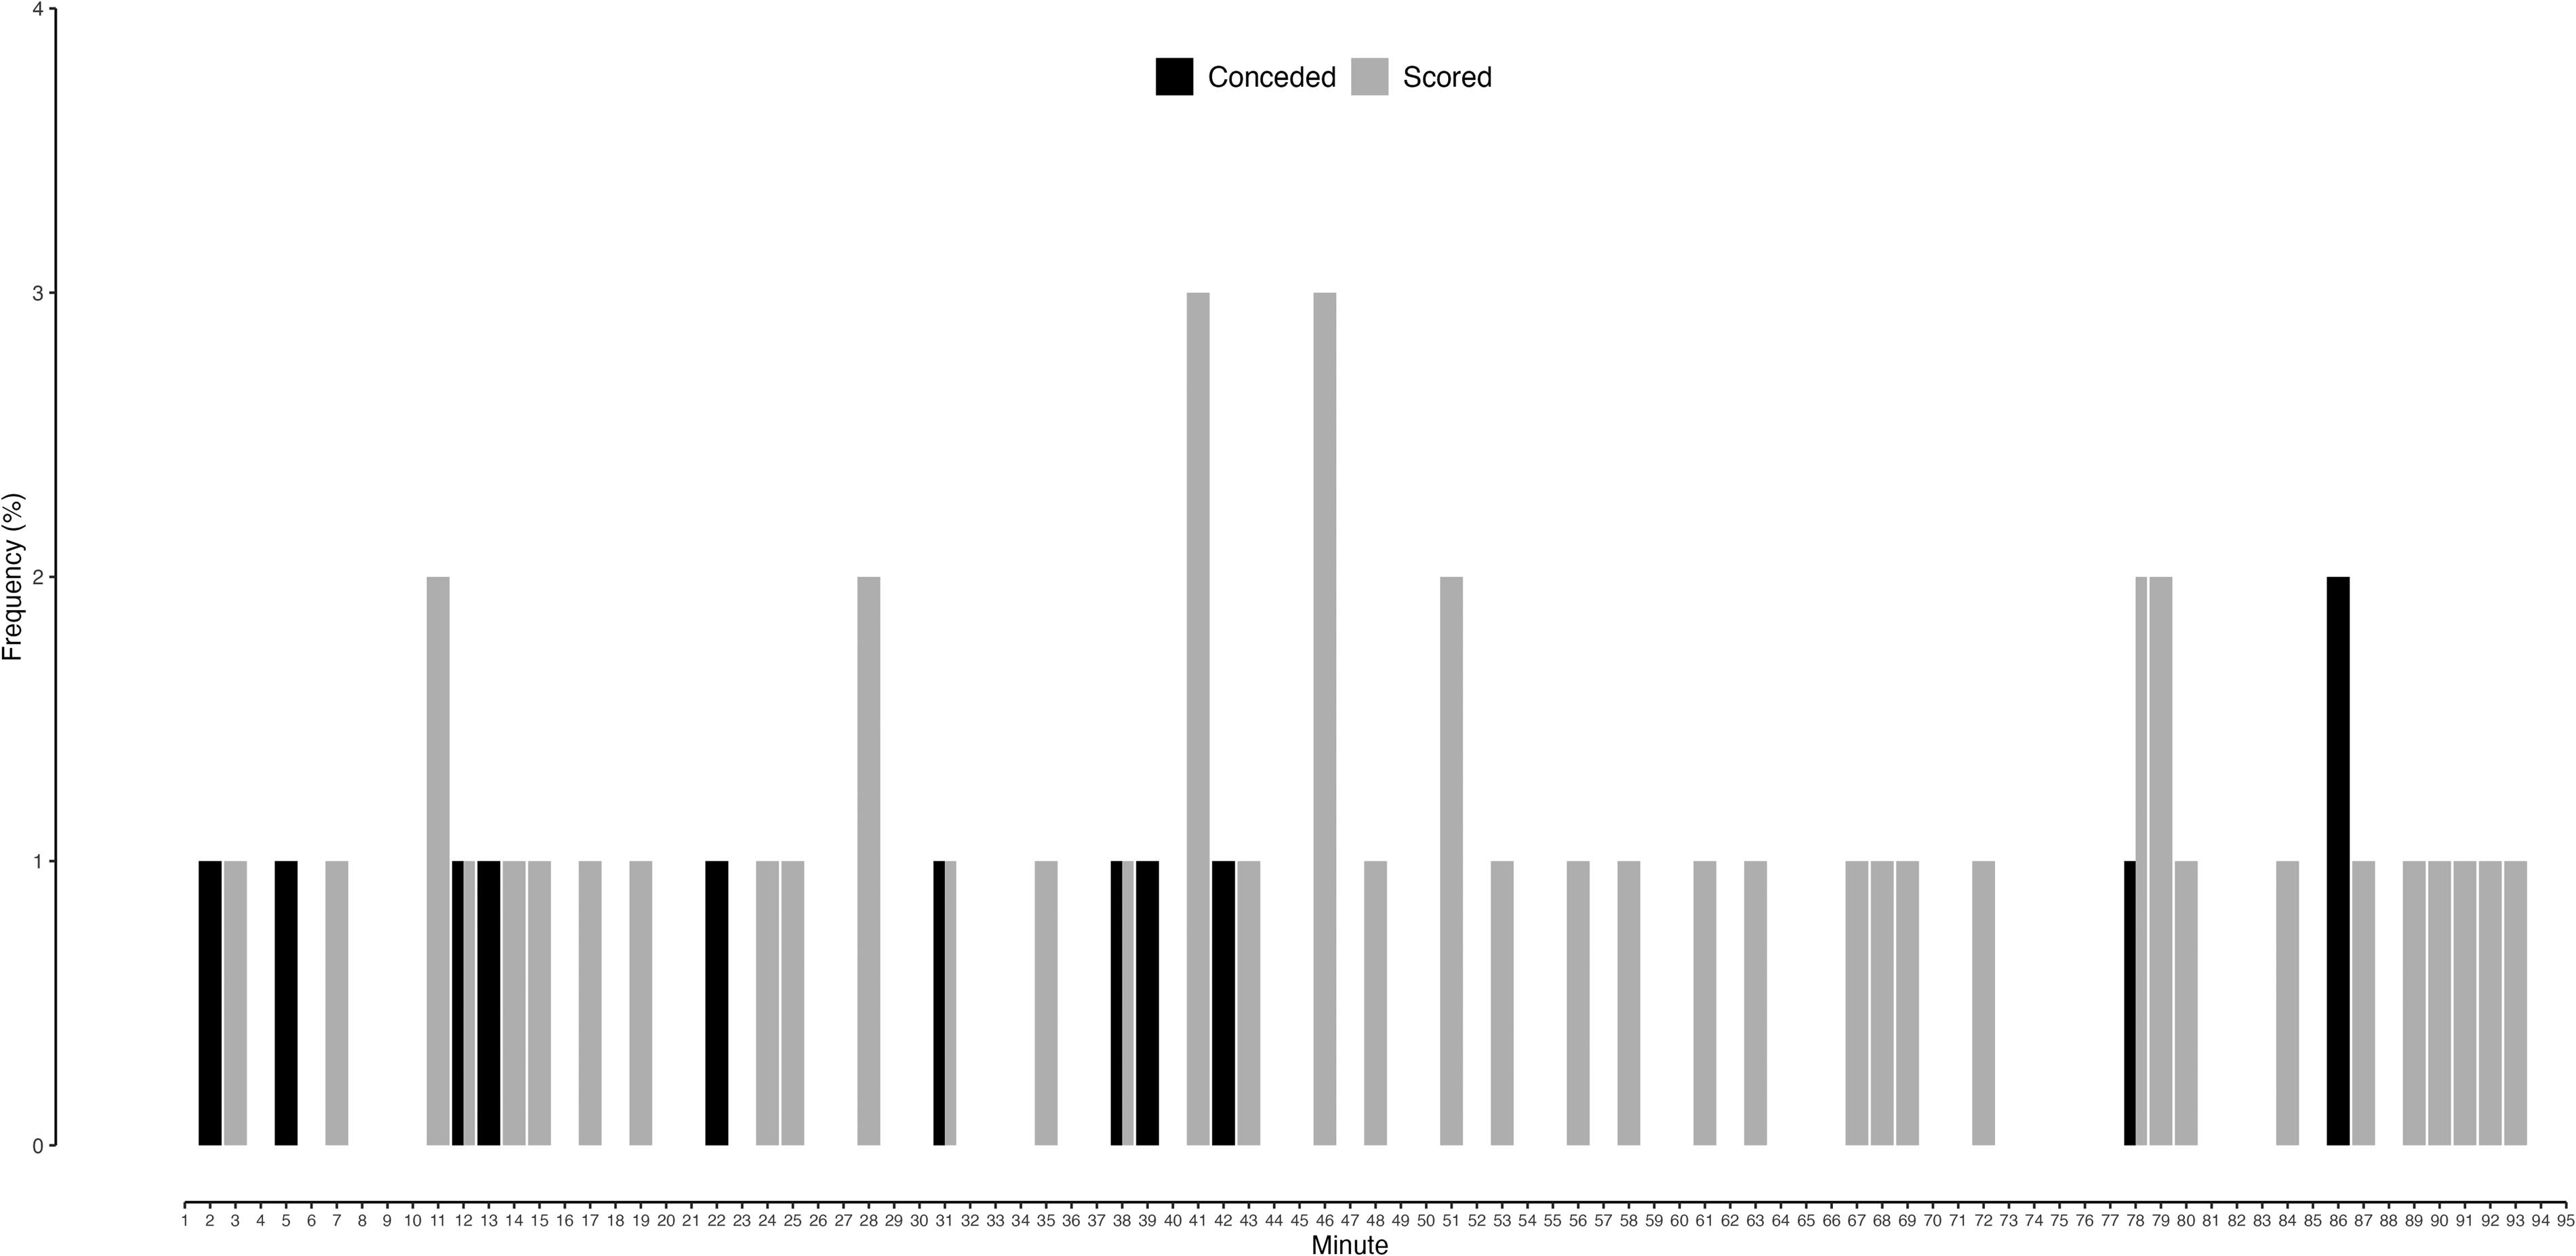
Time-distribution frequencies for the goals scored and conceded.
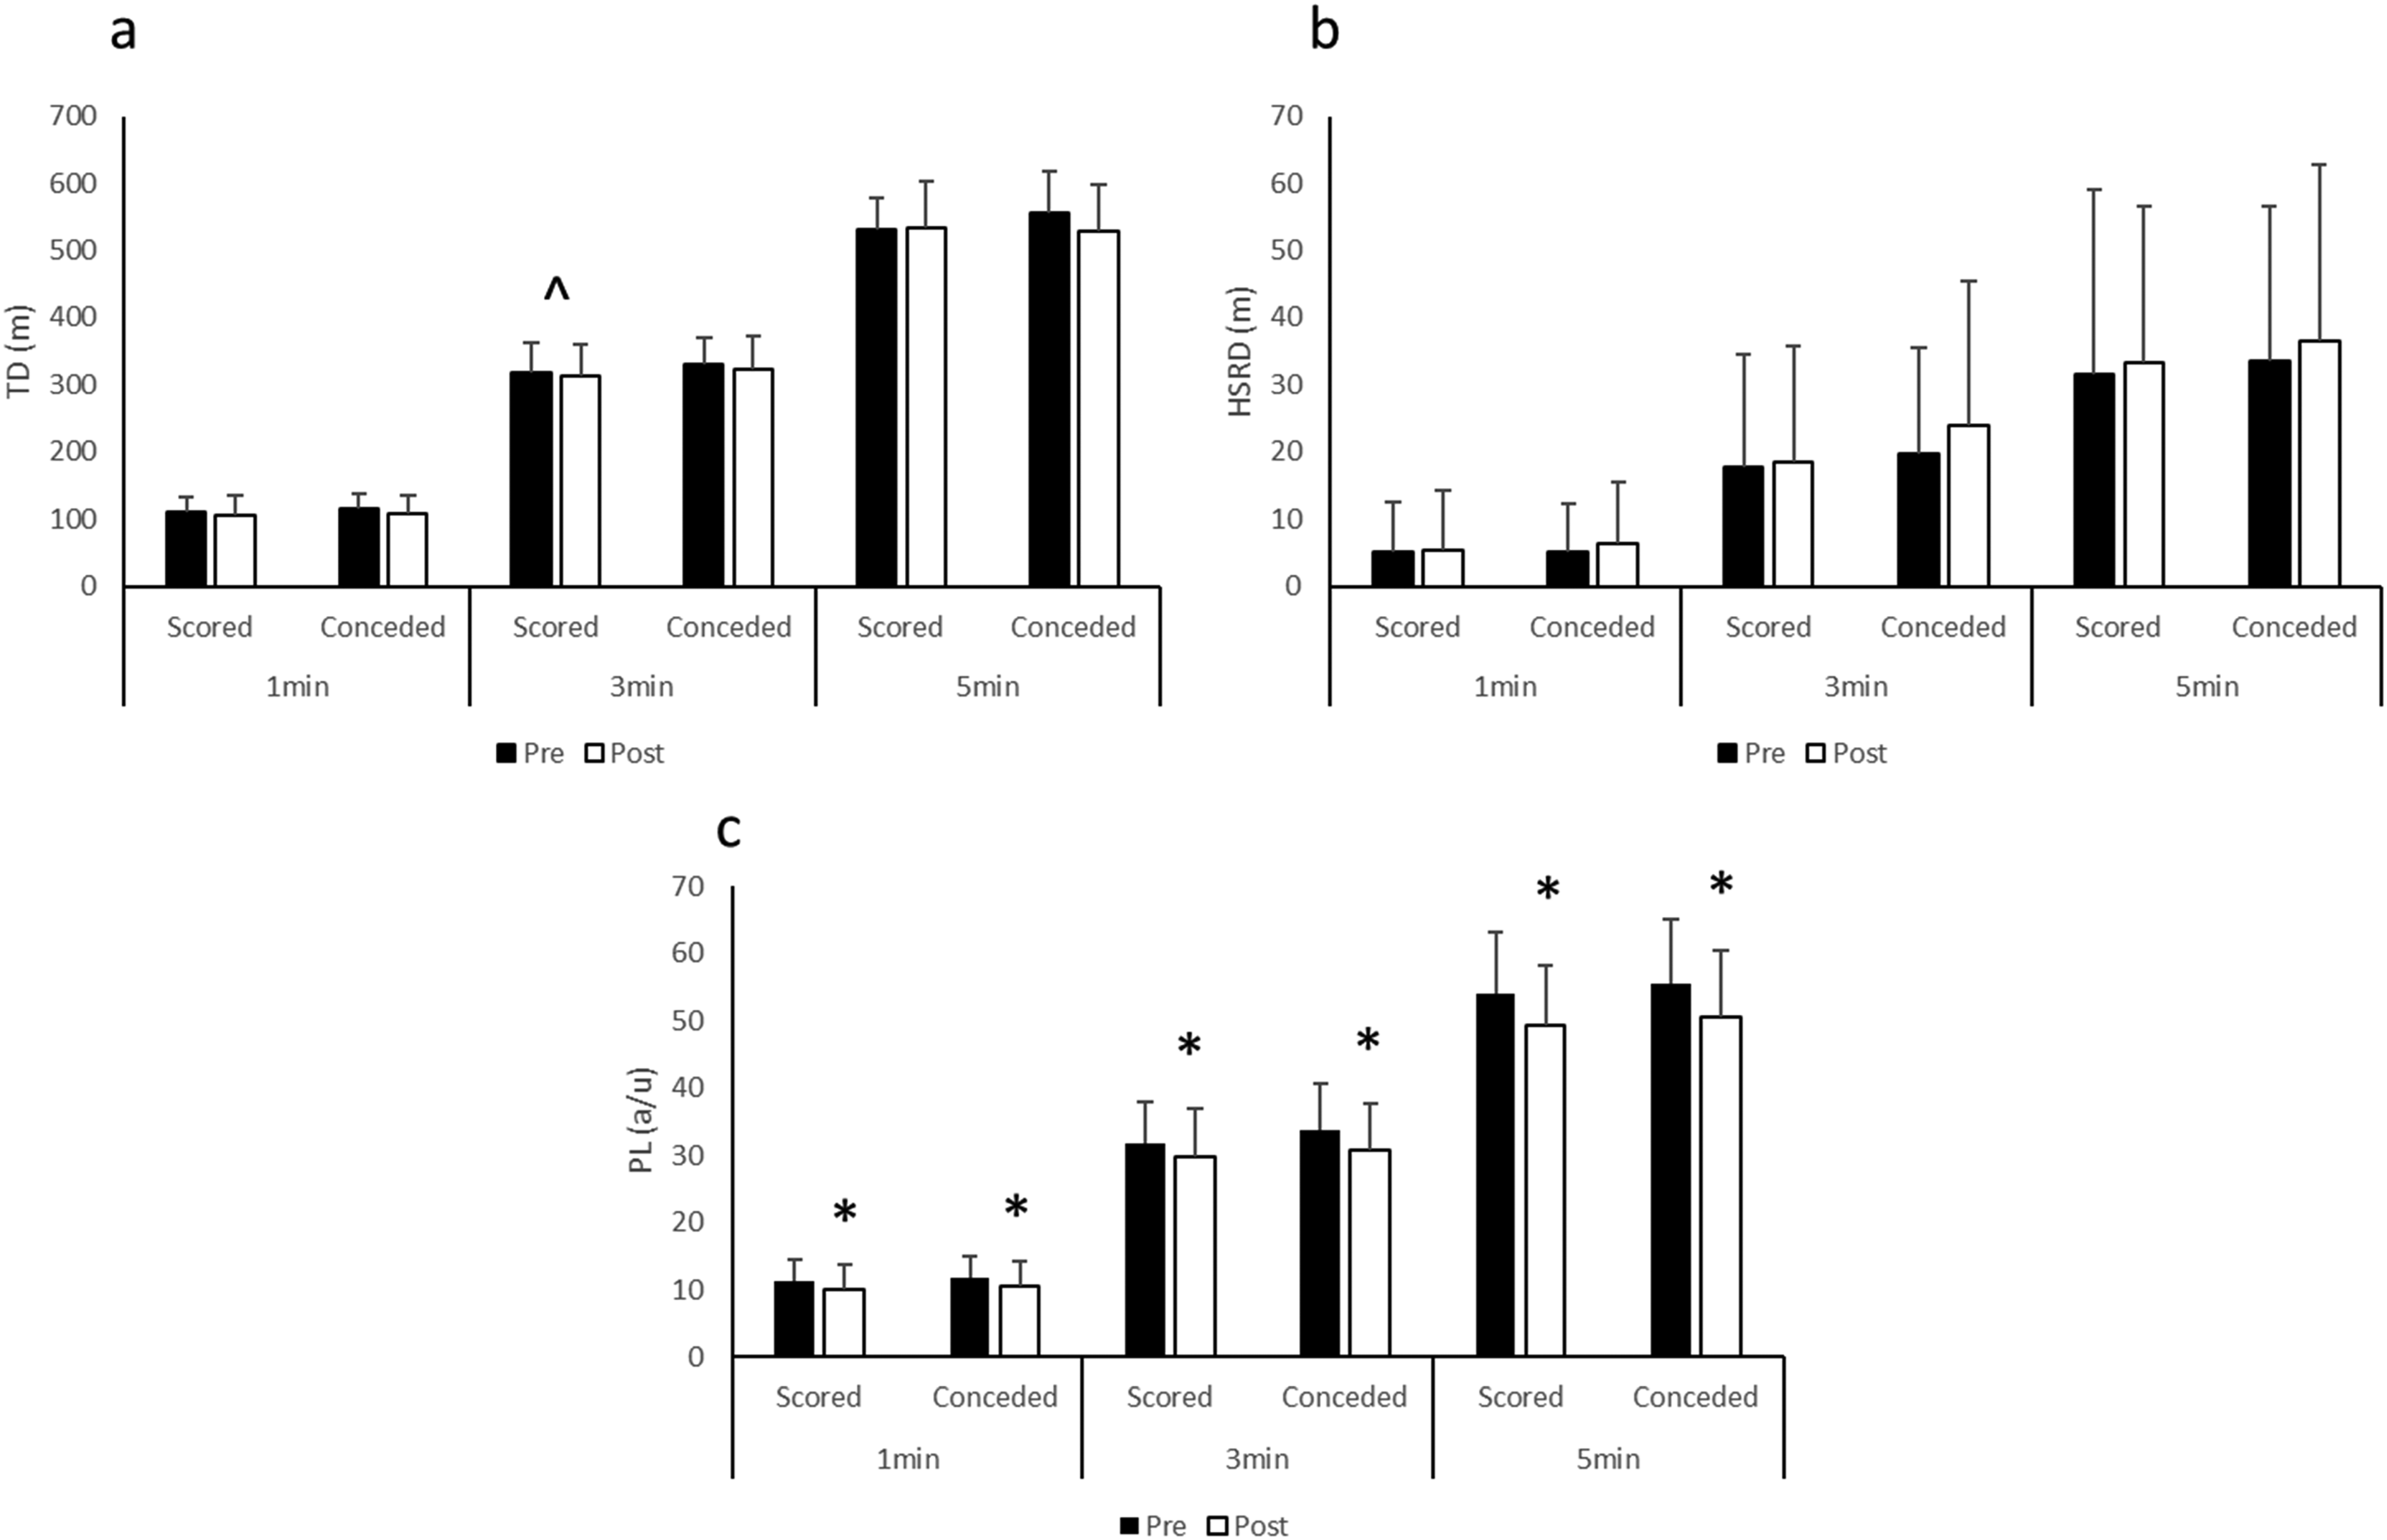
Team values for (a) TD, (b) HSRD and (c) PL when scoring or conceding the first goal during competitive match-play during 1 minute, 3 minute and 5 minute epochs. * denotes significantly less than pre-values; ^ denotes significantly less than the conceded values.
Position-specific values for TD, HSRD and PL when scoring or conceding the first goal during competitive match-play, considering the epoch length: 1 minute.
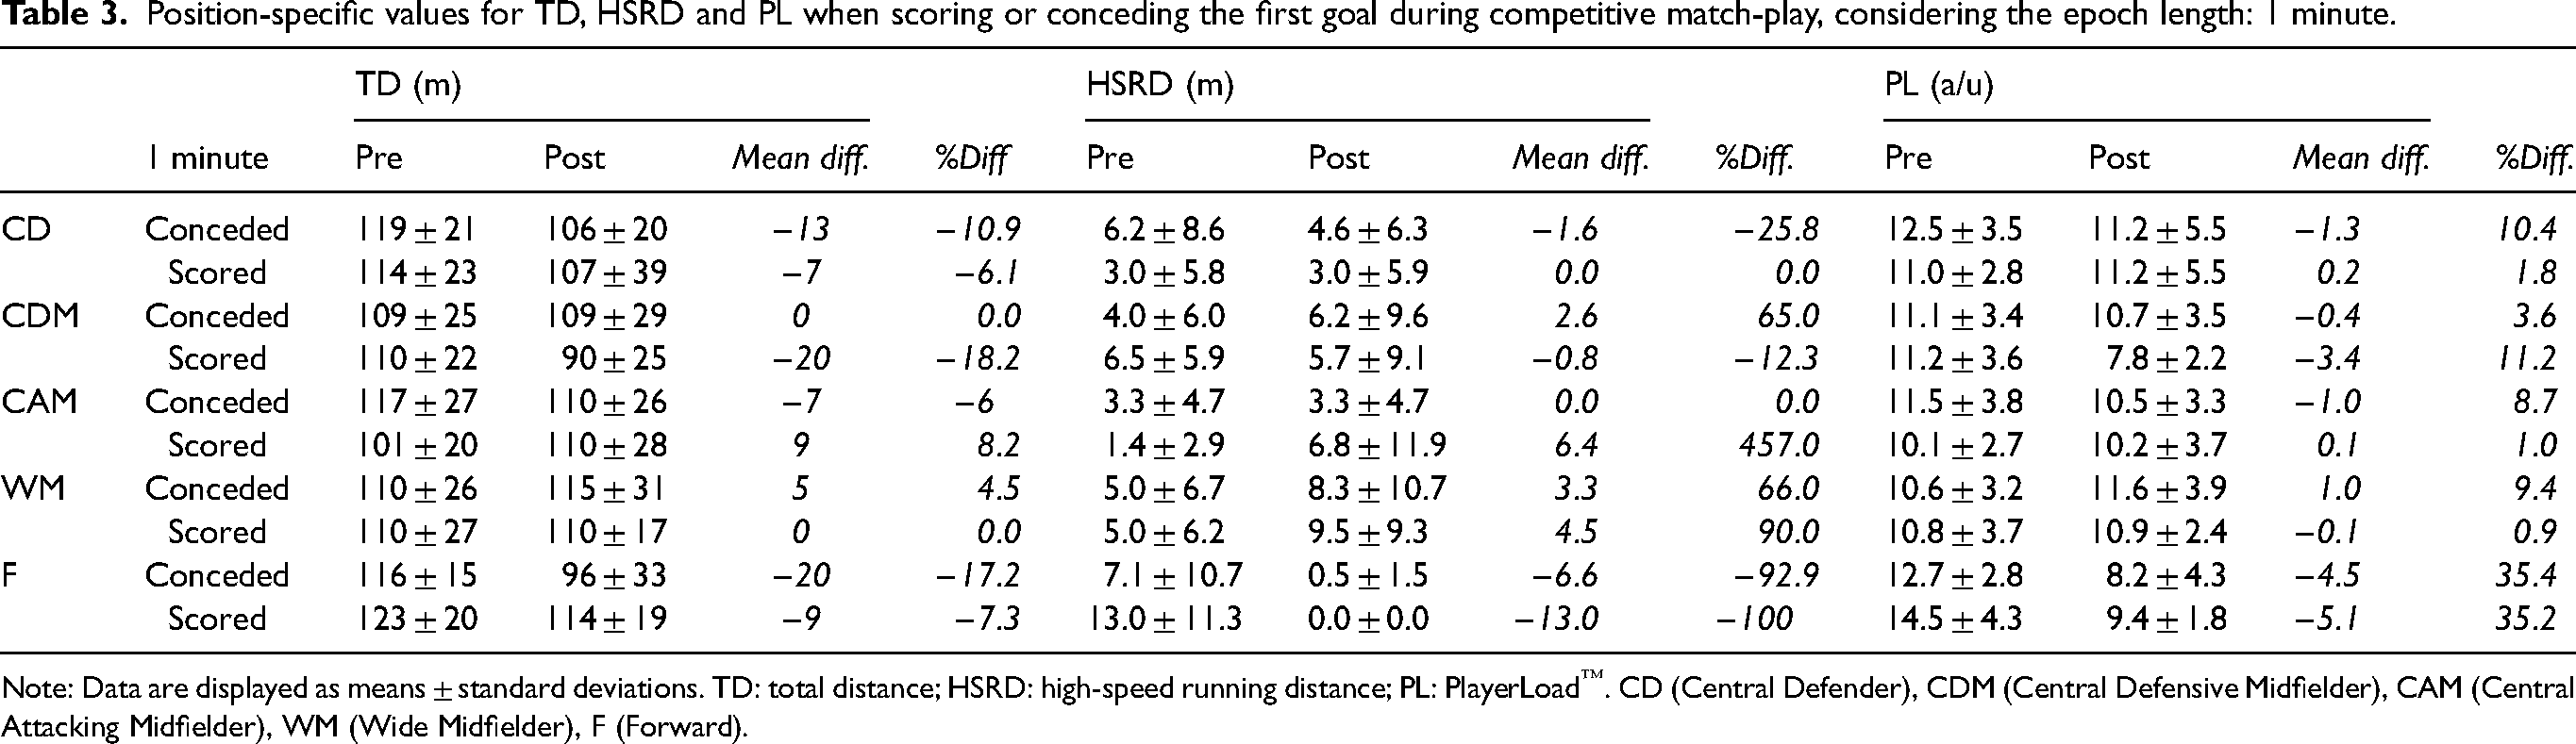
Note: Data are displayed as means ± standard deviations. TD: total distance; HSRD: high-speed running distance; PL: PlayerLoad™. CD (Central Defender), CDM (Central Defensive Midfielder), CAM (Central Attacking Midfielder), WM (Wide Midfielder), F (Forward).
Position-specific values for TD, HSRD and PL when scoring or conceding the first goal during competitive match-play, considering the epoch length: 3 minutes.
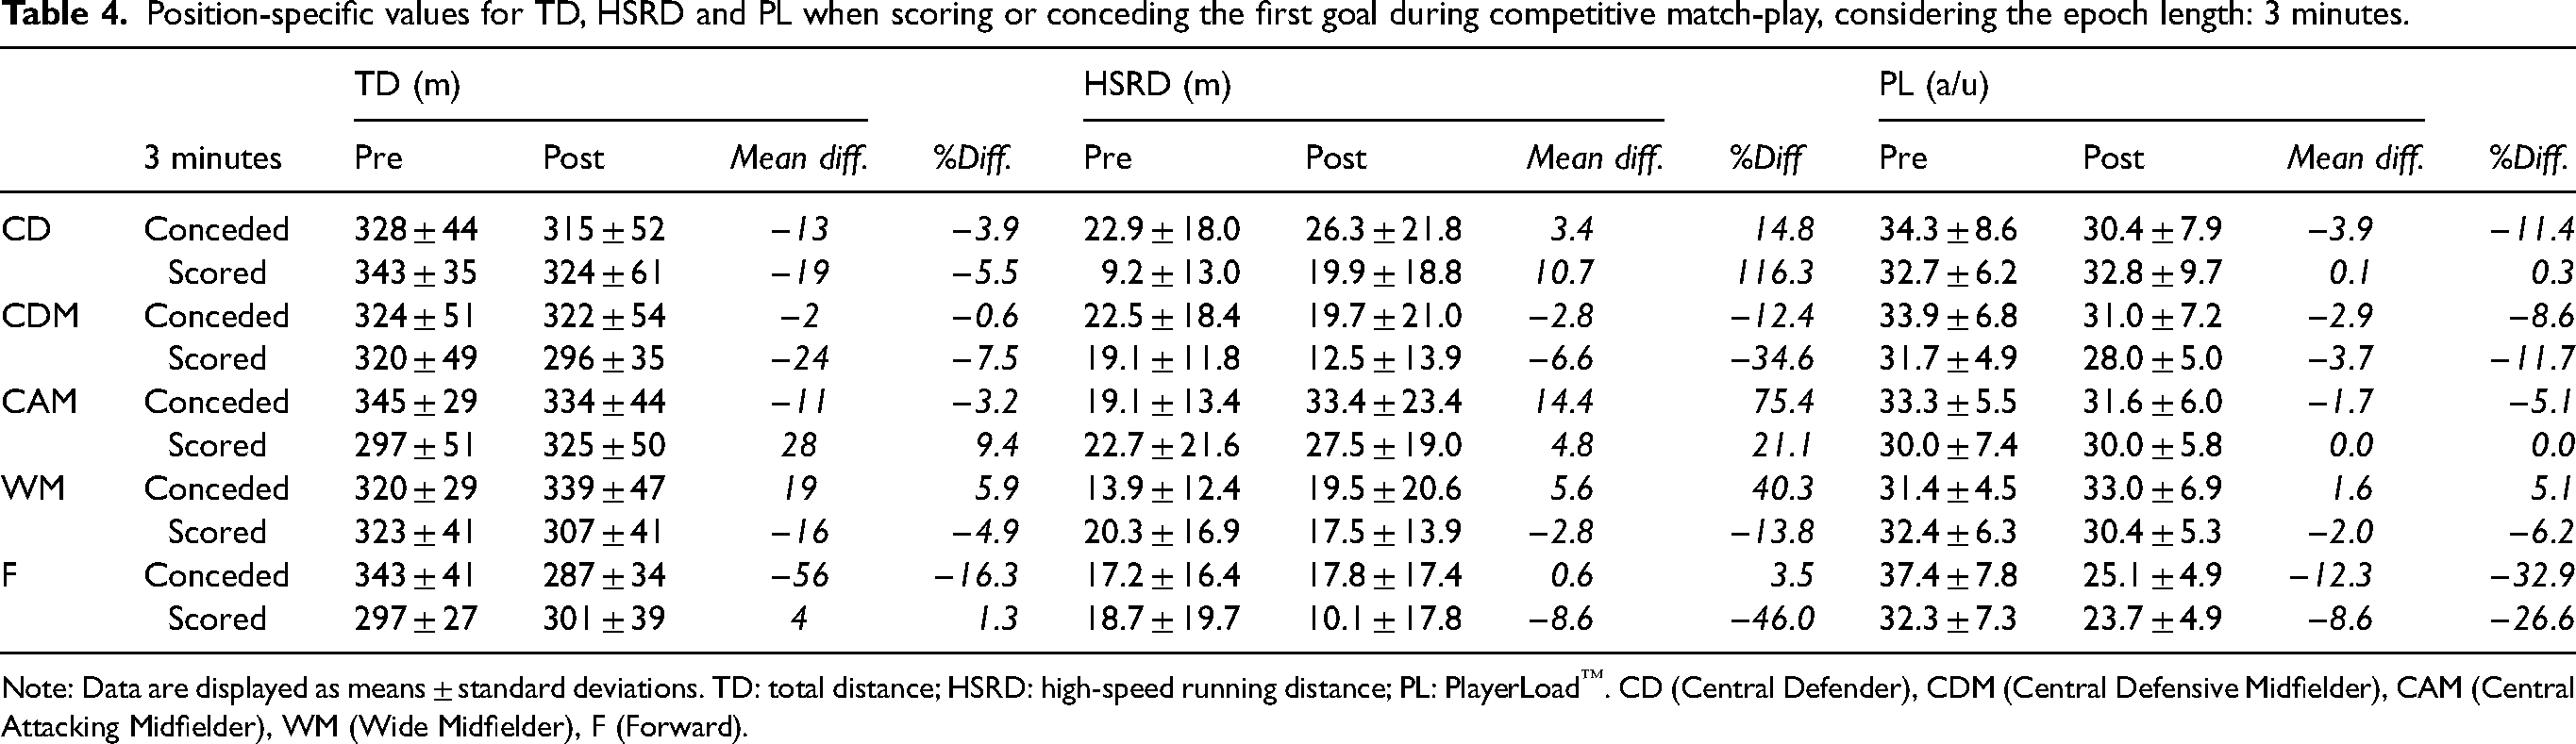
Note: Data are displayed as means ± standard deviations. TD: total distance; HSRD: high-speed running distance; PL: PlayerLoad™. CD (Central Defender), CDM (Central Defensive Midfielder), CAM (Central Attacking Midfielder), WM (Wide Midfielder), F (Forward).
Position-specific values for TD, HSRD and PL when scoring or conceding the first goal during competitive match-play, considering the epoch length: 5 minutes.
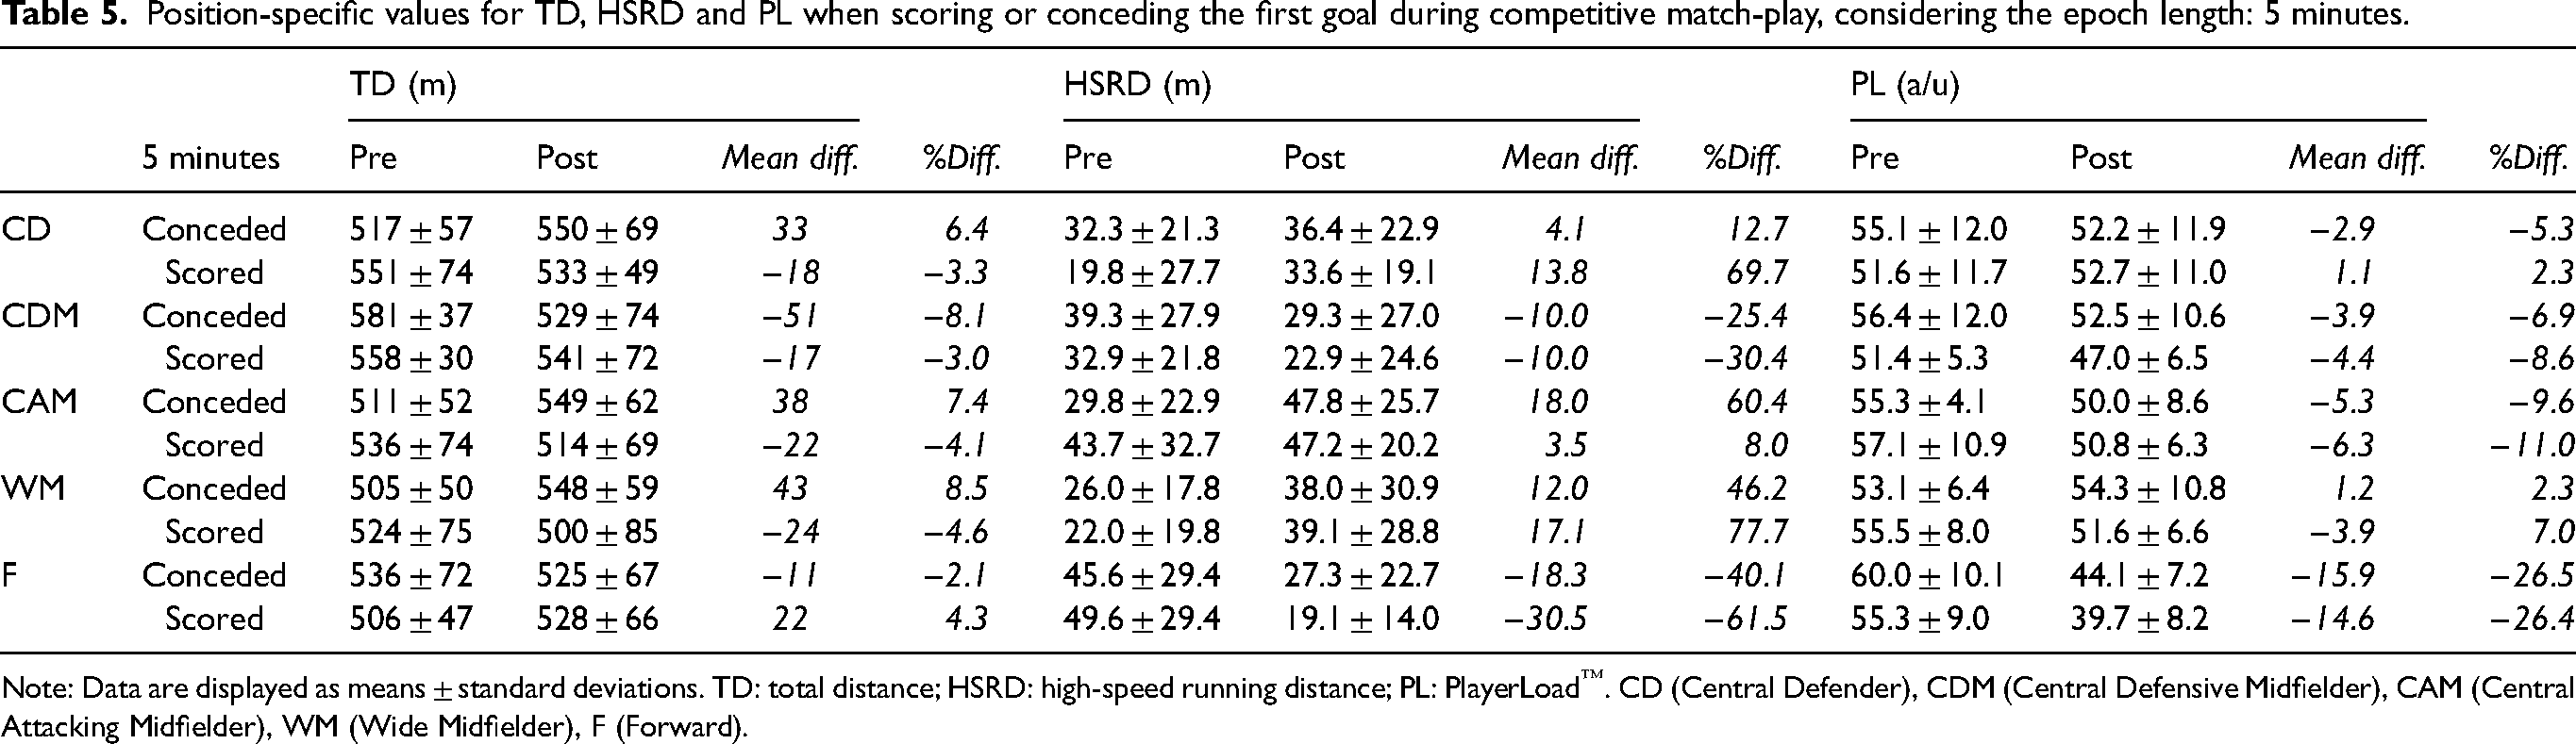
Note: Data are displayed as means ± standard deviations. TD: total distance; HSRD: high-speed running distance; PL: PlayerLoad™. CD (Central Defender), CDM (Central Defensive Midfielder), CAM (Central Attacking Midfielder), WM (Wide Midfielder), F (Forward).
Discussion
The primary purpose of this study was to describe the peak and average periods of activity for elite female soccer players in three different time epochs during match-play, whilst also considering the contextual factors of playing position and post-goal activity. One of the primary findings of the current study was the observation of positional differences for peak HSRD across all three time epochs. Some positional differences were also observed for TD (peak 1-minute) and PL (peak 3-minute). Conversely, when considering match average values, playing position differences were noted for all metrics (HSRD, TD and PL) across all time epochs (1-, 3- and 5-minute epochs). Uniquely, this research aimed to consider post-goal locomotor activity, with current results suggesting potential differences in locomotor activity at both a team and playing position-level following a goal (conceded and scored). This finding may have key technical and tactical implications for coaches, players and practitioners when monitoring, observing and seeking to affect competitive match-play in elite female soccer players. Interestingly, peak TD and PL values occurred more frequently during the first 5 minutes of match-play, possibly highlighting the team's strategic attempt to establish superiority. 26
Positional differences were observed for peak HSRD across each epoch (1, 3 and 5-minute epochs) with WM, F and CAM typically covering more HSRD than CD and CDM (Table 1). These findings are comparable to the limited previous research on peak periods in female soccer and are likely a reflection of the differing tactical requirements of each positional role.14,22 WM and CAM have both attacking and defensive responsibilities which ensure they operate across large areas of the pitch and therefore frequently exceed the speed thresholds for HSR. Relatedly, Fs are required to make high-speed decisive movements to evade the opposition and these actions have been shown to be common in goal sequences. 27 Previous research in this area has often grouped CDM and CAM into an overall central midfield (CM) group and to the authors’ knowledge, the present study is the first to further subdivide into CDM and CAM to analyse peak periods. The importance of distinguishing between the differing tactical roles of the CM group was first considered by Dellal and colleagues in 2011, 28 yet this approach has seldom been adopted in female soccer research, despite the observed differences in locomotor activity between positions. This additional classification of the CM group can provide practitioners with more granular information to help inform position-specific training practices. Due to differing methodologies and speed thresholds adopted, it can be challenging to make direct comparisons between studies; however, the current findings are similar to a study in the Danish women's league 22 where the peak 5-minute HSRD ranged from 74 to 110 m, which is similar to the current findings (62–111 m).
The peak TD was generally similar between playing positions across each time epoch (Table 1). The only exception was a higher peak 1-minute TD in WM (172 m) compared to both CD and CDM (155 m and 158 m, respectively). This similarity between the playing positions for peak TD is fairly consistent with previous research, 14 although other studies have noted differences in peak 5-minute TD between CD and other playing positions.22,29 This divergence between the current study and other research may be a result of the narrow team shape adopted by the current team whereby they utilised three CD and no wide defenders. Indeed, previous research has shown physical match performance to be higher in team formations with three defenders, as opposed to four defenders. 30 The peak TD values observed in our study were broadly similar to other studies undertaken on elite domestic female match-play in Spain, 14 Norway 29 and Denmark, 22 but slightly lower than those reported in international match-play. 23 Similar to the findings for peak TD, there were limited positional differences across the different time epochs for peak PL (Table 1). Indeed, the only significant difference was between F and CD for peak 3-minute PL. This finding corroborates previous research which has noted a strong relationship between PL and TD. 23 The peak 5-minute PL observed in our study (64.0–70.2 AU) was broadly similar to previous investigations in U20 (68.4–64.5 AU) 31 and senior international match-play (68.4–74.5 AU). 23 Despite examining peak 5-minute PL, the previous studies did not investigate playing position differences so we are not able to compare this aspect of our research.
Investigating peak periods in match-play activity is an increasingly popular approach to further understand the most physically demanding periods of match-play. It is recognised that being cognisant of these peak periods is useful for training drill design, development and monitoring purposes. 2 However, the focus of training sessions is not always about working at maximum intensity and consequently, an appreciation of the average values for various load metrics is also warranted. For the average match data reported in this study, positional differences were observed for average HSRD, TD and PL across each epoch (1, 3 and 5-minute epochs) (Table 1). Significant differences were noted between WM and CD for each variable and for all time epochs. There were also significant differences between CDM and CAM for average HSRD across all time epochs, with CAM completing more HSRD than CDM. As discussed previously, these positional differences are not unexpected due to the differing tactical role of each playing position.14,22 Accordingly, this study not only reiterates the need for position-specific training but also highlights the awareness that further subdividing playing positions (i.e. CM divided into CAM and CDM) can be enlightening, enhancing our understanding of position-specific match demands.
Despite the known importance of goal scoring within elite soccer, there is a paucity of research examining the influence of scoring on locomotor patterns. Previously, research has considered the association between match outcome 15 (i.e. win, lose or draw) and locomotor activity; however, such an approach fails to appreciate the ever evolving nature of competitive soccer match-play. To the authors’ knowledge, however, this is the first study to consider the locomotor activity undertaken following instances in which a goal is conceded or scored. Post-goal activity patterns intuitively seem important as they represent a significant point in the game and combine physical, technical, tactical and psychological aspects of performance. Furthermore, post-goal activity better represents the stochastic nature of match-play compared to match outcome which encompasses 90 minutes of activity.
From a team perspective, no significant differences in HSRD or TD activity were observed, between pre- and post-goal activity. However, specifically after conceding a goal, there was a significant increase in TD values during the 3-minute epoch. PL values were lower post-goal across all time epochs, regardless of scoring or conceding (Figure 3 (a) to (c)). These findings in part corroborate the findings of Castellano and colleagues, 32 who suggest that losing teams may initially increase their work rate in an attempt to score; however, it may not be possible to maintain this increased work rate. 17 The post-goal reduction in PL was a novel finding as this metric has not readily been cited in similar prior work. This significant finding indicates a change in activity pattern post-goal, possibly implying fewer changes of speed and/or direction; however further investigation, including the combination of tactical and technical information, is warranted to further understand this change. Indeed, the playing position analysis highlighted some key differences in post-goal locomotor patterns; for CAM, there were large increases (457%) in 1-minute HSRD distance after scoring, and for F there were decreases in most epochs for both HSRD and PL when scoring and conceding (Tables 3–5). The rationale for these changes in post-goal HSRD and PL activity cannot be confirmed by the current study; however, it is interesting to consider whether these were proactive or reactive tactical responses. Future research needs to combine physical, tactical and technical performance measures to further understand these complex interactions.
This study is not without limitation, firstly, this was a small dataset collected from a single club team and consequently the findings may not be transferrable to wider populations due to the differences in style of play and tactical considerations. Connectedly, there was an imbalance in the team's results, with matches won accounting for 79% of those analysed, which may have influenced the findings. Also, as the investigated team play a system without wide defenders, this playing position was not reported in the current study. Secondly, each of the external load metrics were expressed separately; however, recent narratives suggest that peak periods should be considered as multivariate and complex constructs. 12 Thirdly, incorporating more technical and tactical aspects of performance through optical data, alongside the physical metrics, would have allowed a deeper and more holistic understanding of the peak periods of match-play.
In summary, this study provides a comprehensive overview of average and peak periods of match-play activity in elite female soccer players and secondly offers some novel findings on post-goal locomotor patterns. The reference values obtained in this study may be a useful guide for practitioners to inform training drill design, while also aiding training monitoring processes. More generally, profiling and benchmarking positional-specific physical demands whereby informing training load strategies to compensate the disparity between the prescribed (i.e. expected) training dose and the actual (i.e. observed) response. The current study observed that both peak and match average values were influenced by playing position which further highlights the need for position-specific training protocols. For example, a possible training drill for a CAM could be a pitch run from 6-yard line to 6-yard line (∼103 yards), followed by a pitch run from 18-yard line to 18-yard line (∼79 yards). The distance covered during this drill would be ∼182 yards (166 m), which is representative of the peak 1-minute TD for CAM (Table 1). Practitioners, however, must also be cognisant of the reality that a combination of external load metrics and contextual factors must combine to create a true peak period. 12 The current study seeks to extend and develop upon the existing research which has examined the impact of match outcome on locomotor activity, by considering the evolving match status (i.e. goal-scoring events) and the influence on players’ locomotor activity. Consequently, post-goal locomotor patterns highlighted differences in the TD covered by teams after conceding a goal, as well as positional differences for HSRD and PL. Further research should focus on combining tactical and physical performances to better understand these complex interactions.
Footnotes
Acknowledgements
We would like to thank the players and staff at the club for their cooperation throughout the study.
Declaration of conflicting interests
The author(s) declared no potential conflicts of interest with respect to the research, authorship, and/or publication of this article.
Funding
The author(s) received no financial support for the research, authorship, and/or publication of this article.