
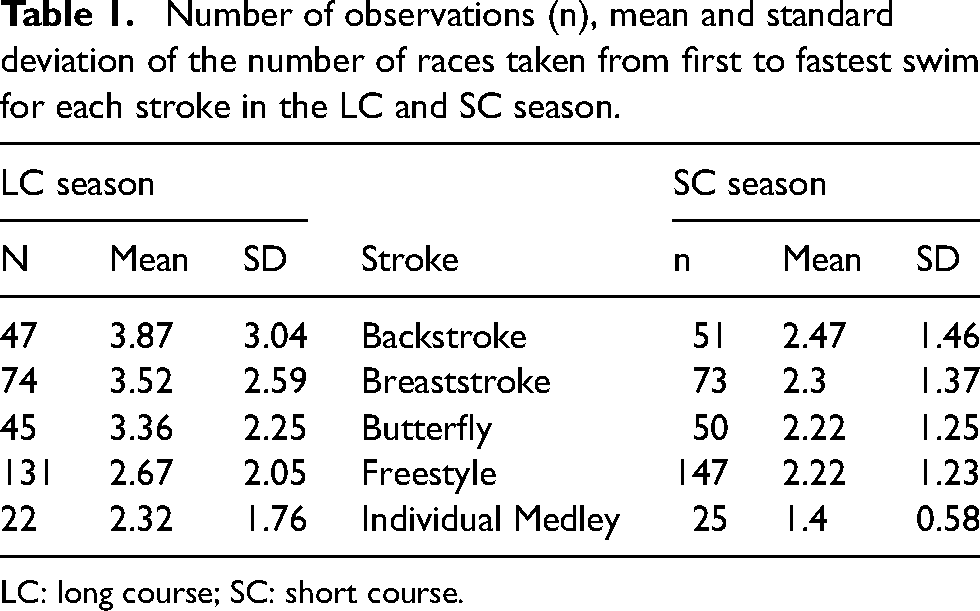
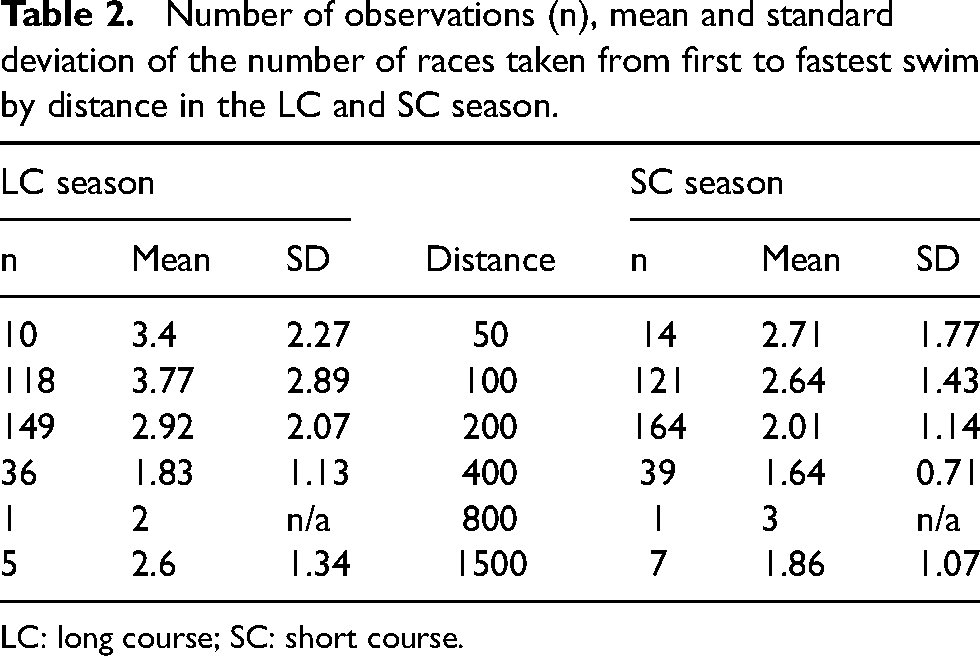
Abstract
The purpose of this study was to analyse contemporary performance data in elite and sub-elite Irish swimmers, to explore the number of days and races required for swimmers to achieve their fastest competitive performances and how this may be influenced by sex, stroke and race distance. The initial dataset consisted of n = 3930 observations on n = 56 swimmers, with n1 = 2709 (68.9%) long course (LC) observations and n2 = 1221 (31.1%) short course (SC) observations. The main findings indicated that, firstly, the swimmers (LC & SC) produced their fastest swim in their first race of the season, approximately 39% of the time. Secondly, there were no significant differences between male and female swimmers regarding the number of days and races required to achieve their fastest performances. The final key finding identified the number of days and races between first and fastest performance was influenced by (a) stroke, for example, LC and SC freestyle and individual medley swimmers required less races and shorter timeframes to fastest swim, with breaststroke requiring the greatest number of mean days in LC and SC formats and (b) race distance, for example, across LC and SC, 400 m swimmers required fewer races (n = 1.83 & 1.64) and shorter time frame (n = 24.83 & 21.26 days) to fastest swim than other distances. These findings are valuable to coaches and practitioners, as (a) they can provide guidelines when designing competition programmes, and (b) support exploration of what a swimmer's competition may look like in terms of volume and duration to support the fastest performance.
Introduction
With increasing professionalism in sport, coaches and practitioners have tried to optimise training and competitions schedules to deliver optimal performances when required.1–3 The performance research landscape has traditionally focused on concepts such as periodisation and tapering when looking at how athletes can time their performance to coincide with specific competitions. As such it can be assumed that a well-executed tapering phase can increase the odds of an athlete winning a gold medal at a championship event.2,4 Swimming is primarily divided into two formats: (a) short course (SC) (25 m pool); and (b) long course (LC) (50 m pool). Within high-performance swimming, the Olympic Games and the World Championships are the two premier competitions on the swimming calendar 5 and occur every 4 and 2 years, respectively (not withstanding COVID-19 induced postponements over the last 2 years). Given that both competitions are in the LC format, LC swimming is viewed as the more important format. Anecdotally, it is well accepted within the swimming community that SC racing serves as a pre-cursor to LC performances (i.e., SC performances give an insight into how an athlete may perform in the subsequent LC season). Deciding on what competitions to attend and events to compete in is generally led by the coach, with older/more experienced athletes having greater input into their competition schedules.
At major competitions, swimmers ranking prior to competition are used to determine what heat an athlete will race in. Progression through the competition rounds (i.e., heats into semi-finals/finals and then semi-finals into finals) are decided based on rankings of the previous round (i.e., the top ranked eight or 16 swimmers), making it different to sports such as athletics, where progression is decided by a set number of automatic qualifiers (based on finishing positions per heat) and ‘fastest losers’. Progression between the various rounds at a competition has been well documented in the literature across sports such as track and field athletics6–8 and swimming.9–12 Within swimming, research has also previously focused on variability in competitive performance. For example, the variability in performance across one competitive season,10,11 variability between world ranking and Olympic Games performances 13 and variation within and between competitions.10,12,13 When analysing performance changes between world rankings and best times achieved at the 2000 Olympic Games, Trewin et al. 14 indicated that, on average, performances at the Olympic Games were 0.3% (range 0.2%–0.4%) slower than the world rankings times, but that Olympic Games medallists improved by 0.6% (0.4%–0.9%), whereas non-medallists swam 0.6% (0.5%–0.7%) slower. A similar trend was also found at the 2004 Olympic Games by Issurin et al. 15 who reported that overall performances from all competing swimmers were, on average, 0.58% (±1.13%) slower than the qualification times, but that medallists (0.35% (±0.79%)) and finalists (0.12% (±0.85%)) were faster than their qualification times. More recently, Mujika et al. 12 reported that less than 40% of world class swimmers achieved a better performance at an end of season major competition, compared to their season's best time. They reported that performance progression at the end of season major competition was not determined by the amount of time between an athlete achieving their season-best time and the major competition, the event they participated in or the swimmers’ sex (Mujika et al. 12 ).
Costa et al. 16 have tracked the variability in performance of world-ranked male swimmers during five consecutive seasons (2003/2004–2007/2008) in Olympic freestyle events. The authors reported that there were significant variations in the mean swimming performance in all events between all seasons. Performance enhancement was approximately 0.6%–1% between seasons leading up to the Olympic Games. Clephas and Wilhelm 14 noted that previous research was limited in supporting coaches to draw conclusions on planning and peaking within a season due to the nature of research focusing on an examination of a small number of fixed dates rather than investigating performance variability over a continuous period of time. To address this, Clephas and Wilhelm 14 investigated how performances of elite swimmers developed during an8-month period, within one competition season, noting that more successful swimmers had more constant results than their competitors, suggesting that stability in performances in the lead up to any major competition may be an important indicator for peak performance. Periodisation and programming in swimming has also received recent attention.15,17 Periodisation is an accepted part of any training programme and is predominantly used to guide the training process of most athletes. 17 Periodisation describes the deliberate sequencing of training to enable an athlete to attain the physiological capabilities required to deliver timely optimum performance.18–20 Of relevance to this work, are the studies examining performance timing within swimming12,21 and track and field.17,22,23 Collectively across these studies,12,17,21–23 it was noted that athletes mostly failed to produce a season-best result at major events, suggesting a possible issue in the structure of training to enable performance maximisation on a given date. The role of managing the competition phase of athletes may also influence the timely delivery of optimum performance. 2 How best to structure a competition schedule to support optimum performance, is less well known or researched. 2
Given the importance of the competition phase to the preparation of elite and sub-elite athletes, it is surprising that there is little focused research to aid swimming coaches’ planning on the structure or volume of a swimmer's competition phase (i.e., what, and how many, competitions to participate in). With a lack of focus on how the competition phase is structured (e.g., number of days, number of races, distribution of races, etc.), it remains difficult to draw conclusions for a coach or athlete, regarding competition planning and timely peaking within a season.14,24 Therefore, given the limited research on planning a competition programme 14 and the anecdotal nature of best practice on competition engagement, 24 the present study investigated the competitive performances of elite and sub-elite Irish swimmers across eight seasons (2012–2020). The primary aims of the current study were to use contemporary performance data to determine: (a) the number of competitive races prior to a season's fastest performance; (b) the time frame between a swimmers first and fastest races of that season (in days); (c) how this varied between SC and LC swimming; (d) any variation by event stroke and distance; and (e) how this varied by sex, to support coaches to develop their planning practice.
Methods
Participants
Participants were swimmers who had been identified by Swim Ireland to be part of their national squad programme. Swimmers included in the dataset were part of the programme throughout the period of 2011 to 2021. Swim Ireland National Squad qualification times are based on those tracking towards Olympic qualification. The initial sample consisted of n = 3930 observations with n1 = 2709 (68.9%) LC observations and n2 = 1221 (31.07%) SC observations. In total, 56 individual swimmers contributed to these performances (n = 30 male, n = 26 female). The median number of years of data per swimmer was six, with lower and upper quartiles of 3 and 10 years, respectively. The participants had an overall mean age = 21.34 years, at data collection.
Data extraction
All data included in the study were collated from https://sports-tek.active.com. Using an observational research design, data were extracted on individual swimmers. Data were extracted for each year in the period 2012–2020. All individuals included in analysis had the following data available on all their performances; swimmer's name, current age, sex, date of competition, distance, stroke, pool format (i.e., LC or SC), name of competition, preliminary or final race in a swimming meet and performance (time achieved). Subsequently, the total number of races by event and stroke, fastest performance by event and stroke and the first and last performance of each season were identified.
Performance selection criteria
For this study, the SC season analysis included only those competitions that were completed between October and March (inclusive) of any year. Given that the data set starts in the year 2012, the SC portion of that season (2011/2012) was not available. Therefore, the data from early 2012 was omitted from the initial dataset during the analysis so that the SC data represents full seasons from 2012/2013 to 2019/2020. The analysis for the LC season included only those competitions that were completed between April and September (inclusive) for each performance year. Any observations outside this period were omitted from the analysis. Each swimmer's season was determined to have started on the date of their first competition, rather than a fixed date. If a swimmers fastest swim occurred at a championships event, the performances were counted in the order in which they would have been completed (i.e., heats, semi-finals & final). Additionally, swims within a championship context were counted as individual races, i.e., where a swimmer progressed through two qualifying rounds and competed in the final, this was counted as three swims. 2
Statistical analysis
The initial exploration of the data was conducted through calculating standard five-number summaries 25 (minimum – lower quartile – median – upper quartile – maximum), along with the mean and standard deviation. Further analysis of the data was then completed through detailed regression analysis. Due to the nature of the dataset (i.e., repeated observations in the form of counts for each swimmer), it was determined that count regression models were needed to investigate differences between strokes, distances, and sex whilst accounting for heterogeneity between swimmers. Due to large variability and an excess of zeroes, it was found that standard models (e.g., Poisson) did not work well with the data. Hence, the analyses used a zero-inflated negative binomial (ZINB) for examining the number of days to fastest performance in both the LC and SC data sets. Within the analysis of the number of races within a year to fastest performance, the counts were much smaller than for the number of days, and the number of races must begin at 1 (zero races is nonsensical), therefore a zero truncated Poisson model was deemed appropriate. Significance was set at p ≤ 0.05 throughout the analyses. All regression models were carried out in R, using the glmmADMB package.26–28
Results
The purpose of the study was to determine the number of competitive performances prior to a swimmer achieving their fastest swim and the time frame between the first and fastest competitive swim in a season. The study focused upon the performance data of elite and sub-elite Irish swimmers over the period 2012–2020.
Number of races within a year to fastest swim
The five-number summary for the total number of races was 1–2–3–5–15. The five-number summary for the number of races until the fastest swim within the LC season was 1–1–3–4–13. The analysis has indicated that overall, across all swimmers, the mean number of races first to fastest swim within the LC season was 3.12 races (SD = 2.40 races). The modal number was one, with swimmers producing their fastest performance in their first competitive swim, 38.87% of the time. In the SC season, the five-number summary was 1–1–2–3-7. Further analysis indicated that during the SC season there was a mean of 2.22 races (SD = 1.28 races) from first to fastest swim. The modal number was again one, with swimmers producing their fastest swim at the first time of asking, 37.79% of the time. The summaries are represented in Figure 1.
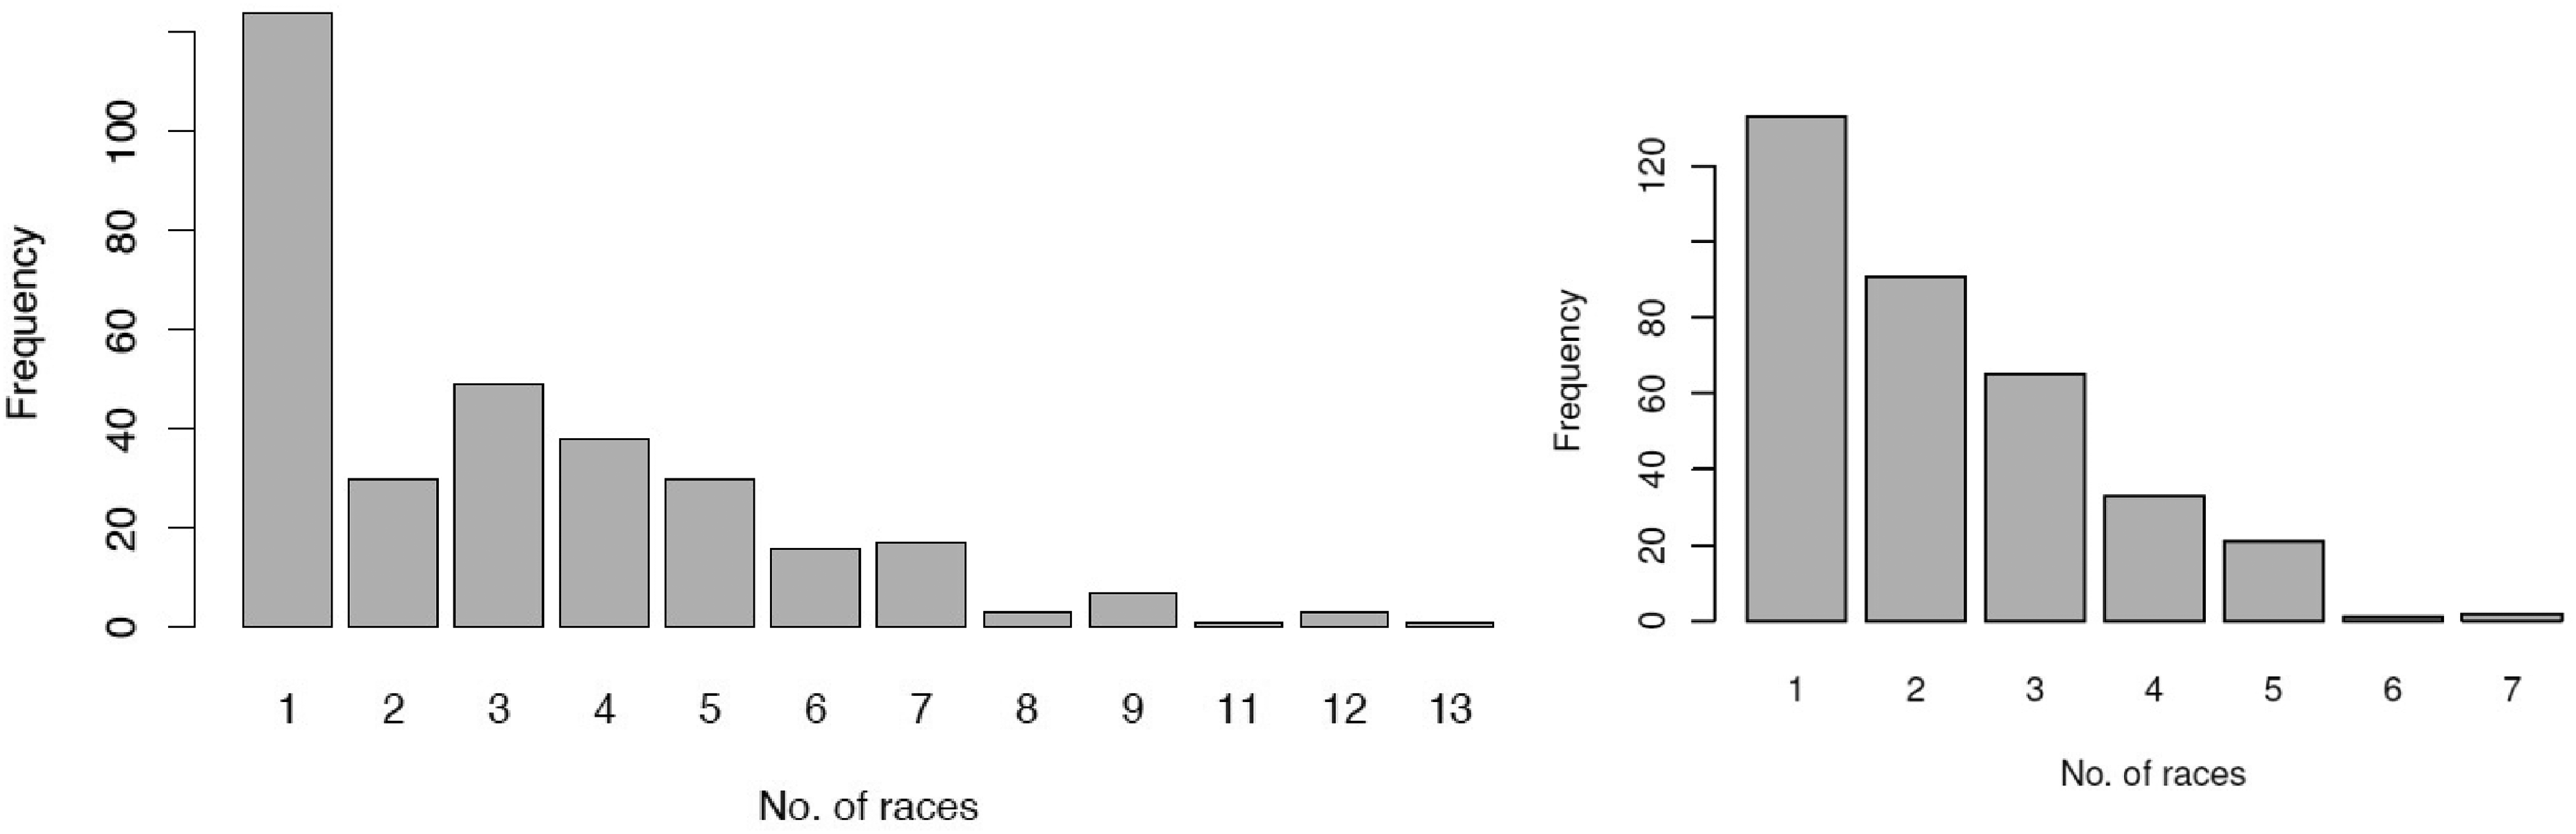
Bar chart of the number of races within a year to fastest swim in the LC season (left) and SC season (right). LC: long course; SC: short course.
There was no significant difference (p = 0.95) between male and female swimmers when examining the number of races between a swimmer's first and fastest performance during the LC season, with a mean of 3.11 races (SD = 2.43 swims) and mean 3.13 races (SD = 2.35 races), respectively. This finding was replicated for the SC season (p = 0.51). Male swimmers had a mean of 2.26 races (SD = 1.30 races), and female swimmers a mean of 2.16 races (SD = 1.27 races).
From the bar charts in figures 2 and 3, the distribution of the number of races to fastest performance was near identical for each sex in both the LC and SC formats. However, there was a difference in the distribution between the LC and SC data for both sexes, with a greater frequency of swimmers achieving their fastest swims at the start of their SC competition season.
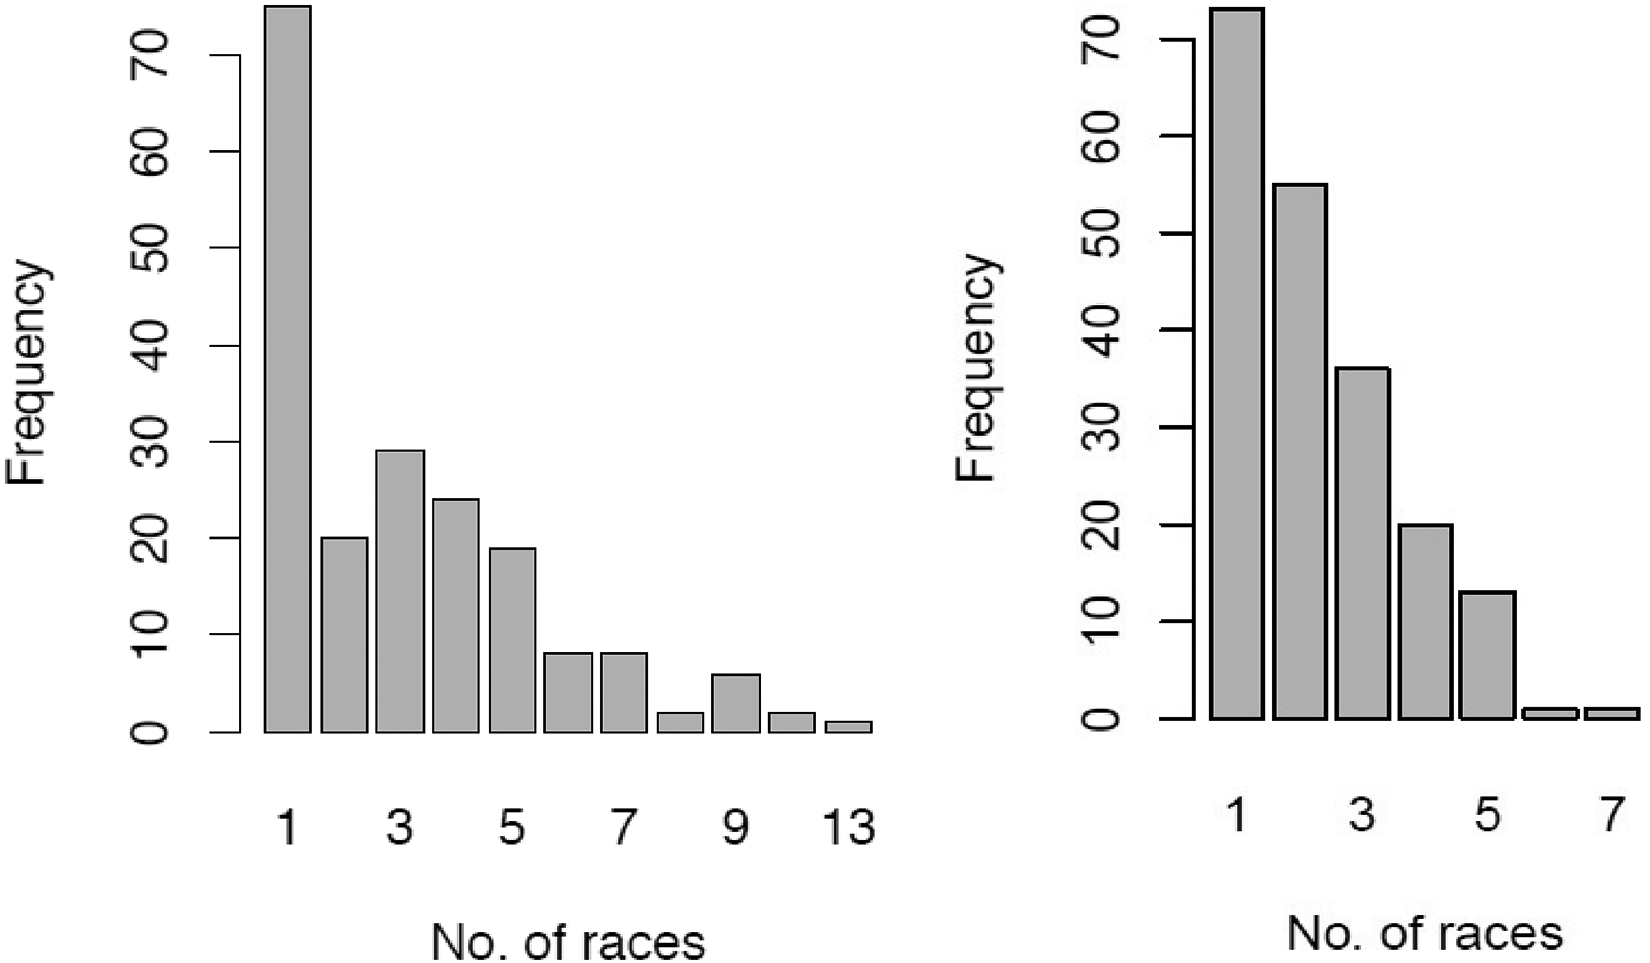
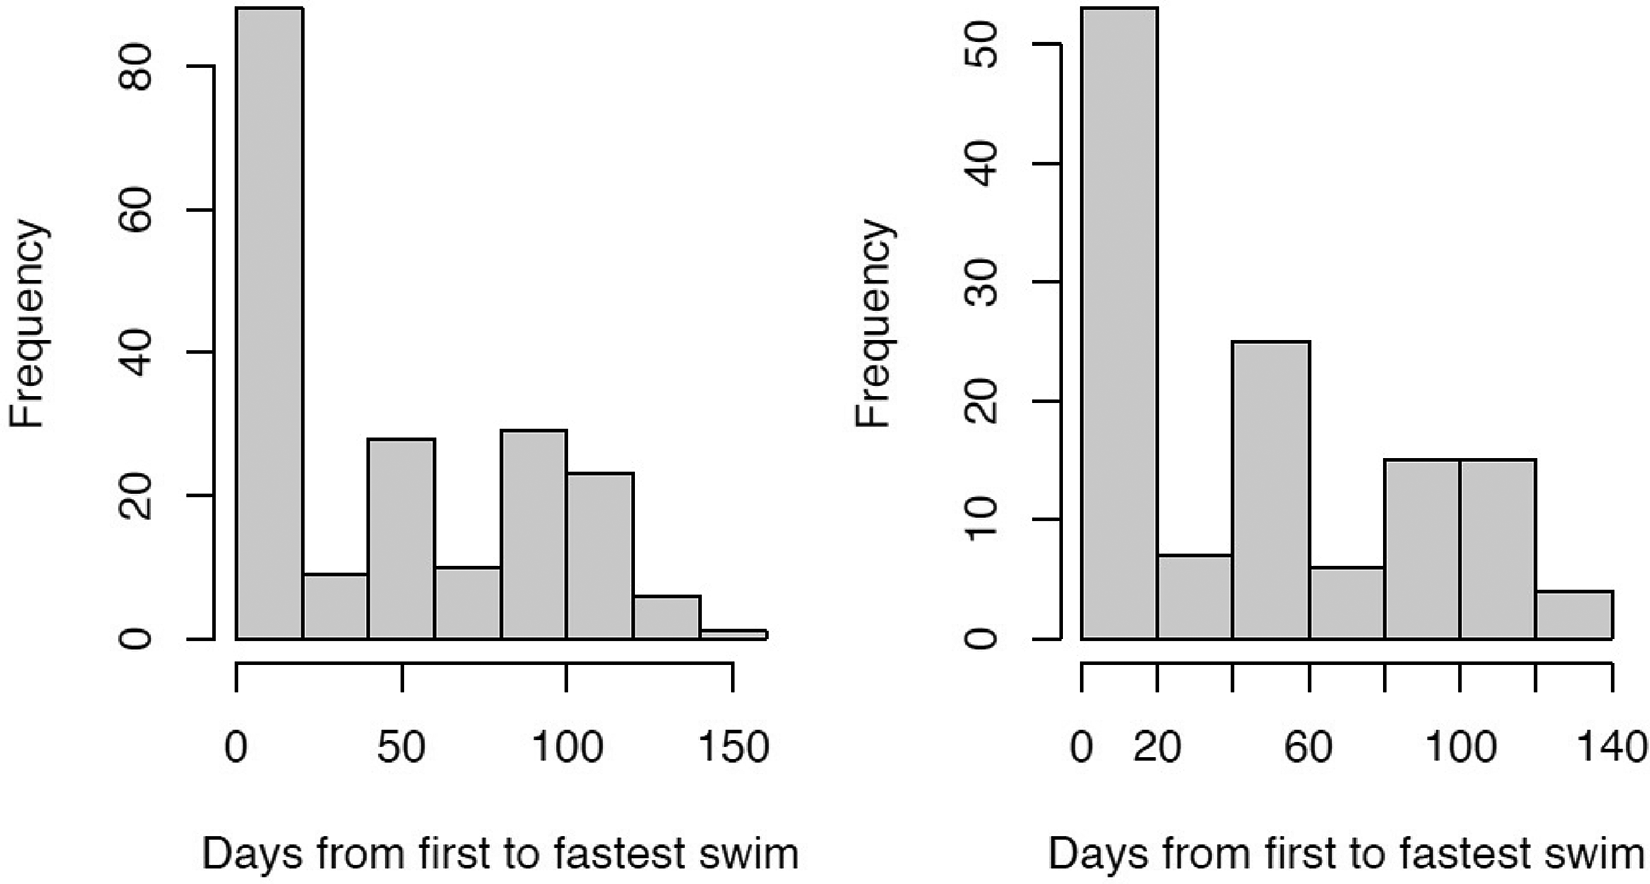
Bar chart of the number of races to achieve the fastest swim for male swimmers LC (left) and SC (right). LC: long course; SC: short course.
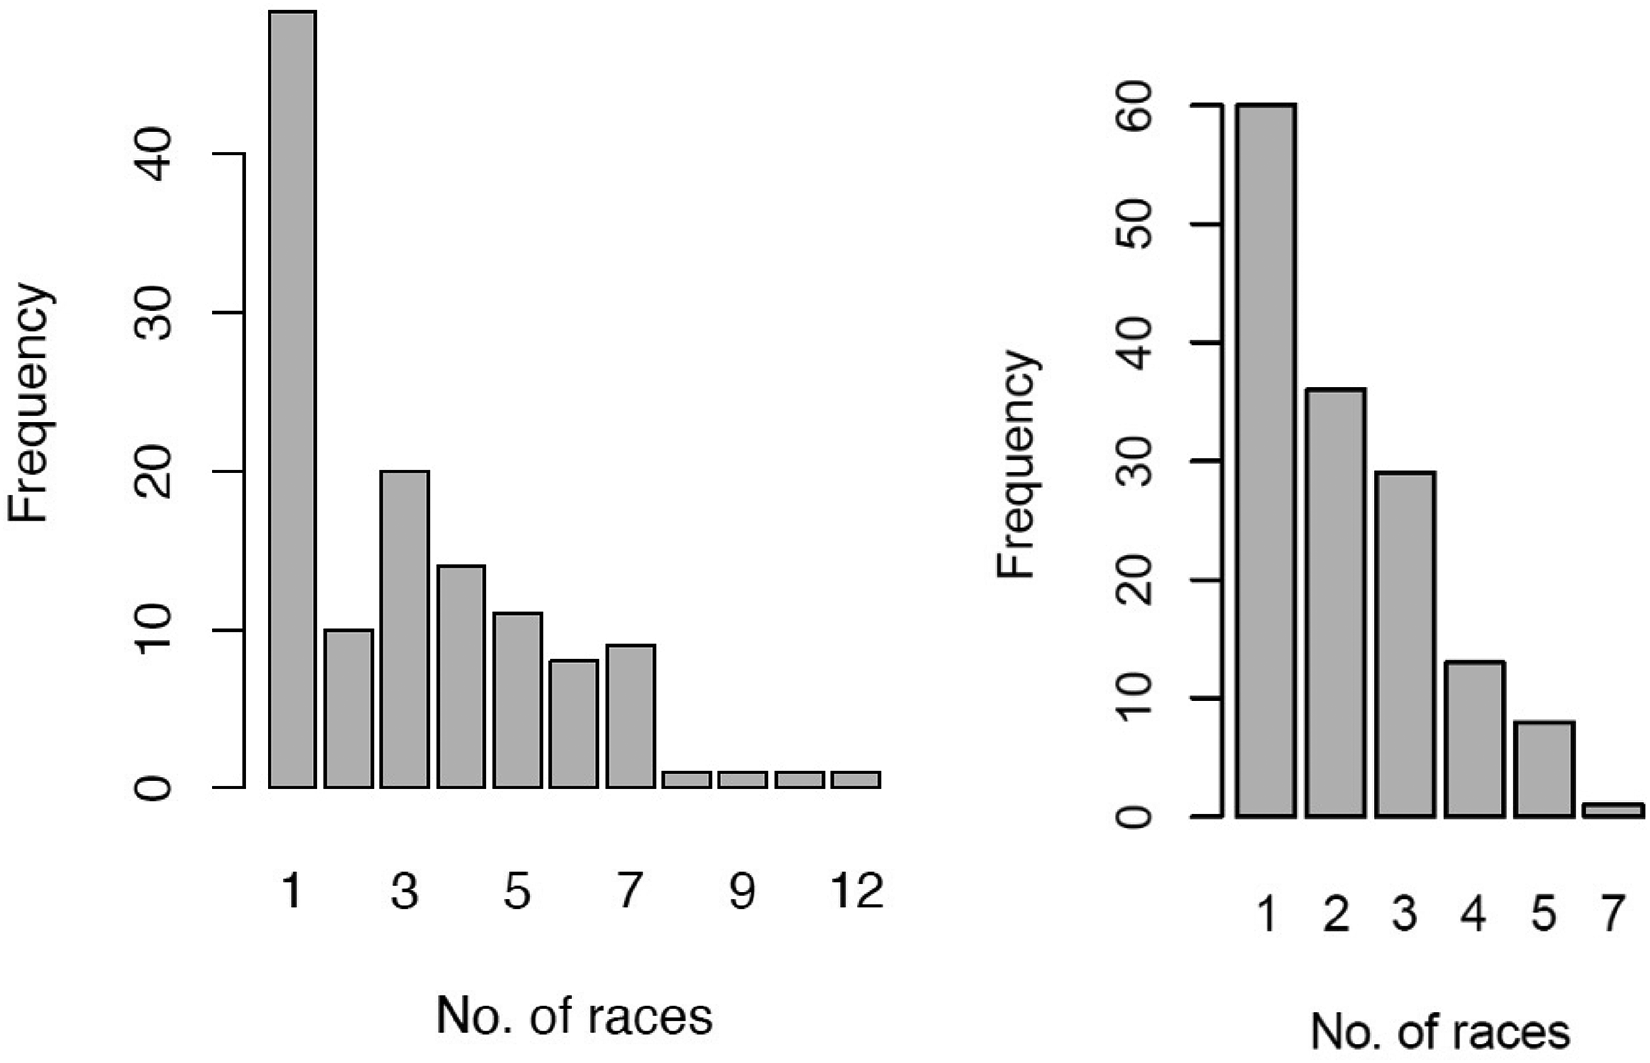
Bar chart of the number of races to achieve the fastest swim for female swimmers LC (left) and SC (right). LC: long course; SC: short course.
Using the zero truncated Poisson model, there were significant differences in the number of races for SC 200 m (p < 0.001) and 400 m (p < 0.01), who swim fewer races in general. The only other significant difference was that SC individual medley swimmers also have, on average, fewer races until their fastest performance, (p < 0.05), at around half of the expected races of other disciplines. The analysis indicated that significantly fewer races were required for both LC 200 m (p < 0.01) and 400 m (p < 0.001) swimmers, to achieve their fastest performance. Of note in the SC season, it was observed that the probability of swimming fastest at the first race of the season was higher for 200 m and 400 m SC swimmers and that individual medley swimmers have, on average, fewer races until their fastest performance.
Number of days within a year to fastest swim
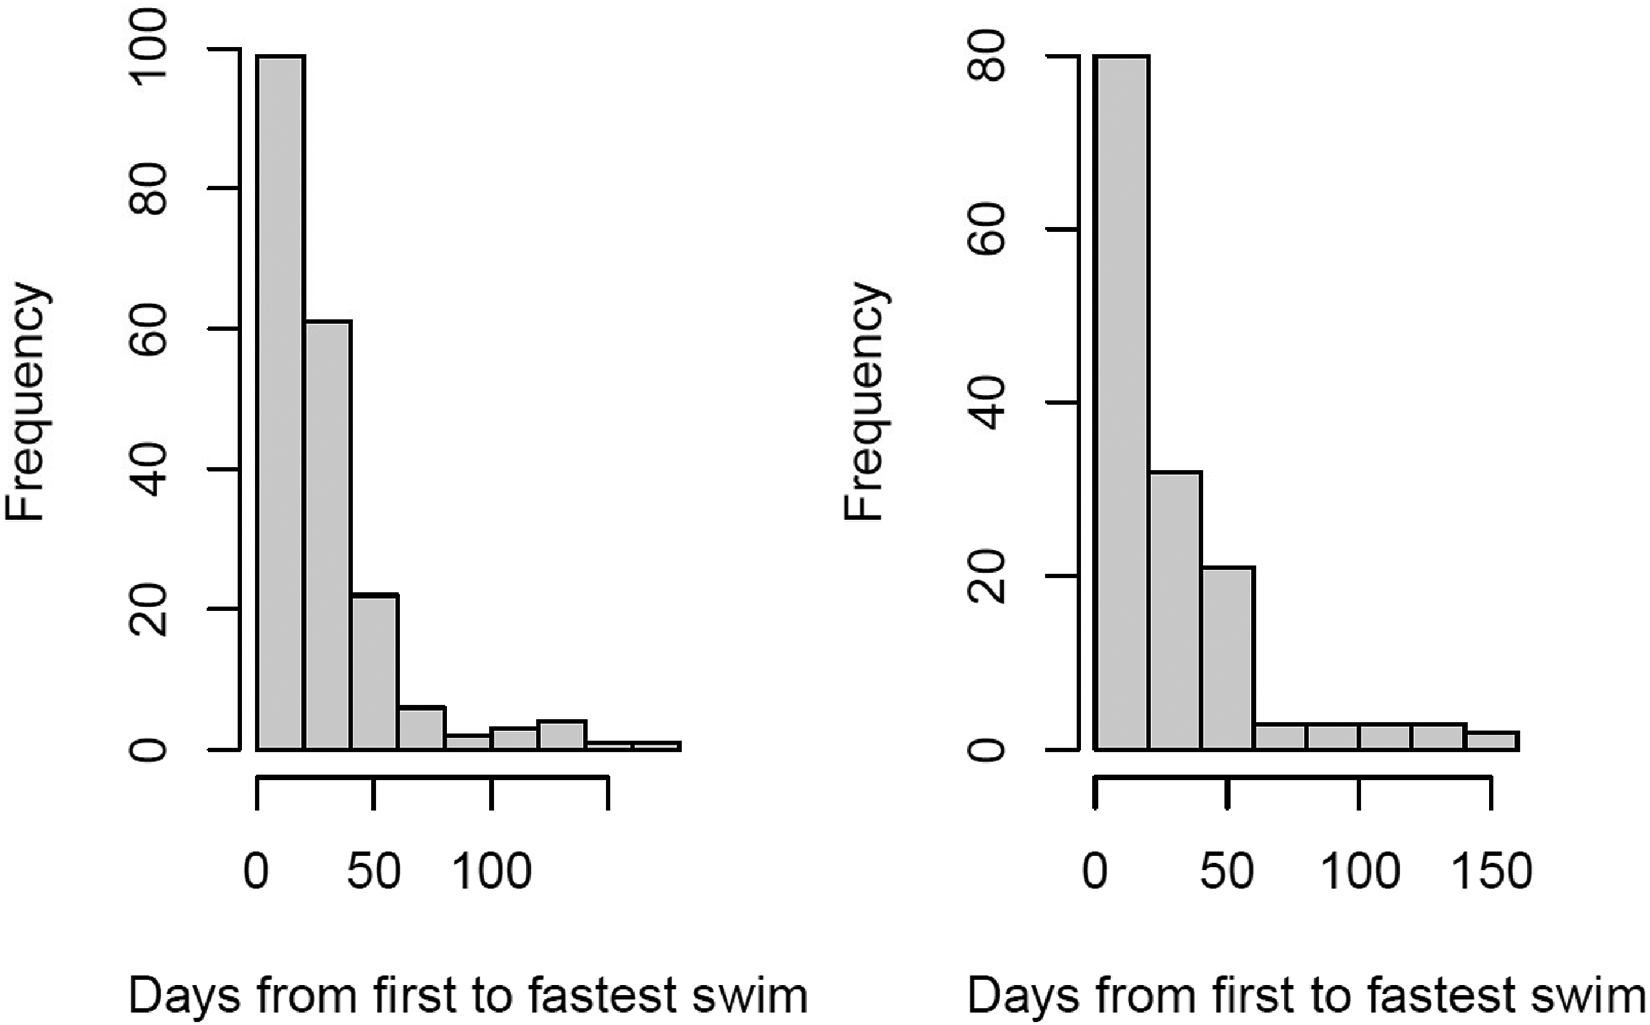
The five-number summary for the number of days between the fastest swim within the LC season was 0–0–43–85–149. The analysis has indicated that overall, across all swimmers, the mean number of days first to fastest swim in the LC season was 43.85 days (SD = 43.86 days). In the LC season, the number of days from first to fastest swim was significantly different (p < 0.05) for LC 400 m swimmers, compared to the other distances. The mean number of days from first to fastest swim in the SC season was lower than LC, at 26.07 days (SD = 32.00 days). The modal number was zero in both formats. Figure 4 represent the number of days for first to fastest swim by format.
For the SC season, the five-number summaries were 0–0–20–40–169. In the analysis, it was noted that: (a) with regard to the number of days, the only significant covariate was distance, with no significant changes between sex, stroke and race distance; (b) that the distribution of values was uneven, in that there were pockets of high frequency at, for example 7 and 14 days, which was not observed in the LC season data. The analysis looked at any sex differences with regard to the number of days from first to fastest swim. There was no significant difference between male and female swimmers when examining the number of days between a swimmer's first and fastest performance in both LC and SC formats (Figures 5 and 6). Male swimmers had a mean number of days for the LC and SC season of 44.16 days (SD = 44.71 days) and 26.09 days (SD = 31.04 days) respectively, whilst female swimmers had a LC mean of 43.37 days (SD = 42.68 days) and SC mean of 26.05 days (SD = 33.37 days).
Number of races to fastest swim by stroke and distance
During the LC season, the mean number of races from first to fastest swim was lower for freestyle (n = 2.67) and individual medley (n = 2.32), when compared to other three strokes. These differences were significant for freestyle (p < 0.01) and individual medley (p < 0.05) swimmers. Within the SC season, the smallest mean number of races was for the individual medley (n = 1.40) (similar to the LC data), with small variations between the other strokes. Backstroke had the largest mean (n = 2.47) which mirrored the LC data findings (Table 1).
Examining the number races from first to fastest swim within a year by distance (Table 2), the LC results indicated that the longer the distance, on average, the fewer the number of races were required between first and fastest swim, with a small variability. For the SC season, the smallest mean number of races was for the 400 m (n = 1.64), with a decline in the mean as the distance moved from 100 m to 400 m.
Number of days to fastest swim by stroke and distance
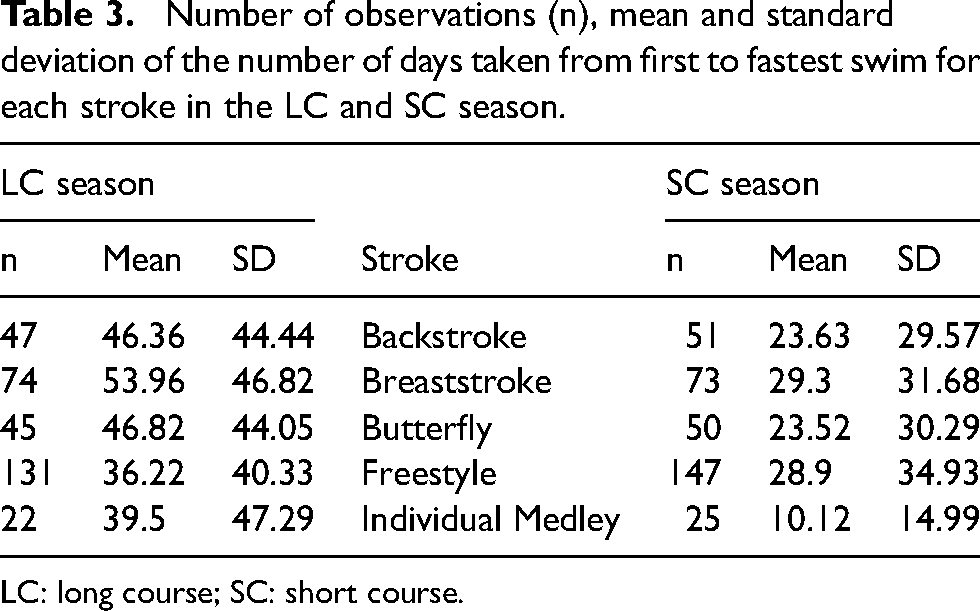
The mean number of days to fastest swim by stroke during the LC season was appreciably lower for freestyle and individual medley, at 36 and 40 days, respectively, and longer for breaststroke, with a mean of 54 days. Backstroke and butterfly produced comparable results (Table 3). In the SC season, the mean number of days was considerably lower for the individual medley (10 days) and longer for breaststroke and freestyle (29 days in each case).
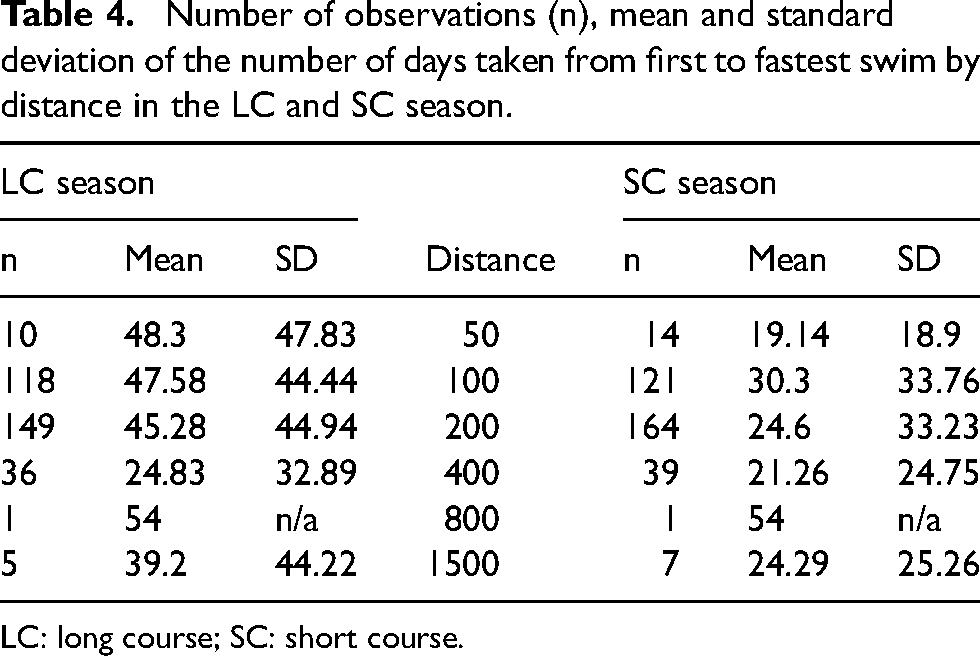
Examining the data by distance revealed that in the LC season 400 m swimmers had a smaller mean number of days (n = 25) between their first and fastest performance, when compared to the other distances. The shorter distances of 50 m, 100 m, and 200 m have a larger number of mean days between the first and fastest performance, with a mean of 48, 48 and 45 days, respectively (notwithstanding the small sample size for 50 m) (Table 4). The SC season data revealed that number of days gets smaller as you progress from 100 m (n = 30) to 200 m (n = 25) to 400 m (n = 21).
Discussion
The purpose of this study was to analyse contemporary performance data in elite and sub-elite Irish swimmers, to explore the number of days and races required for swimmers to achieve their fastest competitive performances. The main findings from the current study indicated that across the observations of the LC and SC formats, that the fastest swim occurred in their first competitive swim 38.9% and 38.4% of the time, respectively. That is, for a number of swimmers, they were unable to produce a faster swim as the season progressed. Secondly, the analysis revealed no significant differences between male and female swimmers regarding the number of days and races required to achieve their fastest performances. The final key finding was that the number of days and races between first and fastest performance was influenced by stroke and race distance.
Number of races between first and fastest performance
The analysis of the average number of races to fastest swim across the swimmers, is suggestive that coaches may wish to consider a main racing programme that looks to have approximately 3−5 races in the LC format (mean = 3.11, SD = 2.43) and 2–3 races in the SC format (mean = 2.2, SD = 1.3) to achieve fastest performance when desired. There was no significant difference between the sexes, with male and female swimmers producing comparable results for both the LC and SC seasons. Due to the relatively fixed nature of the competition calendar for all swimmers, and similar prescriptions in training for both male and female swimmers, this may account for any lack of difference between the sexes. The difference between LC and SC could be accounted for regarding the facilities used in training for the swimmers in this study. 28 Due to an increased availability of 25 m pools (in comparison to 50 m LC pools), swimmers in this study are likely to train in a 25 m pool throughout the majority of the swimming season, thus, requiring a short transition period to the longer 50 m pool. In addition, during the SC format, it may be that the additional underwater transitions which allow for a greater percentage of time spent underwater, the increase in the number of short recovery periods during each race (gliding phase underwater from push off), combined with the possibility of the generation of extra power from the push off the wall, may explain a shorter number of races to fastest performance within the SC season.29,30 Finally, the higher number of competitions could be indicative of competitions being integrated into the peaking process in the LC season. 4 The analysis revealed that across both the LC and SC seasons, approximately 39% of the time, swimmers achieved their fastest performance in their first race of the season. There is no clarity as to why this phenomena of producing the fastest performance in the first race has occurred. Given the reasonably structured competition calendar and the implausibility a swimmer wishing to maintain or even intentionally wanting to reduce their performances across the season, 2 those achieving their fastest performance in their first race would not be optimal. Whilst the study did not have access to the training data for the swimmers, for those swimmers where the fastest race is happening in the first race of the respective season, it might be suggestive of the need to revisit the design of the training programme/practices of these swimmers to examine the type of work being completed during the pre-competition and competition period to support continued performance progression throughout the season, culminating in possibility of fastest performance at major championships or target race. Achieving the fastest performance in the first competitive race could also be indicative of the balance of training versus racing within any given period. During racing periods, an individual's swimming volume may increase (through swimming rounds, warm-ups and cool downs) or decrease (reduction in training time, travel to competitions and post-racing recovery time), which may influence a swimmer's overall performance. For example, through an increase in amount of swimming volume, alongside swimming at the higher intensity that occurs during competition periods, it may contribute to a decrease in performance across a season. Similarly, for swimmers competing over shorter distances, a reduction in training volumes during racing period could also influence racing performance, contributing to higher number of swimmers who produce their fastest performance in their first race. In addition, the swimmers in this study tended to be younger athletes (overall mean age = 21.34 years, at data collection), which may account for fast early season performances, with a possible lack of physical conditioning being accumulated within the swimmer's development, to sustain performances across an entire season30,31
Number of days between first and fastest performance
Within the LC season, the average number of days to produce a swimmer's fastest performance was 44. This was consistent between the sexes 44 (male) and 43 (female). For the SC season, the mean number of days reduced to 26 days. Again, there was no significant difference found between the sexes (26 for both). The difference between competition formats may be explained through the nature of each, with a suggestion that swimmers may be able to compensate for any weaknesses in their aerobic development and muscular endurance in SC formats. An interesting finding is that within the SC season, there were pockets of high frequency at 7 and 14 days, when swimmers achieved their fastest performance. The same ‘bumps’ of high frequencies at multiples of 7 days were not repeated in the analysis from the LC data. These higher frequencies at 7 and 14 days may be explained through the timing of competitions during the SC season or the availability of the swimmer to engage in competition at fixed times/days. As the LC season covers a longer period than the SC season, this may explain why we do not see the same pattern at 7 and 14 days. Additionally, the longer time course of the LC season could account for the increase in races/days, as swimmers may have greater flexibility in the races they choose to compete in and/or a greater number of competitive options across the season. The increase in days may also be reflective of an ability to build in either more or larger periods of recovery from intense competition periods and still ensure maintenance of training volumes across a season. To examine the pockets of high frequency seen in the SC data, further exploration of the data maybe required, to explore who (e.g., sprinters v distance swimmers) is swimming fastest in this window to help understand why this has occurred.
Stroke and distance covariates
The analysis indicated that 400 m swimmers required fewer days and races to reach their fastest performance in both the LC (mean days = 24.8, mean races = 1.8) and SC (mean days = 21.2, mean races = 1.6), with the overall number of days and races in both formats decreasing as the race distance increased. Anecdotally, this may be accounted for in the perceptions of the physicality and demanding nature of the 400 m event on swimmers, thus they may be afforded greater recovery periods between LC competitions. The difference in days and races in LC may also be explained through possible delayed physical adaptations developed through the SC season (e.g., pool length, number of turns, volume of endurance work and development of breathing patterns). Finally, the profile of those swimmers appearing the data set may help account for the lower number of days and races in the 400 m events. If the swimmers are more distance orientated (e.g., 800 m and 1500 m swimmers), who are swimming down to an event (i.e., 400 m or less), they may require fewer days and/or races to swim fast. Conversely, if the swimmers are swimming up (e.g., 100 m and 200 m swimmers), then there may be an increase in taper time required to swim fast at the 400 m distance.
LC freestyle (mean days = 36.2, mean races = 2.6) and individual medley (mean days = 39.5, mean races = 2.3) swimmers required fewer days and races to reach their fastest performance, compared to the other strokes. In the SC season, freestyle and backstroke swimmers required a larger number of days between their first and fastest performances, compared to the other strokes. The nature of the different swimming strokes may account for the differences in the time course to fastest performance. Strokes which are more leg dominant (e.g., breaststroke) may need a longer period to benefit from the training adaptions on performance or a great amount of recovery time, to produce a fastest performance. Additionally, the difference in strokes and distance to fastest performance may be attributed to the balance of diverse types of training and the length of taper that is built into a swimmer's training programme (endurance work vs. power work). For example, those programmes which have an emphasis on the development of power may promote the achievement of fastest performance earlier in the season, due to quicker physiological adaptations occurring. Of note, breaststroke and backstroke swimmers (across both LC & SC) required a greater number of races (mean races n = 3.52, 3.87 & 2.30 & 2.47, respectively) to between first and fastest performance compared to other strokes. LC and SC breaststroke swimmers required a greater number of days from first to fastest swim compared to other strokes (mean days =53.96 & 29.30) During training, breaststroke swimmers may use other strokes, for example, front-crawl, to support the development of their aerobic capacity, 31 alongside breaststroke specific work. As breaststroke is both a demanding (i.e., energy expenditure during breaststroke swimming is highest between the four strokes) and technical stroke,32,33 which requires swimmers to make numerous changes in body shape to develop and refine their technique 34 (possibly more than the other strokes). It therefore maybe be postulated that a longer transition to an efficient technical performance in competition and longer tapering period may be needed, resulting in a larger number of races and days to fastest performance. In addition, given that breaststroke is more lower limb dominant compared to the other strokes,34–36 it might be feasible that any residual fatigue accumulated throughout the training period may result in the breaststroke swimmer requiring more recovery time, to produce their fastest performance. Given the above, breaststroke may benefit from an extended interrogation of the data to further explore any differences noted.
Practical applications and limitations
Understanding of individual swimmers’ competition profiles may aid the planning, and timing, of a swimmer's training and competition programme. We believe that the findings will be valuable to coaches and practitioners, providing guidelines on areas of consideration when designing competition programmes for their swimmers. By indicating the variation in performance achievement by distance, stroke and competition format, it should allow coaches to raise questions about their own programming to augment their planning practices regarding competition programmes when it comes to laying out a swimmer's season plan. In providing evidence to underpin the competition planning process, it could support coaches to identify where they may realistically expect (or desire) the swimmers to produce their fastest performance (e.g., Olympic Trials), identify the factors they should be considering in supporting swimmer performance, where those factors may have already been accounted for and identify what areas may also support the planning process. This may allow for deeper reflection and greater clarity on the role of each competition and parameters that should be included in the planning process based on the data of when the fastest performances may actually occur for a swimmer. The insights may also provide some ignition to coaches’ thinking and reflection processes on previous seasons’ performances. This could support the exploration of what the swimmer's competition plan may look like in terms of volume and duration, and whether there is anything the coach could consider, or do differently, to support the fastest performance at the required point of a season (i.e., swimming fastest in target competitions).
Given the nature of the sport, where swimmers are able to choose the races they competed in during the course of a season, it is pertinent to acknowledge that there was some variability in the number of races each swimmer competed in (both within and between seasons). The data indicated that whilst there was large variability in the overall number of races individual swimmers chose to compete in during a season (min 1,max 15), the median value across all swimmers (n = 3) is suggestive of a trend towards a lower number of competitions within their overall programme and to produce the fastest performance. However, given the variability in the swimmers’ racing programmes, it is not clear whether this approach to the volume of the swimmer's competition programme was deliberately planned, and is something that coaches and support staff need to be cognisant of when planning a swimmer's racing plan. Additionally, the study was also unable to take account of when the swimmer intended to reach their fastest swim. There is a note of caution to the proposed guidelines; it is important to recognise that consideration of individuality, athlete preference, age, training history, event group and athlete responses to competition and access to competition 2 is needed in determining a competition programme. Finally, the data captured from this sample group, would not capture the holistic nature of a swimmer's competition profile. This analysis can only provide a partial answer to the design of effective competition programmes, and only provides an indication of the potential markers for a coach based on this sample group.
Conclusion
The exploration of a swimmer's competition phase has revealed that the number of days and races between the first and fastest performance was influenced by format (i.e., LC or SC), stroke and distance, but not by sex. Additionally, the swimmers in both LC and SC formats produced their fastest swim in their first race of the season approximately 39% of the time. Many of the swimmers in this study produced there fastest competitive swim early in their competition programme. The constraints of the competition calendar would indicate that this situation is not optimal. The variation across the swimmers in the study maybe indicative of a need to determine evidence-based guiding principles, when planning a swimmers competition period. Developing an understanding of time course of the competition phase, and number of competitions required would facilitate the coach's planning process. In the absence of any other empirical evidence, these general recommendations (by format, stroke and distance) can provide potential markers within which a coach can plan and evaluate both current and future competition programming to enable a personal model to be constructed for each swimmer, 2 as advocated in most studies of the training–performance relationship. 37
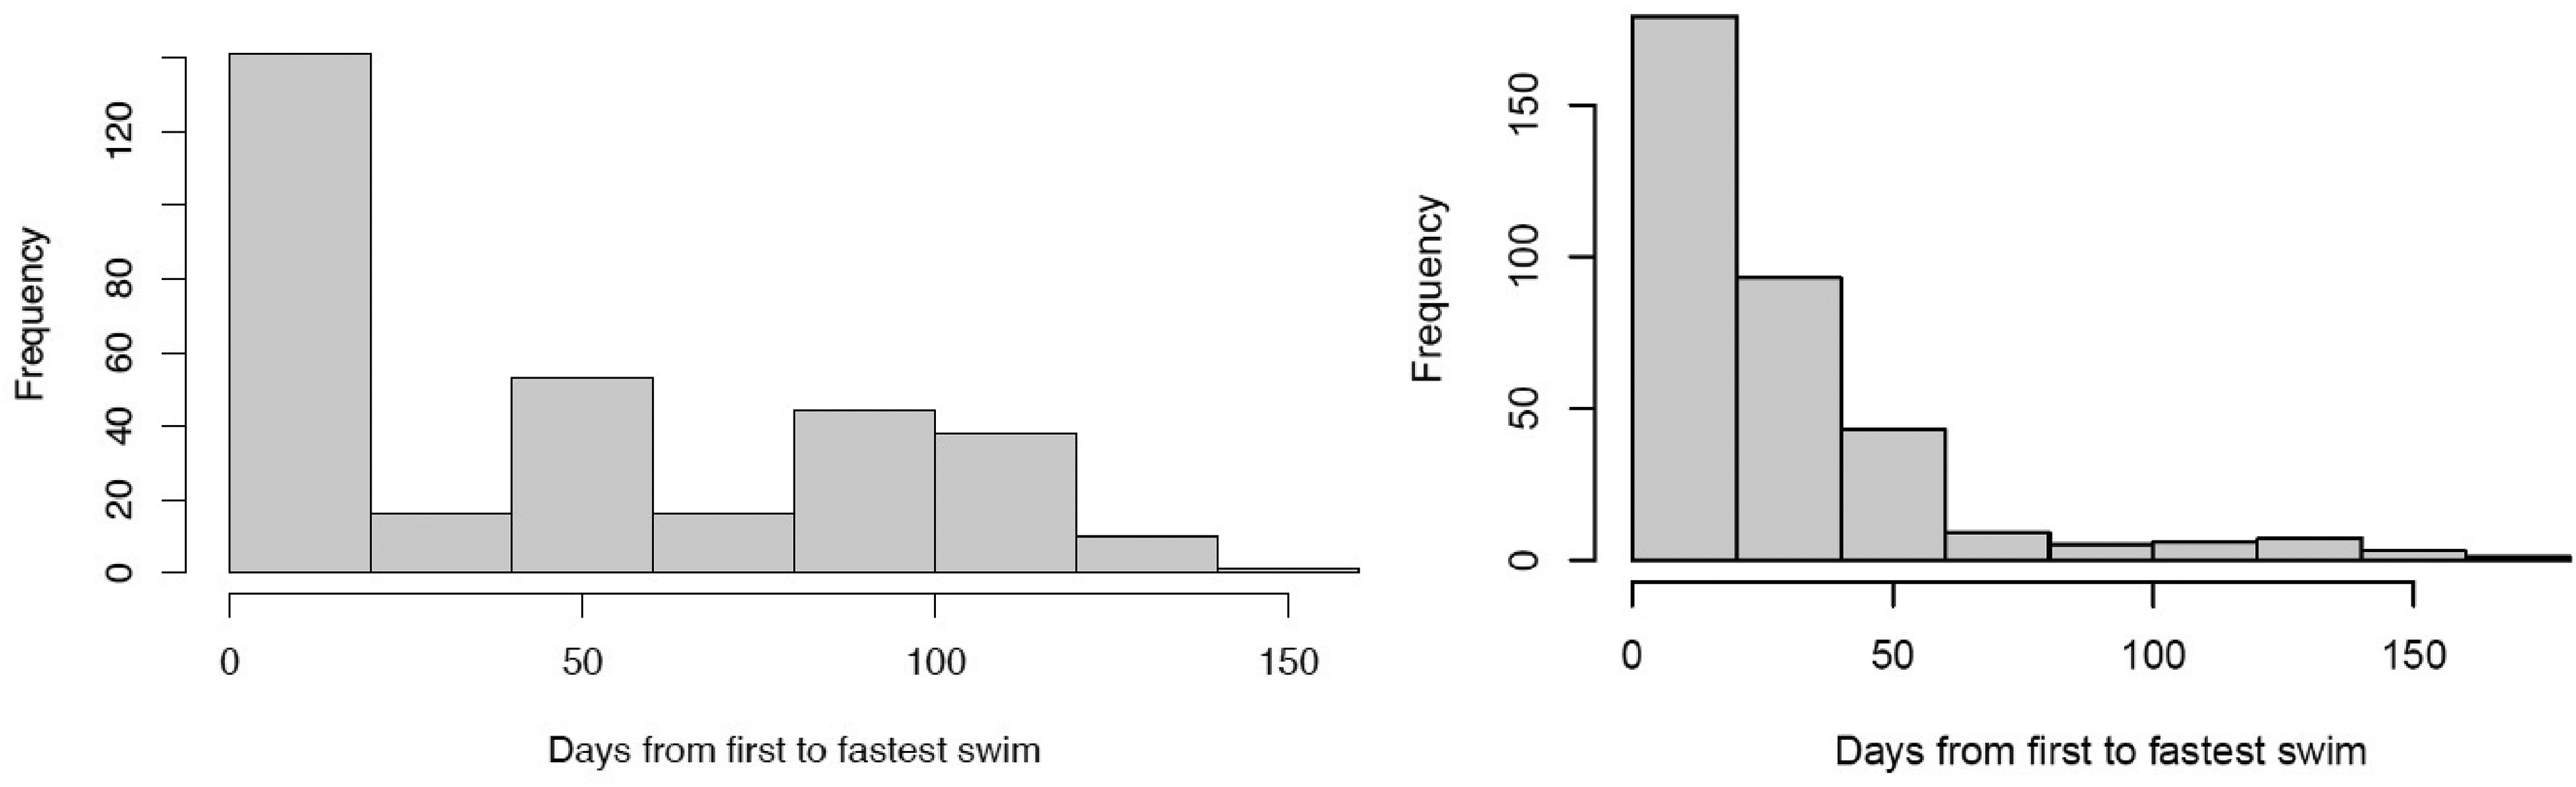
Histogram of the number of days from first to fastest swim for the LC data (left) and SC data (right). LC: long course; SC: short course.
Histogram of number of days from first to fastest swim for LC data for male swimmers (left) and female swimmers (right). LC: long course.
Histogram of number of days from first to fastest swim for SC data for male swimmers (left) and female swimmers (right). SC: short course.
Number of observations (n), mean and standard deviation of the number of races taken from first to fastest swim for each stroke in the LC and SC season.
LC: long course; SC: short course.
Number of observations (n), mean and standard deviation of the number of races taken from first to fastest swim by distance in the LC and SC season.
LC: long course; SC: short course.
Number of observations (n), mean and standard deviation of the number of days taken from first to fastest swim for each stroke in the LC and SC season.
LC: long course; SC: short course.
Number of observations (n), mean and standard deviation of the number of days taken from first to fastest swim by distance in the LC and SC season.
LC: long course; SC: short course.
Footnotes
Acknowledgements
The authors would like to thank Swim Ireland for supplying the performance data. No funding was received for the conduct of this study.
Declaration of conflicting interests
The author(s) declared no potential conflicts of interest with respect to the research, authorship, and/or publication of this article.
Funding
The author(s) received no financial support for the research, authorship, and/or publication of this article.