
Abstract
The assessment of total energy expenditure (TEE) is imperative to ensure appropriate fuelling during competition and training, although the current lack of TEE research in para sport make the prescription of nutritional strategies challenging. This study aimed to assess TEE of an elite wheelchair tennis (WT) player during training and competition of the highest level. One male WT player (age 23.6 years; career high World No. 1; body mass 65.7 kg; VO2max, 45.3 ml.kg−1.min−1) participated. Prior to the assessment, VO2max and maximum heart rate, resting metabolic rate, 10 m sprint speed and upper body skinfold measurements were made. Doubly labelled water assessed TEE during a 19-day period which included the Wimbledon Championships (5 days-3 matches), training (8 days) and the British Open (BO) (6 days-7 matches). Throughout data collection, the participant continued their usual training and preparation. During Wimbledon, TEE was 3118 kcal·d−1: 60.3 kcal·kg−1 FFM: PAL 2.0 and during BO was 3368 kcal·day−1: 65.1 kcal·kg−1 FFM: PAL 2.2. Mean daily activity was 124 mins and 132 mins, respectively. During training, TEE was 3177kcal·day-1: 61.4kcal·kg-1 FFM: PAL 2.0: mean daily activity was 138 mins. These findings show the TEE of an elite WT player captured during a period of training and high-level competition, alongside data outlining the physiological profile of a world-class para-athlete.
Introduction
Wheelchair tennis (WT) is a sport played on the same courts, surfaces and rules set out for able body tennis (AB), with the only exception being that an additional bounce is permitted before the ball is returned. The sport is played at the highest levels alongside AB tennis at Grand Slams, the Paralympics and at global events governed by the ITF (International Tennis Federation). Players are categorised by their impairment into either the Open class (an eligible impairment affecting the lower limb/s) or the Quad class (an eligible impairment affecting a minimum of three limbs). 1 WT match play involves distinctive physical and technical challenges, predominantly during multi-direction wheelchair chair propulsion whilst simultaneously sustaining shot execution. WT can be considered a moderate to high intensity sport which is predominantly aerobic in nature with an average intensity of 70 ± 9% maximal heart rate (HRmax).2,3 During match play, male Open division players typically cover 2.2 ± 0.8 km per set and reach peak speeds of 13.8 ± 1 km with rallies typically lasting three strokes or less.4,5
Although existing research on WT players has reported an estimated EE of male players during simulated match play to be 301 kcal·hr−1 and training 326 kcal·hr−1, the daily total energy expenditure (TEE) of an elite player during competition of the highest level is unknown.2,6 To date, no data exists that has directly determined the energy demands of elite WT players, or any Paralympic athletes during competition and training, to inform nutritional strategies that sustain performance and promote recovery. In this regard, the doubly labelled water (DLW) method is a non-invasive and ‘gold standard’ approach to assess TEE in free living individuals, a method not previously employed within para-sports.
Therefore, the current aim is to profile the physical characteristics and the energetic demands of a world class WT player during competition and training. To this end, an elite open classification WT player was assessed during a 19-day period comprising of participation in the Wimbledon Championships, a week of training, followed by participation in the British Open Wheelchair Championships during the summer of 2021. To contextualise the EE data presented, the study also outlines the physical demands of elite WT, along with the physical profile data of a player at the very pinnacle of the sport.
Methods
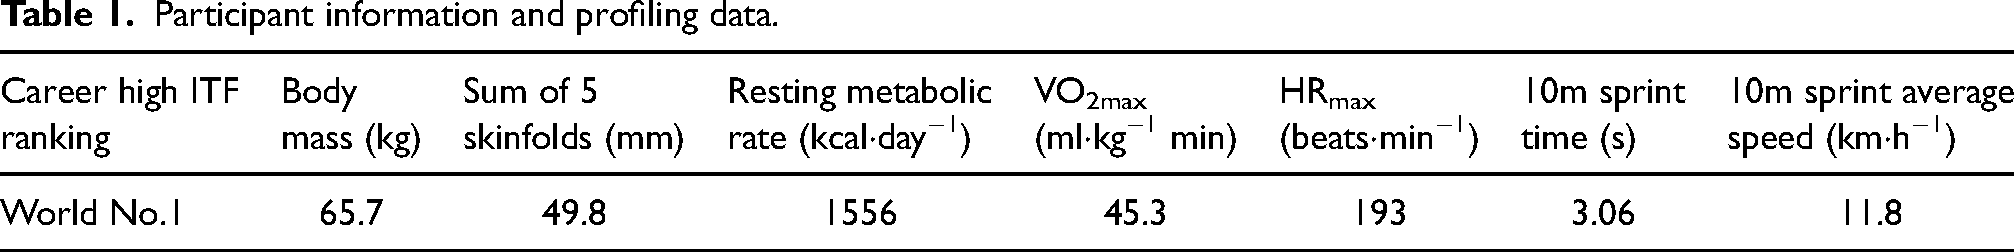
An elite male professional WT player competing in the Open category with a career high ranking of World No. 1 volunteered to participate in this study (Table 1). The study was approved by the local Ethics Committee of Liverpool John Moores University and the participant provided written informed consent before the study commenced.
Participant information and profiling data.
Study design
Data collection was conducted over a 19-day period (July 2021) comprising of participation in both the Wimbledon Championships Grand Slam tournament (grass court) and the British Open Wheelchair Championships (outdoor hard court) at Nottingham Tennis Centre, UK. Throughout data collection, the participant continued with their usual training and preparation with no changes made to their usual competition routines. Sample collection were multi-point and positioned to allow for the assessment of energy expenditure during the periods of Wimbledon Championships, during days 1–6 (P1), training, during days 6–12 (P2) and British Open, during days 12–19 (P3). 7
Daily energy expenditure (kcal·day−1) was measured using the DLW technique as validated on multiple occasions by comparison to simultaneous indirect calorimetry in humans.
8
The participant was weighed (Seca, Birmingham, UK) upon arrival at their training venue, before providing a single baseline urine sample into a labelled sample pot before sealing. Following collection of a baseline 35 ml urine sample to estimate background isotope enrichments, the participant self-administered orally a weighed bolus dose of hydrogen (deuterium 2H) and oxygen (18O) stable isotopes (Cortecnet, Voisins-Le-Bretonneux, France) in the form of water (2H218O) (witnessed by the lead researcher) and the time of ingestion was recorded. The participant was dosed in accordance to their body mass with a bolus of DLW weighed to four decimal places. Once administered, to ensure the entire dose had been ingested the glass vessel was refilled with tap water and consumed. The following morning, the participant was weighed and asked to provide a 35 ml sample of the second urine void of the day. Further second void urine samples were collected daily until day three, then continuing every 2–6 days with the last collection on day 19. Urine samples were encapsulated into glass capillaries to enable storage at ambient temperature during the field-based collection. Analysis of the isotopic enrichment of urine was performed blind, using a Liquid Isotope Water Analyser (Los Gatos Research, USA).
9
Initially the urine was vacuum distilled, and the resulting distillate was used for analysis.
10
Samples were run alongside five laboratory standards for each isotope and international standards to correct delta values to parts per million (ppm). Daily isotope enrichments were loge converted and the elimination constants (ko and kd) were calculated by fitting a least squares regression model to the loge converted data. The back extrapolated intercept was used to calculate the isotope dilution spaces (No and Nd). A two-pool model, specifically equation A6 from Schoeller et al., (1986) as modified by Speakman et al., (2021), was used to calculate rates of CO2 production.11,12


The following day, sprint speed was captured on an indoor hard surface tennis court using timing gates (TCi System, Brower Timing Systems, Draper, UT, USA) placed 10 m apart. The participant was asked to sprint maximally with racket in hand, from a static start immediately behind the first gate and continue until completely passing through the second gate. Body composition data are displayed as sum of five upper body skinfold measurements taken from subscapular, tricep, bicep, iliac crest and abdominal landmarks as outlined by the International Society for the Advancement of Kinanthropometry.
15
Only upper body measurements were taken due to the invasive nature of lower body skinfold measurement for this population. Fat free mass (FFM) was calculated from total body water analysis (18O dilution space) using the DLW method.
16
Resting metabolic rate (RMR) was measured using PNO


Quantification of activity loads and match data
Activity loads were determined by heart rate (HR) measurement using a chest mounted strap (Garmin HRM Dual, Garmin International, Inc., Olathe, KS, USA) and categorised into three %HRmax zones, < 70%, 70–85%, > 85%. 20 Competition and training distances covered were captured by gyroscope (Garmin bike speed sensor 2) placed on the wheelchair wheel with Bluetooth connection to Garmin bicycle computer (Garmin 520). Match data was sourced from the National Federation performance analysis department.
Results
Summary data and relative intensities (%HRmax) during each period are shown (Figure 1(A) to (F)). Summary data presented in Figure 1(A) and (B) represent the week comprising of participation at Wimbledon Championships and training (P1), data presented in Figure 1(C) and (D) summarise a period of training (P2), and Figure 1(E) and (F) summarise participation in the British Open Wheelchair Championships (P3). Daily distance (km), duration (mins), HRmax, HR average, peak %HRmax, average % HRmax, peak (km⋅h−1) and average speed (km⋅h−1) are shown (Figure 2(A) to (F)). The daily energy expenditure increased from 3118 kcal·d−1 during P1, to 3177 kcal·d−1 during P2, and to 3368 kcal·d−1 during P3 (Figure 2A), resulting in PAL values of 2.0, 2.0 and 2.2, respectively. When expressed relative to FFM, energy expenditure in P1, P2 and P3 corresponded to 60.3, 61.4 and 65.1 kcal·kg−1 FFM, respectively.
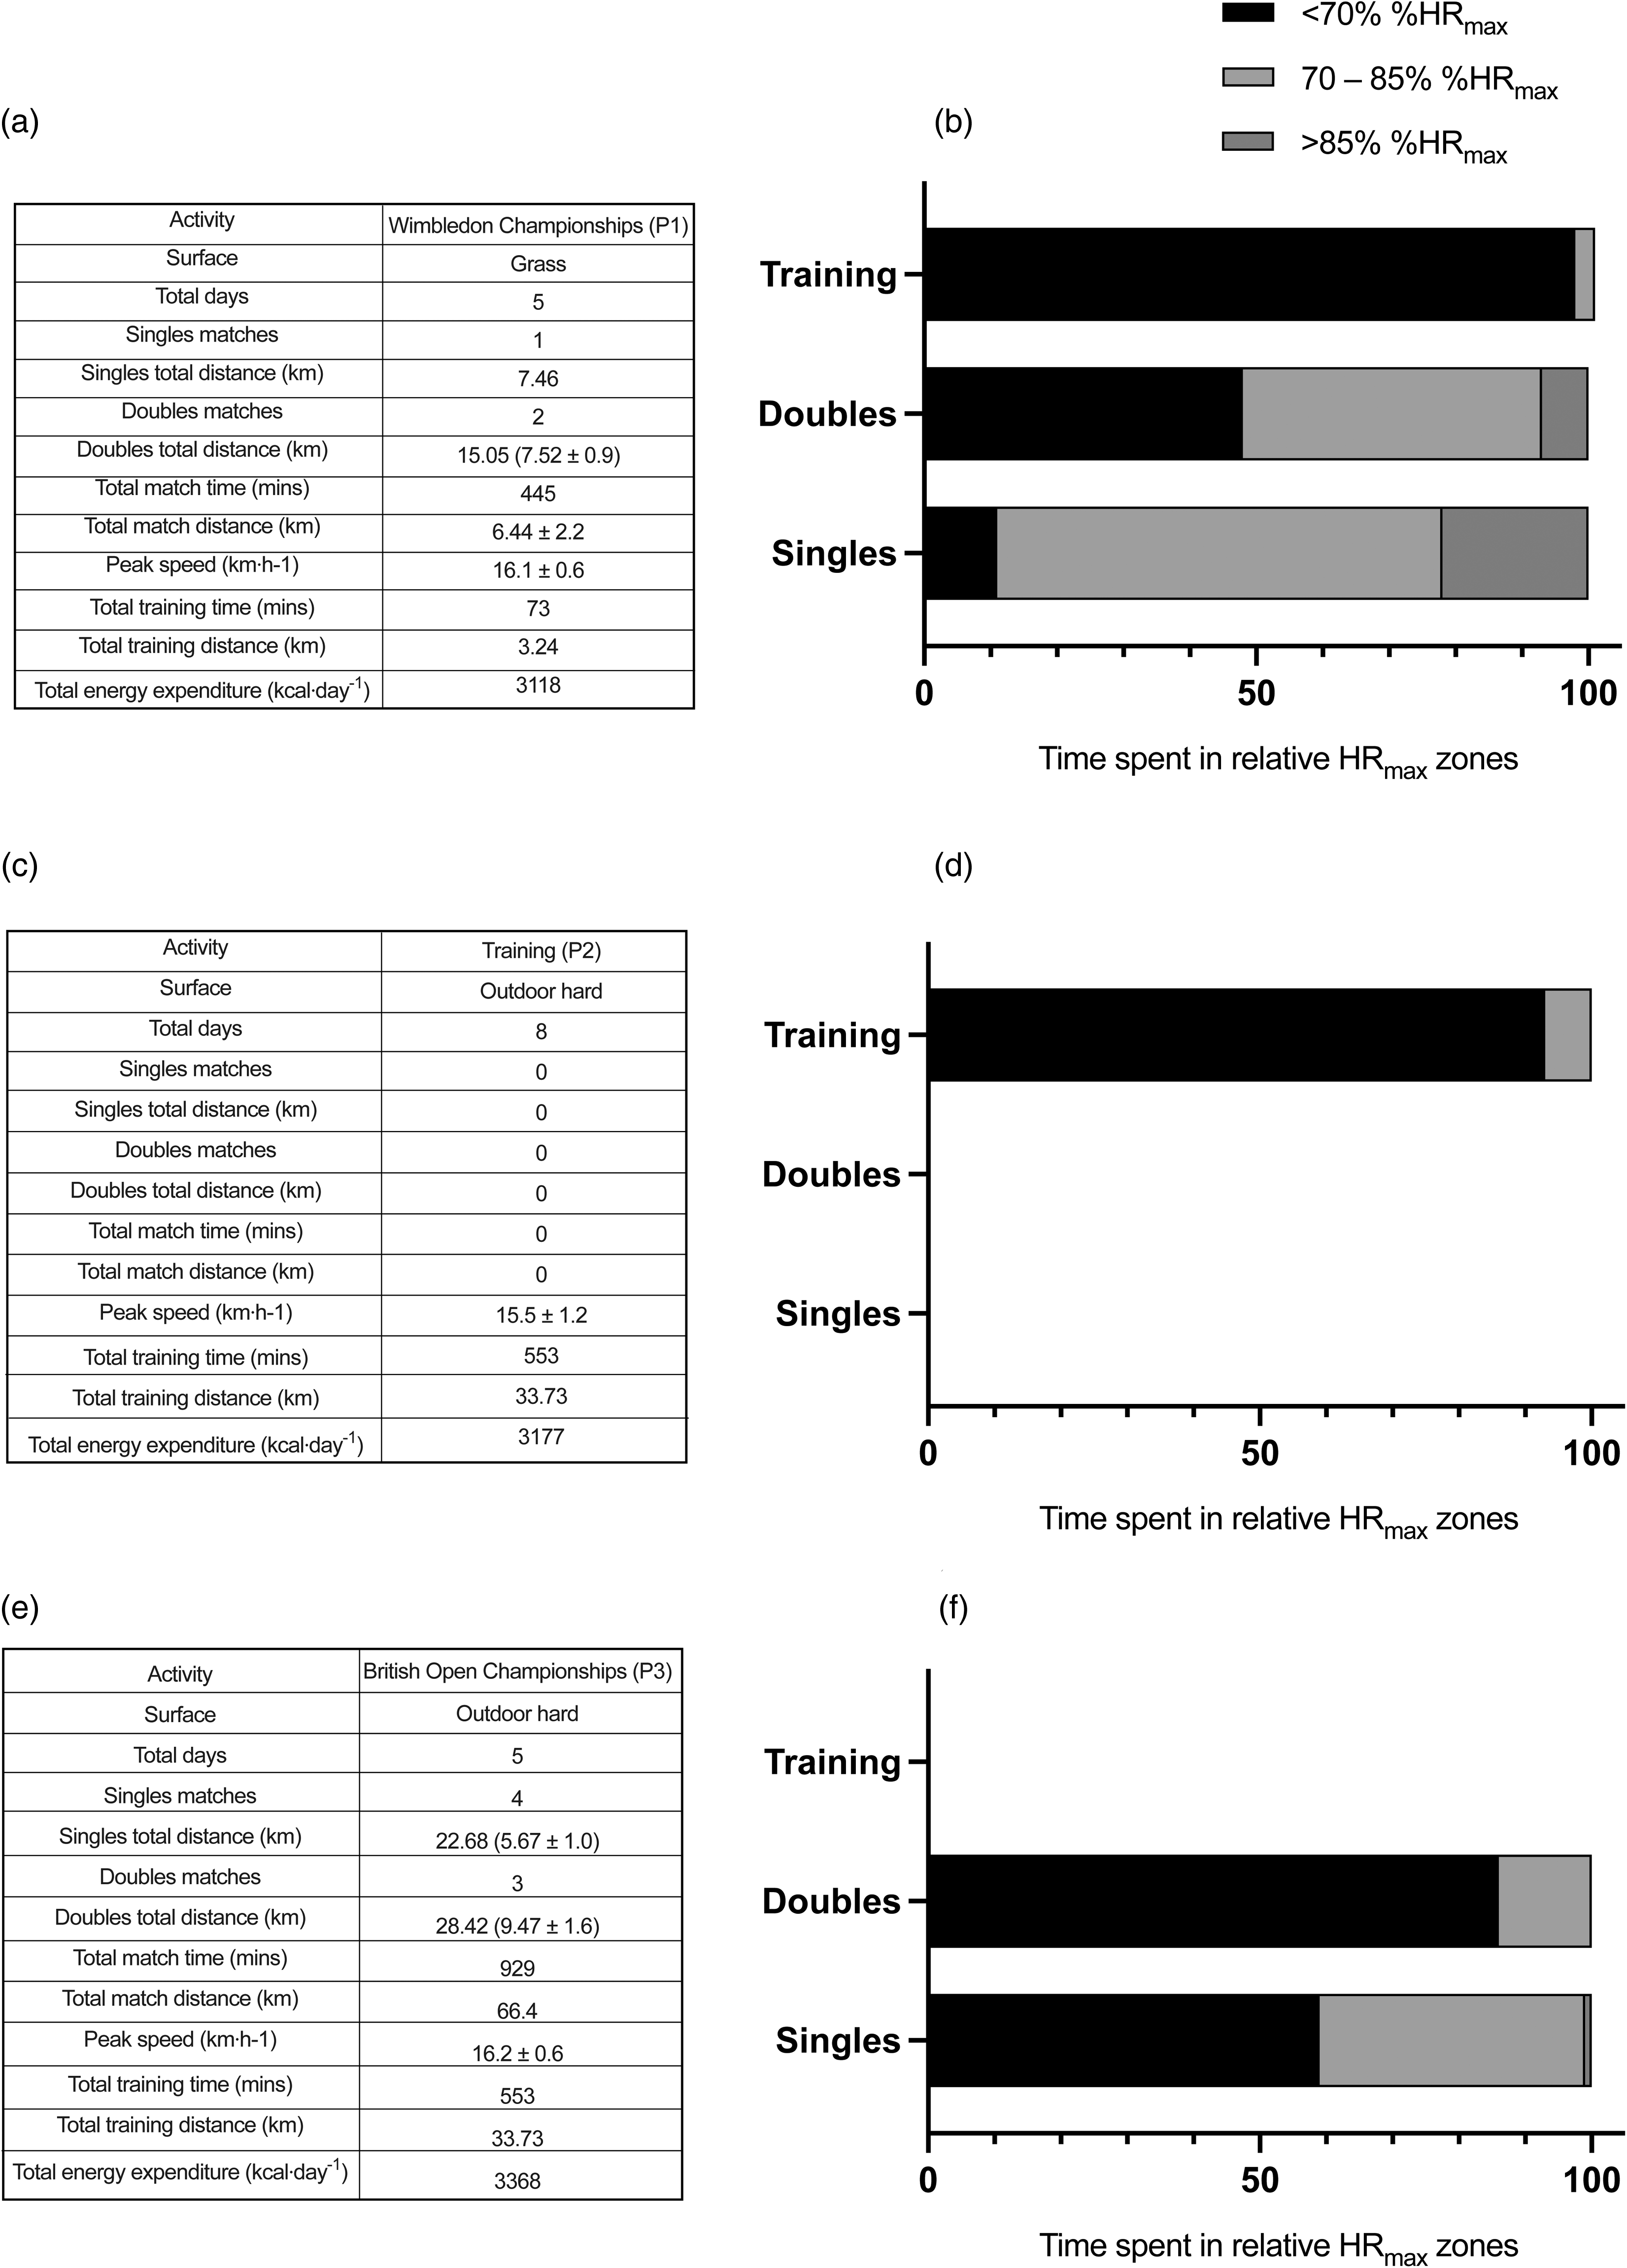
Activity summary data (a, c, e) and time spent (% mins) in relative HRmax zones (b, d, f) during each period.
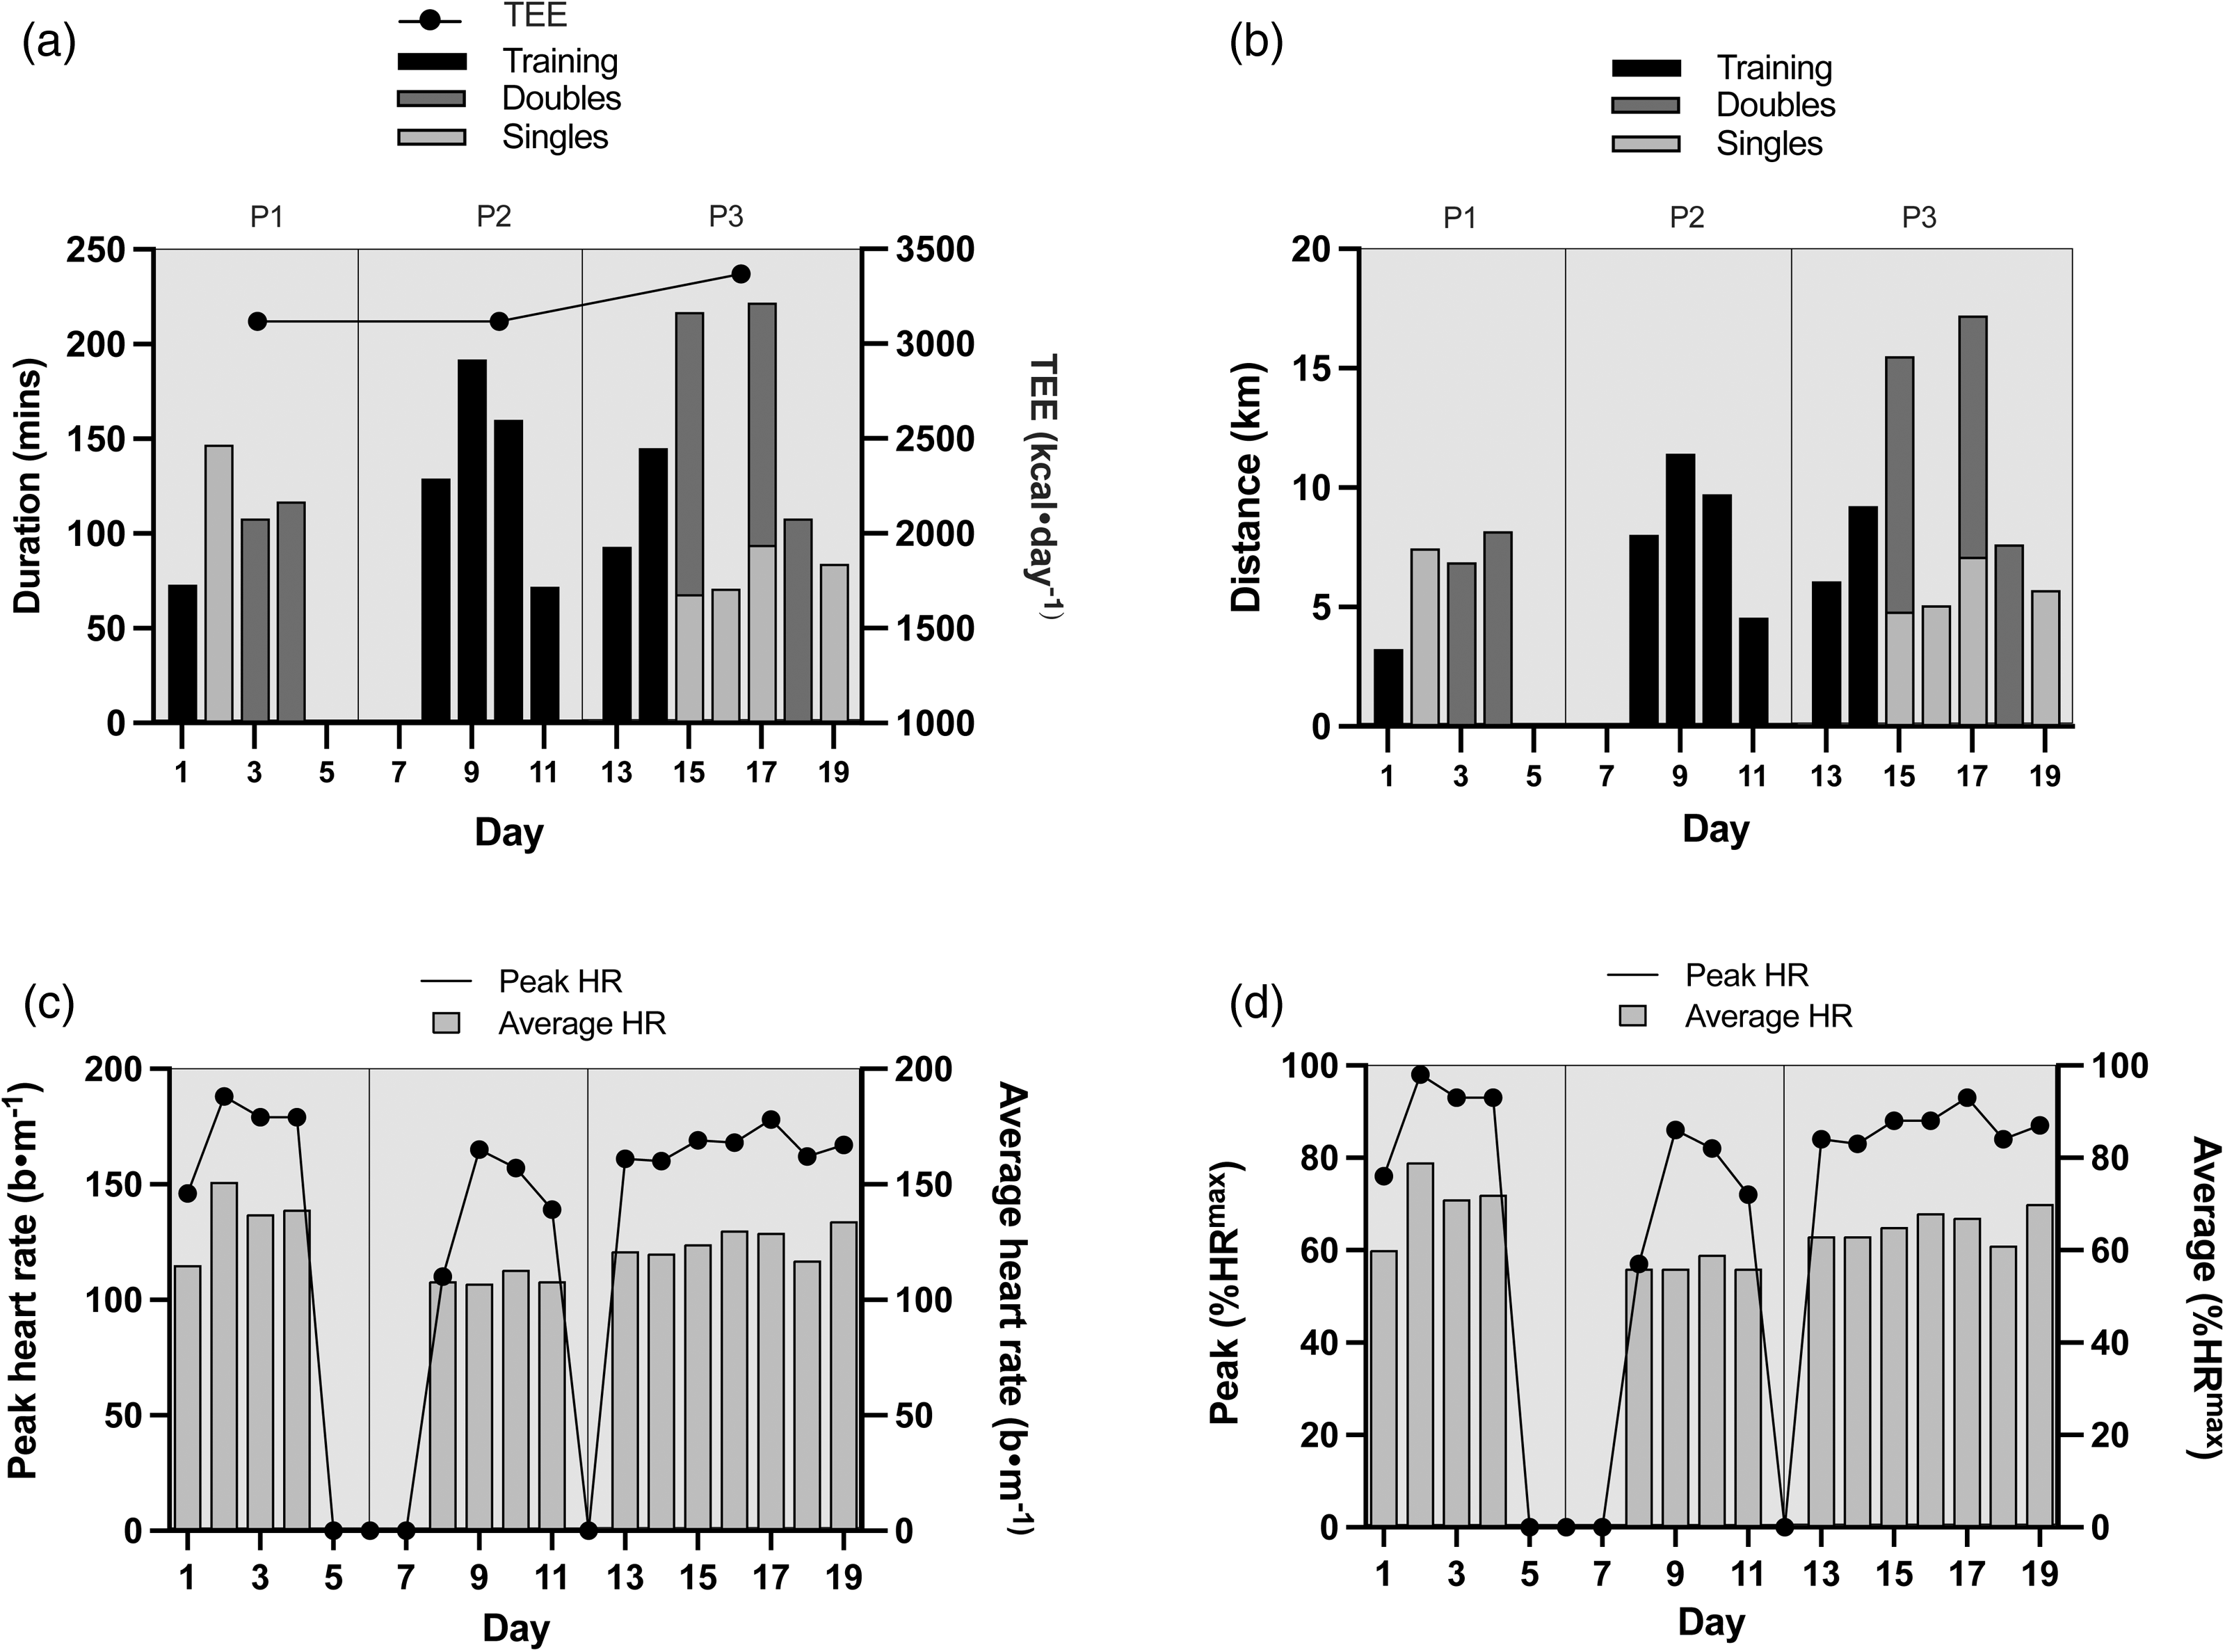
Daily duration (min) and TEE (kcal·day−1) (a), distance (km) (b), absolute HRpeak data (b·m−1) (c) and relative HR data (%HRmax) (d) are shown.
In P1, three matches were played (one singles and two doubles) with a mean daily duration of 124 ± 20 min (in a range of 117–147 min) and covering a mean daily distance of 7.5 ± 0.6 km (7.5–8.2 km). During P2, the player had training with no competition, amounting to a mean daily duration of 138 ± 51 min (72–192 min) and a mean daily distance of 8.4 ± 2.9 km (4.6–11.4 km). During P3, seven matches were played (four singles and three doubles) with a mean daily duration of 132 ± 61 min (71–222 min) and a mean daily distance of 9.5 ± 4.9 km (5.1–15.5 km). Strokes per rally were 3.5 ± 0.1 during singles match play and 7.5 ± 0.7 during doubles.
Discussion
We report for the first time the energy demands of a world class elite WT player during 19 days of training and competition played at the highest level in the male Open category. The data shows a small stepwise increase during each period of collection (P1; 3118 kcal·d−1, to P2; 3177 kcal·d−1, to P3; 3368 kcal·d−1) perhaps logically explained by the increase of duration and distance covered during activity in each period. It should be appreciated that given potential differences in WT match play demands within Quad division, and female Open category, this data is specific to the male Open category.
When compared to our previous data from a male AB player, we report lower absolute TEE during training (3177 vs 3712 kcal·day−1) and competition (3368 vs 5520 kcal·day−1). 21 To the best of our knowledge, currently no DLW data exists that has explored the TEE of full-time paralympic athletes to compare. To contextualise the data shown here, TEE during P3 is comparable to that of AB English Premier League soccer players (3566 ± 585 kcal·day−1). 22 However, when considering the relative TEE of 65.1 kcal·kg−1 FFM, we see a value closer to that of AB rugby league players (70.1 kcal.kg−1 FFM), than that of English Premier League soccer players (54.9 kcal·kg−1 FFM).22,23 Such data highlights the high energy demands of a sport that is dependent solely on the upper body for both propulsion and all technical aspects. This data presented PAL values between 2.0 and 2.2, values that are associated with a ‘vigorous lifestyle’. 19 When considering the practical application of the data and the variation of physical function across the WT Open category, utilising these PAL values may be prudent when formulating nutritional strategies due to presence of RMR in the PAL calculation. It is worth noting, the data collection during P1 and P3 occurred during a period of strict competitive ‘bubbles’ designed to eliminate infections during the global Covid-19 pandemic. This may have reduced non-exercise thermogenesis (NEAT) due to travel and activity outside of essential competitive and training being tightly controlled. However, the lack of activity outside of training and competition has provided a clearer assessment of the specific TEE of the sport.
When considering the mean total distances of all matches reported here (singles 6 ± 1.2 km, doubles 8.7 ± 1.6 km) as a per set value, the 2.8 ± 0.5 km is similar to the 2.2 ± 0.8 km per set during analysis of WT singles match play which included players ranked in the world top 8. 5 We found doubles to have greater distances per set (4.3 ± 0.8) presumably due to the continual circulating movement and positional adjustment of both team members. However, peak speeds here (16.2 k·m−1) are higher than the 12.2 and 13.8 k·m−1 previously reported.5,24 Reasons for the variance may be due to differences in the methodology used to collect speed data (wheel mounted gyroscope vs data logger), participant rank and/or competition level. Nevertheless, the peak speed recorded here during match play, correspond with the peak speed of 16.3 k·m−1 (from gyroscope data) within an average speed of 11.8 k·m−1 (from timing gate data), recorded during 10 m sprint testing for this individual. Furthermore, during singles match play, 3.5 ± 0.1 strokes per rally were similar to the 3.2 ± 0.5 previously found. 5 Interestingly, we found doubles strokes per rally to be 7.5 ± 0.7, higher than the 3.41 ± 2.27 previously found during AB doubles match play. 25 Although differences of distances covered between AB singles and doubles players has not been investigated, it would be presumed to be lower in the AB doubles format than AB singles, as doubles matches generally see a shorter, faster match. 26
The mean HR during all match play reported here (69 ± 5%HRmax) is similar to 70 ± 9%HRmax previously reported during WT singles match play. 2 The HR data shown here suggests that singles play was of higher intensity than doubles (Figure 1). It should also be noted that the match intensities during P1 were higher than P3, while a definitive reason is unknown, it is interesting that the two periods were played on different surfaces. Although Wimbledon grass courts are believed to be faster playing surface with lower ball bounce, research has shown grass to increase rolling resistance for the wheelchair user.27,28 Combined with subjective player feedback reporting that grass is ‘a harder surface to push on’, this points towards a potential reason for the increased intensity shown. To determine VO2max of the participant, a wheelchair specific tennis court incremental protocol was used, resulting in 45.3 ml·kg−1·min−1. A value higher than that captured in paralympic basketball players (37.9 ml·kg−1·min−1) and swimmers (39.0 ml·kg−1·min−1), and similar to track and field athletes (44.9 ml·kg−1·min−1). 29 The data presented here can begin to benchmark the physical attributes required for WT played at the highest level.
In summary, we report for the first time the daily TEE of a world class elite male WT player with a career high of world number 1 during a 19-day period that included training and competition. Additionally, to our knowledge, we present the first TEE data of any elite para sport athlete captured by the DLW technique during competition. Such data therefore provide a platform to begin the formulation of specific nutritional and training strategies (for on and off the court), and will hopefully stimulate further research into elite Paralympic athletes.
Footnotes
Acknowledgements
This project was financed by the Lawn Tennis Association. The authors sincerely thank the player and team for providing their time and support to this project.
Declaration of conflicting interests
The author(s) declared no potential conflicts of interest with respect to the research, authorship, and/or publication of this article.
Funding
The author(s) disclosed receipt of the following financial support for the research, authorship, and/or publication of this article: This project was financed by the Lawn Tennis Association.
Informed consent
The participant has reviewed the case study, is aware they may be identified, and has consented to publication and distribution.