
Abstract
The success of a soccer player is not entirely pre-destined by their physical ability, talent, and motivation. There are certain decisions along the way that greatly affect the arc of their career: which skills to develop, and which club to sign a contract with. In this paper, we identify the optimal strategic choices toward multiple potential aims a soccer player can have and we seek the knowledge of what made the greatest soccer players in terms of those decisions. Our two main data sources are Transfermarkt and Sofifa from which we collect data for the period between 2007 and 2021 with 29,231 players. We perform time series analysis on skill features of soccer players, and network analysis of the players’ acquaintance graph, i.e., a graph that indicates whether two given players have ever been teammates before. Finally, we create key performance indicators to check the differences in certain features, i.e., individual player skills and connectivity attributes, between top-tier and the rest of the players, and use dynamic time warping for validation. The outcome of this work is a recommendation tool that helps players to find what needs to be improved in order to achieve their desired goals. The source code and the career advisor tool for soccer players that we have implemented are available online.
Introduction
With the growing importance of the statistical approach to achieve competitive advantage, the quantity and quality of sport-related data have drastically increased. First baseball, basketball, hockey, and American football enjoyed the benefits of data analytics1–3 but now with the explosive growth of available soccer data, there are plenty of use cases where a solution or tool is developed for soccer, which can lead to a competitive advantage for both teams and players.
Our research goal is to create a tool, a so-called handbook, which can identify the optimal career and development plan for young professional soccer players to achieve their desired goals. For example, which is the optimal career path in order to play in one of the top leagues of the world, or what path should the player follow to be one of the most expensive players in the world? We create a model based on high-level features, like the FIFA computer game's skill values of the players and graph metrics extracted from a social network between footballers to identify the outstanding ones, and we define the right decisions for the players with high potential. Our aim is to generalize our decision-supporting solution, so we do not consider only cutting-edge teams and top leagues, we also derive insights from teams and players that are in less developed countries and lower-tier leagues.
In this paper, we describe the steps that we took along the way to creating a career handbook. With data mining and network analysis, we examine professional soccer players’ different dynamical properties and look for the main differences between the players that stand out with respect to a given career goal and the rest of the players. We argue that the findings could successfully highlight those skills that should be developed with great emphasis to become world-class players. Identifying successful professional career path patterns is important for soccer players, their managers, and clubs to make optimal career decisions, club selection, and lucrative player transfers, respectively. Specifically, for players who aspire for excellence during their careers ahead of them, it is of paramount importance to make reasonable choices in decision situations, e.g., focusing on improving specific skills, or selecting their next club. Our handbook is useful for anyone who seeks knowledge of what made the greatest soccer players in terms of those decisions. We implement and test our model on four selected career goals, which we invented using the principles of setting smart goalsa: what attributes are necessary to improve to achieve a market value over €10M, to play in the English Premier League, to get into the Team of the Season,b and to greatly increase the most important skills depending on the players’ position in a soccer team.
We collect information from different sources, which we use in our models, and also create our own features using network metrics. We develop a model to find the most vital skills for each and every position to deal with the problem of the different needs of positions. With a classification model, we identify the features that have the largest effect on reaching a given career goal and we create key performance indicators (KPIs) with these features. We separate the players into two groups, calling the world class players ‘top’ players and the others as the ‘rest of the players’ so we can study the difference between those who achieved a certain goal and those who did not. To validate our separation, we use dynamic time warping to compare the distance of the KPI time series of the players. Comparing the player attributes to the top group, we create fitness scores that represent the chance of reaching the given career goal.
The paper is organized as follows. First, in Section ‘Literature review’, we present the results of related network science and sports analytics research. In Section ‘Method’, we present our data mining method. First, the data collection process is presented, including data cleaning, feature elimination, and transformation due to the inflation of the players’ transfer market value. Then, we describe the properties of our constructed acquaintance network, with great emphasis on scale-free networks and the small-world property, and we present the features extracted from this network, which we also use in our models. Then, in Section ‘Results’, we specify our machine learning models to analyze the importance of the features in different career goal scenarios. Using the most important metrics, we create KPIs, that represent the most vital attributes of the players along their careers. Analyzing the evolution of these KPIs is the way to identify what is the key for success among the world-class players. In Section ‘Discussion’, we show an illustrative example of how our tool can be used, what conclusions can be drawn from the results, and we list the limitations of our tool. Finally, we summarize our findings in Section ‘Conclusion’.
Literature review
One of the biggest breakthroughs in the world of network science was brought by Pál Erdős and Alfréd Rényi 4 who discovered random networks. They both wanted to examine complex graphs, but at that time it was not that obvious how to model networks. They thought most of the networks that occur in real life are unpredictable, asymmetric in structure, and rather appear random. Due to this assumption, the formation of graphs was characterized by the principle of randomness, which means that the best way to build a graph is to add the edges completely randomly between the nodes. Accordingly, each vertex has the same probability to collect edges, so most of the nodes have approximately the same degree. This means that if we want to draw a histogram of the degrees, we get a curve with a binomial distribution. This was proven by Béla Bollobás in 1982. 5 The degree distribution, in this case, follows a bell curve, it has a maximum point, and the degrees of other vertices do not deviate much from this. We do not find vertices with extreme degrees that differ from the average to a large extent. This suggests that, if it were a social network, all people would have nearly the same number of acquaintances. Although most networks today are known to be non-random networks, their discovery has greatly contributed to the development of network science.
Numerous unweighted networks have been proven to be small-world networks, which have unique characteristics: according to, 6 small-world networks have higher clustering coefficients thanks to the many complete subgraphs. 7 Clustering coefficient is a metric in network science, which measures the probability of two neighbors of a vertex being adjacent to each other. Real-world networks usually have a clustering coefficient between 0.1 and 0.5. 8 Another vital feature of small-world networks is that the length of the average distance grows only logarithmically with the number of vertices. 9 Consequently, the average distance is relatively small. According to, 7 the diameter, which is the largest shortest distance between nodes, is also small in small-world networks. Additionally, the degree distribution of such networks follows a power-law distribution. This means most of the nodes have a small degree while only a few have greater degrees. These nodes are responsible for the weak connections, and we usually call those hubs. Such scale-free networks are all small-world networks 10 and inherently differ from random networks.
Researchers have already tackled the analysis of networks in the world of sports. Yamamoto and Yokoyama examined the networks that emerged in a soccer game, representing the players and the passes between them. 10 They concluded that the degree distribution follows a power law and that the exponent values are similar to real-world networks. They also managed to identify the key players who play a big role in the team's performance. Pena and Touchette 11 also used information about passes to create networks and to describe soccer strategies, just like the authors of 12 did, who analyzed an UEFA Champions League match. They visualized the line-up of the teams and determined the importance of the players. Medina et al. 13 used social network analysis to determine match results. They not only developed and analyzed networks but also studied their relevance to the results. Cintia et al. 14 measured team performance with networks as well. They not only used passes to determine the edges between players, but many other actions as well, like tackles, fouls, clearances, etc. They observed that the network indicators correlate with the success of the teams, and then used them to predict the outcome of the matches. Clemente et al. 15 suggested that defenders and midfielders have the highest connectivity in the team. Clemente et al. 16 got similar results when they analyzed the Swiss national soccer team in the 2014 FIFA World Cup. The authors of Ref. 17 used graph theory and complex networks to understand the play structure of the team. They used clustering and centrality metrics to describe the offensive play. Opposed to the listed works that all analyze in-game relationships, our intention is to create a graph theoretical model on player level in order to access relationship information between soccer players. We use these networks to extract valuable information about the player’s acquaintance and create different features which we use to expand our dataset that we use to create our tool.
Several related works have appeared on the topic of career choices of sports professionals. Bettina Schroepf and Martin Lames searched for career patterns in German soccer youth national teams. 18 They managed to find eight typical career types. It has been found that the careers of youth players last up to 1 or 2 years in Germany and only a few players can achieve long-lasting careers. It is interesting how high the churn rate is by young players in major European soccer nations, so it is already a privilege for someone to be among the pros. In our paper, we broaden the search and try to find career paths of adult players around the globe. A recent study revealed that in Portugal the length of a career as a soccer player decreased, but the years of youth career increased: it follows that the career path started earlier in the last three decades. 19 Remaining in Portugal, Monteiro et al. 20 identified that the best result the players performed was at the age of 27 and they ended their careers at around 33. Other researchers revealed that the peak performance by female soccer players is around the age of 25, 21 and between 25 and 27 22 in the case of male players. In our study, we collected data about players between the ages of 15 and 47 and most of the examined players were between the ages of 22 and 27.
Identifying the career potential of athletes is a difficult task. Coaches play a big role in this aspect, because they have the closest relationship with the players. However, they also encounter difficulties. In Cripps et al. 23 the authors found that coaches can predict the career outcome more accurately for late-maturing athletes, but they are less accurate for early maturing players. It is important to keep in mind that the way of maturation can easily affect the career path both positively and negatively. Vroonen et al. 24 predicted the potential score (available on Sofifa.com) of professional soccer players. They selected a player and searched for similar players of the same age. Based on the evolution of the latter, they predicted if he or she had a great potential score in the future. In contrast, in our paper, we recognize continuous market value growth patterns, and we show which attributes are required to be improved to achieve this goal.
It is also interesting to see how psychology affects performance in terms of success. Schmid et al. 25 found patterns in rowing by connecting these variables. They measured the proactivity, ambition, and commitment of the athletes: if a highly motivated rower had poor performance in the recent past, it was more likely that he or she performed at a high level in the future, but athletes with low morale and motivation were more likely to drop out or perform weaker. 25 Highly achievement-oriented players have a better chance to accomplish an outstanding career. 26 Due to the lack of input data, we have not used psychological features in our model.
In contrast to the relevant research from network science and sports analytics, the key difference we identify in them compared to our work, is that we use both graph analysis and data mining in order to find the traits of a successful professional career in soccer. We derive important features from small world graphs, i.e., social networks of the professional soccer world, which we later use in our models.
Method
We use two main sources of data for our analysis: Sofifa.com c and Transfermarkt.com. d From Sofifa we collect data, which covers 15 years (2007–2021), about players included in the FIFA video game database, containing 33 different skill scores like dribbling, short passing, or finishing. The skill variables rank players on a scale of 1 to 100, where higher numbers mean better skill levels. The detailed explanation of these skill features can be found on the FIFA ultimate team website. e Unfortunately, EA Sports, f the publisher of the game, keeps the method of calculating the player skills confidential, but Michael Mueller–Moehring, who is responsible for the ratings, shared some details for ESPN.com. g According to him, there is a group of 9000 people who serve as data reviewers: they watch every player live and evaluate the performance of the players. Advanced statistics of the players are also considered, but those alone are not sufficient as no such data is available for numerous leagues. EA Sports also has 300 data editors, who merge the input from the data reviewers with the available statistics and create the skill attributes of the players. There are some known limitations in the process, as some attributes are difficult to measure like trapping and ball control. Also, the playing style of the teams can affect the attributes, just like the league they belong to, e.g., playing for a team that has a possession-based style usually means higher passing ability scores, although the data editors continuously try to mitigate these issues. However, several academic articles have been published in which results are based on the Sofifa dataset. Beside the previously mentioned potential score prediction of Ref. 24, Cefis 27 used a partial least squares path modeling approach in order to create a new performance index based on the original Sofifa player skill attributes, furthermore Refs. 28 and 29 built on this datasource for player performance and match outcome prediction.
We omit the defensive awareness and speed variables from our dataset, because they were not used between 2007 and 2019 in this system. This dataset also contains some personal information of the players, like nationality, market value, age, position, division, and league.
We have found major quality issues in the Sofifa dataset in terms of market values: missing data between 2007 and 2011, and extreme fluctuation in the values between 2012 and 2016. Therefore, we have also collected the players’ market value information from one of the most reliable sources regarding soccer players valuation, i.e., Transfermarkt.com, and compared the two sets. In 2018, Franziska Prockl and Bernd Frick analyzed the reliability of the website Transfermarkt regarding the market values and they found that the prices generated on the site are close proxies to the actual player values. 30 The values extracted from the site are also used in various scientific analyses, for example in Göke et al. 31 or in Lepschy et al. 32 We have found a significant difference between the market values of the two sources. In order to verify whether the two datasets are drawn from the same population, we applied Mann–Whitney U-, and Kruskal–Wallis H-tests for every year from 2012 to 2021. Except for 2012, we had to reject the null hypothesis at 0.05 significance level: so, the market values reflected in the Sofifa and Transfermarkt dataset do not match. The mean year-over-year changes are also significantly different. We, therefore, use the market values from Transfermarkt during the analysis.
Transforming the market value feature to handle the surge in player prices
We have found that the price inflation in the soccer world seems to supersede the regular monetary inflation. £1 in 1990 is worth £2.39 in 2021, which means 138% cumulative change, h while in the world of soccer player transfers £1 in 1990 is worth £40 in 2021. As a stellar illustration, in 1989 the whole squad of Manchester United was worth £20M, i while today only Cristiano Ronaldo's market value is twice as much at £40M. With this observation, we calculate the inflation rate of the market values over the collected 15 years in order to bring player values to comparable levels for our analysis.
We have tried different approaches to handle this extreme price surge: we linearly adjust the market values of each year to match the mean, median, and the third quartile statistics with those of the latest year. By doing so our intention is to set the values of each year to their present value as close as possible. We have found that the best statistic is the third quartile: we set it in 2021 as the base value being €1.8M and linearly scaled each year's values to bring their Q3 to €1.8M. Thanks to this, the year-over-year changes become uniform, the sudden changes in pricing and even the effects of the 2014–2016 market value boom disappear. The mean and median methods are not the best approaches, because due to the paramount differences in market values between the high-end and the rest of the players (75% of our players have €1.8M or less market value in 2021, while the top 10% of the players are over €8M), they cannot adjust the market values sufficiently to handle inflation. Figure 1 shows the original market value distribution for every year between 2012 and 2019. About 75% of the players have less than €1M (∼6 in log10 form) value between 2012 and 2014, but this increases to €1.5M (∼6.2 in log10 scale) after the market value boom.
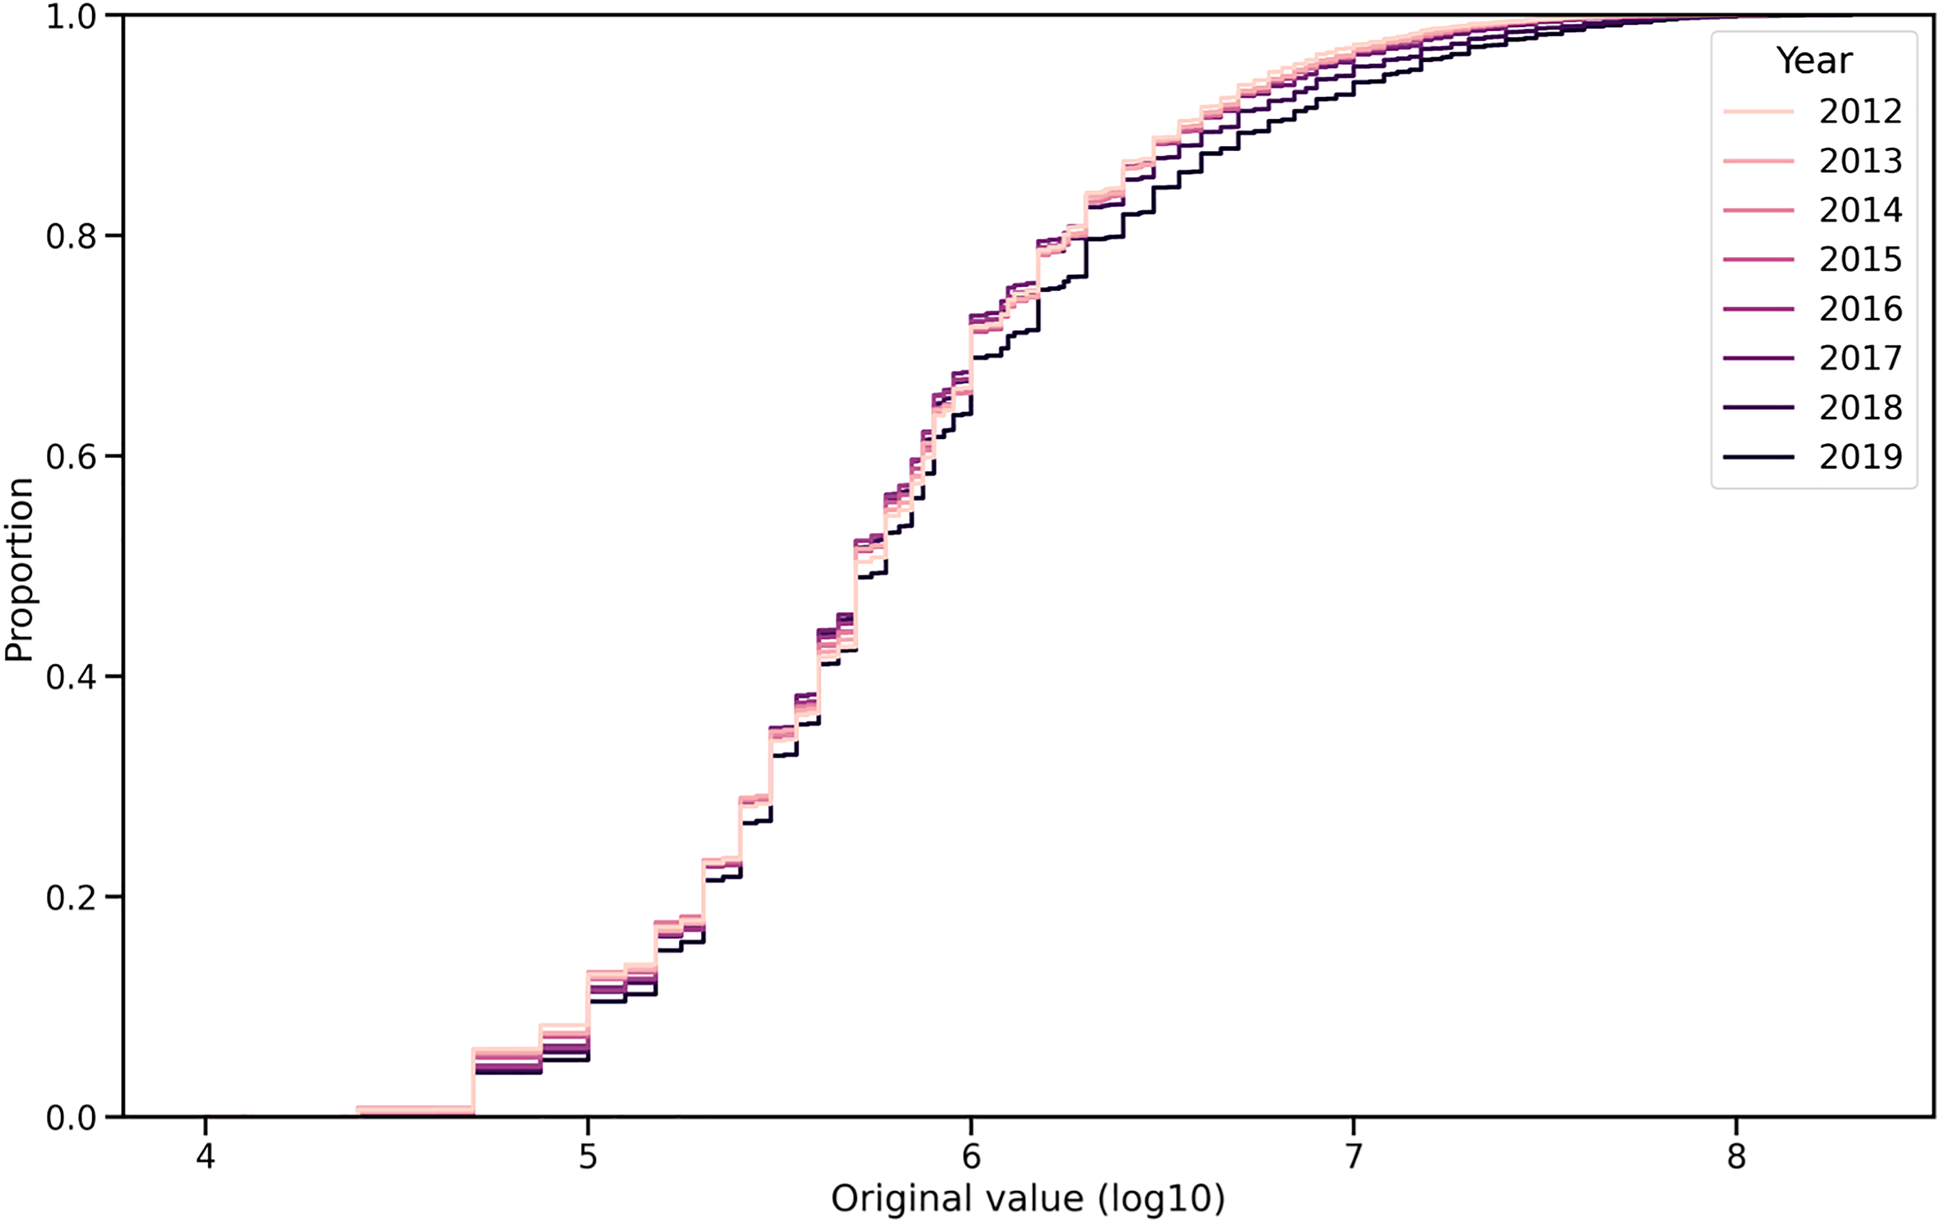
CDF of the original market values in logarithmic scale.
Figure 2 shows the market value distribution after the adjustments of leveling the third quartiles. The distributions approach to one another in the upper segment: the market values of the high-end players (where the difference was spectacular due to the inflation) become closer to each other.
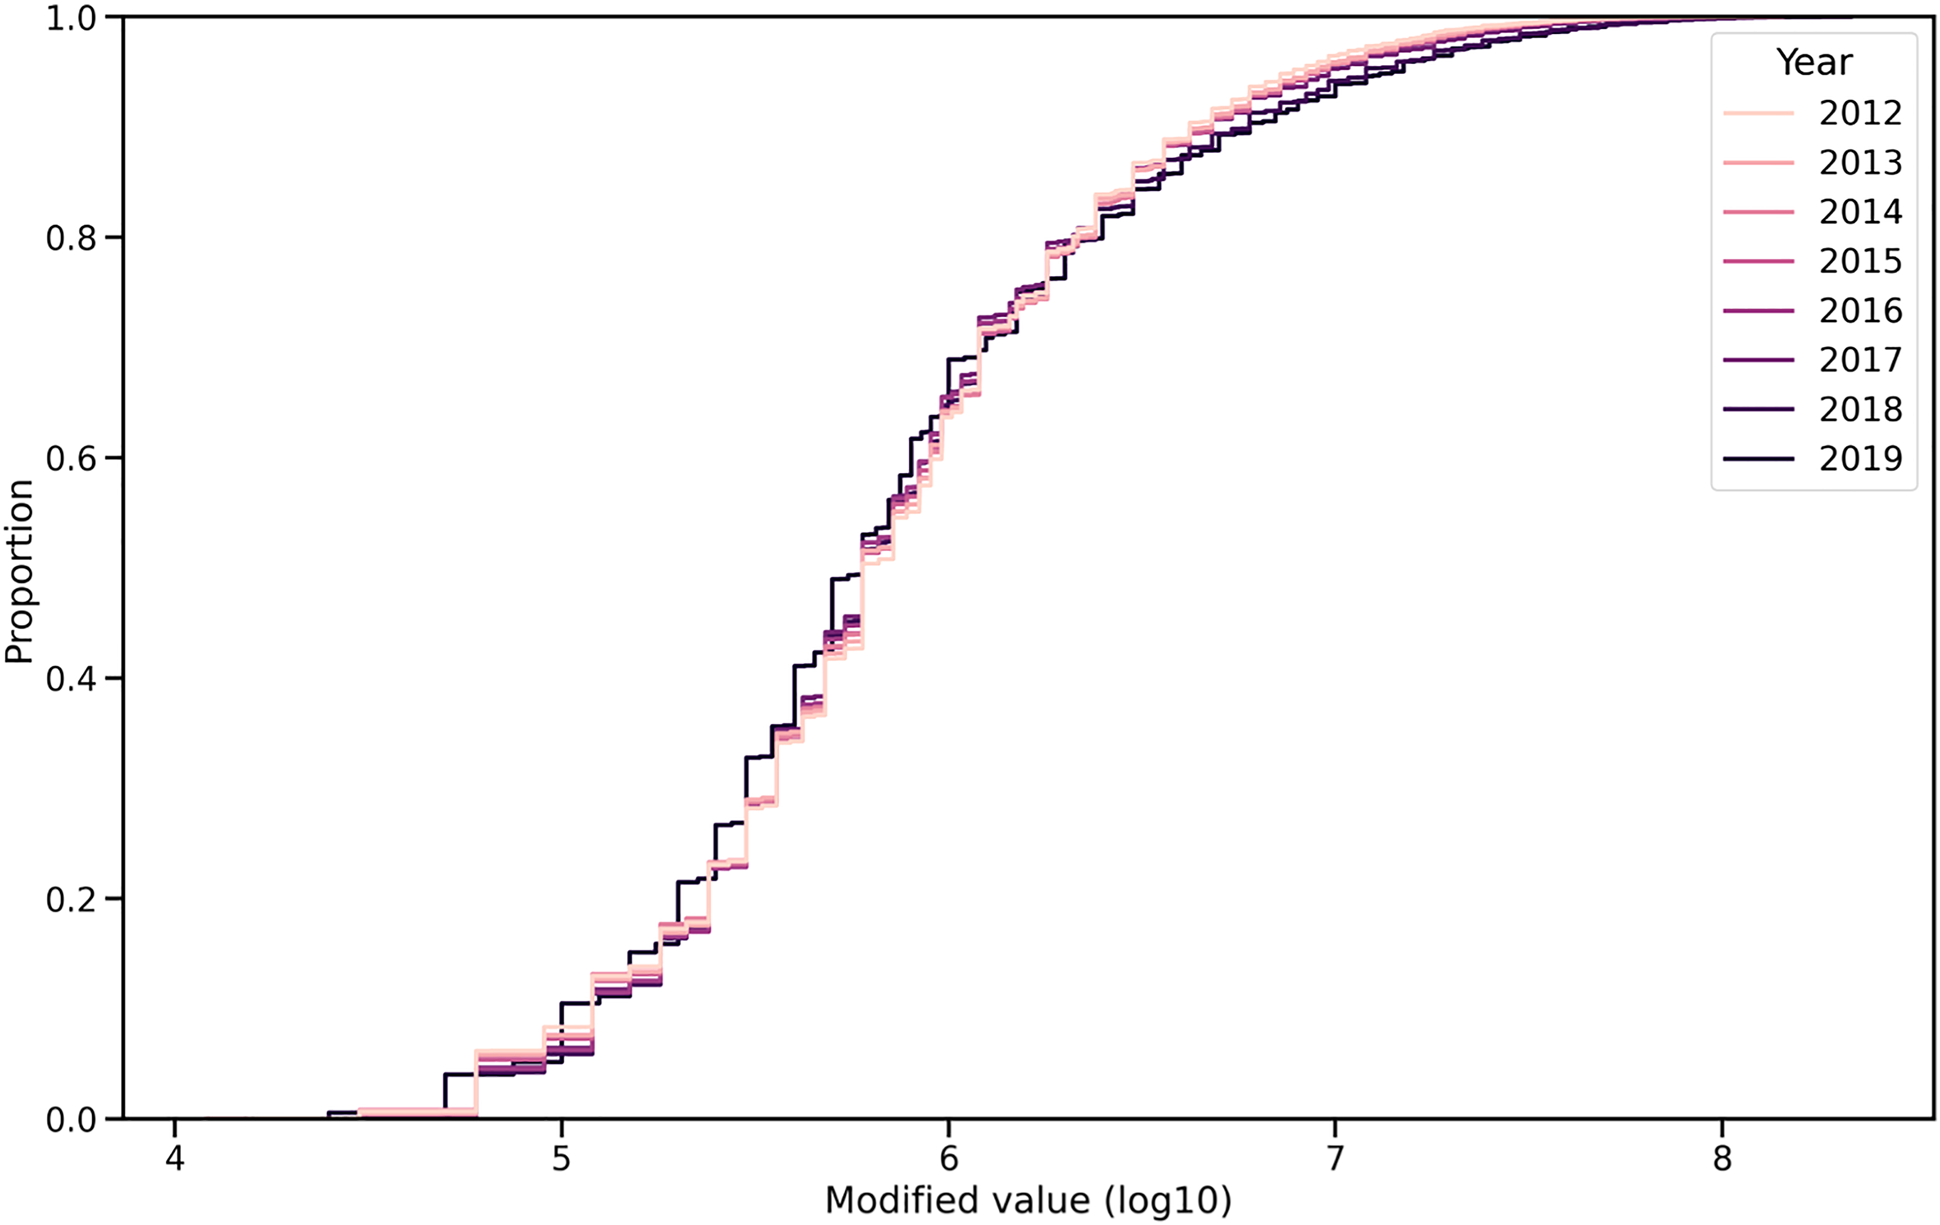
CDF of the adjusted market values in logarithmic scale.
Important skill feature selection for each player position
In our dataset, we have 33 independent skill variables, which we must transform due to the different skill set each position requires. We use feature elimination to define the most essential skills for each position with the Random Forest Regressor model. Soccer players with higher-quality skills tend to have a higher market value, so we use the market value as the continuous dependent variable and the skills as the independent variables. With the model we can analyze which skills are the most vital ones regarding the players’ quality in each position.
Due to the similarity between certain positions and the low number of players, we merge some positions. We change the forwards into strikers, wing backs into right- or left-backs, and wingers into midfielders. During the feature selection process, we collect the five most essential features for each position. Using 6 or more variables did not significantly increase model accuracy and we decided to reduce the dimensionality as much as possible in order to increase the simplicity of the model and the running speed of the machine learning algorithm, so we have used only those five features during the modeling phase. The feature selection is implemented with three different methods. We use recursive feature elimination, which iteratively drops the least influencing features; backward elimination, which uses the P-value to define the most vital features; and extra tree classifier, which is an ensemble learning technique that aggregates the importance results of multiple decorrelated decision trees by the Gini index and during the feature selection process, the normalized total reduction is used in decision of the splits. j
The results are different with each elimination method and there is no such feature which is present in every result for the same position. E.g., backward elimination has some features (finishing and volleys) that should not be essential for defenders. To find which feature selection results are the best to predict the market value, we have created three XGBoost models. The backward elimination method performs poorly, and as the Extra tree classifier's feature importance has the best results, we continue our analysis with the features selected by this model. The results of the models are shown in the Appendix in Table 6.
With the five most important skill features for various positions, we can now compare career patterns of all players regardless of their positions. To this end, we create five universal skill features that have the five most important skills for each player respective to the player's position. We denote the most vital skill with Skill 1, the second one with Skill 2, and so on. With this, we can compare the evolution of the most essential skills of goalkeepers with those of strikers. In the Appendix section Table 7 shows all the selected features broken down into positions.
Defining target features for various career goals
In order to serve the analysis of potential career goals, we scrape two additional features besides the value and skill data: (i) whether a given player has played in their national teams (the IsNational binary attribute is 1 in case the given player played at least one match in the respective national team in the given year according to Transfermarkt data, otherwise 0), (ii) IsTOTS represents whether a player got into the Team of the Season in the given year, it is 1 in the positive case, otherwise 0. We have pulled this information from the Futhead website, k which includes FIFA computer game information about the soccer players, as every year Electronic Arts, l the developer of FIFA video game, creates the Team of the Season for many leagues, based on the real performance of the players.
Both features indicate excellence: the best players are invited into their country's national team and getting into the Team of the Season is a great honor.
Feature extraction from the acquaintance network of soccer players
Network science has become widespread in recent years.13,16,17 One reason for this could be that by examining complex networks, one can obtain valuable information that would not be otherwise possible, e.g., about the relationships of the nodes, or about their importance in the whole network. Therefore, we set up an acquaintance network among the soccer players that reflects the connection between any two. In this social network, the players are the nodes and there is an edge between them if they have ever been teammates.
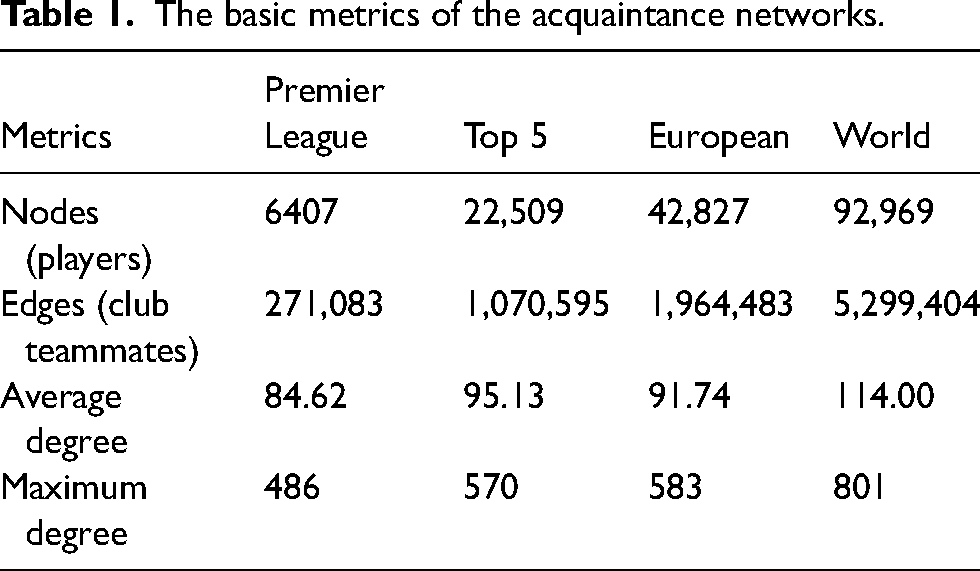
We create four different graphs with more and more leagues involved, in order to examine how the network metrics change with the increasing number of nodes. We start the analysis with one of the most competitive leagues in the world, the English Premier League. For this graph, we use the information available on the official website of the league. m We study the teams from the 1992/1993 season to the 2020/2021 one, so this part of our research covers the entire history of the Premier League. We create three more graphs: “Top 5” includes the best five European soccer leagues, which are the English, Spanish, Italian, German, and French first divisions; “European” contains 24 first division leagues from Europe; “World” contains 58 leagues from all over the world. First, second, third, and in some cases even fourth divisions are included. These latter three graphs are based on Sofifa data. We use information about players since the 2007 release. After defining the edge list, the developed graphs have the following metrics, summarized in Table 1.
The basic metrics of the acquaintance networks.
First, we examine the degree distribution of the graphs, which is decisive for small-world graphs: they have a power function distribution, which means that most players have only a few connections, but some players have a lot. Indeed, a power function is followed by the distribution of the degrees in the four graphs we created as Figure 3 shows.
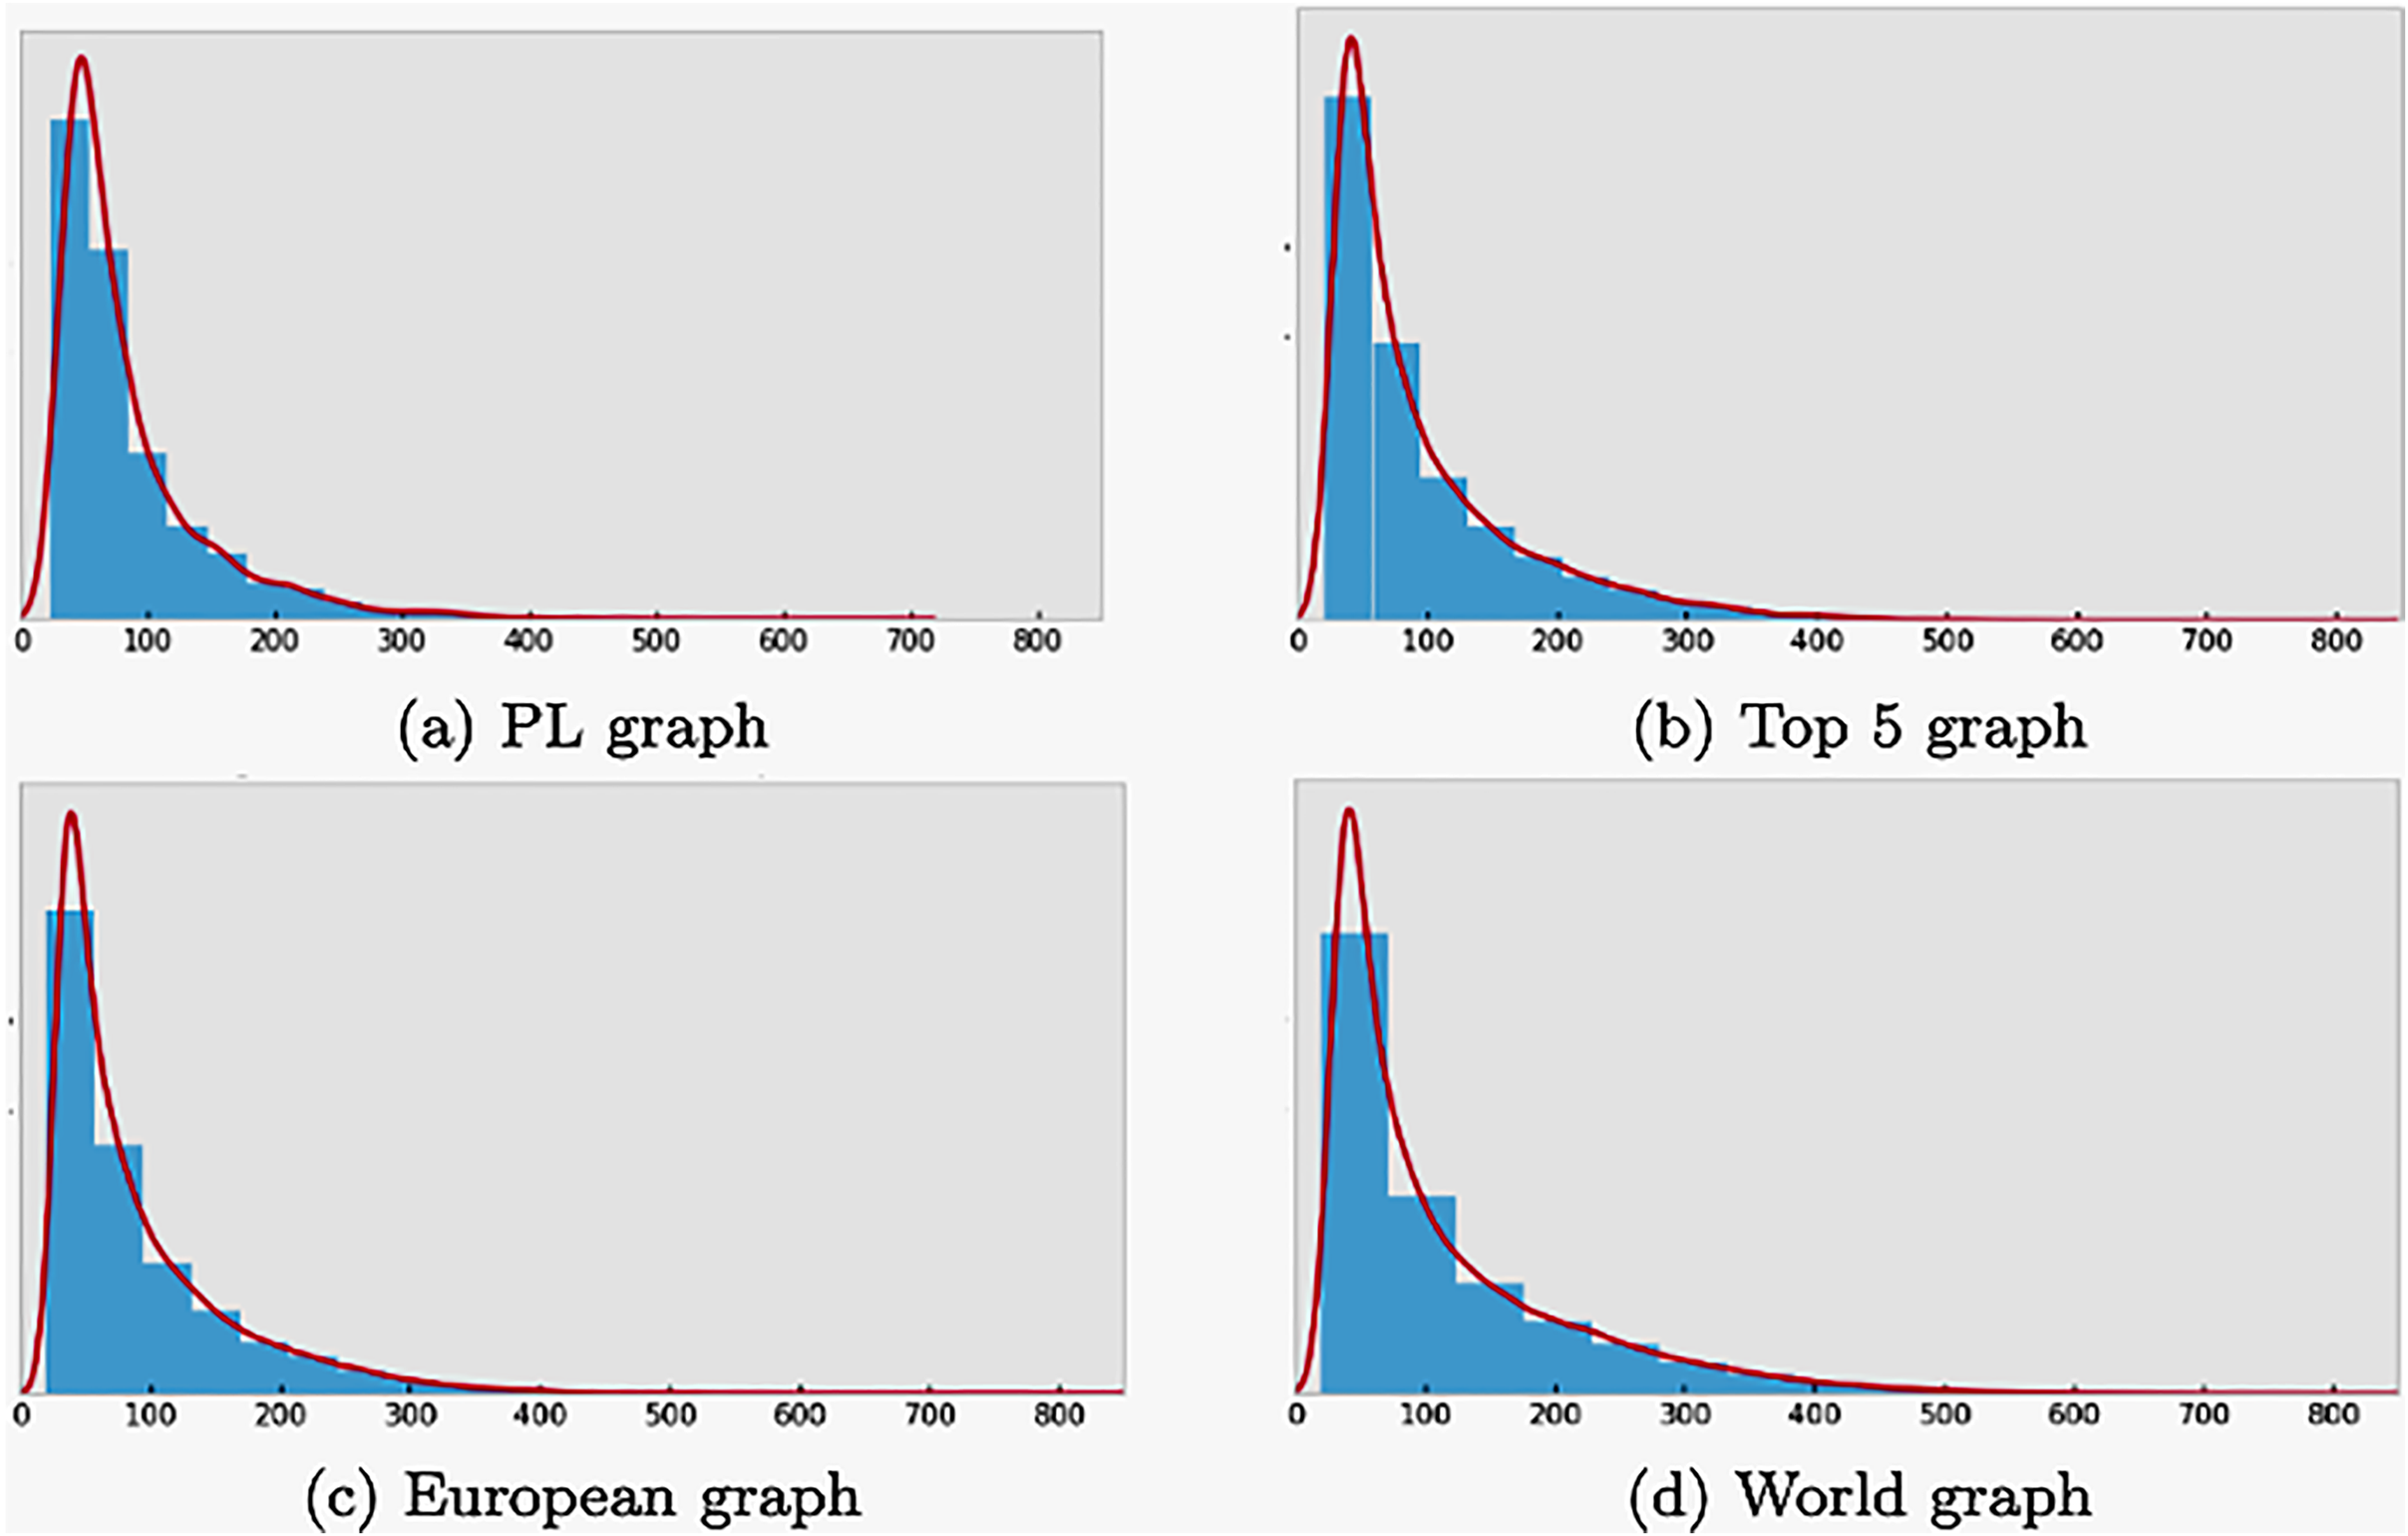
Degree distributions of the graphs follow power law.
The average shortest distance and the diameter are both relatively small in small-world networks. Quite precisely, these numbers are roughly equal to the logarithm of the number of nodes. The average distance is 2.63, while the diameter is 5 in the Premier League graph. As 6407 base 10 logarithm is 3.8, the average distance is even smaller than what is required for a small-world graph. This means that in the Premier League, the distance between players is small, averaging less than three players and even between the farthest players, the distance is only 5. As shown in Table 2, these metrics are also small for the other graphs and increase at a slower rate than the logarithm of the number of vertices. Even in the “world” population players are just over three steps apart on average. What is more, it only takes a maximum of six steps to connect any two players, even if they play in the farthest parts of the world.
The distances and clustering coefficient of the graphs.
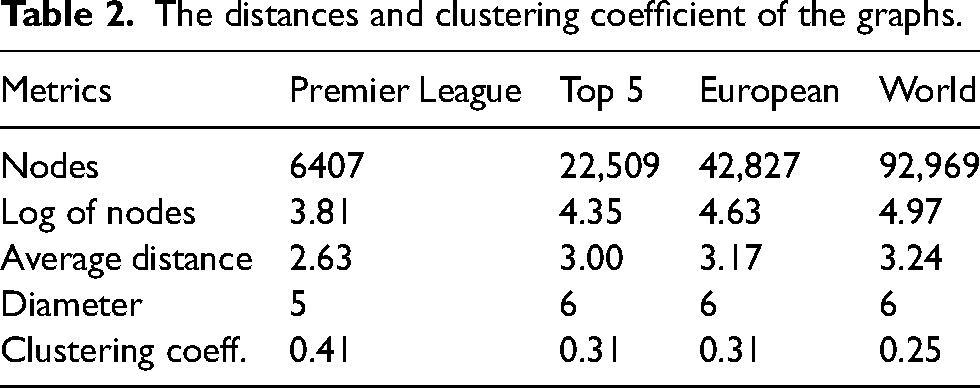
The third characteristic which we examine is the clustering coefficient metric. It seems logical that this should be comparatively high since teammates form a complete subgraph within the graph. The whole network is made up of such subgraphs connected by players who have turned up in several teams. When examining the clustering coefficients, we are curious about the extent to which there are triangles in the graph, so this property is also commonly referred to as triadic closure. 33 This metric for the Premier League players’ graph is 0.41, which is closer to the upper limit of the standard value described earlier. Table 2 suggests that with increasing number of vertices, the clustering coefficient becomes smaller. But as it is still relatively far from zero, the last condition is also met, so in the world of soccer, players make small-world networks.
Thus, the world of soccer players is small, no matter how many championships we consider, since all the properties that apply to graphs with small-world properties are fulfilled in them. To get information about the players’ relationship with each other, we extract features from these networks. We build graphs for every year to avoid linking players who play in the same club later. For example, if the given year is 2017, we use the graph that has the data before 2016 to avoid a player's score being influenced by a later teammate.
The reason why we create these graphs is to get network-related features which can positively influence our models. Therefore, we extract the degree number, which represents the number of different teammates the given player had; the eigenvector, which is a centrality metric to measure the player's importance in the graph (it takes into account the degree of the vertices and the degree of its neighbors when determining the importance value); the number of links each player has with other players who played in their national team, and the number of teammates who got into the Team of the Season. With these features we include information about the structure of the players’ world, and our aim is to improve the performance of the models with the additional information.
Results
Our aim is to create a tool that helps to understand the differences between world-class players and the other players, referred to as top and the rest of the players from now on, respectively. Being aware of such differences could mean a competitive advantage, as a player would know exactly what is needed to be improved to reach his or her goals, what career path should be taken, and what decisions should be made. By analyzing the differences between the two groups, we can identify the optimal strategic choices toward multiple potential aims a soccer player can have.
We analyze four such potential career goals, create machine learning models to predict one's potential to reach these goals, and with the models’ feature importance, we create KPIs for each year in the career of the players. We end up with different time series for the examined players, that include the features of the models with various weights. Analyzing these time series provides a picture about the improvement of the players and the comparison of the two groups (those who reached the given goal, and those who did not), highlights the necessary steps the players must take to reach a world-class level. We validate our KPIs with distances calculated by dynamic time warping.
Classifier models to create the KPIs
We define four aims a player could strive for. The first one is to get into the team of the season, the second is to play in a top 5 league (we use premier league specifically, but any leagues can be selected), the third is to reach a relatively high transfer market value, and the fourth is to greatly develop the main skill of the player's position making him or her world-class among other players at playing in the same position. We argue that these goals are set by many young players who want to become world-class players.
After creating the target variables for differentiating the top and the rest of the players, we train the model on our dataset that contains Sofifa data between 2012 and 2019 with the main skills, market values from Transfermarkt data, the features extracted from the acquaintance graph, and the IsNational and IsTOTS features. We only use this 8-year-long segment, because the features gathered from the TOTS database were available only for this time period. Since we use the TOTS teammates feature for most career goals, we considered this interval reduction necessary. In total, we have 92,120 records of 29,231 different professional soccer players. We develop four different models for the four different aims, choosing the target variable in the following way:
In the first case, the target variable is the IsTOTS feature. In the second case, we create an IsPL variable, and fill it with ones, if the player plays in the Premier League in the given year. In the third case, we use the market values (transformed as discussed in Section ‘Transforming the market value feature to handle the surge in player prices’) to decide which players are in the top category. We create a binary variable called IsValue, and fill it with 1, if the player's market value is at least 7, which means exactly €10M in 2019. About 5% of the analyzed players have reached this value during the studied period, which we consider a psychologically important limit. In the fourth case, we create a target variable based on the Skill 1 variable, which is the most essential skill of the players according to their position. Using the Pareto principle, we choose 80 as the turning point, which represents the better players (noted with gold card in the game). We mark the players who reached this limit with ones.
We use the same process for all models to define the one with the best performance. First, we check the distribution of the target variable in all four cases. The most imbalanced target variable is IsTOTS, having only 1733 positive cases out of the possible 92,120. This is followed by the IsPL model with only 3932 positives, and by the Value model with 4465 positives. The Skill model's target variable is more balanced, with 7072 positive cases. We use synthetic minority oversampling technique (SMOTE) to reproduce the favorable data, if there are too few positive cases leading to performance degradation. After trying several techniques, oversampling with BorderlineSMOTE works the best. Creating too many records results in over-fitting, so we only add so many cases as necessary to reach a 30% rate of positive cases. The skill 1 model does not require any oversampling techniques.
We have tried numerous models (XGBClassifier, GradientBoostingClassifier, RandomForestClassifier, BaggingClassifier, LogisticRegression, GaussianNB, BernoulliNB, SVC, NearestCentroid) and we have compared their results. We use cross-validation to train the models and choose the best-performing one according to the area under curve (AUC) metric on the test set. In case of a similar AUC, we also consider the Accuracy and the F1 metrics. In three cases, the random forest classifier works the best, but for the IsPL model the XGBoost Classifier achieves slightly better results. The performance metrics of the models can be found in the Appendix (Tables 8, 9, 10, and 11).
As the dataset contains some categorical variables, e.g., country, league, and position, we encode those variables. We check the performance of the chosen models with different encoding techniques, and similarly to the model selection, we choose the one with the best AUC. CatBoostEncoder works the best for the IsTOTS and the Value models, JamesSteinEncoder has the best AUC for the IsPL model, and for the Skill 1 model we choose the MEstimateEncoder.
Finally, we use grid search to find the best parameters. We choose the set of hyperparameters with the highest AUC metric. The best set of parameters are 500 estimators, 0.9 maximum samples, and 11 maximum features. The final AUC metrics of the different models obtained on the validation set are around 85%. The exact values are available in the Appendix (Table 12).
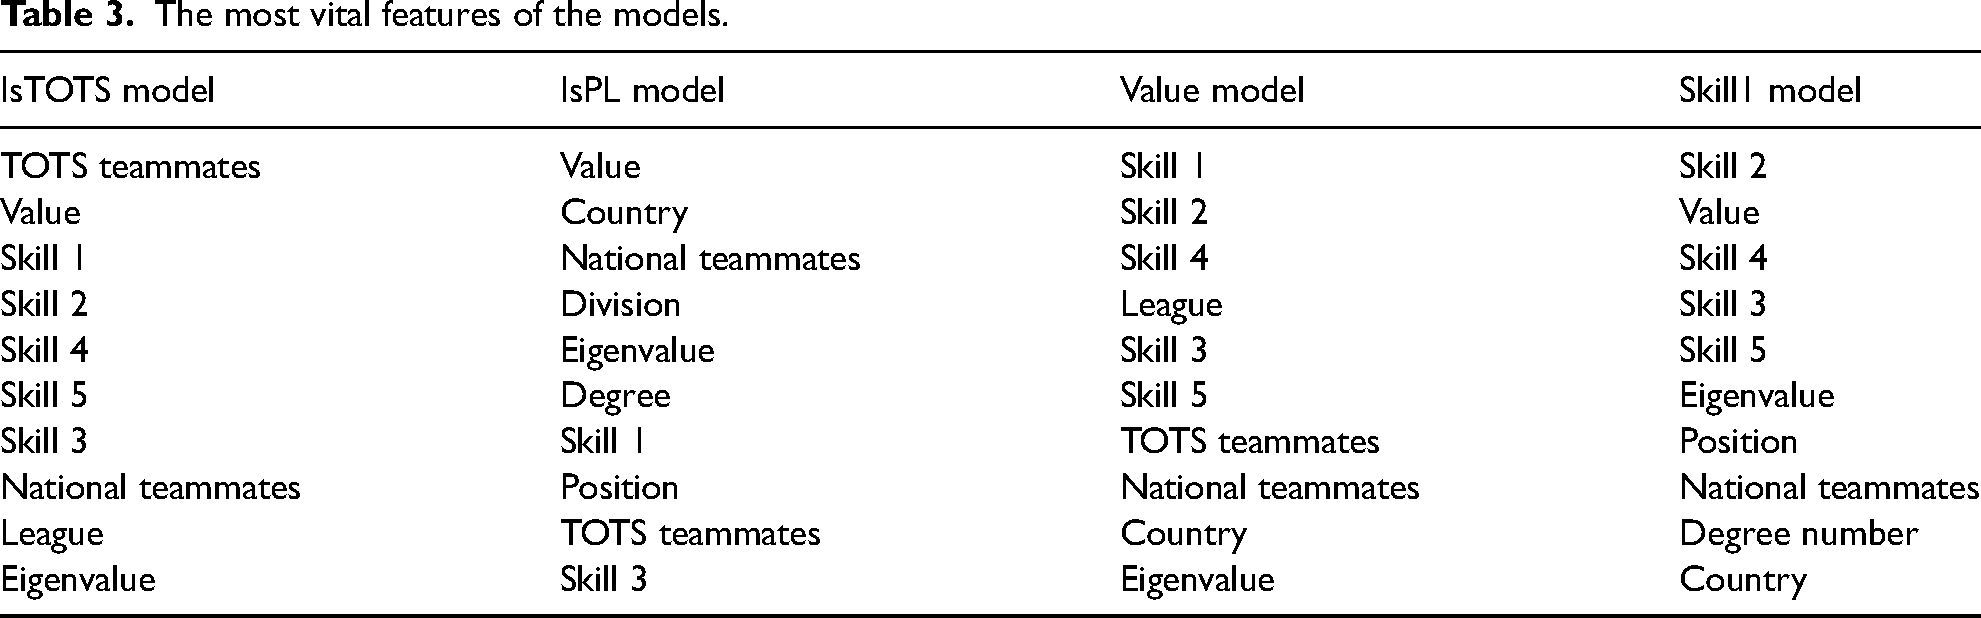
We use these models to identify the most vital features in each career goal case. To do that, we use the feature importance function of the models, which weighs every feature according to its predictive power. The 10 most vital features of the models can be seen in Table 3.
The most vital features of the models.
Skill features and the market value (denoted as Value) are evidently important features in most cases. Furthermore, every feature extracted from the network made it to the highest 10, which means playing with better teammates can have a positive effect on the players’ career. E.g., the best way to get into the Team of the Season, is to play with many other players, who already did it. This could represent a good team, whose players usually make it to the TOTS.
The IsPL model stands out from the others, as the most important features are the Value and Country, and the number of national teammates is the third. These features are different from the other models’ most essential features, except for the value. The country is significant because the majority of the Premier League players come from the countries of the United Kingdom and from the other countries that have outstanding national teams, like France, Spain, or Brazil. Playing in the Premier League will also result in more national teammates, as playing in a top league means advantage for the players in terms of selection for the national teams. Division is also essential as the PL is a first-division league. Eigenvalue is the fifth on the list, which is usually high for those players who connect more players together, often with changing teams frequently. Because of the large difference in the vital attributes compared to the other models, we have also performed the same investigation for the Spanish first division. There, the top five most essential features are the Division, Country, Skill 2, Value, and Skill 1. The Eigenvalue is the sixth feature in the importance ranking. In the Premier League, the players’ market value is the highest in the world, n but among the global top 20 most valuable players, 10 are from another leagues. o Therefore, even if the players in the English first division have inflated values, we argue that the use of the value feature is beneficial in our study.
In order to improve one's market value, the model suggests increasing their skills and play in high-ranked leagues, but also having teammates who play in the national team and get into the TOTS have a positive inference. Getting to a high level in skill1 seemingly necessitates being great in the other selected important skills of the player's position.
Using the weights of the model's feature importance metrics, we create KPIs for every year of the players’ careers. Analyzing these KPI time series does not just highlight what attributes need to be improved, but also the necessary rate of the improvement. Therefore, we group the players into two groups (top and the rest of the players) and compare the evolution of their KPIs in our next step. First class players are the ones who achieved the given career goal, while the rest of the players did not.
We validate the KPIs by comparing their time series within the groups, and between the two groups using Dynamic Time Warping.
Dynamic time warping for world-class validation
We validate our hypothesis on the key difference between the outstanding players and other players in each career goal case with the help of the KPI time series. Since our dataset contains players with different lengths of career time, we use dynamic time warping (DTW) to compare the time series. We measure three distances with DTW:
The distance between the KPI time series of top players (the grouping is valid if the distance is relatively small). The distance between the KPI time series of the rest of the players (the grouping is valid if the distance is relatively small). The distance between the KPI time series of the two groups (the grouping is valid if the distance is relatively higher than the measurement within the groups).
If all three prerequisites are met, we can declare that we constructed KPIs that indicate significant differences between the careers of the players. In Table 13 of the Appendix, we collect the results of DTW for each career goal, where we calculate the mean distances for each group observation. In each case, the distance between the groups is higher than the distance within the groups. The most outstanding differences can be identified in the skill and value goals. In the TOTS case, the inner distance of the top players is closer to the distance between the two groups. This is partly due to the low number of players ever achieving this goal, but as the distance between the groups is larger, we also accepted this result and considered the separation to be satisfying.
In Figure 4, we present an illustrative example result of DTW between top players (with market value career goal). On the X axis, we illustrate the examined years and on the Y axis, we show the KPI values of the selected career goal. In Figure 4(a), the visualized DTW distances between the first two players within the top group is small, i.e., 1.15. Figure 4(b), shows the results within the rest of the players, where the distance is 1.02. In Figure 4(c), we compare two players from the two different groups, and we get a much higher distance, 11.46. Thus, the distance between the groups is much greater than within the groups.
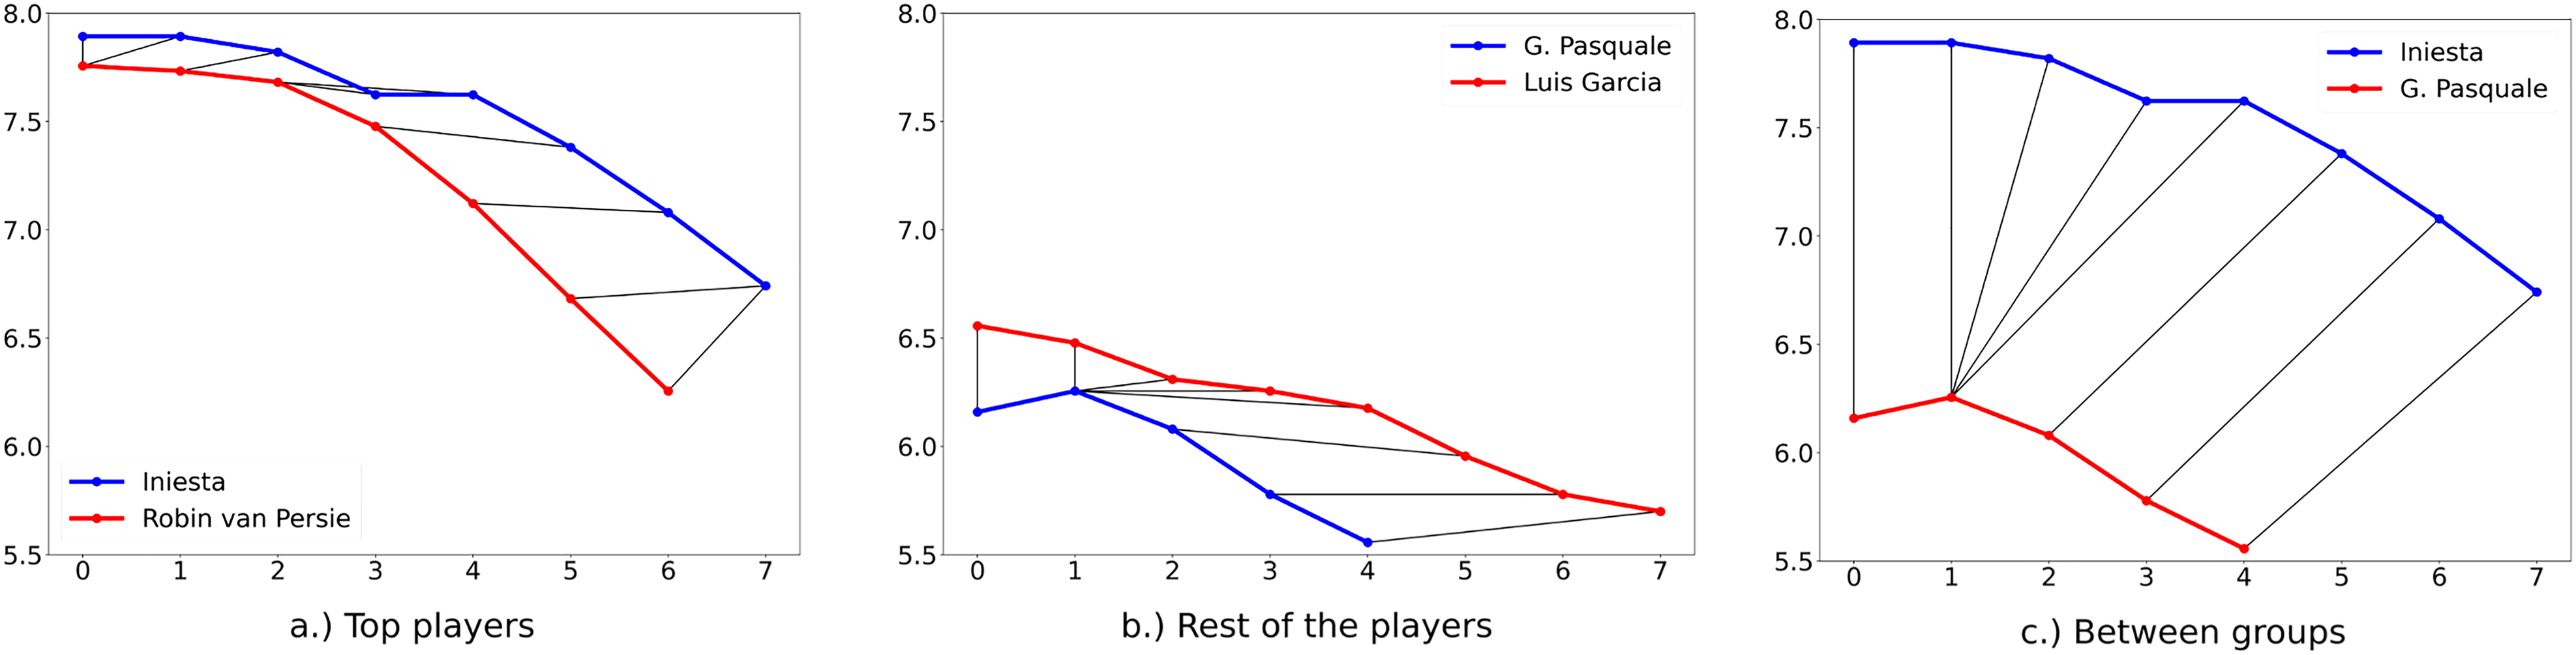
DTW distances between pairs of players with market value career goal.
Discussion
In this section, we show an example output of the soccer player handbook tool that we have implemented. The source code p and the career advisor tool for soccer players q that we have implemented are available online. The tool calculates the fitness (the percentage of how close the player is to achieve the goal) of a player and the required further skill development based on the player's career history. In the illustrative examples shown here, we focus on young players, because it is a great advantage if a club can find a hidden talent and help him or her to become a top player from the beginning.
An example for practical implications
We show a use case where we can easily identify the deficiencies and make a recommendation to achieve the Value goal with the help of the tool (the same steps are applied to the other goals as well). We select a Turkish player, Semih Kaya at the beginning of his career. First, we take Kaya's early career statistics (from age 20 to 22) and compare them with the careers of the top players who were able to achieve the market value career goal. The main idea here is to find the examined player's rating each year for all the important variables that were used to create the KPIs. We only compare the features that the player has the opportunity to develop, e.g., we exclude the origin country feature because it is impossible to change it, thus we are able to recommend feasible improvements. We calculate the cumulative distribution function of the top player's features and take Kaya's exact percentile score every year of his career. Figure 5 shows how our player's third most important skill (he is a center back so it is the sliding tackle for him) is positioned (red dot) in the Skill 3 distribution of top players and how it develops over the first 3 years. Purple, orange, and green lines are indicating the first, second, and third quartiles of the distribution, respectively.
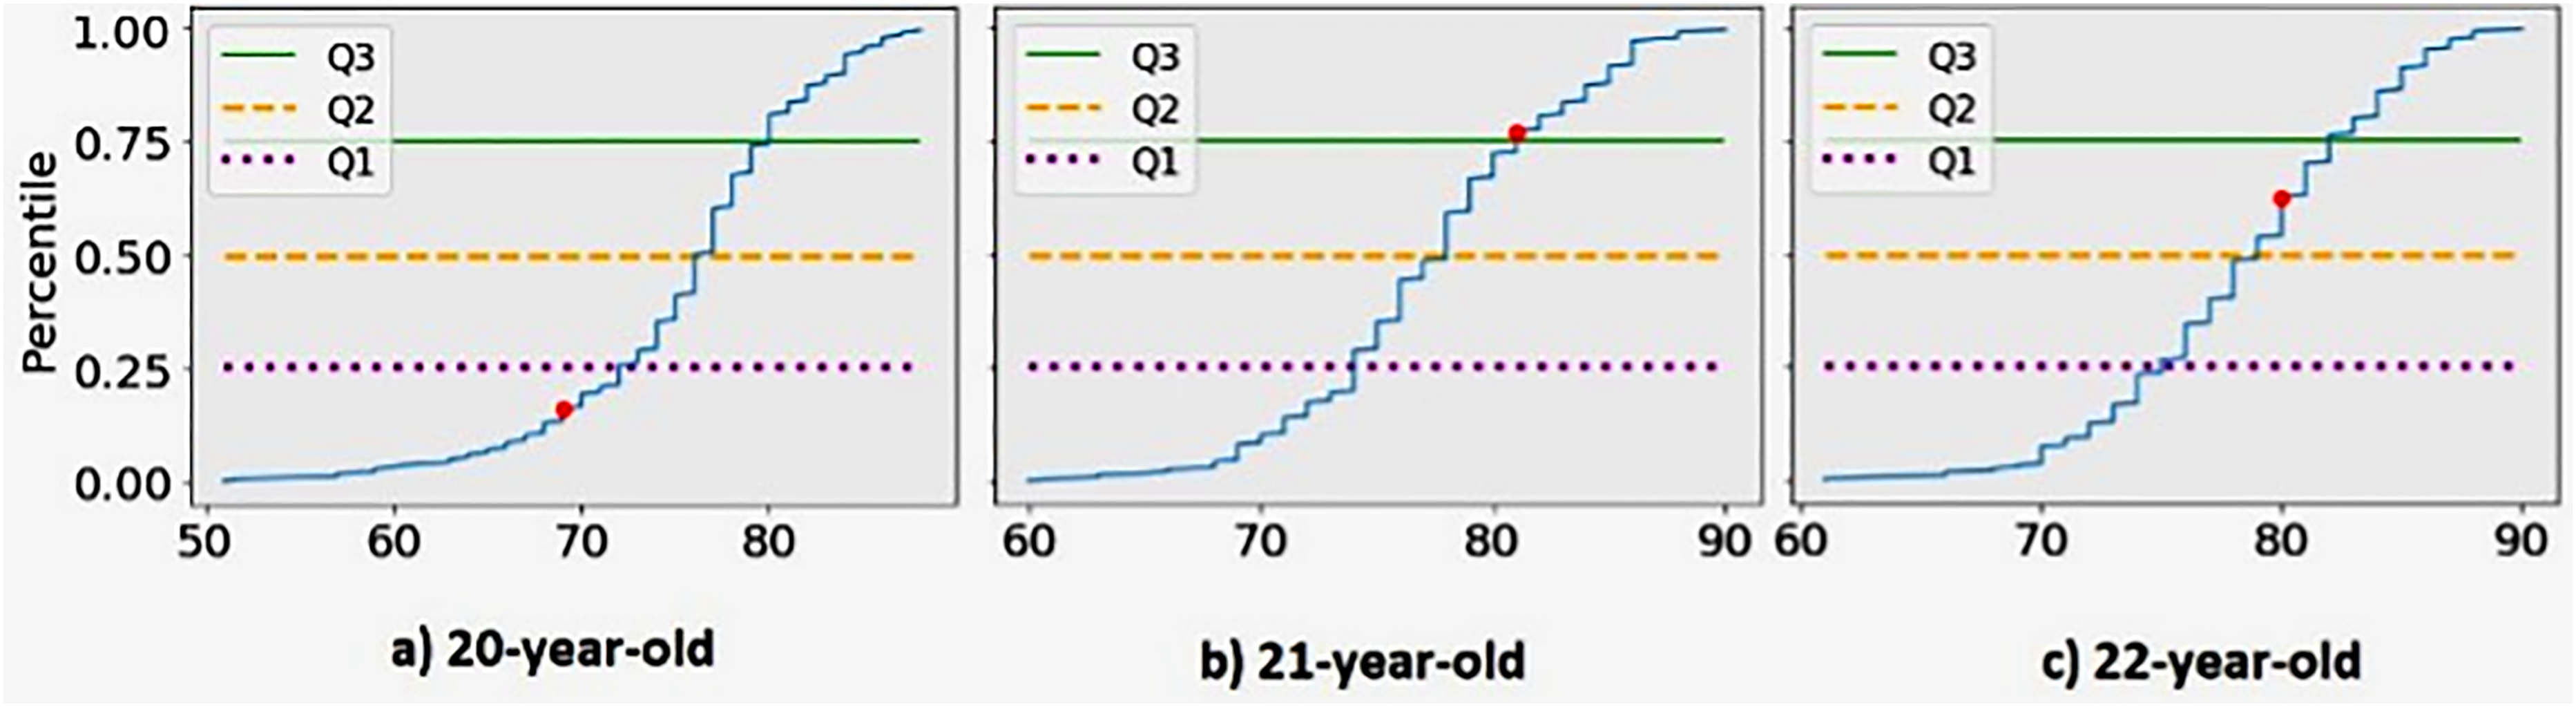
Kaya's Skill 3 rating during the first three available years of his career compared to the cumulative distribution of Skill 3 values of top players at the same age.
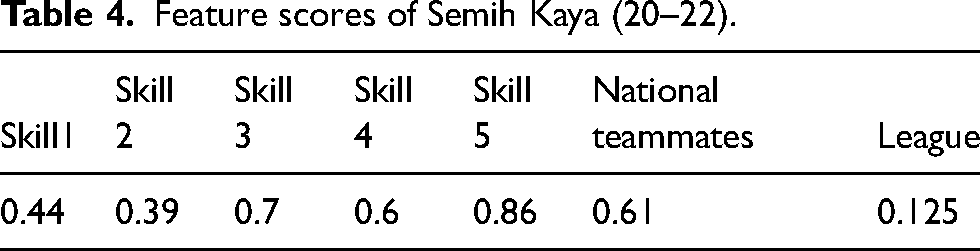
In Figure 5(a), the exact percentile value of Kaya is 0.16 at age 20. While this is not an outstanding skill level, in the subsequent two years he managed to improve it: in Figure 5(b), the score is 0.77, which means that he performed better than 77% of the top players at age 21. In Figure 5(c), the score decreases to 0.63 but it is still a fairly good level. We do the same comparison for each feature value every year, and from the yearly scores, we take the interpolated value of 75 percentiles (Q3 as in third quartile) for each variable. Table 4 shows the Q3 values of Kaya. His National Teammates variable is high as the player has a high number of teammates who have played in their national team. The league attribute reflects the number of top players in the league the player's club competes in. This value is relatively low for Kaya.
Feature scores of Semih Kaya (20–22).
Most of his feature scores are high so he is close to achieving the goal. We calculate his overall fitness by taking again the interpolated Q3 value of all his scores indicated in Table 4. The fitness of Kaya is 65%. The value 65% indicates that he has a good chance to achieve the goal, but there is something he must improve in the next few years, e.g., skill, club, league. If the fitness is above 80%, the player should achieve his goal in the next few years with high certainty based on his evolution and career path. If it is between 80% and 50%, then changes are needed to be able to achieve the given goal. If it is under 50%, then the player should recalibrate his career goals, as drastic changes would be needed, which most of the time cannot be attained.
In Figure 6, we illustrate how Kaya is positioned among the top players in terms of the seven attributes. From Table 4 and Figure 6, we can see that his skills are on par with the top players’ and his national teammate rating is also high (he is a member of a top team in his league, Galatasaray A.S., double league champion during the examined years). However, we can notice that the league rating is low. He played in the Turkish Süper Lig during these 3 years and this league was not even in the top 10 in terms of the total number of top players. Based on the output of our tool, it is highly recommended for Kaya to transfer to one of the top leagues in order to achieve the market value goal, should he have that in mind. Based on his skills he is a talented young player and he is just a step away from this goal. During the examined 3 years, he managed to achieve a market value between 6.73 and 6.88 but due to the reputation of his league the goal of 7 seems to be unreachable.
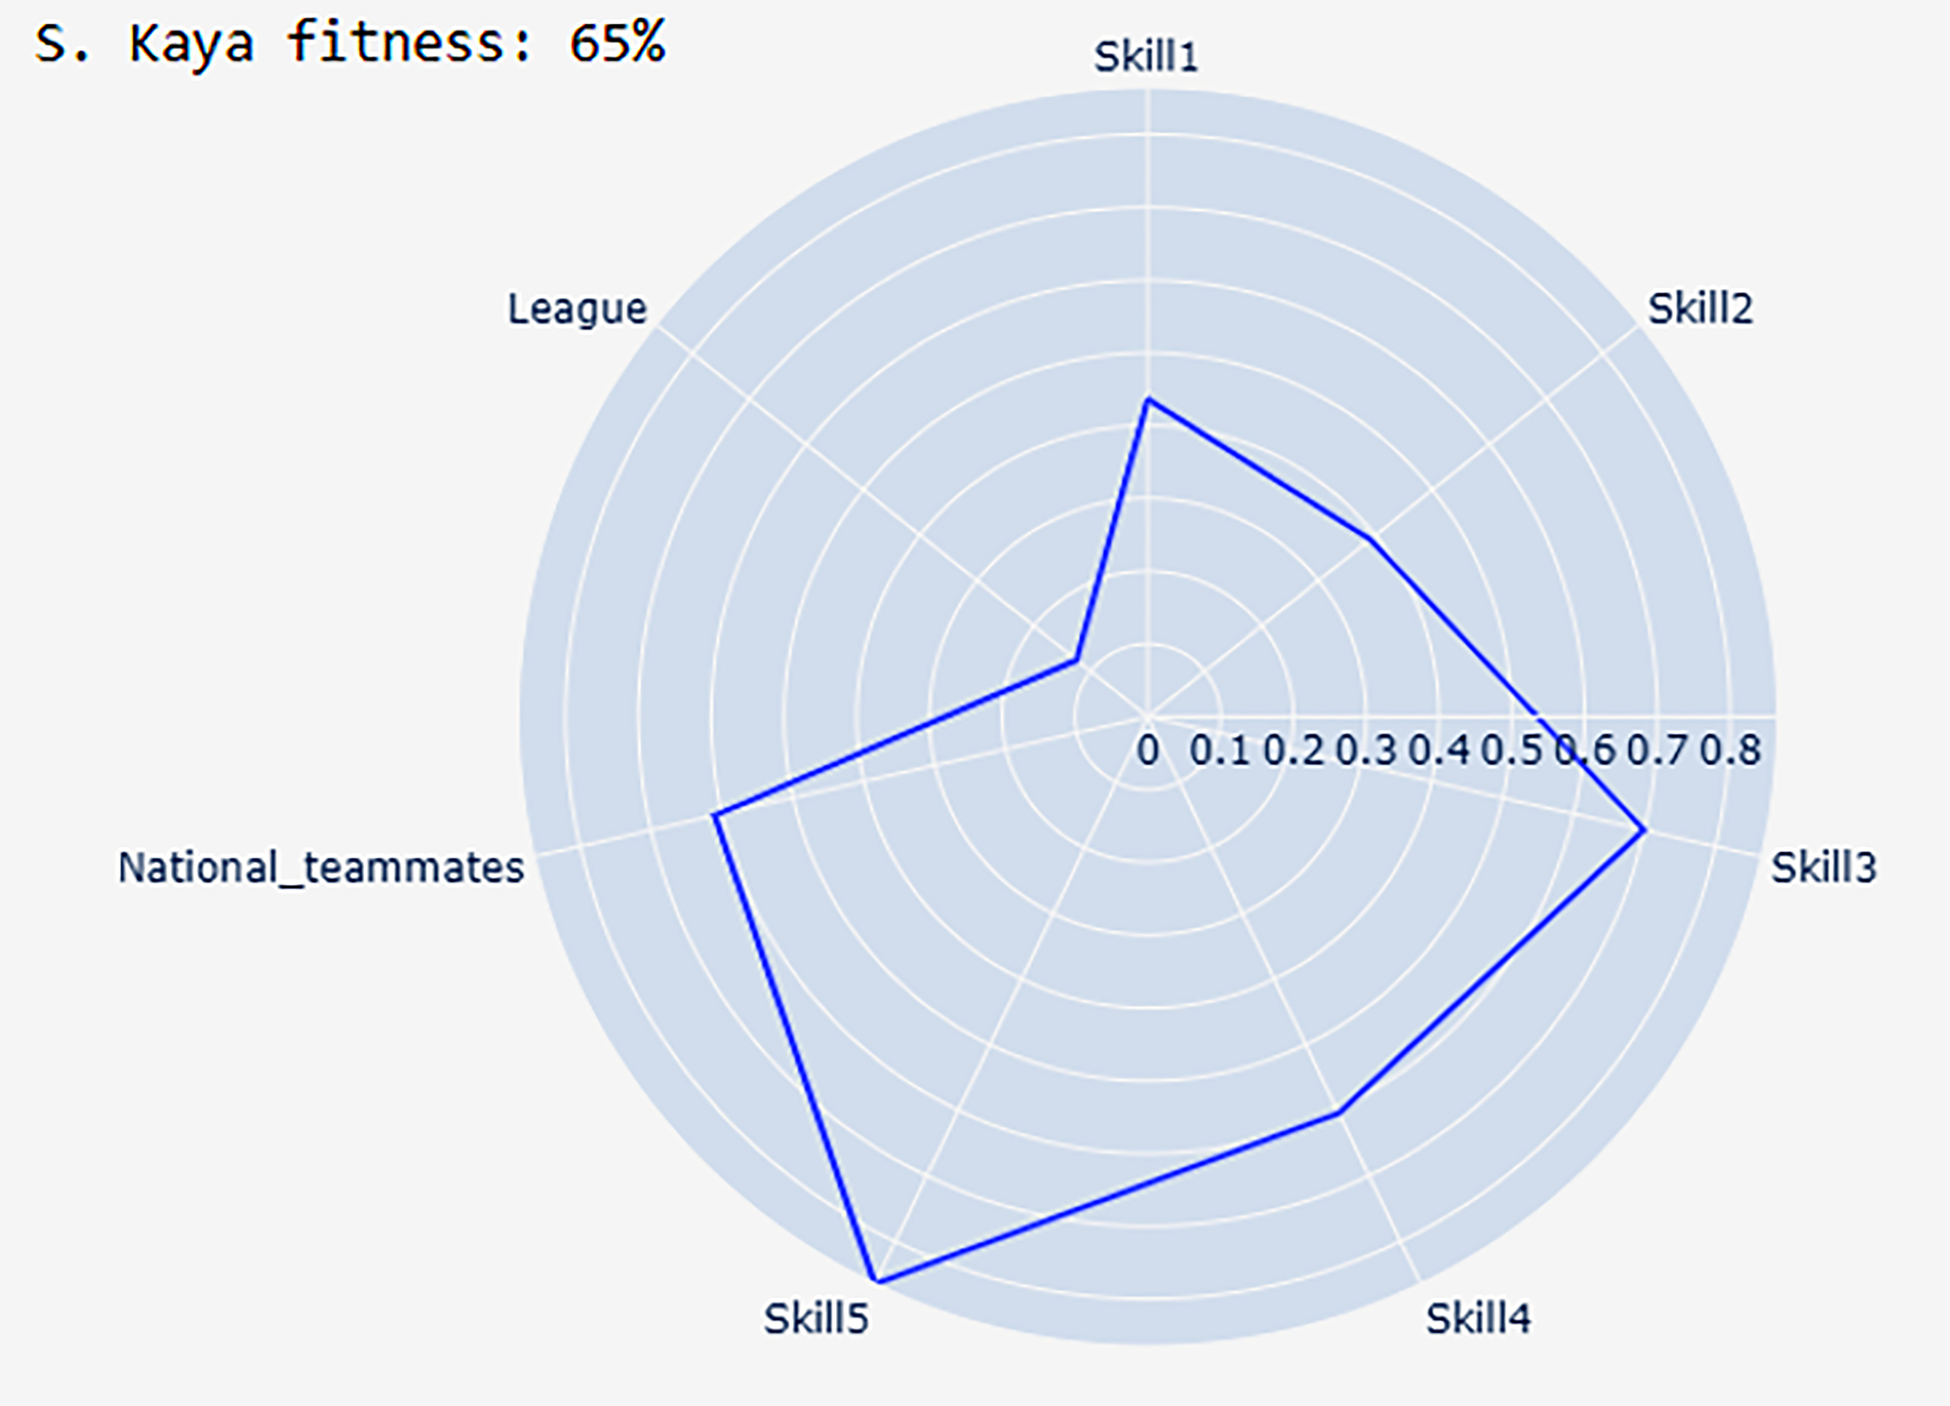
Semih Kaya's overall feature ratings between the age of 20 and 22.
Figure 7 shows which league the players who ever achieved the market value goal played in when they were 22 and 24 years old. The colors represent the rate for the given leagues, and only those leagues are included which have at least 2% of the top players in the given age group. It looks like playing in the top five leagues is already crucial at the age of 22. Besides those leagues, only those players have ever achieved the goal, who played in the Portuguese, the Dutch or the Russian first division at the age of 22, but the rate of those players is low compared to the top five leagues. By the age of 24, they remained in these leagues, except for the Dutch league, from which these players were transferred into one of the top five leagues. At the age of 26, there is no change. A few of the world-class players (4%–4% respectively) transferred into the English Championship and into the Turkish Süper Lig at the age of 28. It seems that it is more advisable to get into a better league at a young age, where one can make a name for themselves and then go back to the Turkish first division, if one wants to increase their market value greatly.
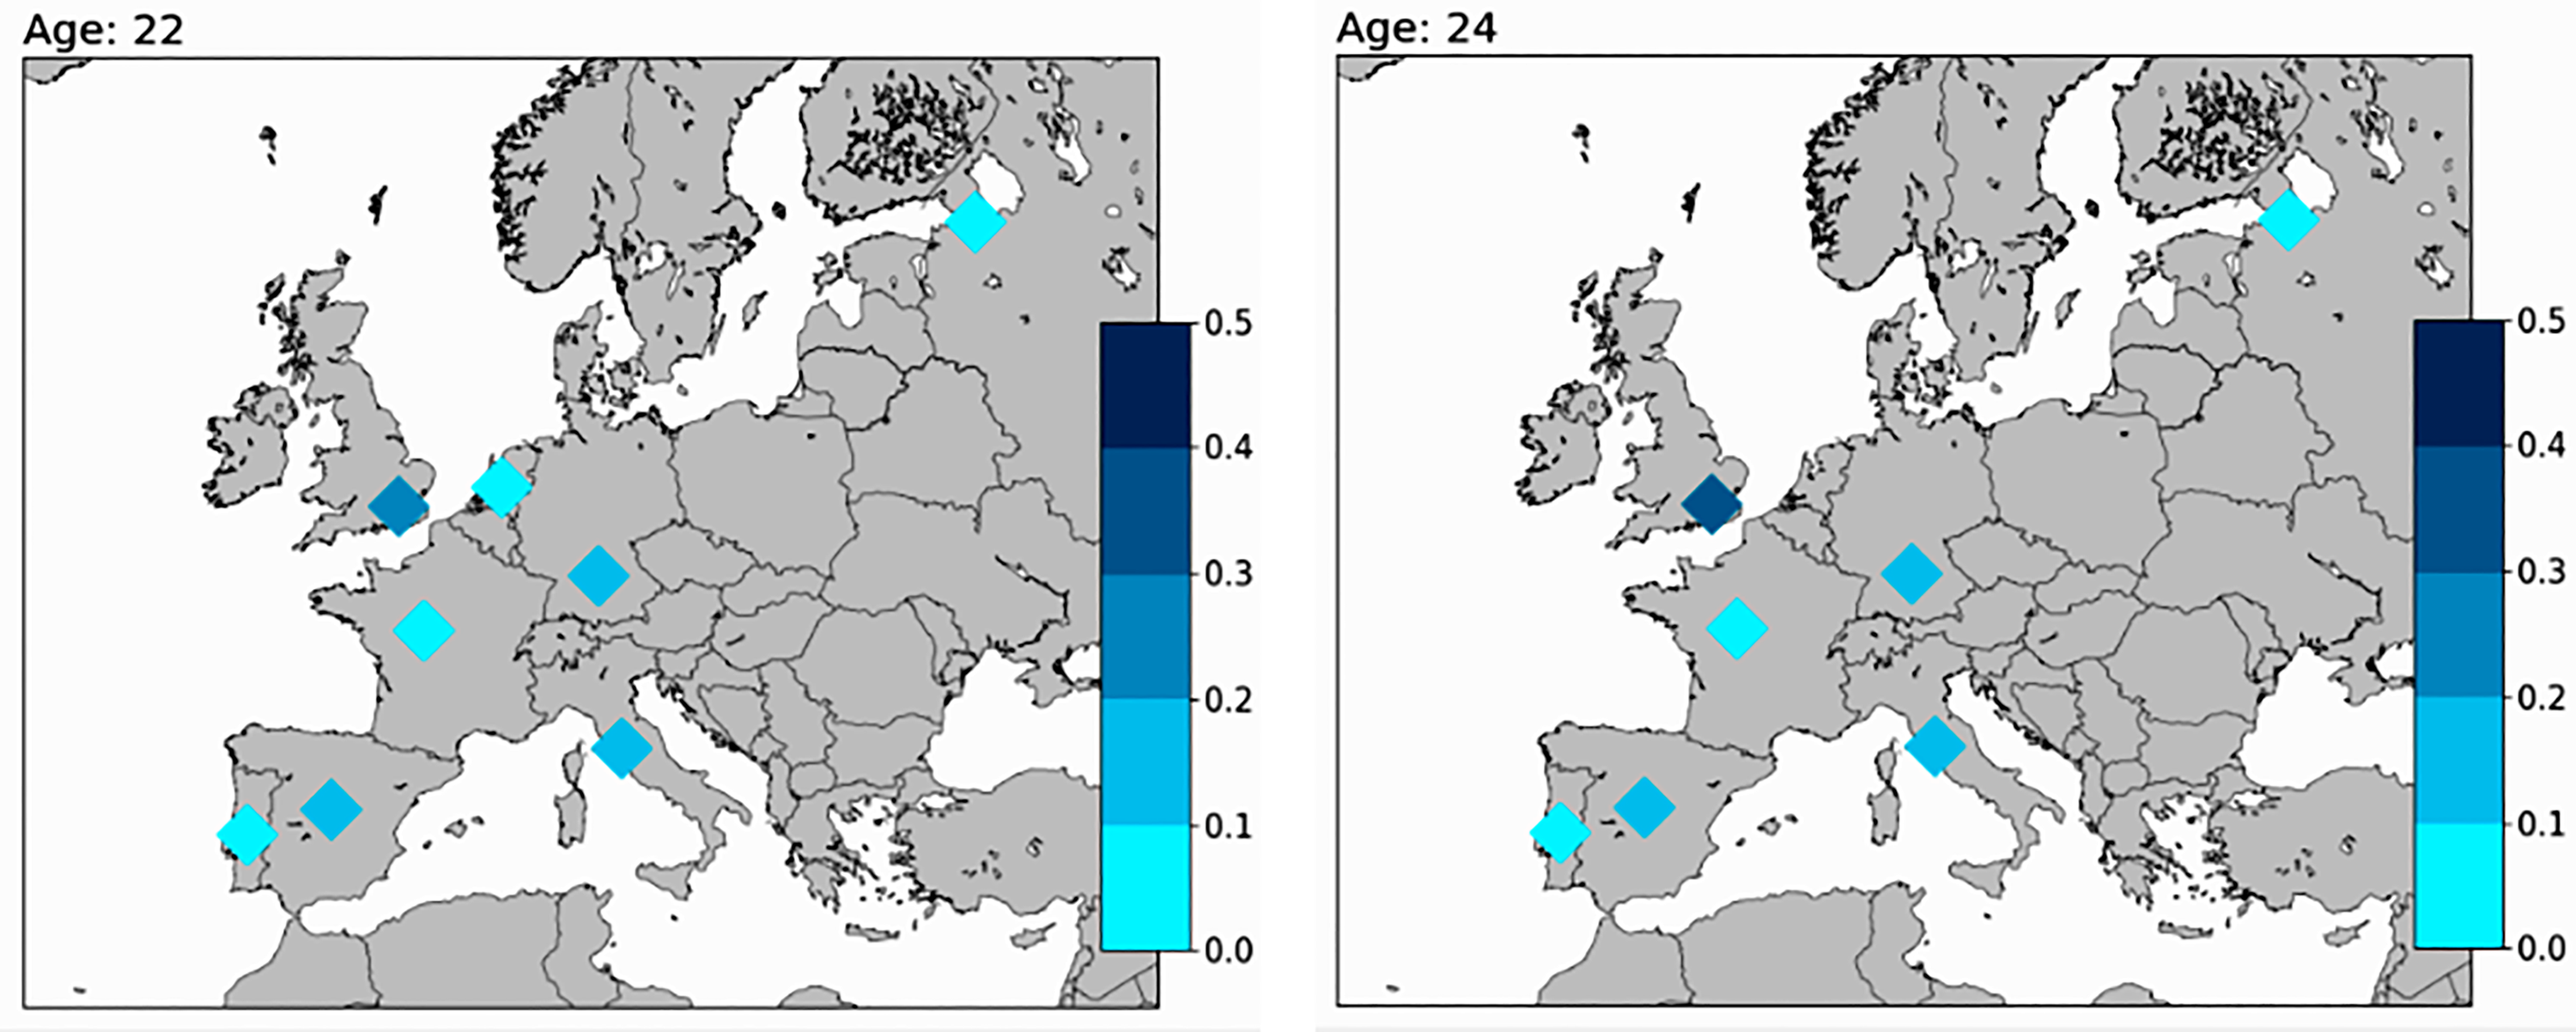
The league rate of the top players at the age of 22 and 24.
Let us follow Kaya's career by looking at the subsequent two years (age of 23–24). Table 5 shows the new feature scores within the top player population between the ages of 20 and 24, taking into consideration the whole career history at hand.
Feature scores of Semih Kaya (20–24).
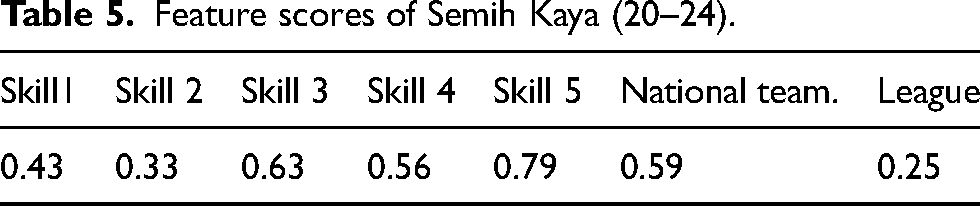
We can see that his skills are almost at the same level, but the league rating is still low. His fitness (Q3 of Table 5 feature scores) dropped to 61%, because he did not leave the Turkish Süper Lig and it was still not a league chosen by the best players. Figure 8 shows the overall feature ratings of Kaya for the age group of 20–24 compared to his ratings for the age group of 20–22.
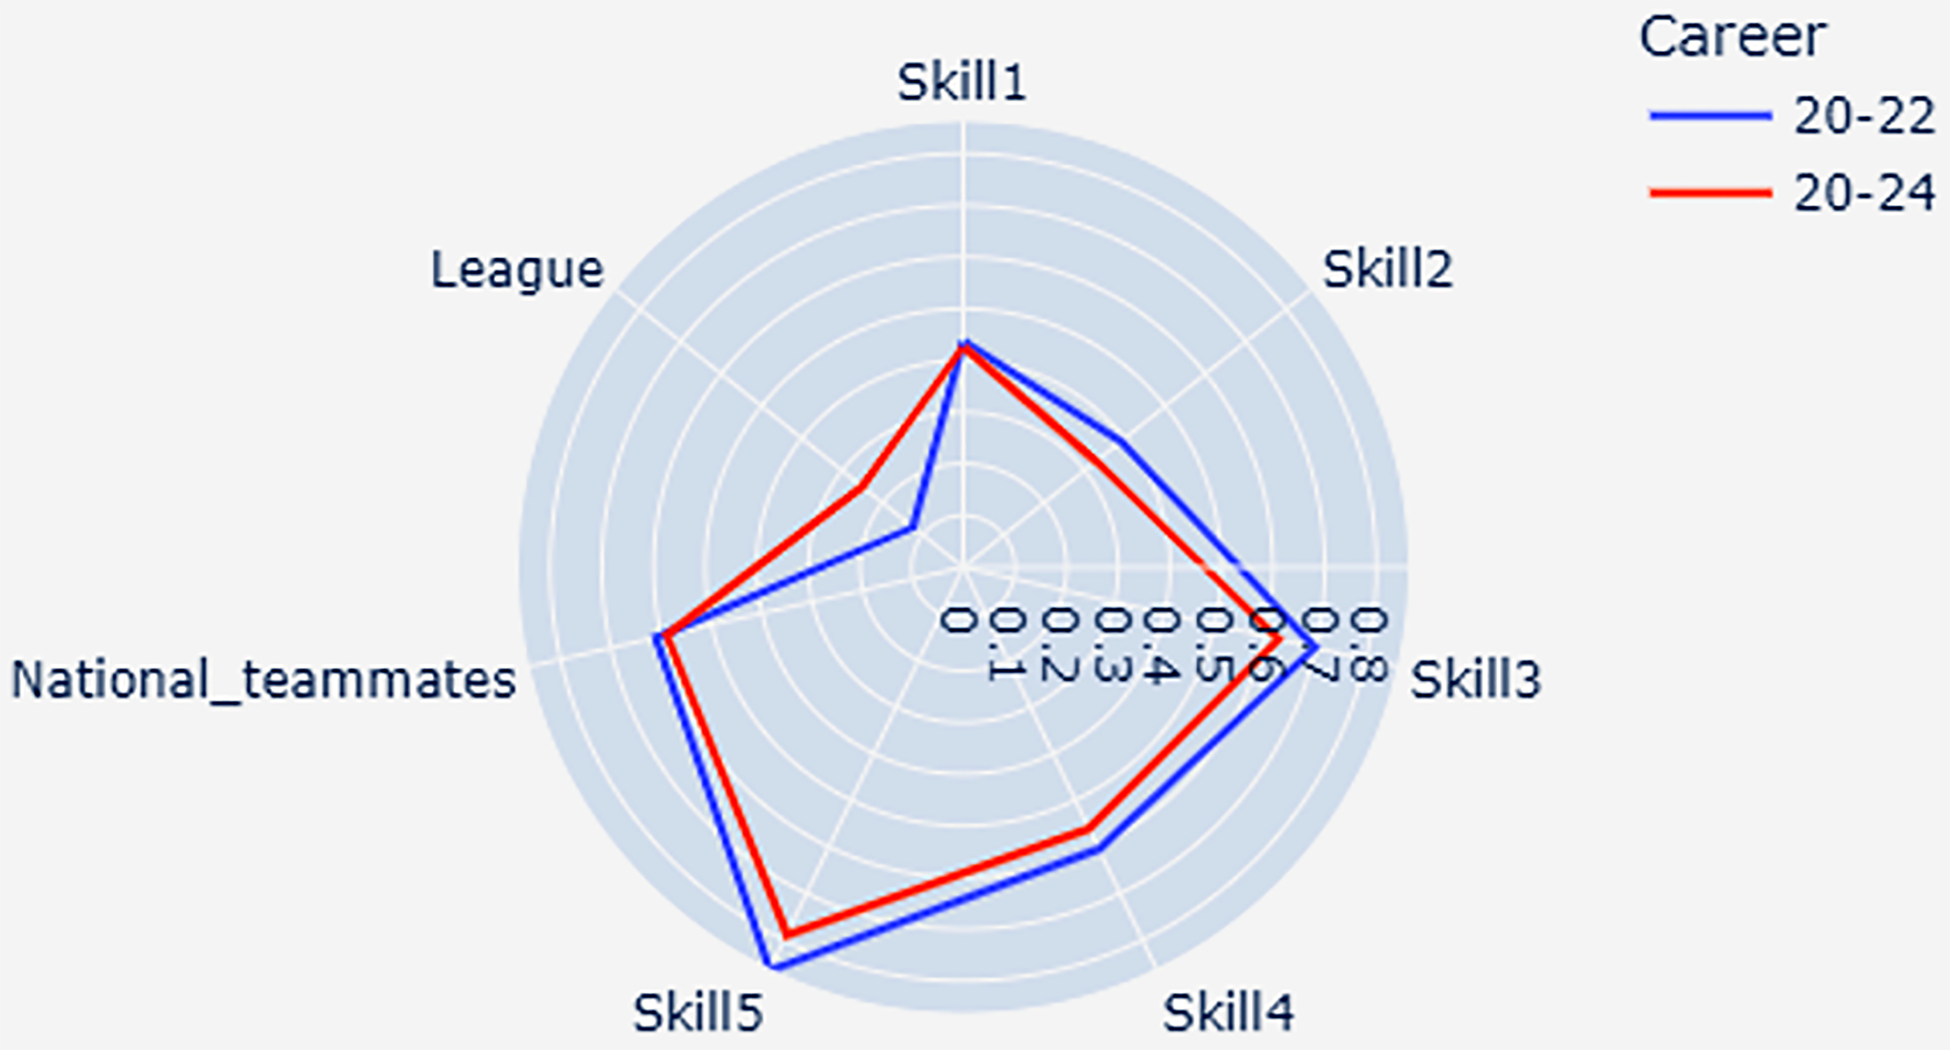
Kaya's overall feature ratings between the age of 20 and 24 compared to his ratings between the age of 20 and 22.
In the end, we can say that Semih Kaya started his career as a young talent with good potential and he played in the champion team in the Turkish Süper Lig. His most important skills as center back were mostly outstanding. He was in competition with the top players between the age of 20 and 22, and in 2015 he received an offer from the top Italian team FC Internazionale which could have greatly increased his price, but the contract has been declined and despite the later attempts by Inter, it has never been made. r He stayed with his team and never left the Turkish league in the examined years, which led to the outcome in his early career that he has never achieved the market value goal of 7.
Contextualization of the data
In sport analytics, putting the data into context is of importance. We can state that individual performance is heavily affected by the team and league the player plays in. In many cases a player in a lower-tier league or team in a defending position may have much more defensive activity on the field than someone in a league leading, world-class team. In our case players are compared based on their skill attributes and not the on-field performance, e.g., how they can track, tackle or counter the attacking players by blocking a crossing or passing. In our tool, we exclude these inequalities or differences between the different teams and leagues and focus more on the individual skill deviations.
Study and model limitations
This study has a number of potential limitations. Involving on-field performance or activity statistics about the players and teams could further improve the performance of our models and would potentially generate more advice for the players. The information on the method of measuring the skill variables is unfortunately limited. According to FourFourTwo football magazine, EA Sports employs scouts around the world to observe and score the players. s
In some national teams, there are more skillful players than in others. Therefore, the given player also must be better, if he or she would like to get in their respective national team that is generally ranked higher. The chances of getting into the national team are therefore not equal for every player: it is more difficult to play in the higher ranked national teams which usually perform well and have more talented players.
Some of the most vital features that we identified to require improvement cannot be altered, e.g., nationality. As these features have great effect on the career goals, we do not exclude those during the player classification and KPI creation, but for the use case and development recommendation we only use and compare the variables the players are able to improve.
Although we call the created online tool a career handbook and advisor tool, one might find this appellation excessive. The recommendations given based on data analytics might be reframed as an information/database toolkit that can be used by anyone, i.e., public, researchers, players, and coaches.
Conclusion
The success of a soccer player is not entirely pre-destined by their physical ability, talent, and motivation. There are certain decisions along the way that greatly affect the arc of their career: which skills to develop, which club to sign a contract with. In this paper, we identify the optimal strategic choices toward multiple potential aims a soccer player can have. Players, managers, and clubs may use the lessons learned in their strategic decisions. We handle the soccer market inflation, find the most important skill features for each position, and deal with the unique position skill requirements. Then, we create new features from a network analysis and also consider national team and Team of the Season selections. We build classification models to find all the features to build KPIs and divide our dataset into top and rest of the players based on the desired career goal. Then we validate our player separation with dynamic time warping where we compare the KPI time series that represent the evolution of player skill and other attributes. Based on the results, we can declare that this methodology successfully distills the main factors that make world-class professional soccer players. Based on the models, we have created the soccer player handbook. With the help of this tool, one can analyze the career history of young players and see how close their skills and other statistics are to the top players at the respective age regarding a selected career goal. After the comparison, the tool calculates the fitness of achieving the goal and recommends essential improvements that are needed to actually reach it. In this paper, we represent an illustrative use case of our model regarding the market value goal with a young player, but our freely accessible handbook can be used for other career goals as well, e.g., getting selected into one's national squad or making it into the English Premier League.
Footnotes
Declaration of conflicting interests
The author(s) declared no potential conflicts of interest with respect to the research, authorship, and/or publication of this article.
Funding
The author(s) disclosed receipt of the following financial support for the research, authorship, and/or publication of this article: Projects no. 128233 and no. 135074 have been implemented with the support provided by the Ministry of Innovation and Technology of Hungary from the National Research, Development and Innovation Fund, financed under the FK_18 and FK_20 funding schemes, respectively.