
Abstract
Soccer players need to make many decisions throughout a match in order to maximize their team’s chances of winning. Unfortunately, these decisions are challenging to measure and evaluate due to the low-scoring, complex, and highly dynamic nature of soccer. This article proposes an end-to-end deep reinforcement learning framework that receives raw tracking data for each situation in a game, and yields optimal ball destination location on the full surface of the pitch. Using the proposed approach, soccer players and coaches are able to analyze the actual behavior in their historical games, obtain the optimal behavior and plan for future games, and evaluate the outcome of the optimal decisions prior to deployment in a match. Concisely, the results of our optimization model propose more short passes (Tiki-Taka playing style) in all phases of a ball possession, and higher propensity of low distance shots (i.e. shots in attack phase). Such a modification will let the typical teams to increase their likelihood of possession ending in a goal by 0.025.
Introduction
A vital task of soccer players is to make decisions about the ball destination throughout the match with respect to optimizing their team’s chances of winning. Due to some prospects of a soccer game such as typically low end scores, complex situations, and high dynamism, it is cumbersome to measure and evaluate such decisions. Furthermore, some decisions might have little impact in the short-term but overall contribute to the team winning in the long run (e.g. a relatively simple pass that opens up space elsewhere on the pitch). Perhaps, this is a good inception of Cruyff’s quote: “Sometimes something’s got to happen before something is going to happen.” 1 Figure 1 illustrates the Belgian Pro League 2020-21 teams’ decisions in terms of selecting ball destination. We have summarized all actions with clear ball destinations as follows: “short pass,” “long ball: ball movement over 32 m in length,” and “shot.” Figure 1 makes it evident that teams’ propensities of choosing actions are non-stationary and vary in different phases of ball possession. For instance, the typical teams in the Belgian league-wide model tend to perform “short pass” in 41% of times when in build-up play phase, and perform “shot” in 38% of times when in attack phase. But how these statistics could assist the soccer coaches and players? They still ponder if they should adjust their current propensities, and by how much? We aim to provide answers for such questions.
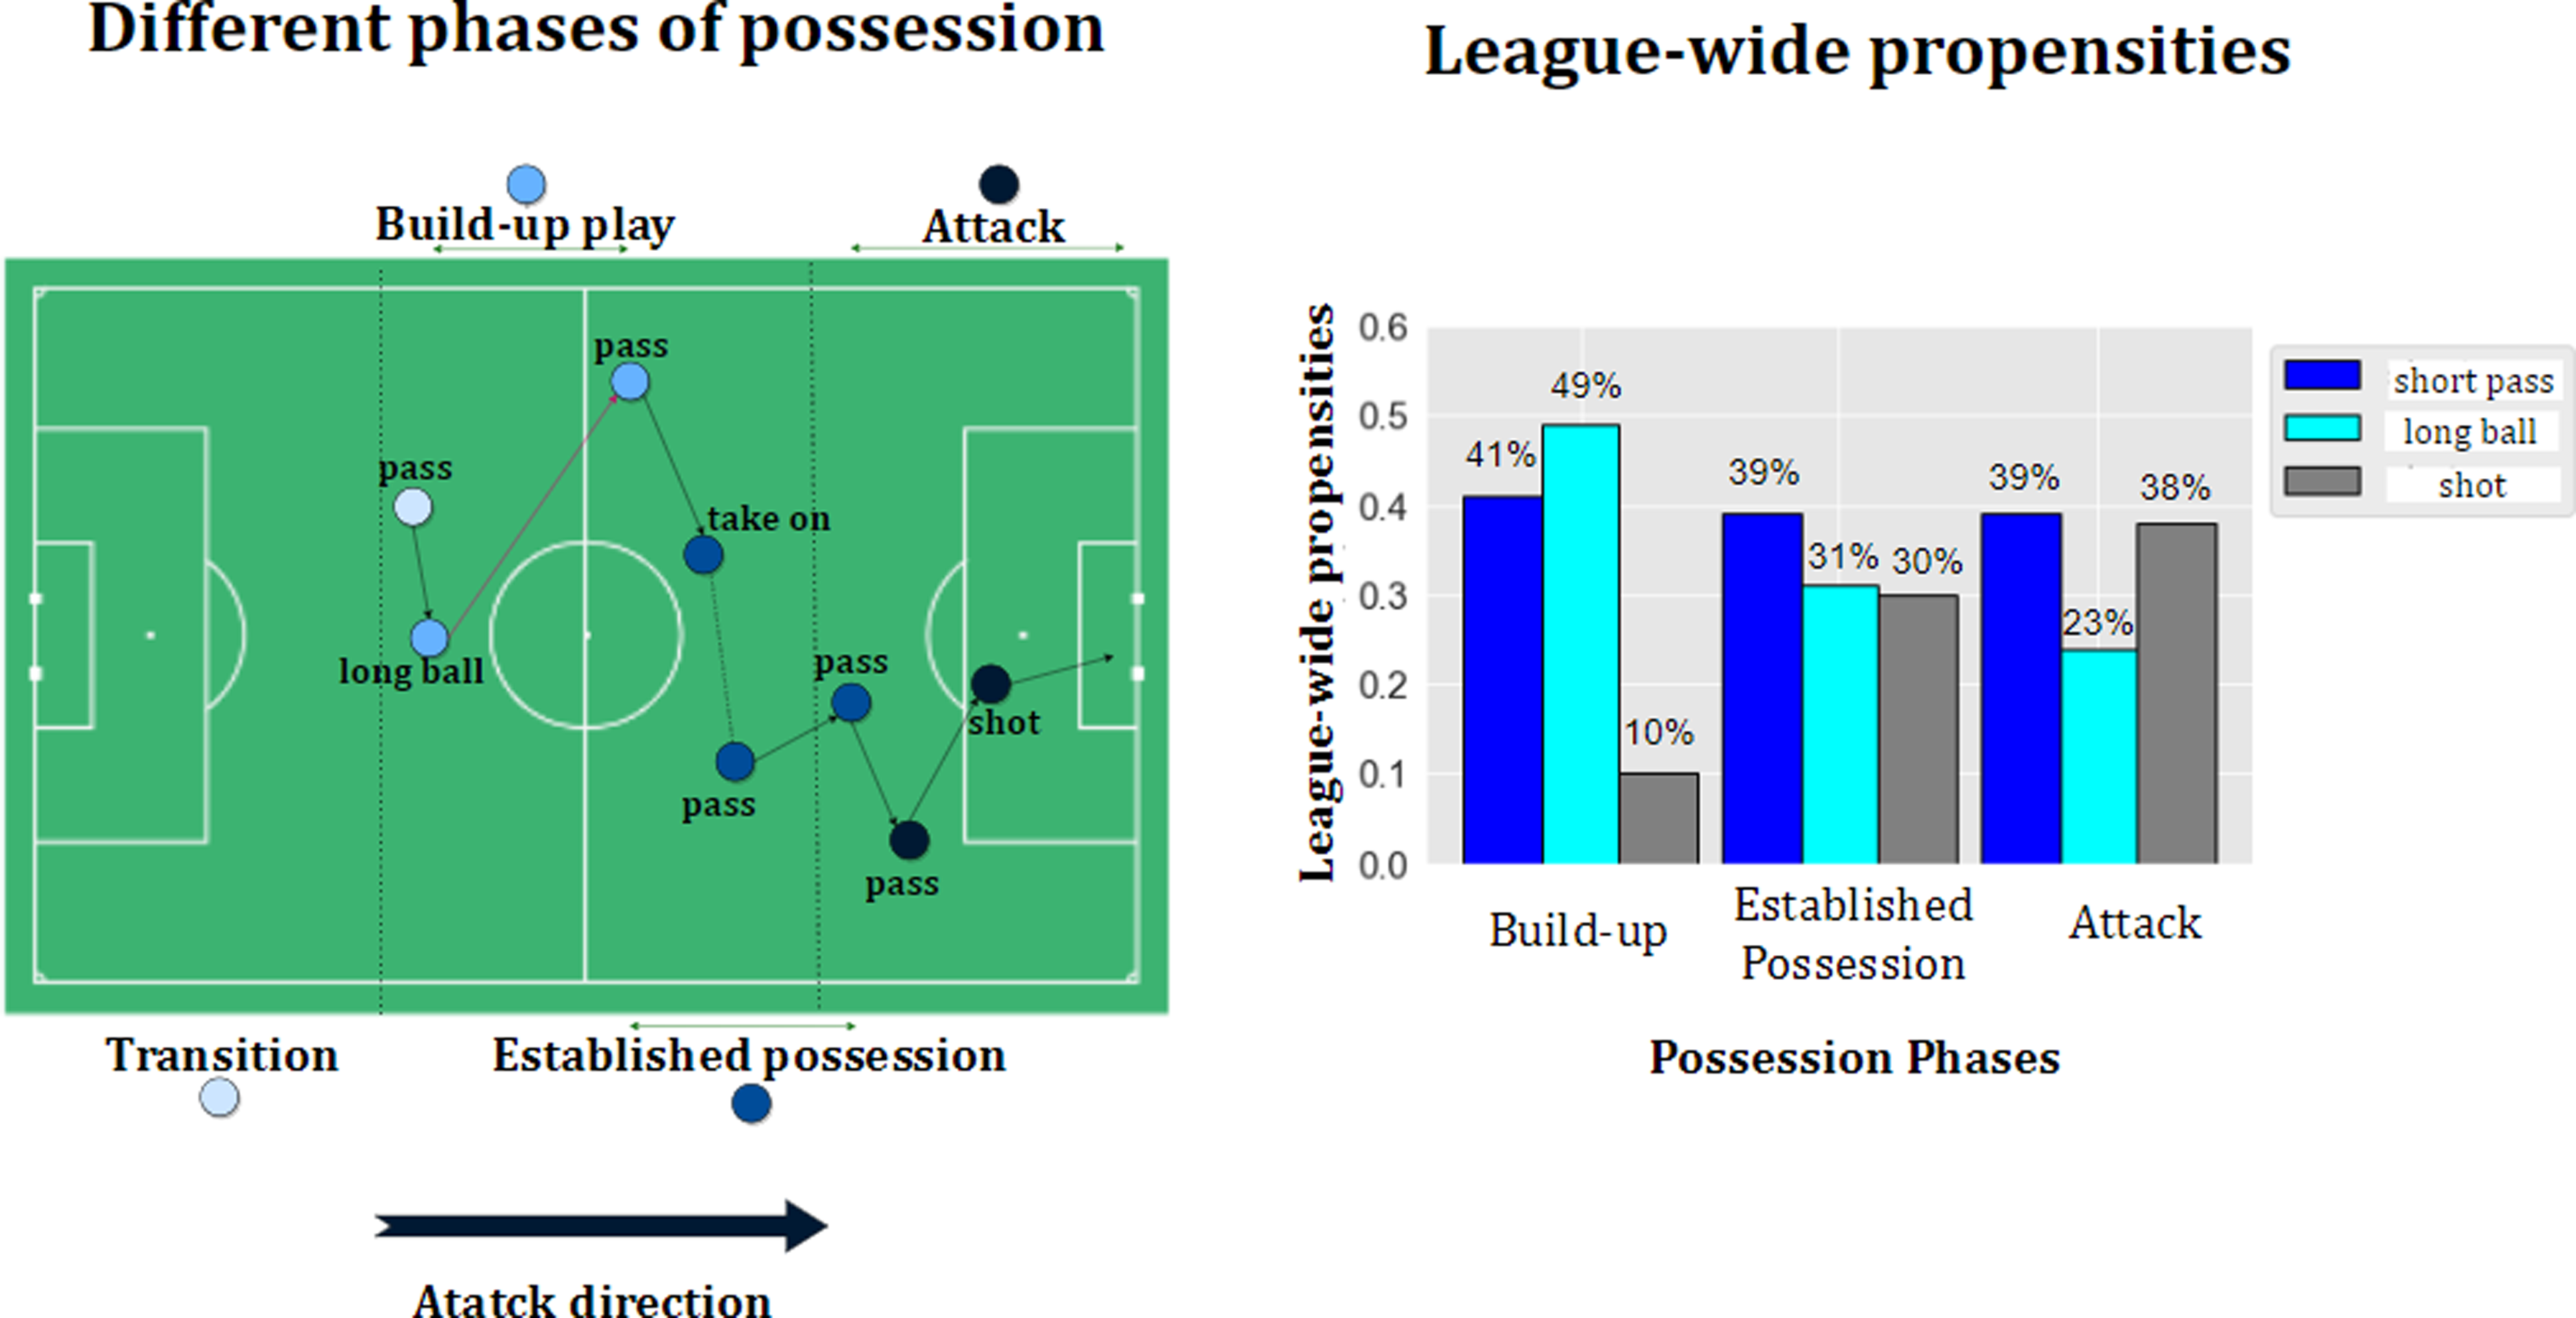
League-wide analysis in the Belgian Pro League 2020-21 season in terms of teams’ propensities of deciding the ball destination location on the pitch.
Current analytics methods on soccer decision making are limited to measuring the potential outcome of alternative decisions,2,3 and action valuation methods are focused either on short-term (e.g. pass success and turnover probabilities)4,5 or long-term (e.g. goal scoring probability within the next 10 actions) valuations.6–8 Therefore, soccer analytics still seeks straightforward answers to the following questions:
How to split the whole game into different game phases and expound the short- and long-term objectives accordingly to address the non-stationary nature of decision making in soccer? How to analyze the current strategy of a team, and obtain the optimal strategy? How to evaluate the obtained optimal strategy without the cumbersome and expensive process of applying it in a real match?
A comprehensive method must regard a wide set of actions and consider all exact player- and ball locations rather than team formations. The current methods using artificial intelligence could predict where a player will pass the ball (pass selection),
7
the likelihood of that pass being completed (pass success),7,4 and whether this pass will result in a scoring opportunity (pass valuation).8,5,6,9,10 These latter values are estimated by the probability of a shot being made in the next 10 s, next 10 actions, or at the end of the possession. But what if a pass is too far away from the subsequent goal scoring? Analytical works to date cannot provide a comprehensive and well-defined answers for the above-mentioned questions. Moreover, they only evaluate the current passes and do not have a suggestion for alternative optimal pass options. This work aims to bridge this gap by first analyzing the current strategy of the teams in terms of their propensities to select the destination location of the ball, and then calculating optimal tactics based on all players’ positions on the pitch, for example, learning about the effectiveness of cross passes, and Tiki-Taka playing style. Furthermore, our optimization framework continuously highlights the most valuable space on the pitch for the ball to be moved to, which has the maximum potential contribution to the team winning in the long-term. We directly derive the optimal policy for teams in terms of ball locations instead of evaluating the effect of alternative policies and counterfactual reasoning such as: what could have happened if another destination had been selected? The advantage of our proposed method compared to the state-of-the-art is that we can directly evaluate the performance of following the optimal policy rather than counterfactual reasoning and what-if analysis
2
(e.g. what could have happened if the team had increased long or short pass/shot frequency by x%?). We model the offensive behavior of all teams in the Belgian Pro League for over two seasons in a Markov Decision Process (MDP) framework and derive their team-specific optimal behavior using techniques from Reinforcement Learning (RL). At first, we apply deep learning to estimate the selection and success probability surfaces given the current location of the 22 players and the ball in each instance of the game. Second, we construct a Markovian environment, which properly models the offensive behavior of each specific team in the league. Third, we take advantage of the Policy Gradient (PG) algorithm that is a well-suited technique in RL when one wants to work with real data rather than simulated games to derive the optimal probability surface of ball destination location. Finally, we explore the effects of applying the derived optimal behavior for each team on their expected possession outcomes and on winning the game, which removes the necessity of deploying the optimal policy in real games to see the outcome.
Overall, the optimization model proposes more short passes (Tiki-Taka playing style) in all phases, and higher propensity of low distance shots (i.e. shots in attack phase). In case we were able to measure the actual likelihood of a goal for a particular ball possession ranging between
Related works
The state-of-the-art methods in soccer analytics are categorized into decision making analysis, and action valuation methods. Current analytics methods on soccer decision making are limited to measuring the potential outcome of the alternative decisions (e.g. What would have happened if the team had increased particular action frequency by x%?) rather than directly discovering the optimal ones. Exploring the effect of changing such decisions is studied by Van Roy et al. 2 and Fernandez et al. 8 in football, and Sandholtz and Bornn 3 and Sandholtz and Luke 11 in basketball. A comprehensive method must consider a wide set of actions and all exact player- and ball locations rather than team formations. The current methods using artificial intelligence could predict where a player will pass the ball (pass selection), 7 the likelihood of that pass being completed (pass success)4,7 and whether this pass will result in a scoring opportunity (pass valuation).9,10,12,5,6,8 It was in the work by Rahimian et al. 13 that used RL to directly derive optimal policy rather than action valuation in soccer. Later on, they expanded the framework for finding the best action for both offensive and defensive phases of a soccer match. 14 However, their method is designed for finding the best discrete offensive and defensive actions and lacks predicting the full probability surfaces in the soccer games. Mendes-Neves et al. 15 introduced a soccer simulator tool based on event data and used RL to decide the best action to make according to the current state and then to give feedback in the form of a reward. Our work uses deep learning techniques to analyze the current strategy of the teams in terms of their propensities to select the destination location of the ball on the full pitch surface using both event and tracking data, and then use RL to directly discover optimal tactics based on all players and the ball positions on the pitch.
Materials and methods
In this section, we first describe the dataset we used for our analysis. We then elaborate on technical characteristics of modeling teams’ actual behavior on the pitch. This helps developing fine-grained analysis of game situations in soccer assisting coaches with rich information in a visual and interpretable format about the teams’ actual propensities of selecting ball destination given a game situation. Next, we use RL based on the given reward to the same model to optimize towards producing better decisions and yielding more goals by the players.
Dataset
The dataset consists of high-resolution spatiotemporal tracking and event data covering all 330 games of the 2020-21 season, and 100 games of 2021-22 season of Belgian Pro League collected by Stats Perform. The tracking data include the (x,y) coordinates of all 22 players and the ball on the pitch at 25 observations per second. The event data includes on-ball action types such as passes, shots, dribbles, etc. annotated with additional features such as contestants, period ID, ball possessor player ID, start, and end locations of the ball. We then merged tracking with event data. Each record of our merged dataset includes all players and the ball coordinates with their corresponding features for each snap-shot, that is, every 0.04 of a second.
Teams’ behavior prediction method
In this section, we elaborate on the technical characteristics of deriving a behavioral (i.e. actual) policy on both the league-level and the team-level. The policy in this work is defined as the team propensities of selecting the ball destination, that is, a location on the pitch, given the positions of the 22 players and the ball. In order to represent these propensities for any situation of the game and use them for further decision making, we need to estimate two probability surfaces: The first probability surface is the selection surface, which shows the probability of the ball being passed to each pitch location from a given game state. The second probability surface is the success surface, which predicts the probability of the action being successful (i.e. possession is maintained) for each location on the field if the ball is sent over to that location. These surfaces are obtained by carefully training a policy network that receives a particular game situation and associated labels as input, and produces the probability surfaces as outputs. In order to include the effects of the game context in the model, we build the policy network on top of the event- and tracking data, and we use deep learning techniques to tackle the complexity of spatiotemporal tactics. Now we describe the game state representation, and the architecture of the policy network to obtain the required surfaces.
State representation and input channels
We represent the game state for each situation including the specific locations (x,y) of all players and the ball, their corresponding velocities, and respective outcomes of particular events (e.g. success or turnover for pass). To represent this information, we construct eleven input channels in a format that suits the policy network. Each channel is a matrix of size ( Locations of the attacking team’s players. The value of every player’s location is set to 1. Locations of the defending team’s players. The value of every player’s location is set to 1. x components of the velocities of the attacking team’s players. y components of the velocities of the attacking team’s players. x components of the velocities of the defending team’s players. y components of the velocities of the defending team’s players. Euclidean distance of the ball to each location on the field. Euclidean distance of the defending team goal to each location on the field. Angle between the ball and the goal for each location on the field. Cosine of the angle between the ball and the goal for each location on the field. Sine of the angle between the ball and the goal for each location on the field.
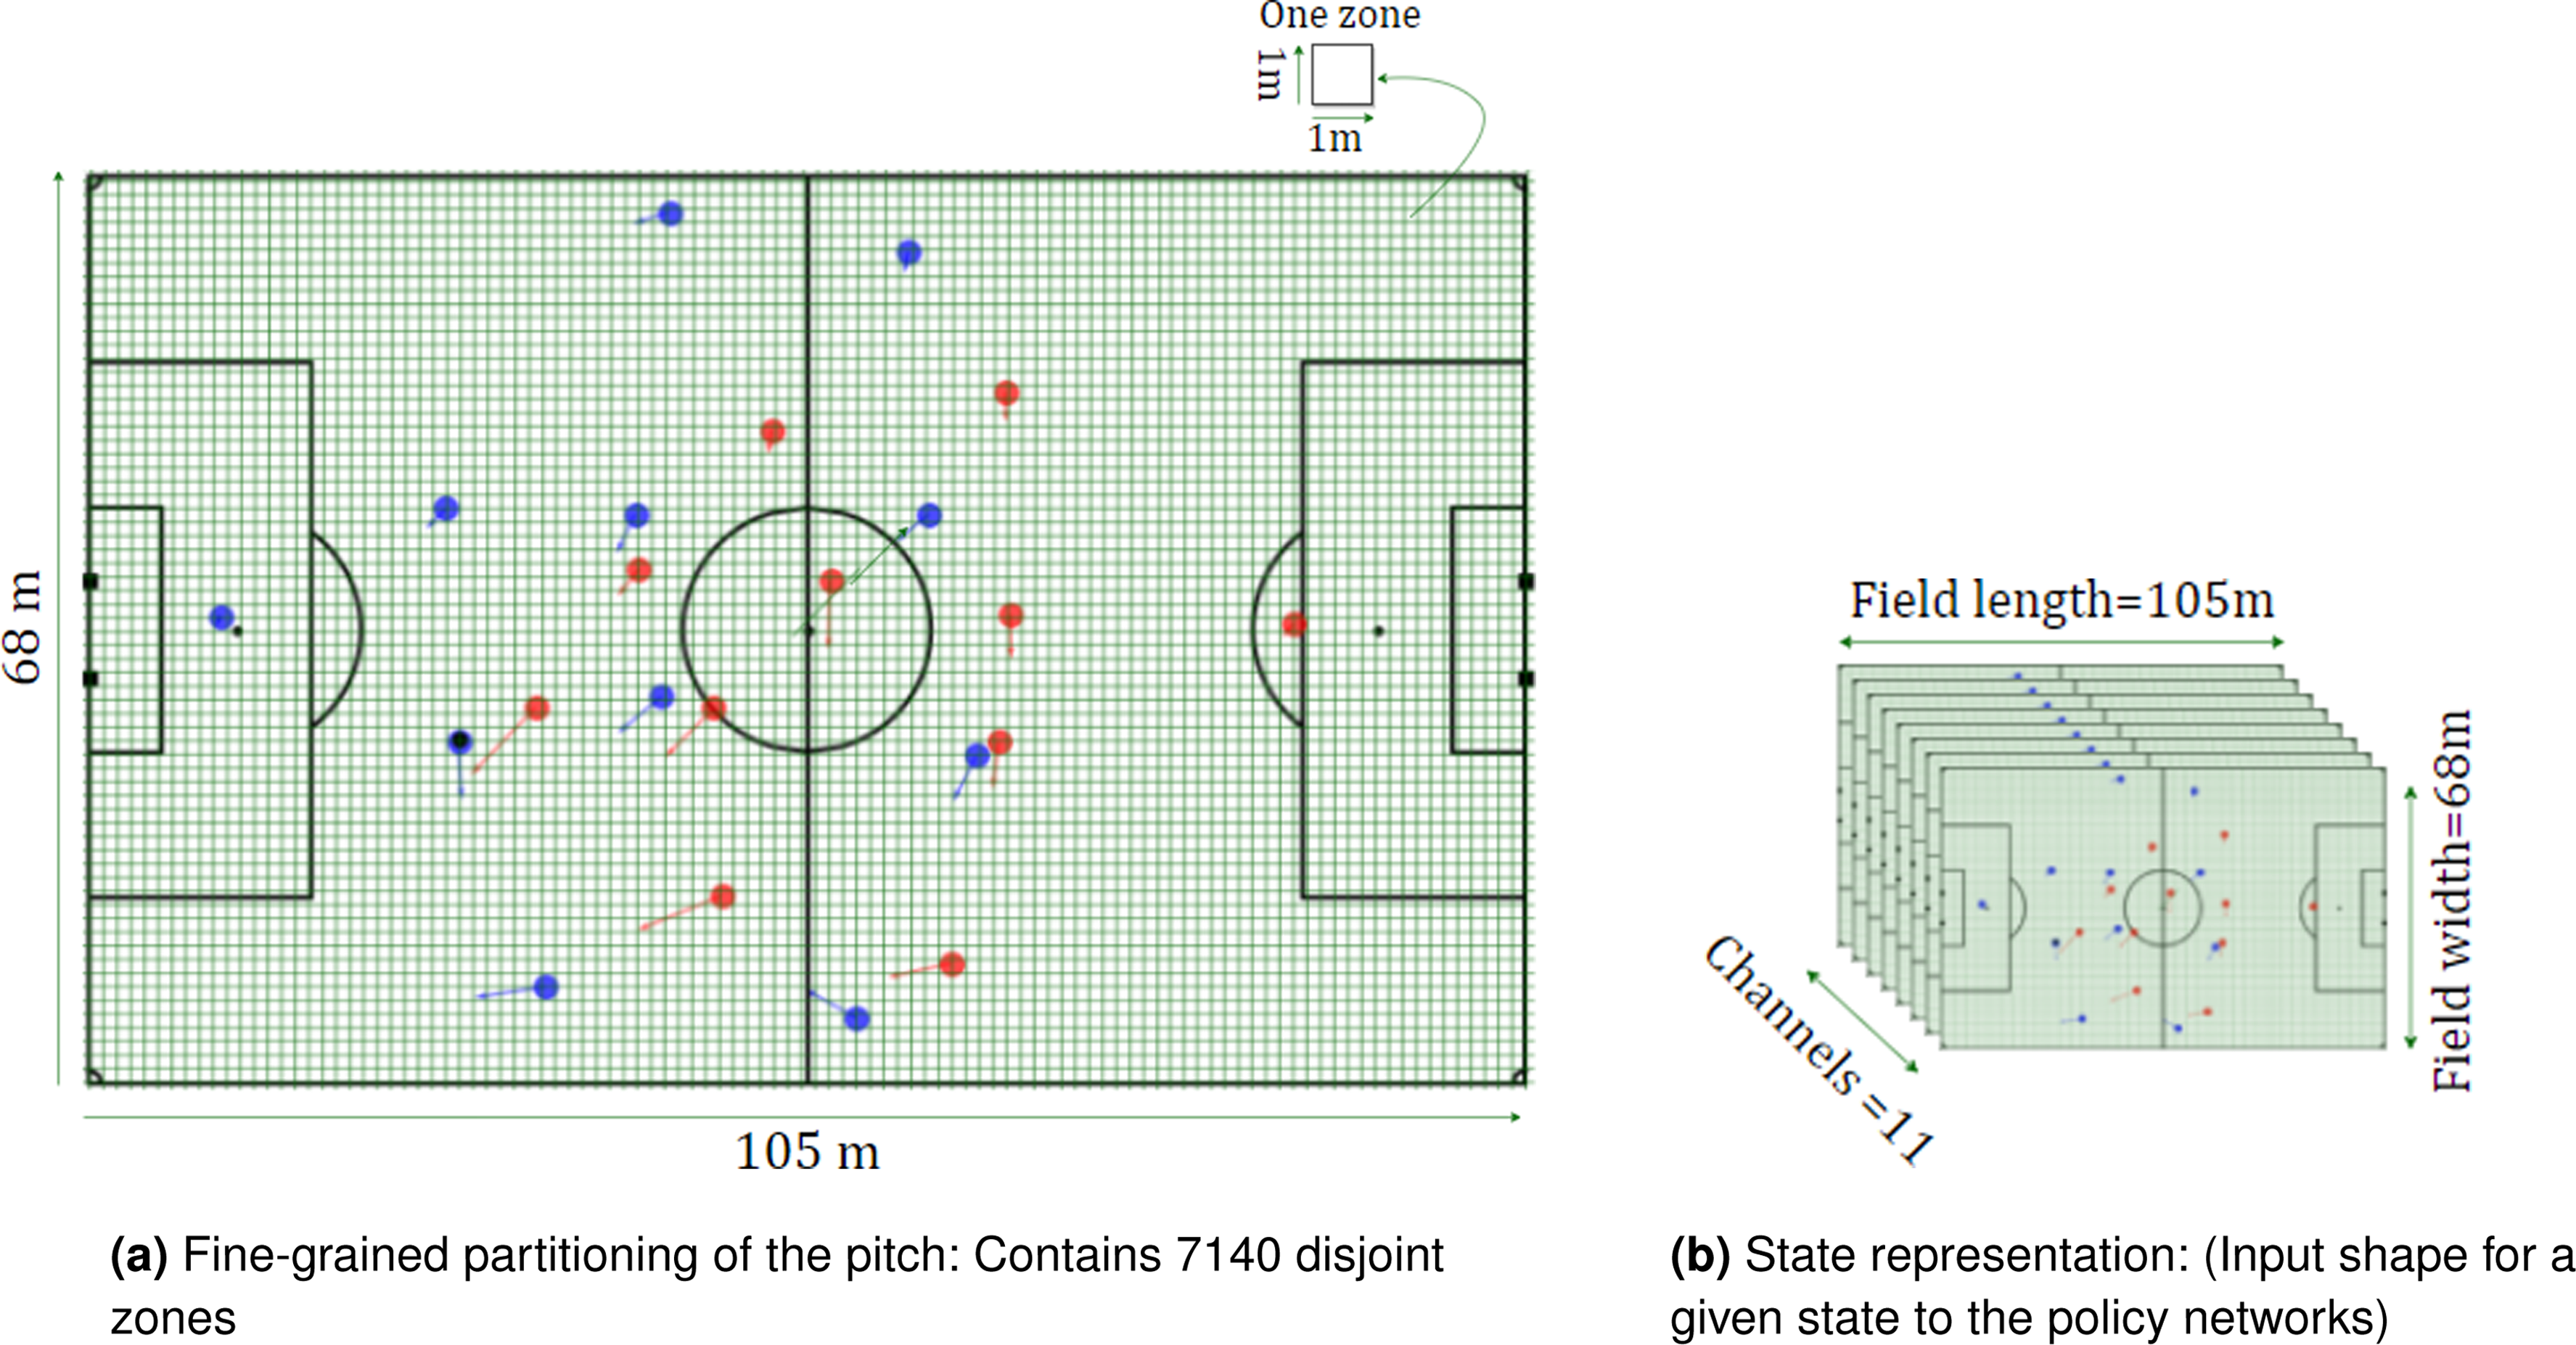
State representation. Blue, red, and black circles represent the home team players, away team players, and the ball, respectively. Each state represents a time step in the dataset, containing 11 matrices with size
The policy network architecture
To infer our probability surfaces and to formulate the policies, we apply deep learning techniques. We use a policy network, which is a neural network that takes a huge number of game states as input and produces the probability surfaces as outputs. From a technical perspective, any probability surface contains
Encoder: Encoder is the first neural structure that takes the input of the model that are the input frame sequences (i.e. the input channel matrices from tracking data described in the previous section), along with the two labels of ball destination location and outcome of the action for each game state taken from the event data. This module learns a suitable mapping from the sparse input data to the feature space which minimizes the decoders’ loss function. Decoder: Decoder is the second neural network in our policy network that takes the features extracted by the encoder for each input frame and produces the required output based on the input feature vector. The gradients of the decoder are backpropagated to the encoder to train its weights along with the weights of the decoder during the training phase.
In the proposed model, the decoder part is a target or policy network used for the optimization process in the next section. The encoder part is a deep neural network applied to extract deep features from sparse input frames. Since we have access to the labels such as the destination location (label 1 in Figure 3) for each frame, we can treat the problem of yielding the selection surface as a standalone supervised learning task for multi-class classification. This can be done by setting a softmax activation function to the last layer of the encoder network to produce the selection surface in which the sum of probabilities over all zones add up to 1. On the other hand, yielding the success surface is an unusual case of weakly supervised learning since there is only one single-pixel correspondence between ground-truth outcomes (label 2 in Figure 3) and the predicted success surface. A sigmoid activation layer is applied to the last layer of the encoder to ensure the probability of each zone in the predicted success surface is a real number between [0,1]. Further details of the structures and loss functions are discussed in Fernandez and Born.
7
We here focus on the practical application of the network rather than the technical characteristics and setup.
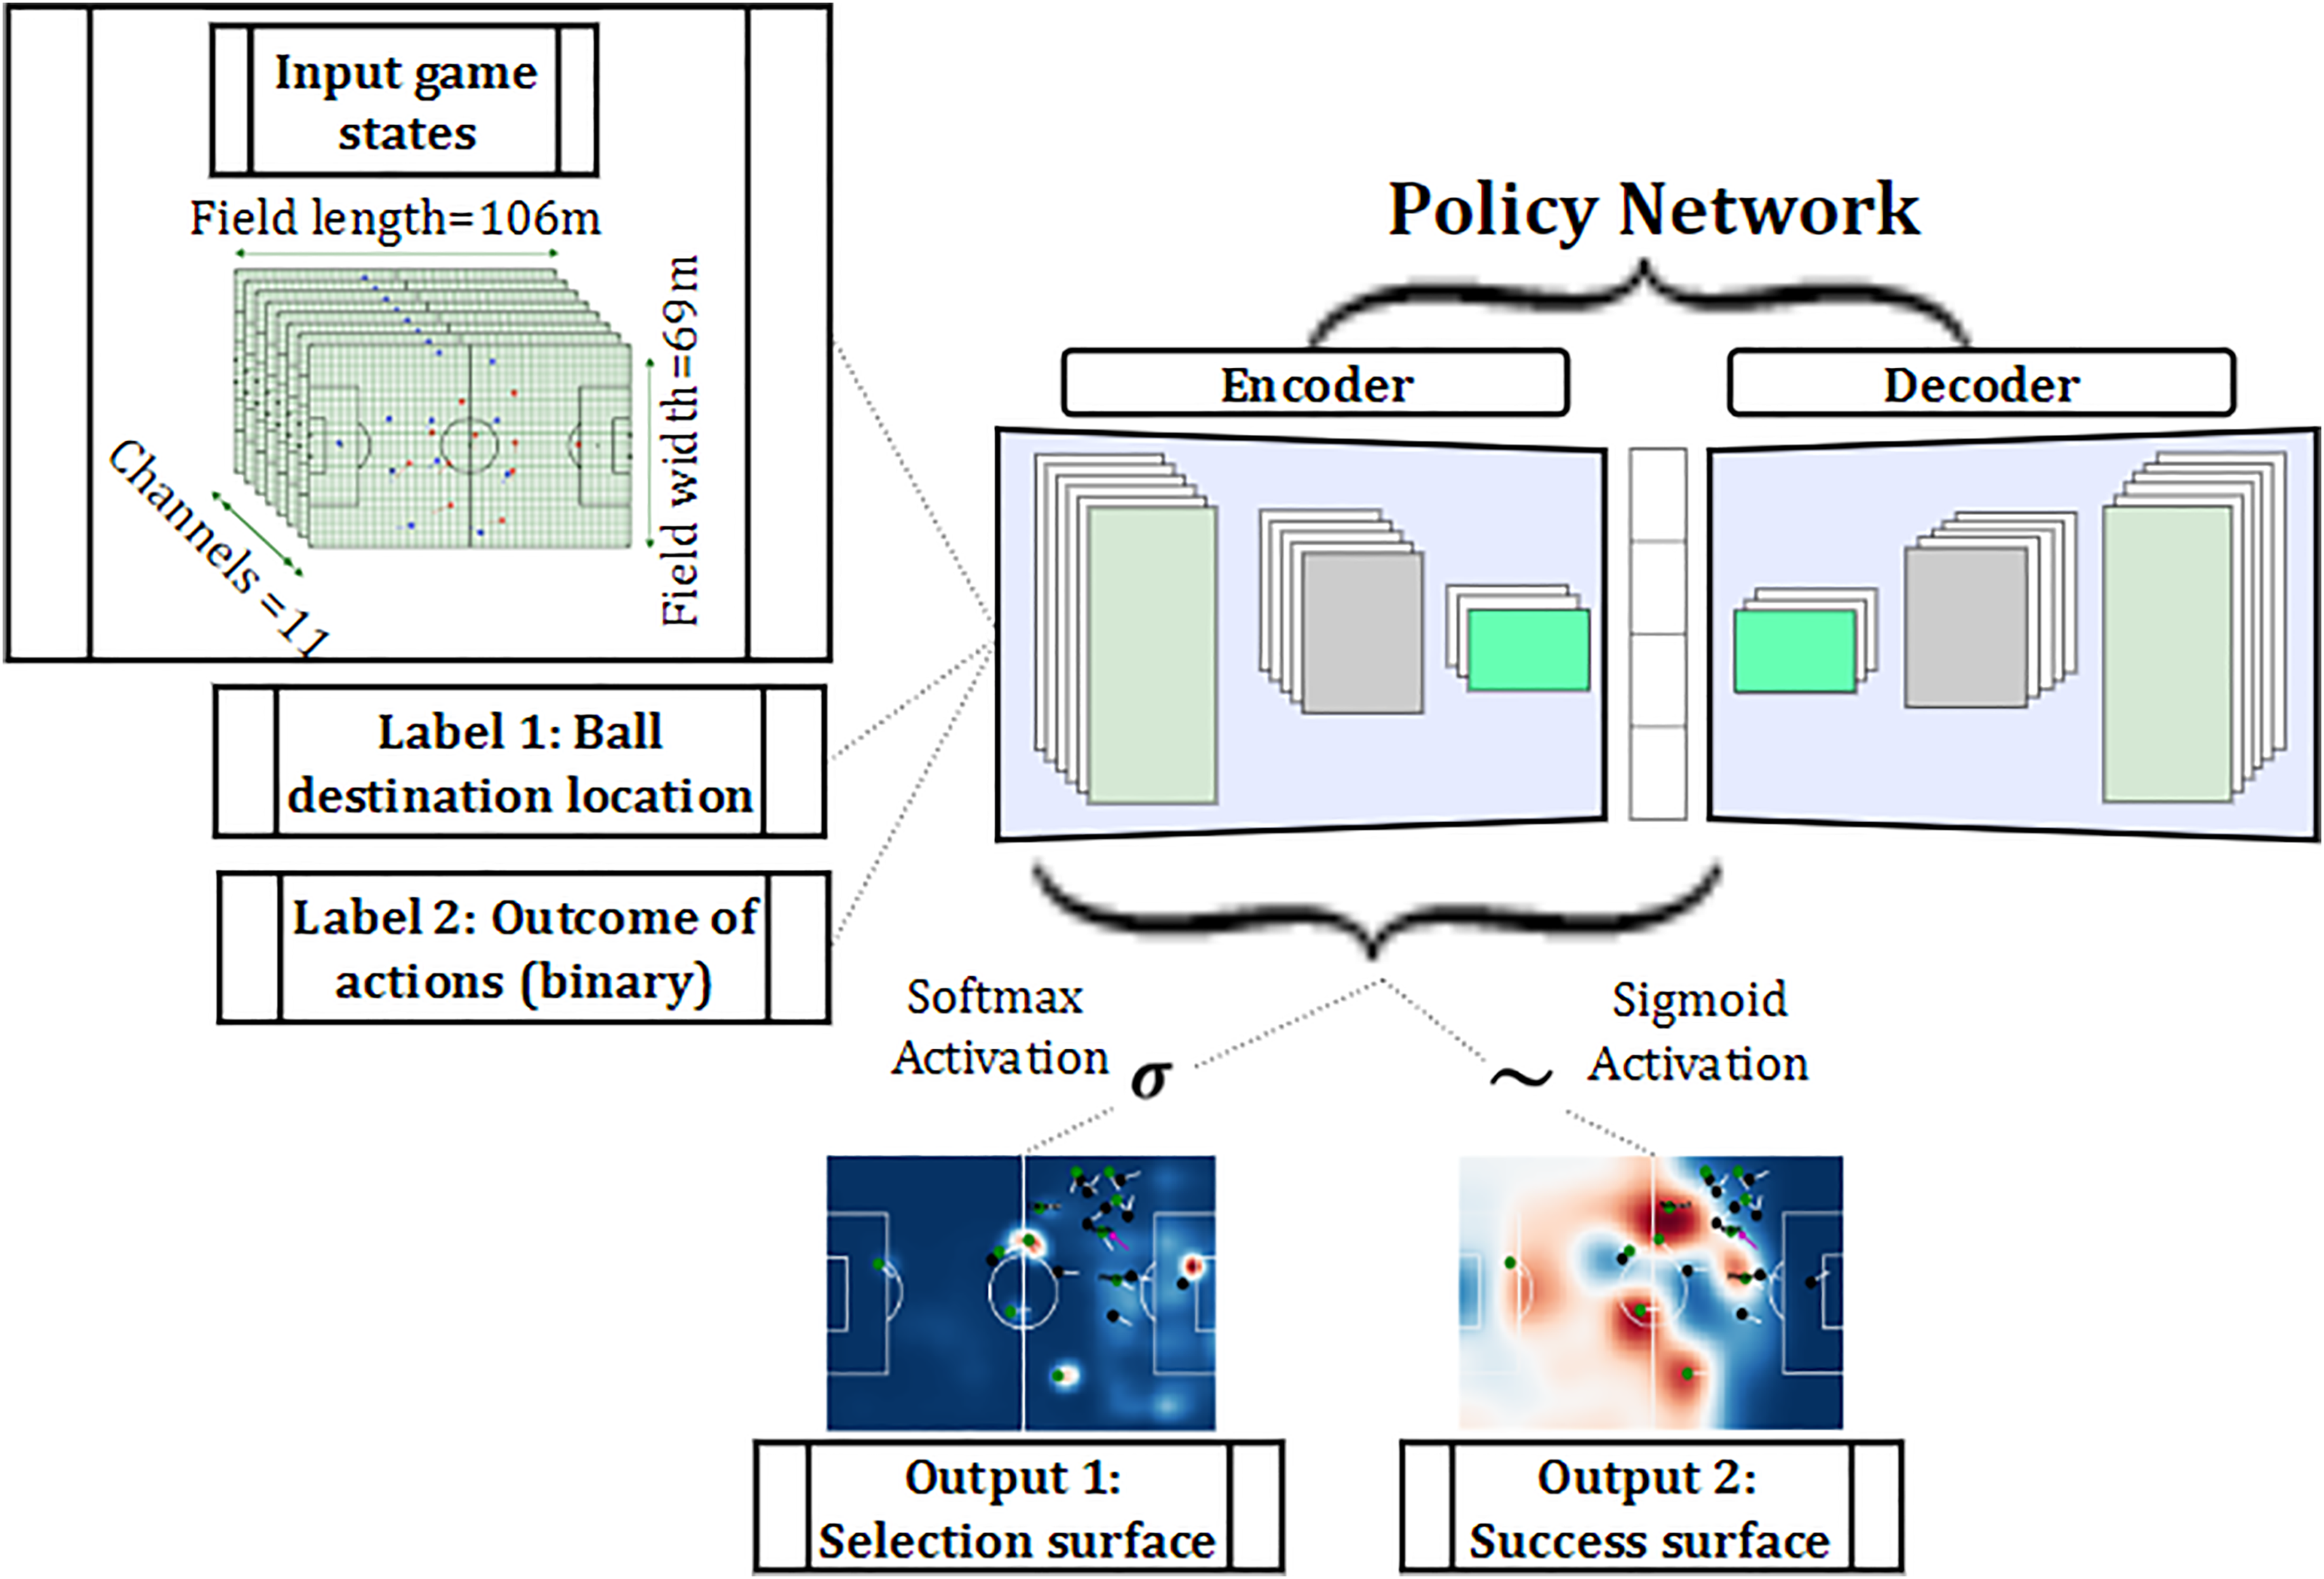
Policy network architecture with the respective inputs and outputs. Label 1 is collected from tracking data and label 2 is based on the event data. Output 1 is the selection probability surface that is considered as the policy in this work. Output 2 is the success surface representing the probability of action being successful if the ball is sent over to each location on the field.
In order to find the best performing spatiotemporal model for learning the probability surfaces, we experiment with different neural networks for the encoder module. The examined neural networks are as follows:
MLP: The Multilayer Perceptron (MLP) model is a neural network with only one hidden layer. GRU: The Gated Recurrent Unit (GRU) is a recurrent neural network exerted on extracting features from sequential data. CNN: The Convolutional Neural Network (CNN) has a kernel which can move in one, two, or higher number of directions and extract features from spatial data. CNN-GRU: The combination of CNN and GRU model is proposed here, where the CNN is responsible to learn features from spatial characteristics and GRU is used to handle the sequential nature of our input frames.
Table 1 shows the results of the selection and success probability estimation of the encoder module of the policy network for all passes in the test set. We used a split of 80%–10%–10% for the train-validation-test sets respecting the chronological order of the games to ensure actions from the same match do not end up in both the train and test sets in order to avoid temporal information loss. We use train set for fitting and training the model in which the model sees and learns from this data. Validation set provides an unbiased evaluation of a model fit on the training dataset while tuning model hyperparameters. The model sees this data, but never learns from it. We use the validation set results, and update higher level hyperparameters. The test set is used to provide an unbiased evaluation of a final model fit on the training dataset. According to Table 1, CNN-GRU outperforms the other models with the lowest log-loss in yielding both the selection and success surfaces, trained and tested on GPU. Furthermore, the small differences between train and test set losses ensure that the CNN-GRU model is fitted correctly. Therefore, we use the trained CNN-GRU model as our policy network in the rest of the paper. Furthermore, we evaluate the performance of our trained policy network for yielding the success surface by comparing the result with a baseline model. Our baseline is a Naïve model for the success estimation proposed by Power et al.,
4
which assigns the average pass completion of 85% to all passes. In our Belgian dataset, the average pass completion is 87% corresponding to a loss of 0.43. This is much higher log-loss than our trained CNN-GRU model and we can conclude that our model works better than the baseline.
Model performance on the train and test sets.
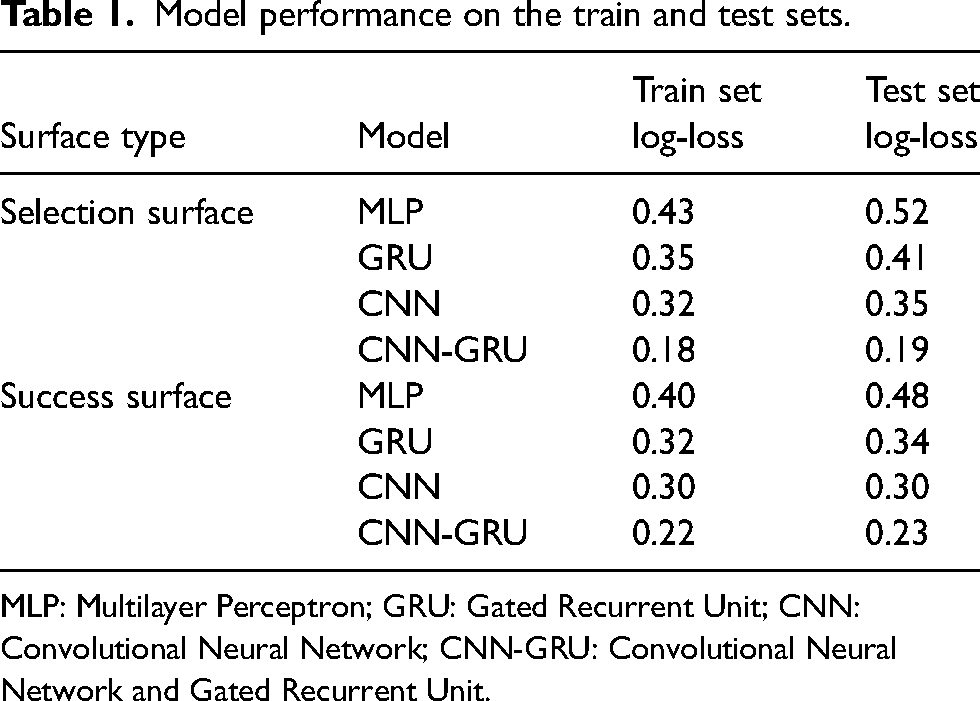
MLP: Multilayer Perceptron; GRU: Gated Recurrent Unit; CNN: Convolutional Neural Network; CNN-GRU: Convolutional Neural Network and Gated Recurrent Unit.
Figure 4 illustrates the surface outputs of our trained policy network on a specific game state during a match of Cercle Brugge against Union SG. The estimated probability surfaces illustrate the performance of our policy network on capturing the influence of teammates, opponents, and their velocities on the ball holder (Hotic) on deciding about the ball destination.
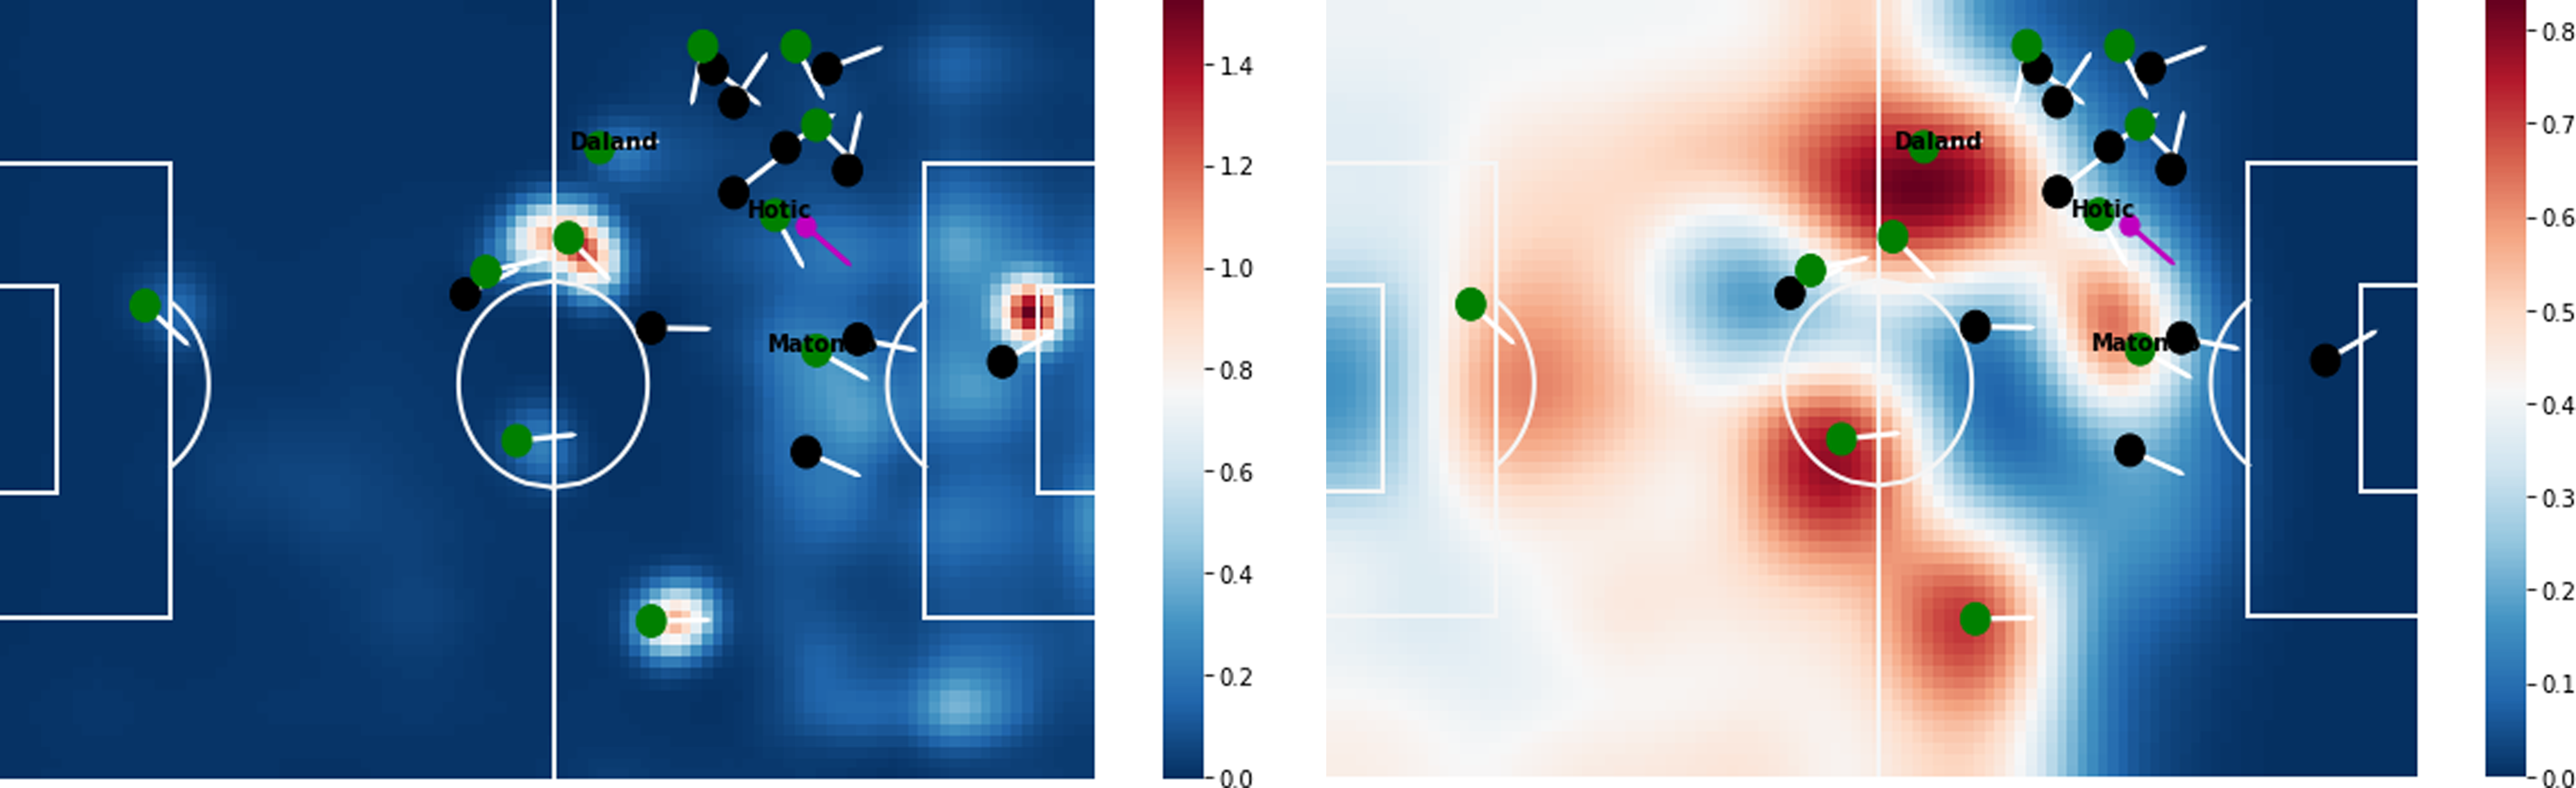
Output surfaces for a game state in a match of Cercle Brugge against Union SG. The surface color represents the probabilities from cool to warm, where cool (blue) represents lower probability, and warm (red) represents higher probability. Green and black circles represent the players’ locations on the attacking and defending team, and the arrows represent their velocities. The purple circle represents the ball’s location.
Optimization method
So far, we have prepared the selection and success probability surfaces for each game state. The current results provide practical applications to analyze the difference between action tendencies of various teams. But the estimated surfaces are not comprehensive enough to assist the players and coaches in optimal decision making: the selection surfaces are estimated according to the general policy of the historical games, and there is no evidence of optimality of the decisions and policies made by teams and players in prior matches. Moreover, the estimated success surfaces only indicate the short-term rewards of not losing the possession that the player can gain if he/she moves the ball to that location. Therefore, we aim to use RL which is able to shift the actual probability surfaces towards optimal ones and infer the optimal actions (e.g. optimal pass direction) from the actual data. The current analytical methods8,7 propose estimating value surfaces by training the neural network to predict the probability of goal scoring within the next 10 actions or at the end of the actual possession. In this section, we elaborate on our proposed optimization algorithm that can directly estimate the optimal full probability surfaces, covering all ball destination locations on the field, rather than learning values for each of the discrete actions that occurred in prior games.
Markov decision process
Markov Decision Process (MDP) is a framework used in systems with an urge for sequential decision making. When it comes to soccer ball possessions, the sequential nature of actions within a possession allows us to model possessions with this popular technique for optimization in RL tasks. The MDP models the probability that the ball carrier selects the destination location of the ball on the field, given the current positions of all 22 players and the ball. Our approach of modeling soccer with an MDP requires a number of well-defined elements: a tuple of
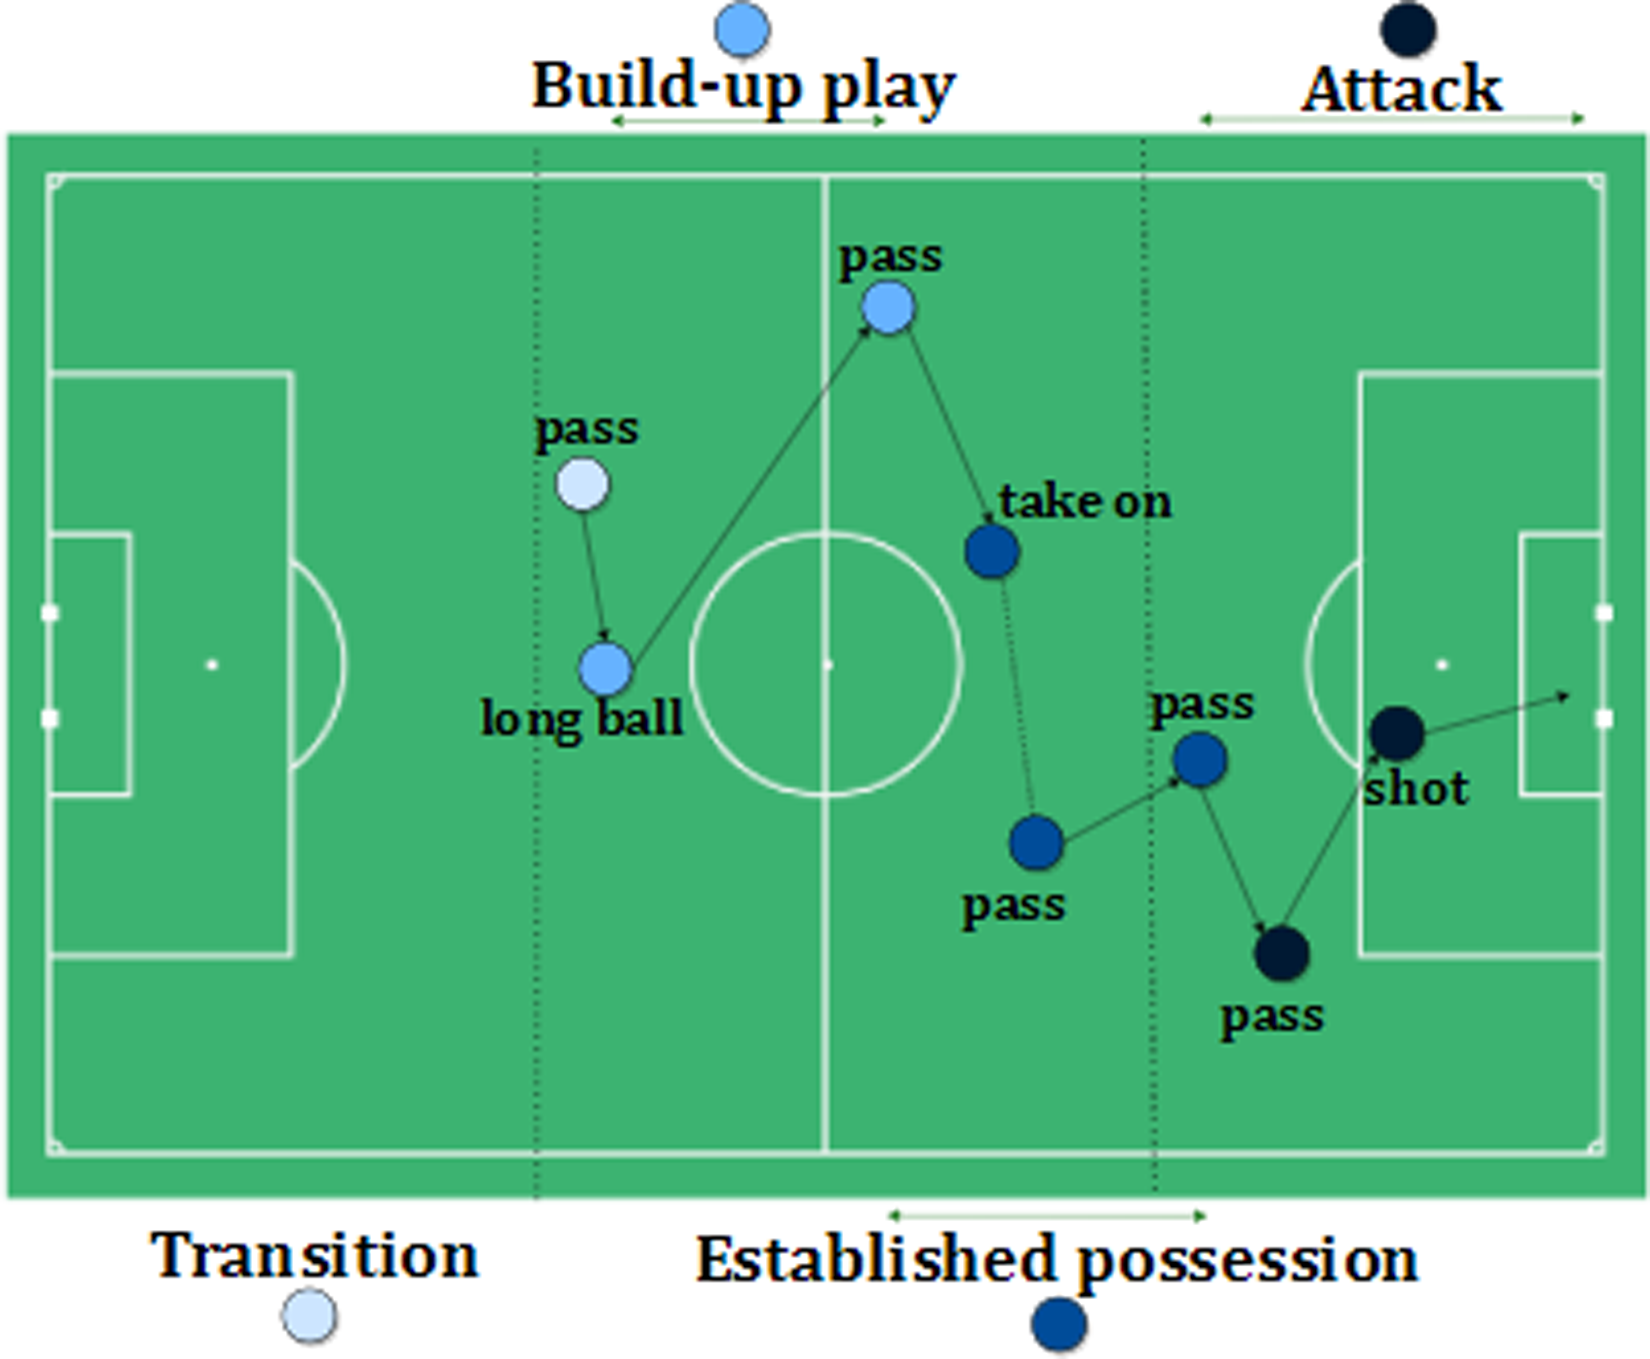
Different phases of a possession:
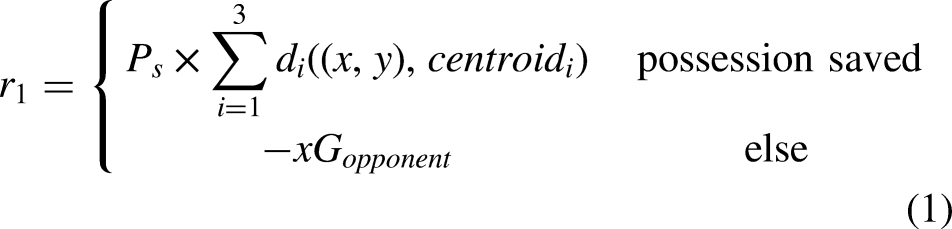
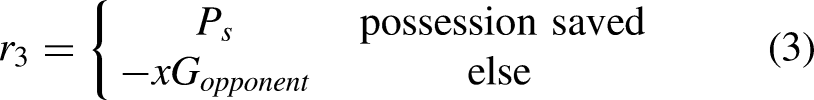
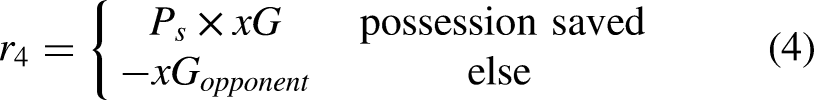
We assign a positive reward to successful actions (i.e. actions that kept possession) and a negative reward to unsuccessful actions (i.e. actions that led to a loss of possession). While an arbitrary choice, a negative reward is needed to discourage the agent from repeating the same action in the same situation in the future. For unsuccessful actions, we use the negative of the expected-goals value for the opponent’s shot, where the expected-goals value corresponds to the likelihood of the shot resulting in a goal.
17
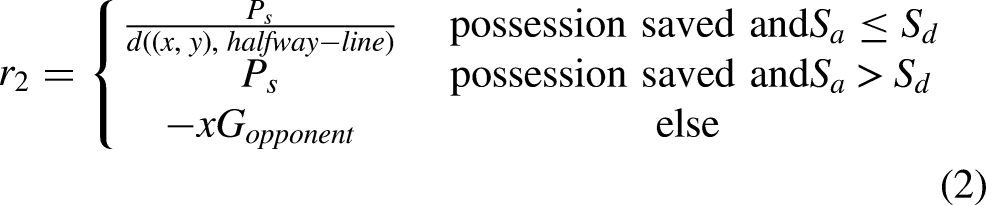
For successful actions, we use a tailored positive reward function for each of the four different possession phases:
Objective function: expected possession outcome
So far, we have assigned a reward to each action in the dataset according to its phase of occurrence during a possession. However, the action with the highest reward is not necessarily the optimal action that the player could perform, as the assigned rewards estimate only the short-term success and do not consider what will happen at the end of the possession (i.e. scoring a goal or losing possession). In order to address this issue, we introduce the notion of Expected Possession Outcome (EPO) for which we took inspiration from discounted rewards in RL algorithms. EPO is a real-valued number in the range (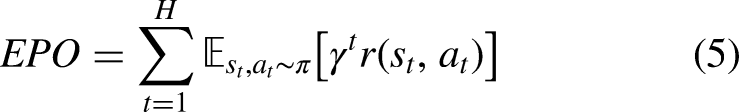
Policy gradient
In order to maximize the likelihood of possessions ending in a goal, we need to determine the actions that maximize (5) for all matches in our dataset. Since carrying out real-world experiments to find the optimal policy would be next to impossible, we apply RL to seek for the optimal solutions. To do so, we take advantage of the Policy Gradient (PG) algorithm19–21 that is a popular technique in RL to get the optimal actions in a continuous space. As we aim to estimate the optimal selection surface, the PG algorithm is a perfect choice for optimization. We use an offline RL workflow, which is able to extract policies with the maximum possible utility out of the available data, thereby allowing automation of a wide range of decision-making domains such as soccer analytics. 22 In this setup, the agent learns (trains and evaluates) solely from historical data, without online interaction with the environment. The policy network presented in the previous section can robustly estimate the selection probability surface that we call the behavioral policy. Now we aim to use the offline PG algorithm to tune the same network parameters to shift the probability distributions and to produce the optimal selection probability surface for each game state. The gradients of the network tell us how the network should modify the parameters if we want to encourage any decision (action) in the future. We modulate the loss for each action taken in a possession according to their eventual outcome, since we aim to increase the probability of successful actions (with higher rewards) and decrease it for the unsuccessful ones. We train the policy network with the help of the gradient vector, which encourages the network to slightly increase the likelihood of actions yielding large positive rewards (e.g. a pass with a high success probability or a shot with a high xG) and decrease the likelihood of negative ones. Consequently, actions with a high reward will tug on the probability density stronger than actions with a low reward. Thus, the offline PG algorithm helps the probability density to shift around in the direction of high rewarding actions, making them more likely to occur. Figure 6 illustrates the workflow of the offline PG method with the respective inputs and outputs.
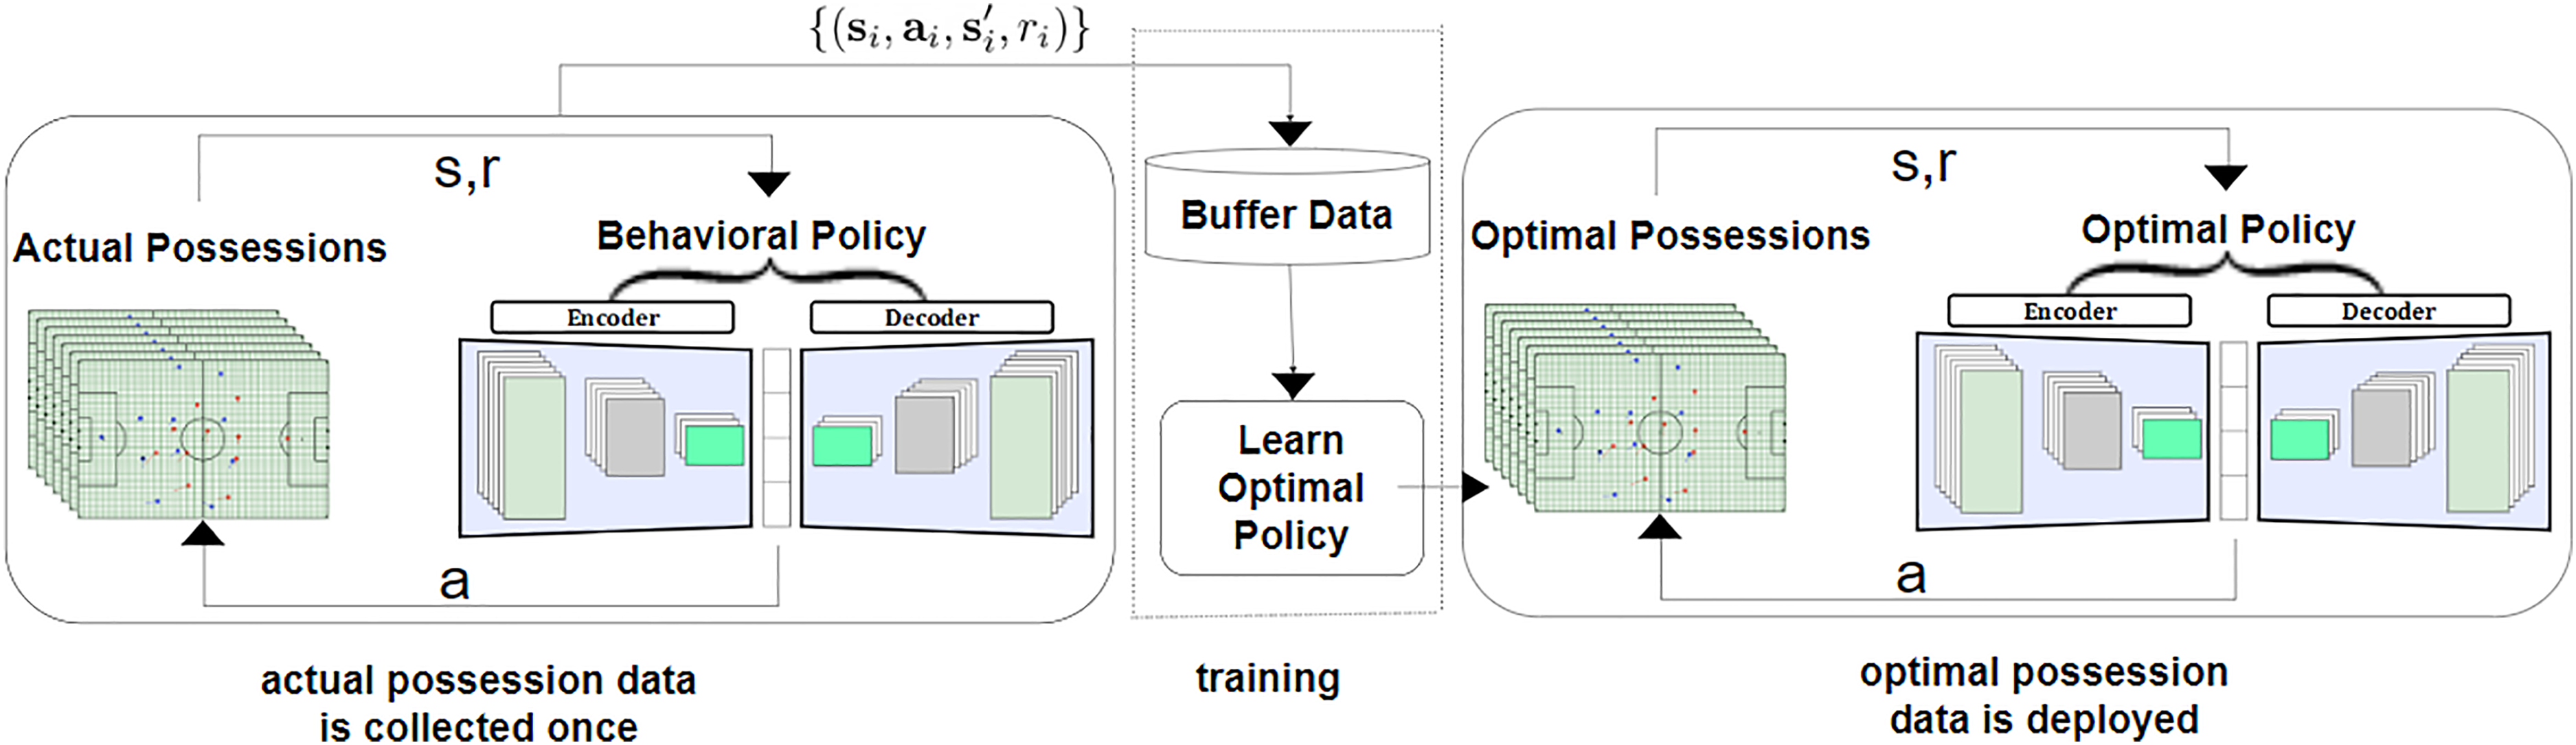
Offline PG workflow for producing optimal actions inside a possession from actual possession data. The state, action, and reward are shown with s, a, and r, respectively. The middle training part is the offline reinforcement learning which employs a dataset collected by the behavioral policy (i.e. selection probability surfaces from the policy network). The dataset is collected once, and is not altered during training, which makes it feasible to use large, previously collected datasets. The training process does not interact with the MDP at all, and the policy is only deployed after being fully trained. PG: Policy Gradient; MDP: Markov Decision Process.
Results
In this section we first describe the evaluation method that we used for assessing the performance of optimal policy, which eliminates the necessity of real deployment in a game. We then show some use-cases of the proposed optimization method and provide interpretable suggestions for the soccer coaches and practitioners regarding the optimal behavior on the pitch.
Evaluation method
In the RL domain, evaluating a policy (decision) concisely means summing the rewards yielded by the selected actions (ball destination) given policy
With this proposed evaluation technique, we proceed with evaluating the derived policies in terms of deciding the ball destination. The result of evaluation on the 2020-2021 season of the Belgian Pro League show that on average, a possession in this league will lead to a goal against with 1% chance following the behavioral policy. However, if the teams follow the optimal policy, this number increases to 0.015, meaning that on average, a possession in this league will lead to a goal with 1.5% chance.
To quantify the effect of changing the policy, we use a metric called EPO difference that is interpreted as the increase in likelihood of a possession ending in a goal, if the team changed their behavioral policy to the optimal one. Considering an average of 100 possessions for each team per game, the improvement in expected goal difference is calculated as:
Momentary decision making
In order to demonstrate a momentary situation in a game, we analyze an unsuccessful possession in the game between Cercle Brugge and Union SG in the 2021-22 season of the Belgian Pro League, which Union SG won with 0-3. Newly promoted Union SG has performed extremely well in the first half of the 2021-2022 season.
Figure 7 shows the sequence of frames for the 24:13–24:23 time window that did not result in a goal for Cercle Brugge. The figure shows the behavioral selection surfaces, reward surfaces, and EPO curve. The Cercle Brugge players are shown as green circles. In the first frame, Daland possesses the ball (T1:14s) and dribbles. Between seconds 15 and 16, the optimal policy suggests passing the ball to his teammate Kanoute (i.e. the direction of the green arrow in the left surface). However, Daland decides to continue dribbling until (T:19s). The EPO curve shows that the EPO would have increased if Daland had followed the optimal policy. In the remainder of the possession, Daland passes the ball to Hotic (T:19s), which is an optimal action and both EPO curves are improving. Later, Hotic continues dribbling until he performs an unsuccessful attempt (T:23s) (i.e. the direction of the red arrow in the right surface) that results in a significant decline of the EPO curve to
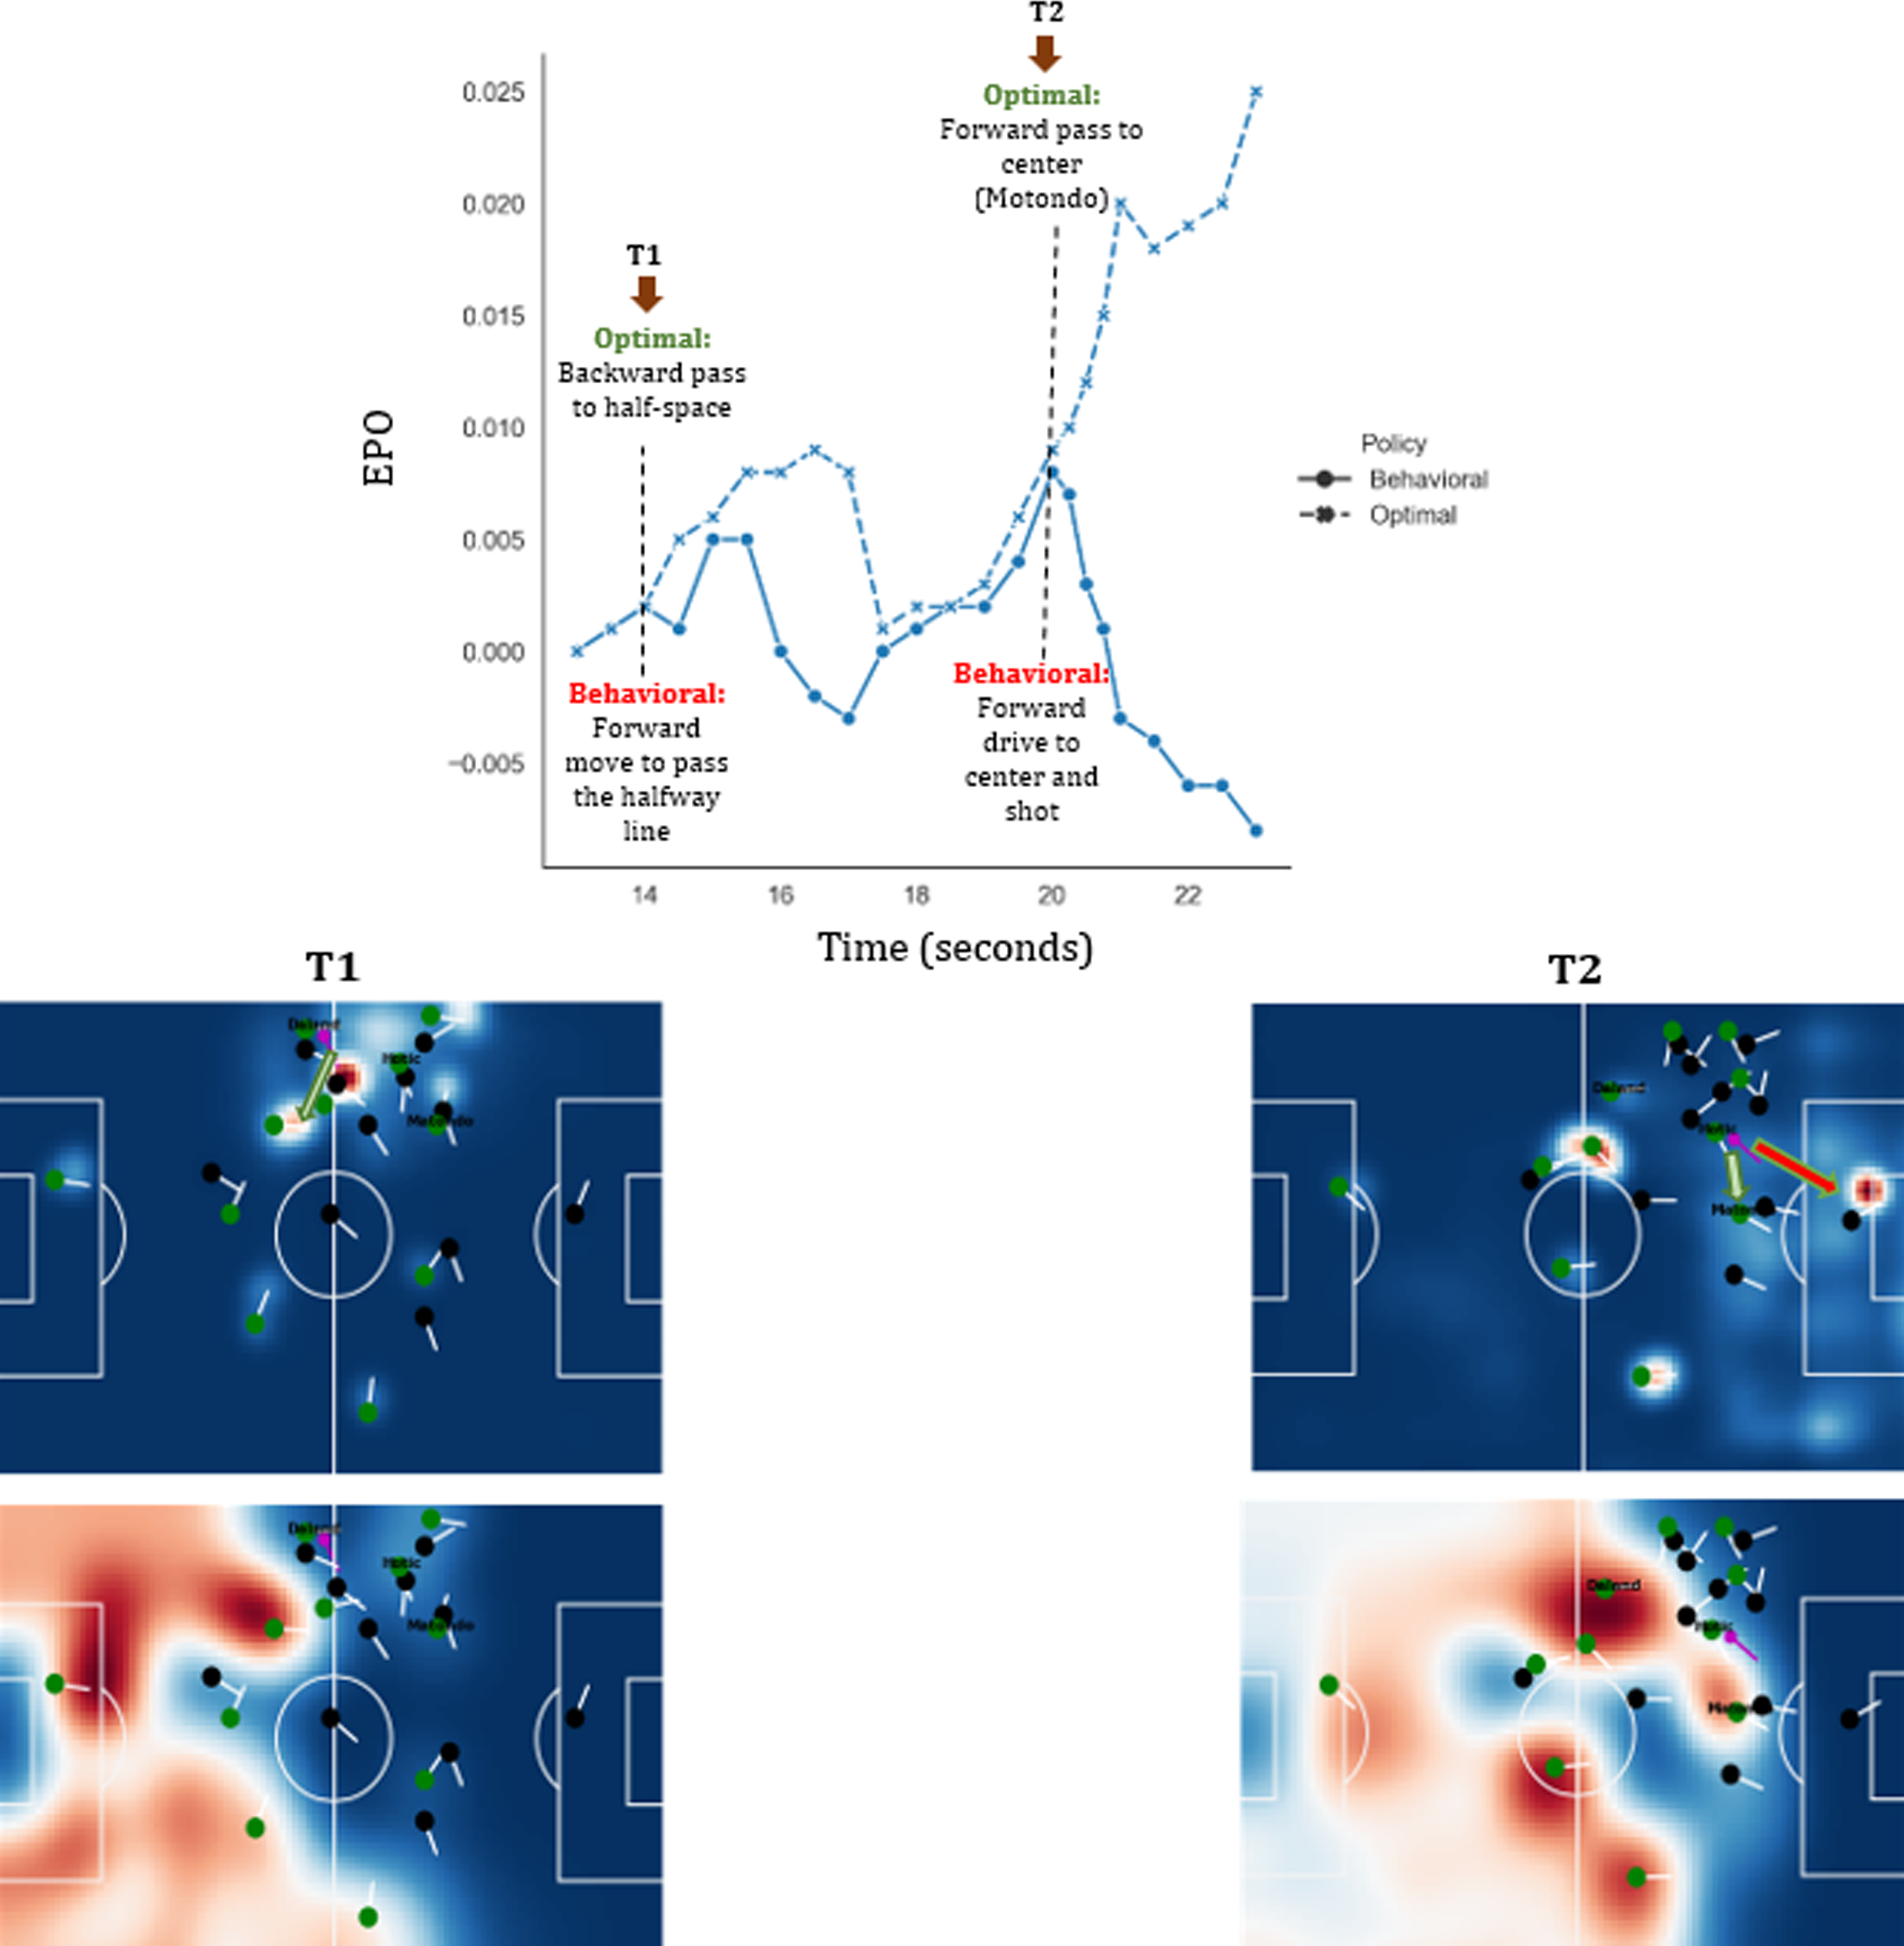
A Cercle Brugge possession evaluation in a game against Union Saint-Gilloise in the 2021-22 season of the Belgian Pro League. The top pitch visualizations show the selection probability surfaces according to the actual behavior. The green circles indicate the Cercle Brugge players, the green and red arrows indicate the optimal and actual ball movement, respectively. The pitch visualizations at the bottom show the reward for moving the ball to each pitch location.
League-wide results
Figure 8 illustrates the pass and shot statistics in different phases of ball possession (i.e. build-up play, established possession, attack) for 18 teams of Belgian Pro League 2020-21. Our proposed method first analyzes the behavioral propensities of the teams to choose any of the short pass, long ball, or shot, with regards to the respective possession phase, then drives the optimal propensities. The results show that in a league-wide model, teams could increase their Expected Possession Outcome (EPO) by 0.025, meaning that they could increase the likelihood of possessions ending in a goal by 0.025, if they had been obeyed the optimal policy by modifying the propensities as follows (the numbers show relative change):
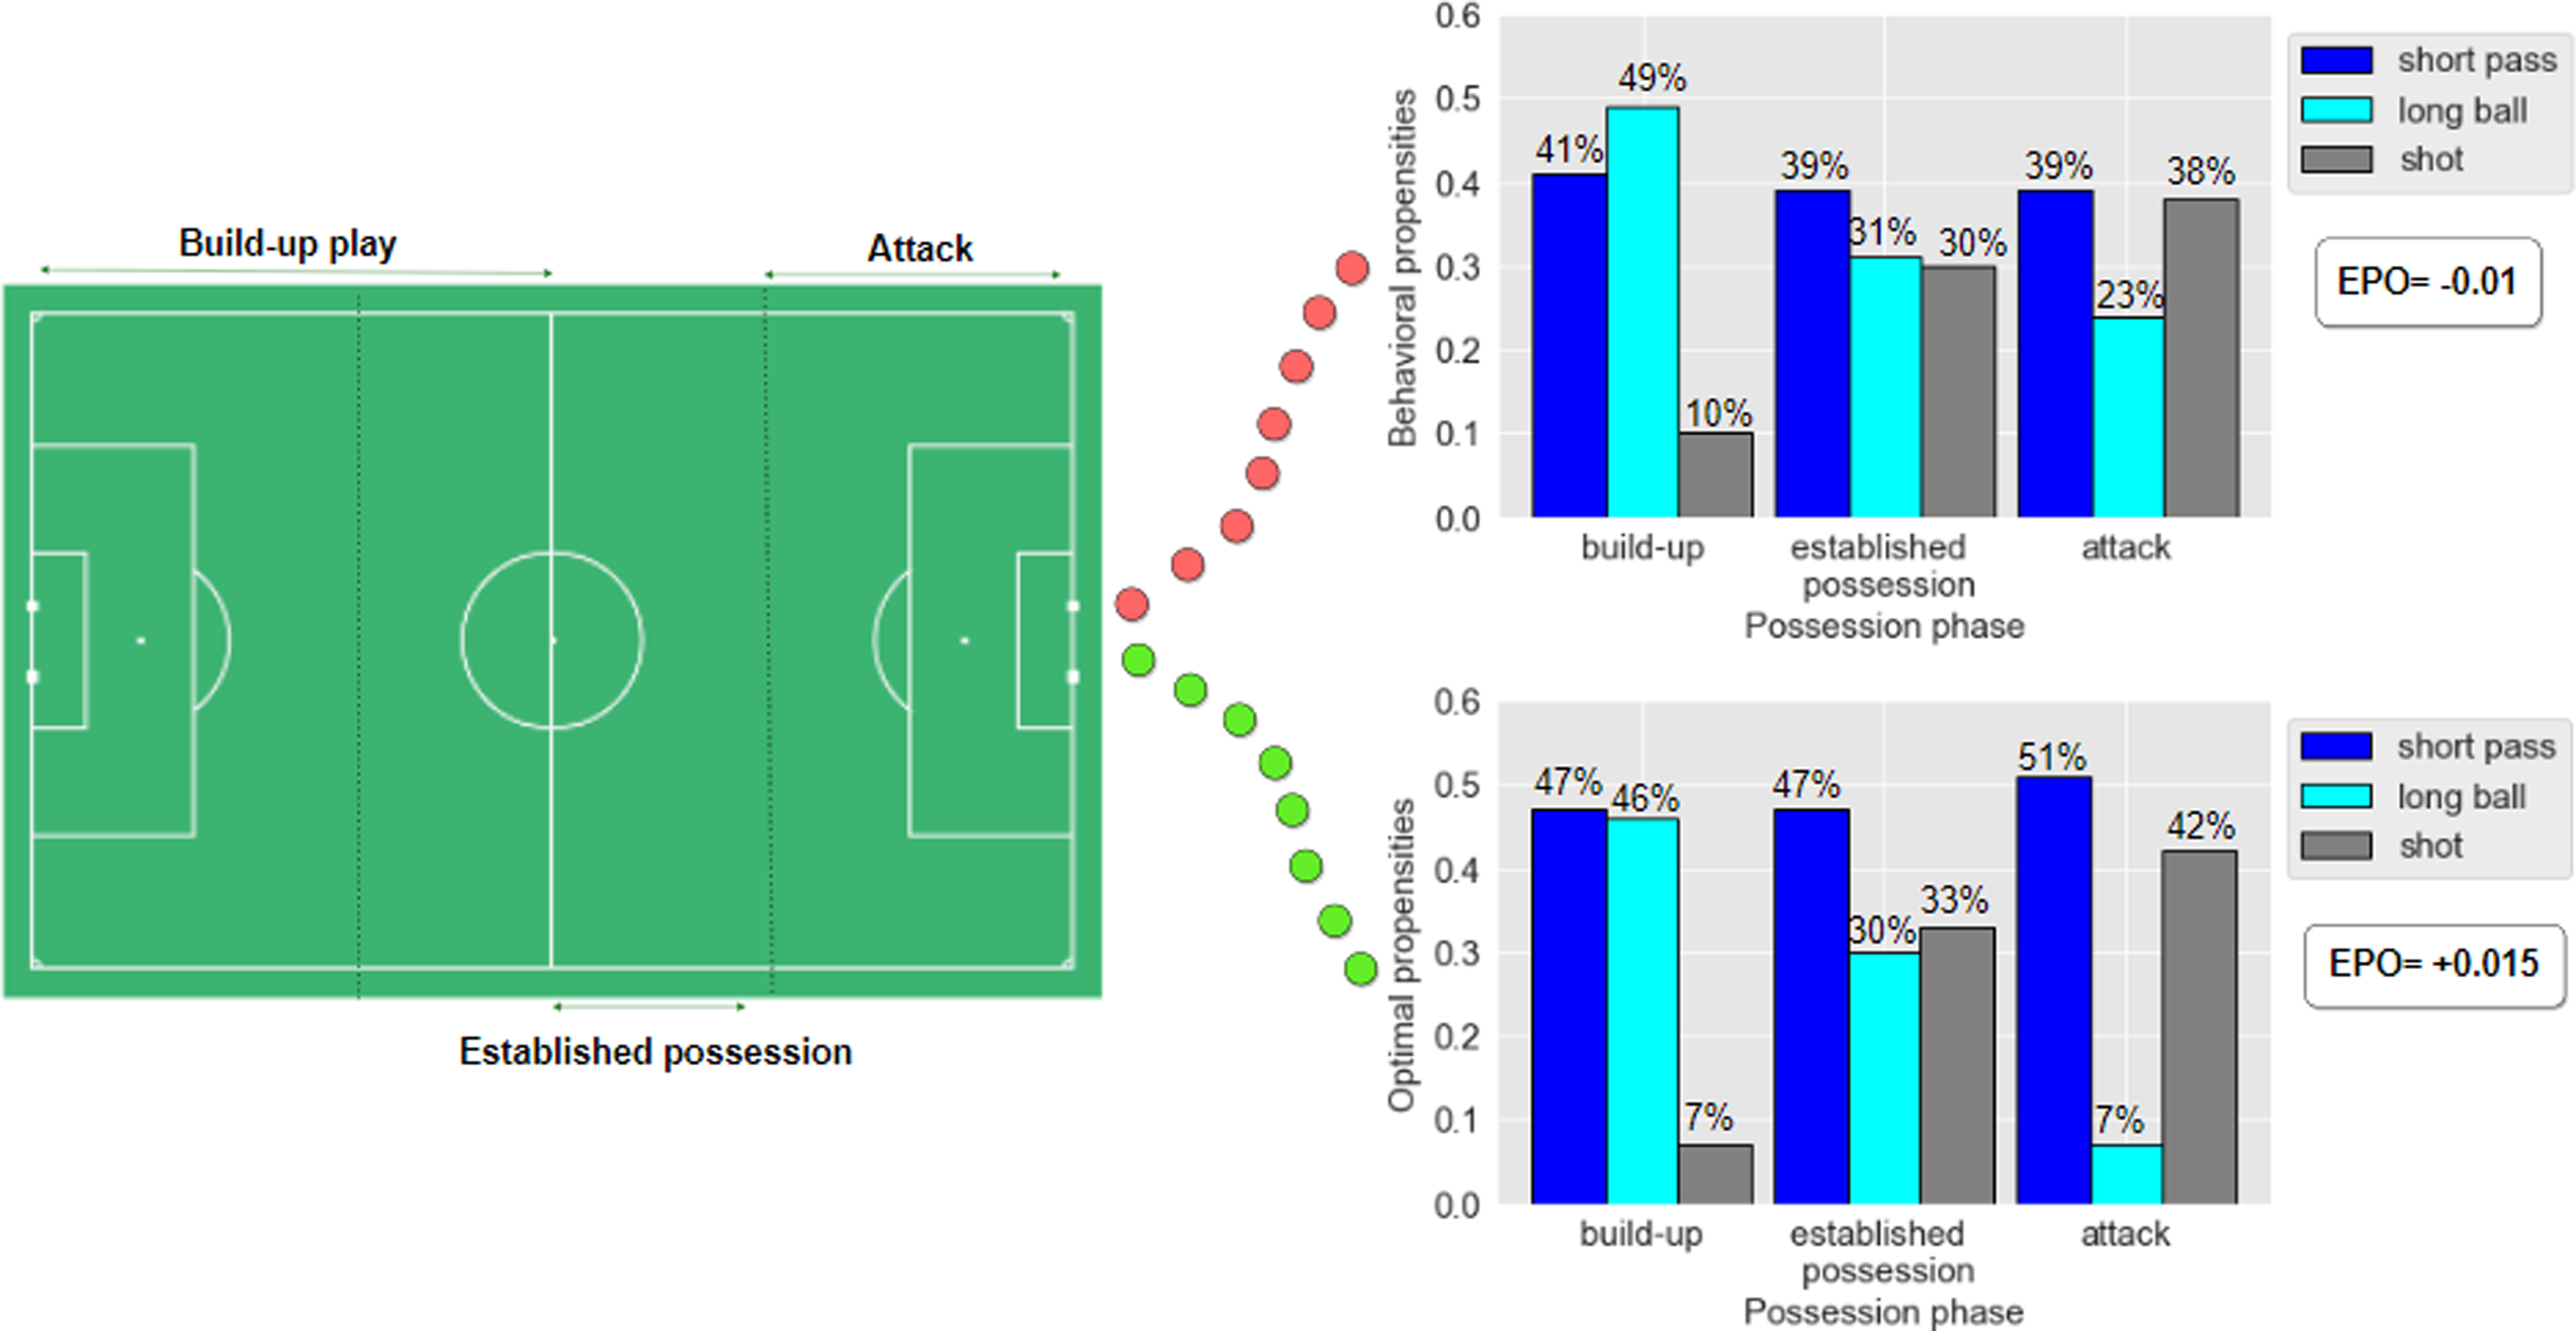
League-wide analysis in the Belgian Pro League 2020-21 season in terms of team propensities to perform short pass, long ball, or shot in three phases of the possession (i.e. Build-up play, Established possession, and Attack). Our optimization model proposes specific modifications to the propensities and ensures a 0.025 increase in the Expected Possession Outcome (EPO) for this league.
In build-up phase: 14% increase in short passes, 6% decrease in long balls, 30% decrease in shots. In established possession phase: 20% increase in short passes, 3% decrease in long balls, 10% increase in shots. In attack phase: 31% increase in short passes, 70% decrease in long balls, 10% increase in shots.
Overall, the optimization model proposes more short passes (Tiki-Taka playing style) in all phases, and higher low distance shots (i.e. shots in attack phase).
In this work, we assume that the rules of soccer are incentive compatible (i.e. there are always incentives to win in general).24,25 However, there are some cases in which a team can be entirely satisfied with playing a draw, especially if it plays away against a strong team. We claim that a robust RL method must be able to consider all contexts of the matches and learn the real and final incentives of the teams from the provided short-term rewards. Therefore, we experiment with eliminating all events where the teams have an equal score. The new results of optimal policy reveal 2% increase of long balls in build-up play phase, and 1% increase in shots in established possession phase, in comparison to the propensities of the optimal policy prior to eliminating the events at equal score. As we find these differences negligible, we claim that RL has learned the long-term incentives of the teams and the league-wide suggestion of optimal policy towards Tiki-Taka playing style and higher low distance shots is valid.
Team-specific results
In order to provide an interpretable summary of the results to the soccer players and coaches, our framework could be adjusted to analyze the team-specific propensities to perform any of the action types, when they are placed in any of the phases of possessions. Moreover, we provide EPO-difference meaning that how much they could add to their likelihood of goal scoring in a possession if they follow the proposal of optimal policy. For each team, we obtain the mean EPO over all possessions in the 2021-22 season when following their behavioral policy and when following the optimal policy. Table 2 presents the calculated differences. The teams are sorted according to the league table at the end of season 2021-22. For instance, the mean EPO over all possessions of Club Brugge in the 2021-22 season is calculated as 0.0046, meaning 0.46 goals per game. We used the off-policy evaluation method (i.e. importance sampling) to evaluate the EPO of their possessions if they had followed our derived optimal policy. The results show that Club Brugge could have increased their likelihood of ending possessions in a goal by 0.016, by following our proposed optimization. Another observation from Table 2 is that the optimal policy yields a smaller improvement in EPO difference for the teams at the top of the table, and a larger improvement for the teams at the bottom of the table. That is because a team like Union SG or Club Brugge at top of the table are quite often selecting the optimal actions (their behavioral policy is nearly the same as their optimal policy), whereas the behavioral policy of the teams at the bottom of the table is far from their respective optimal policy. The newly promoted Union SG had extremely good performance in their offensive strategy with their actions very close to optimal policy. Our method could correctly capture this improvement and detected very small EPO difference for this team. Eupen also showed a good performance in their offensive strategy, but unfortunately this is paired with poor defense and declining their position in the league table.
The effect of changing the policy on the team-level from the actual to the optimal policy. Teams are sorted according to their final ranking.
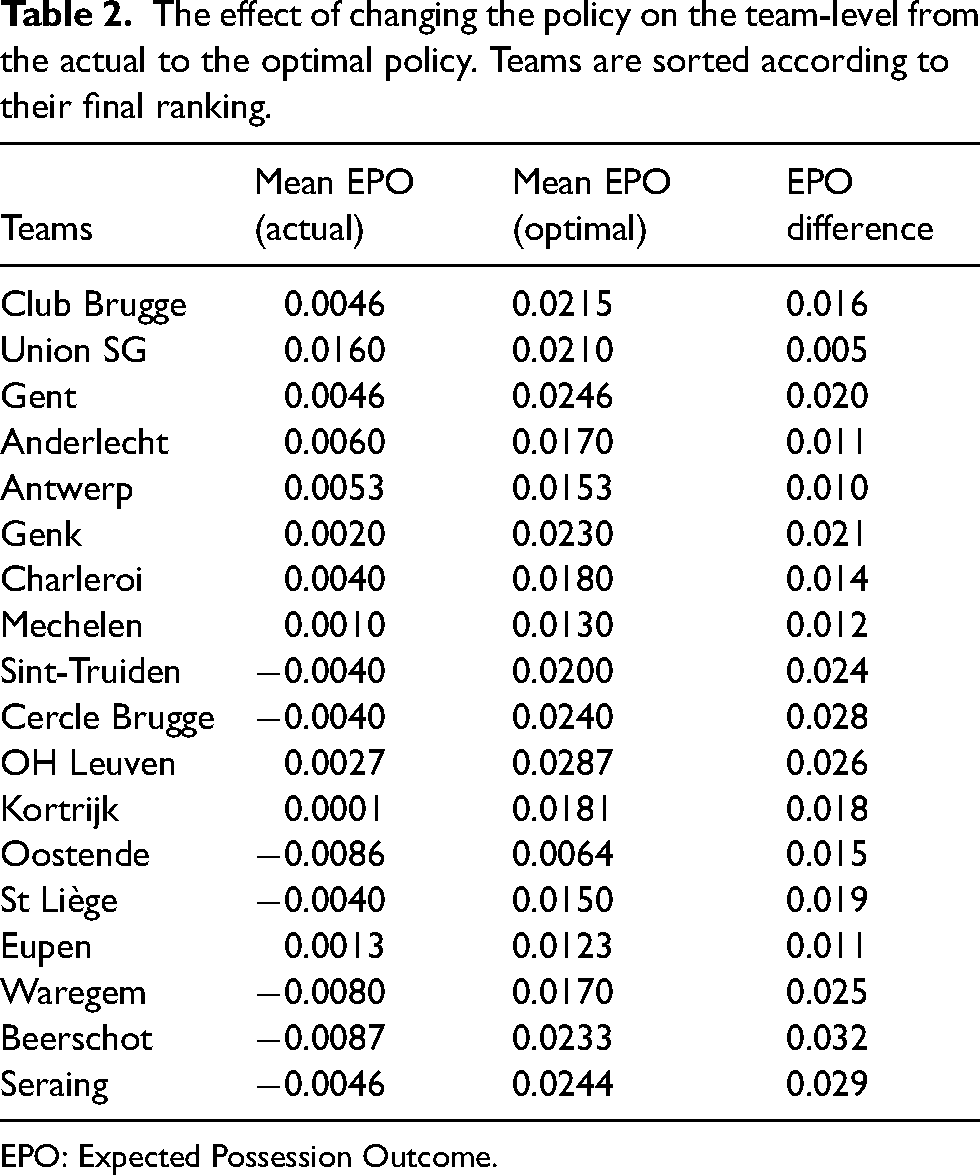
EPO: Expected Possession Outcome.
Furthermore, our framework allows to analyze the propensities of playing short passes, playing long balls and shooting in each of the different possession phases. To do so, we use an action space consisting of three actions, namely “short pass,” “long ball” (i.e. ball move over than 32 m in length) and “shot,” and the possession phases defined in previous section (i.e. build-up, established possession, attack). Figure 9 illustrates such propensities and EPO-diff numbers for four teams in the Belgian Pro League. The highlights are as follows:
Club Brugge: this team propensities of short passes in different phases look quite optimal. They could perform 1.27 more shots in long distance (e.g. build-up phase), and 0.92 less long balls in short distance (e.g. attack phase). Oostende: 7.66 more shots in long distance (e.g. build-up phase). In short distance (e.g. attack phase) they could perform less shots, and more short passes and long balls. OH Leuven: this team shot propensities in short distance look quite optimal. They could perform 1.5 more short passes in build-up phase, and 6.11 more short passes in established possession phase. Zulte Waregem: this team long ball propensities in all phases look quite optimal. They could perform 0.7 more short passes in build-up, and 0.2 more shots in attack phase.
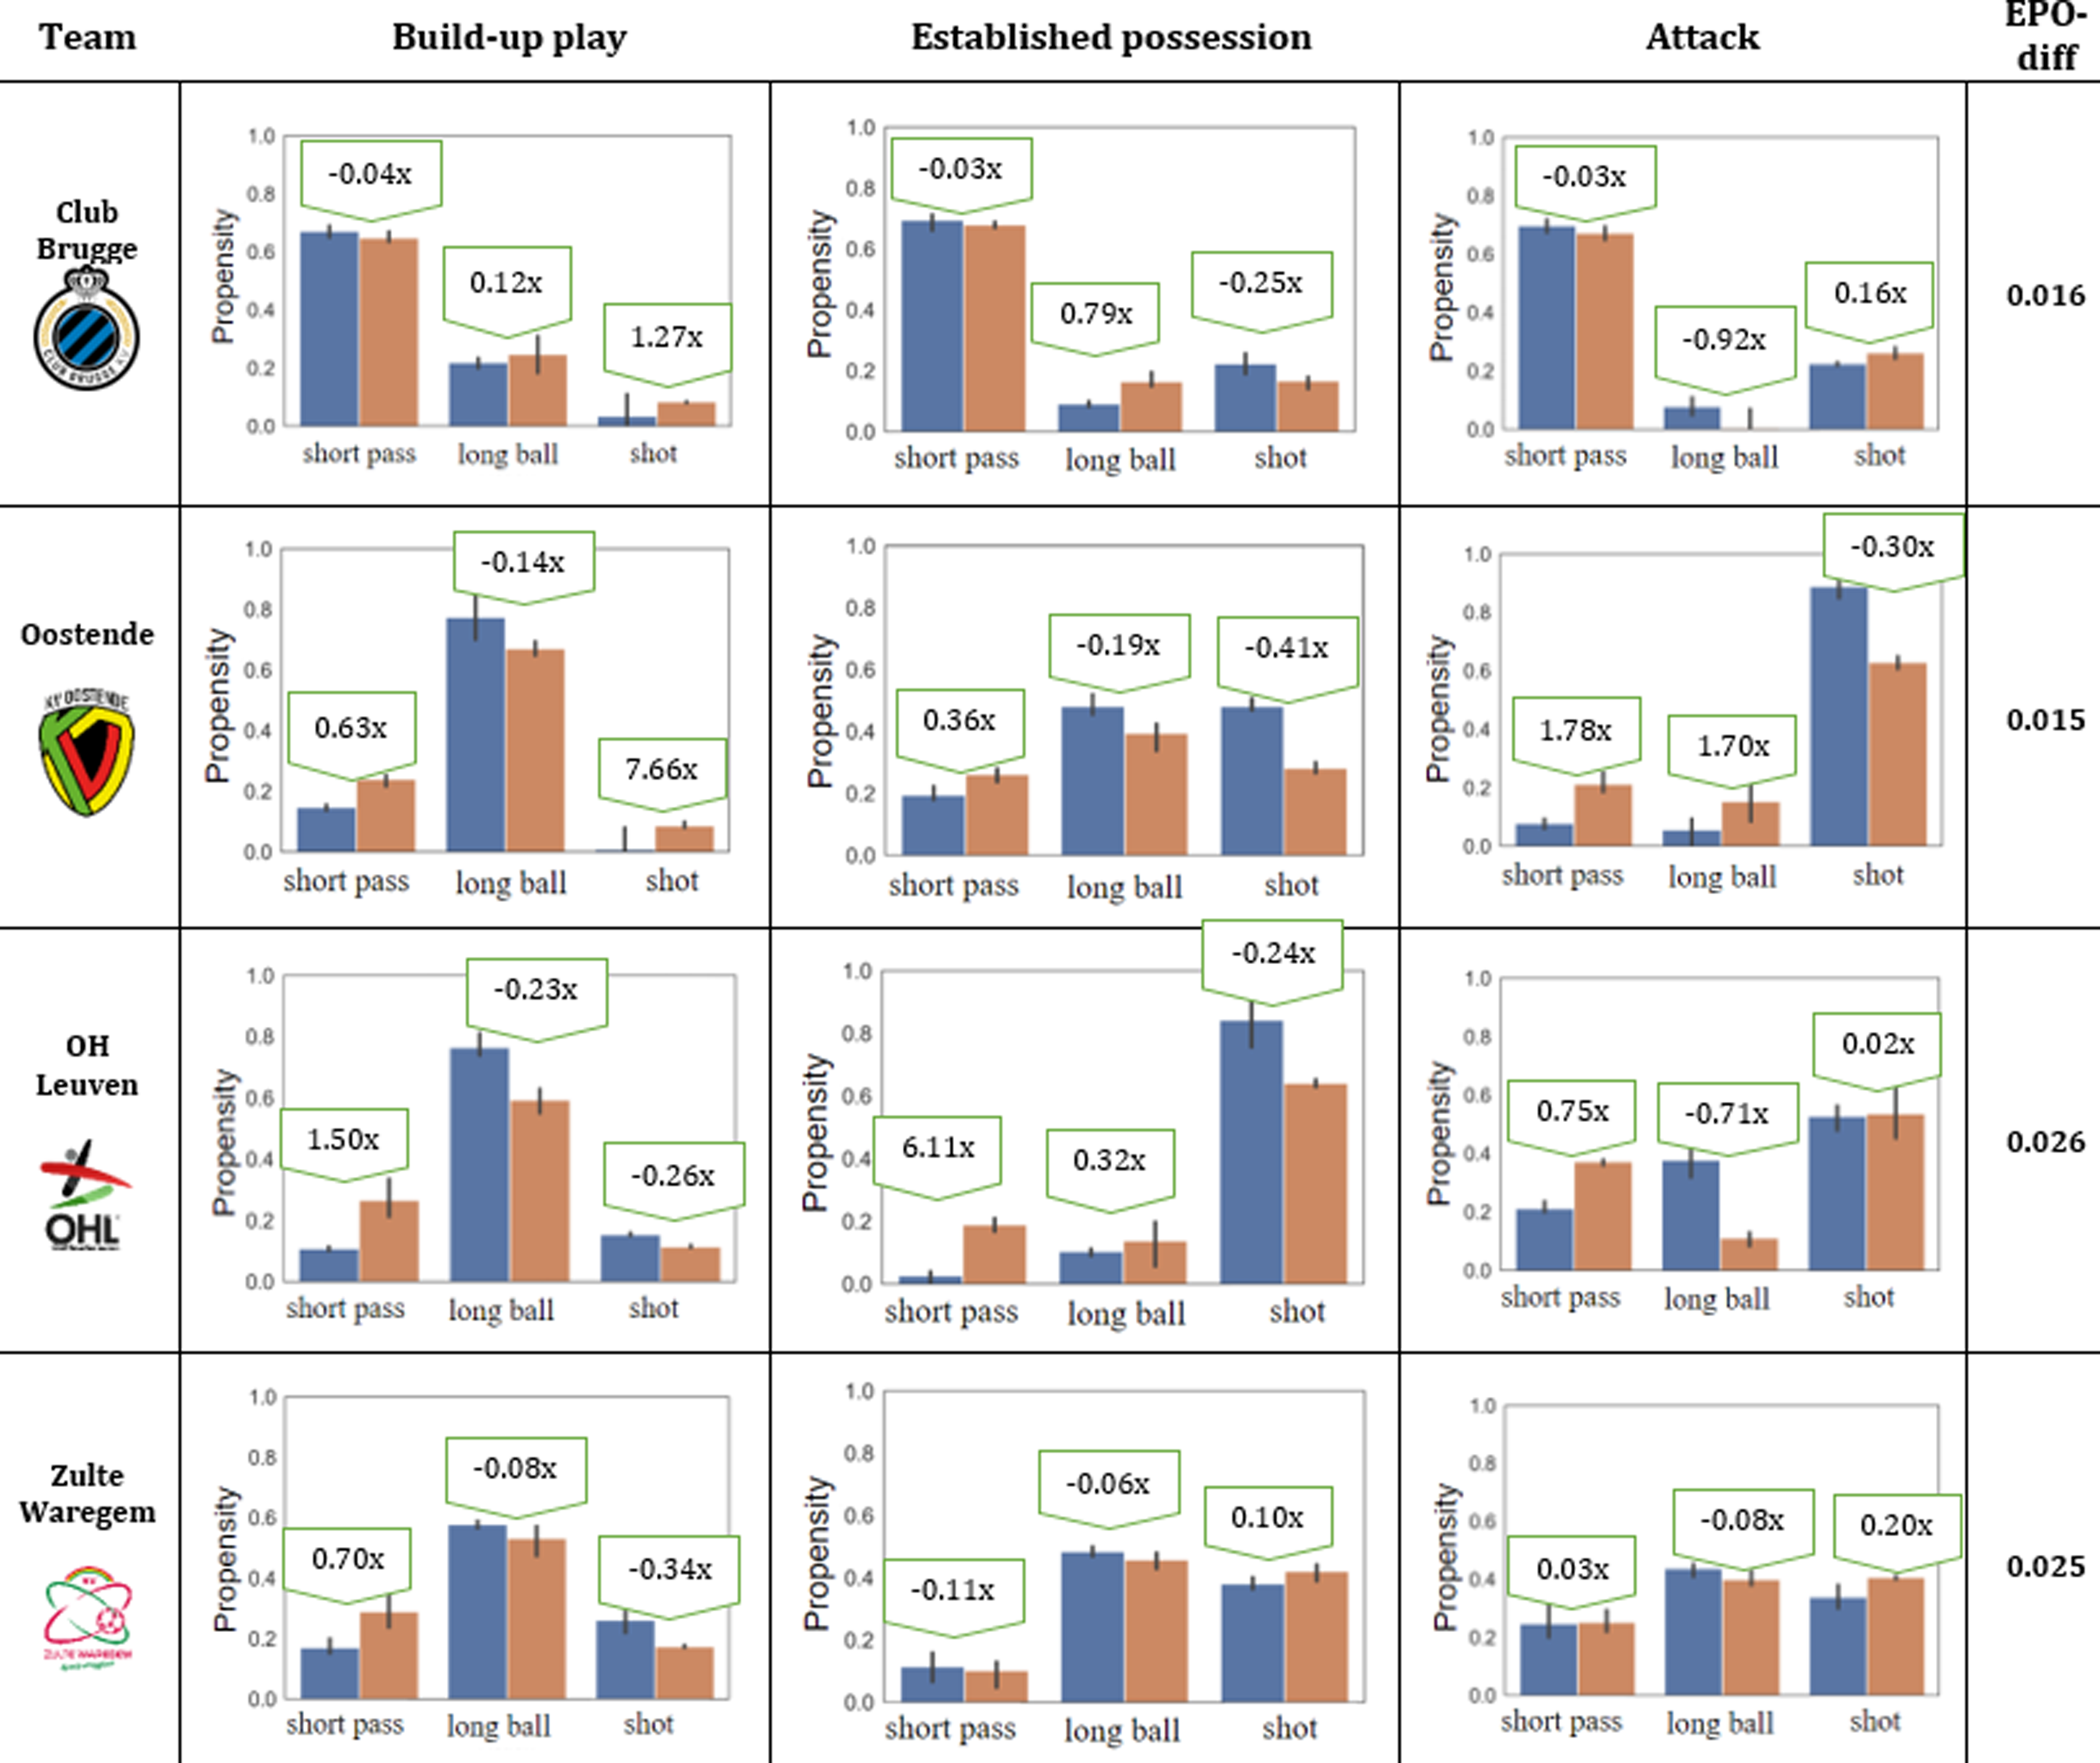
Team-specific propensities in selecting any action type given different phases of possession. The blue bars show the teams’ actual (behavioral) propensities and the red bars show the optimal ones.
Conclusion
We propose an end-to-end deep reinforcement learning framework that derives optimal decisions solely from the teams’ actual behaviors. To do so, we first analyze the current strategy of the teams in terms of their propensities to select the destination location of the ball using deep learning, and then discover the optimal tactics based on all players’ locations on the pitch. Furthermore, our optimization framework continuously highlights the optimal space on the pitch for the ball to be moved to, which has the maximum potential contribution to the team winning in the long-term, even if a particular on-ball action does not directly contribute to a goal. We directly derive the optimal policy for teams in terms of moving the ball instead of evaluating the effect of alternative policies and counterfactual reasoning such as: What would have happened if another ball destination had been selected? In addition to continuously highlighting the optimal ball destination, we compare the team-specific behavior in terms of selecting each of the discrete actions (i.e. short pass, long ball, shot) with the optimal ones. Concretely, in the league-wide model, we show that teams would improve their expected goal difference by
Footnotes
Declaration of conflicting interests
The author(s) declared no potential conflicts of interest with respect to the research, authorship, and/or publication of this article.
Funding
The author(s) disclosed receipt of the following financial support for the research, authorship, and/or publication of this article: Projects no. 128233 and no. 135074 have been implemented with the support provided by the Ministry of Innovation and Technology of Hungary from the National Research, Development and Innovation Fund, financed under the FK