
Abstract
Rugby Union is team-based collision sport with increasing global popularity, particularly in the women's game. Despite this, there is currently no evidence demonstrating the frequency of match events outside of the international game. Therefore, the aim of this study is to outline the frequency and distribution of match events in non-international female rugby union to both outline the demands placed on players and to assess the patterns of play for future injury prevention strategies. Forty-eight games from three seasons of varsity rugby were coded and rates of events per match were calculated. Average ball in play percentage was 51%. The tackle was the most frequent contact match event [280.0 (95% CIs: 270.2-289.7)] while passes were the most frequent non-contact match events [323.2 (95% CIs: 311.8-334.5)]. The distribution of events across match quarter was largely consistent and neither the fixture type, nor the season was consistently associated with differences in match event count per game. This study provides the first analysis of match events outside of international game and provides a useful reference for coaches in preparation of players as well as comparable data for the women's game when informing decision making on injury prevention.
Introduction
Rugby Union (hereafter “Rugby”) is a team-based collision sport with over 9.6 million players globally 1 . Of these players, 2.7 million are women, with an increase in participation numbers of 28% since 2017 1 . While the popularity of the game has grown significantly in recent years, there is a dearth of literature specific to the women's game. One source of literature surrounding the women's game is that of the World Rugby Game Analysis reports, which provide detailed summaries of match events in the context of the international women's game 2 . Despite these useful resources giving an account of the international end of the game, there is no available evidence exploring match events at the non-international levels of the women's game making the generalisability of such reports challenging when preparing athletes for the demands of the sport at lower levels of play.
In previous studies that have focused on the use of video analysis in rugby related research, den Hollander et al. 3 identified two types of studies which are common in the literature, those which focus on the “what” (which identify the frequency of key match events) and those which focus on the “how” (which describe key events, such as how tackle technique might change the risk of injury). Given the variety of skills, physical attributes and movements required of players to perform in the sport, these “what” studies provide key information to coaches to help design more precise training programs that mirror the movements required to play the sport. As a coach, knowing the frequency with which a player may be required to perform certain actions and how they are distributed provides the tools to be able to allocate practice time proportionally based on the frequency and importance of the event. In women's rugby, outside of the international level, there is no published work to provide this information to coaches.
In the men's game, previous work has outlined not only the “what” studies but also more recent studies using video analysis strategies have focused on the “how” to inform injury risk mitigation policy and interventions 4,5. While these studies provide important information regarding key match events such as the tackle, it is unclear whether match events occur with the same frequency in the context non-international women's rugby. Nevertheless, it is known that the rates of injury in women's rugby are different to those of men's rugby, with women's rates of 35/1000 match-hours [professional women 6 ] and 36/1000 player hours [women's amateur rugby 7 ] compared with 87/1000 match-hours [professional men's rugby 8 ] and 49.1/1000 player hours [amateur men's rugby 7 ]. Although reported rates of injury in the women's game may be lower, the severity of injury has been shown to be significantly higher than the men's game, with each lasting an average of 57 days [median: 26 days 6 ] compared to an average of 25 days [median: 9 days 8 ] in the men's game. The majority of injuries are sustained in contact events, with the tackle being the match event leading to the most injuries [36% to 58% in women's rugby 6,7 and 43% to 58% in men's rugby 7,8]. Given the number and distribution of match events is not known in non-international women's rugby union, it is important to understand whether differences exist for both physical preparation strategies as well as targeting successful injury risk mitigation policies (which are currently directed largely at these contact events). For example, by better understanding the frequency of tackles and, in future studies, differences in technique between the men's and women's players, training programs can be used to target tackle technique which has previously been shown to be linked with injury risk 9 . Therefore, the aim of this study is to describe match events in varsity women's rugby union (Canada West Universities Athletic Association) to outline the demands placed on the players and determine whether the pattern of play is similar to that in the men's game. Understanding the match demands of female rugby may help better inform and optimise injury risk mitigation and performance strategies in the female game.
Methods
Participants
This retrospective video analysis study was conducted within a women's varsity rugby union setting in Canada. Matches from three seasons (2017, 2018 and 2019) of the CanWest league were captured for standard match review and analysis by the teams involved in the study. Videos were obtained with the permission of the University of Calgary Athletic Director as well as the Director of the League. All matches (n=49) from the five participating teams were included in the analysis. Players typically range from 18-25, however there may be some exceptions. Ethical approval for the study was obtained from the Conjoint Health Research Ethics Board at the University of Calgary (Ref: REB20-1443).
Procedures
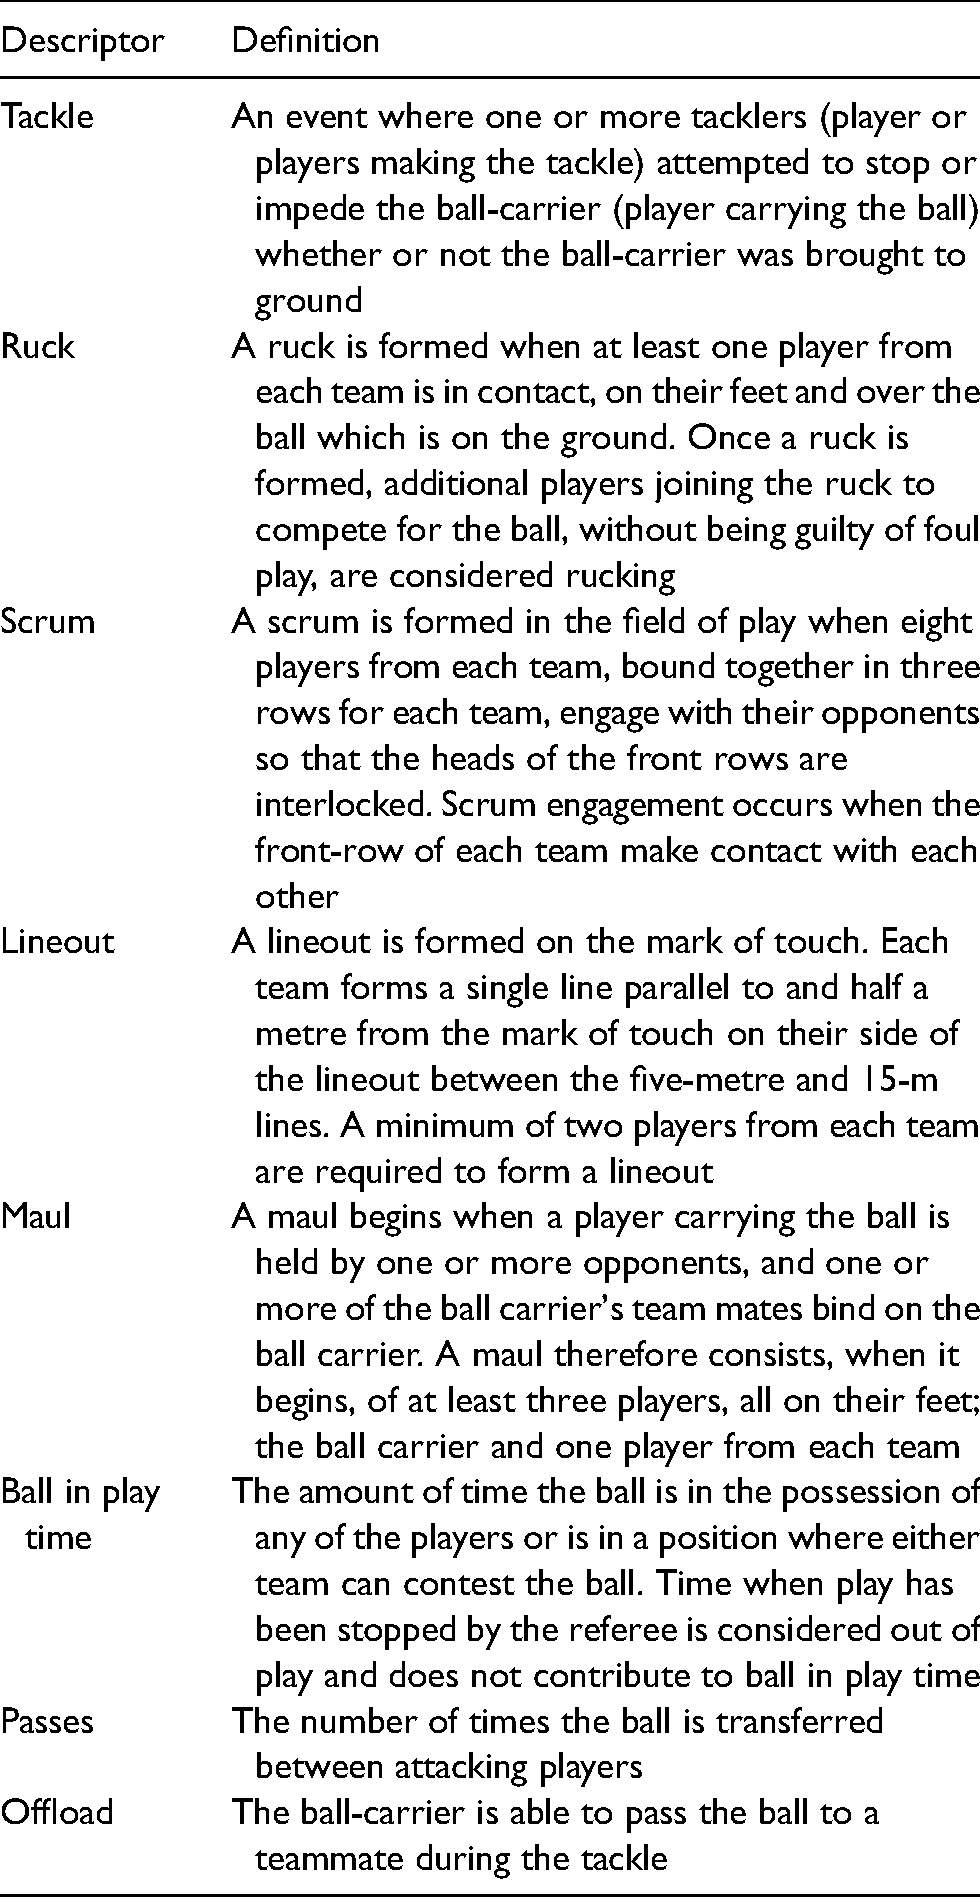
All matches were coded using Nacsport Scout Plus software (Scout Plus V 6.5.0, New Assistant for Coach Sport, S.L). A previously developed coding window was used to capture all match events, including kicks (including kick off/ restarts), scrums, lineouts, infringements, penalties, tackles, rucks, mauls, passes, carries and ball in play time. This coding window was produced in line with the recommendations and definitions outlined in the consensus statement for video analysis in rugby union (Table 1 10 ). During an analysis of a match, the coder had the ability to pause and rewind the video to watch events more than once; it was also possible to use a slow-motion feature to allow for a clearer view of fast dynamic events.
Definitions used for the purposes of video analysis. Adapted from the video analysis framework of descriptors and definitions in Rugby Union consensus statement 10 .
Reliability
Prior to commencing the coding of games, one game was randomly selected from the three seasons and coded by an expert coder. Subsequently, all six video coders were required to complete the same game as the expert coder to assess inter-rater reliability using the kappa statistic. A kappa statistic of >0.80 (“Almost Perfect” 11 ) was chosen as an acceptable level of agreement for each event. Kappa values ranged from 0.88 to 0.96 for all match events and 0.85 to 0.95 for contact events specifically (scrums, tackles, rucks mauls). One month after the initial coding of the game, each coder recoded half the fixture to assess intra-rater reliability. Kappa values of between 0.90 and 0.96 were recorded for all events and 0.92 to 0.98 for contact events only, again indicating almost perfect intra-rater reliability for the six coders. Game events were coded as counts of events, with some events being described further with the use of descriptors (e.g., scrum event was described with the following details: won, lost, collapsed, reset). Further to this, some events were recorded using a timed button to capture the length of the event which required the coder to manually code the beginning and end of an event (e.g., ball in play was captured using this feature).
Statistical Analysis
Following the completion of match coding, all data were checked for outliers to identify transcription errors. Descriptive statistics (mean and 95% confidence intervals) were used to outline the number of events per match, per quarter and per half over the three seasons. To calculate the rates of each event occurring per game, Poisson incidence rates and corresponding 95% confidence intervals were calculated and were further analysed stratified by season (2017, 2018, 2019) as well as fixture type (regular, playoff). Given the number of comparisons which could be made (between game quarters, game halves, seasons and fixture types), the data were first analysed descriptively, with differences in categories being considered meaningful if there was no overlapping of confidence intervals between one group (e.g. 2017 rate) and either of the other groups (i.e. 2018 or 2019). Any comparison (between game quarters, game halves, seasons, and fixture types) which demonstrated no overlap in confidence intervals between any two groups were subsequently assessed using rate ratios and corresponding confidence intervals. Any comparison which demonstrated no overlap in confidence intervals as well as a rate ratio which did not span a value of 1.0 was considered significant. All analysis was undertaken in STATA (StataCorp, 2019, Stata Statistical Software: Release 16. College Station, TX: StataCorp LLC).
Results
Forty-eight games were included in the final data analysis, with one game removed due to poor quality footage. Two games of the included 48 were missing one and 5 min of footage respectively, for which the average number of events within that same game period were imputed to account for the missing time. There were 13, 17 and 18 games for the 2017, 2018, 2019 seasons respectively, with 37 regular season fixtures and 11 playoff fixtures. In total, 62,015 match events were coded. To assess the demands on players, ball in play was calculated for all times the ball was actively in play. Matches were 80 min in length, however the mean ball in play percentage was 51.0% (95%CIs: 49.3-52.7) or 40 min, 48 s. Across all matches, the median single ball in play period was 31 s (Figure 1(a)), while the longest period of ball in play was 329 s (5 min, 29 s: Figure 1(b)). These periods of ball in play were interspersed with a median of 35 s rest (Figure 1(c)). The mean number of tries per game was seven (Table 2).
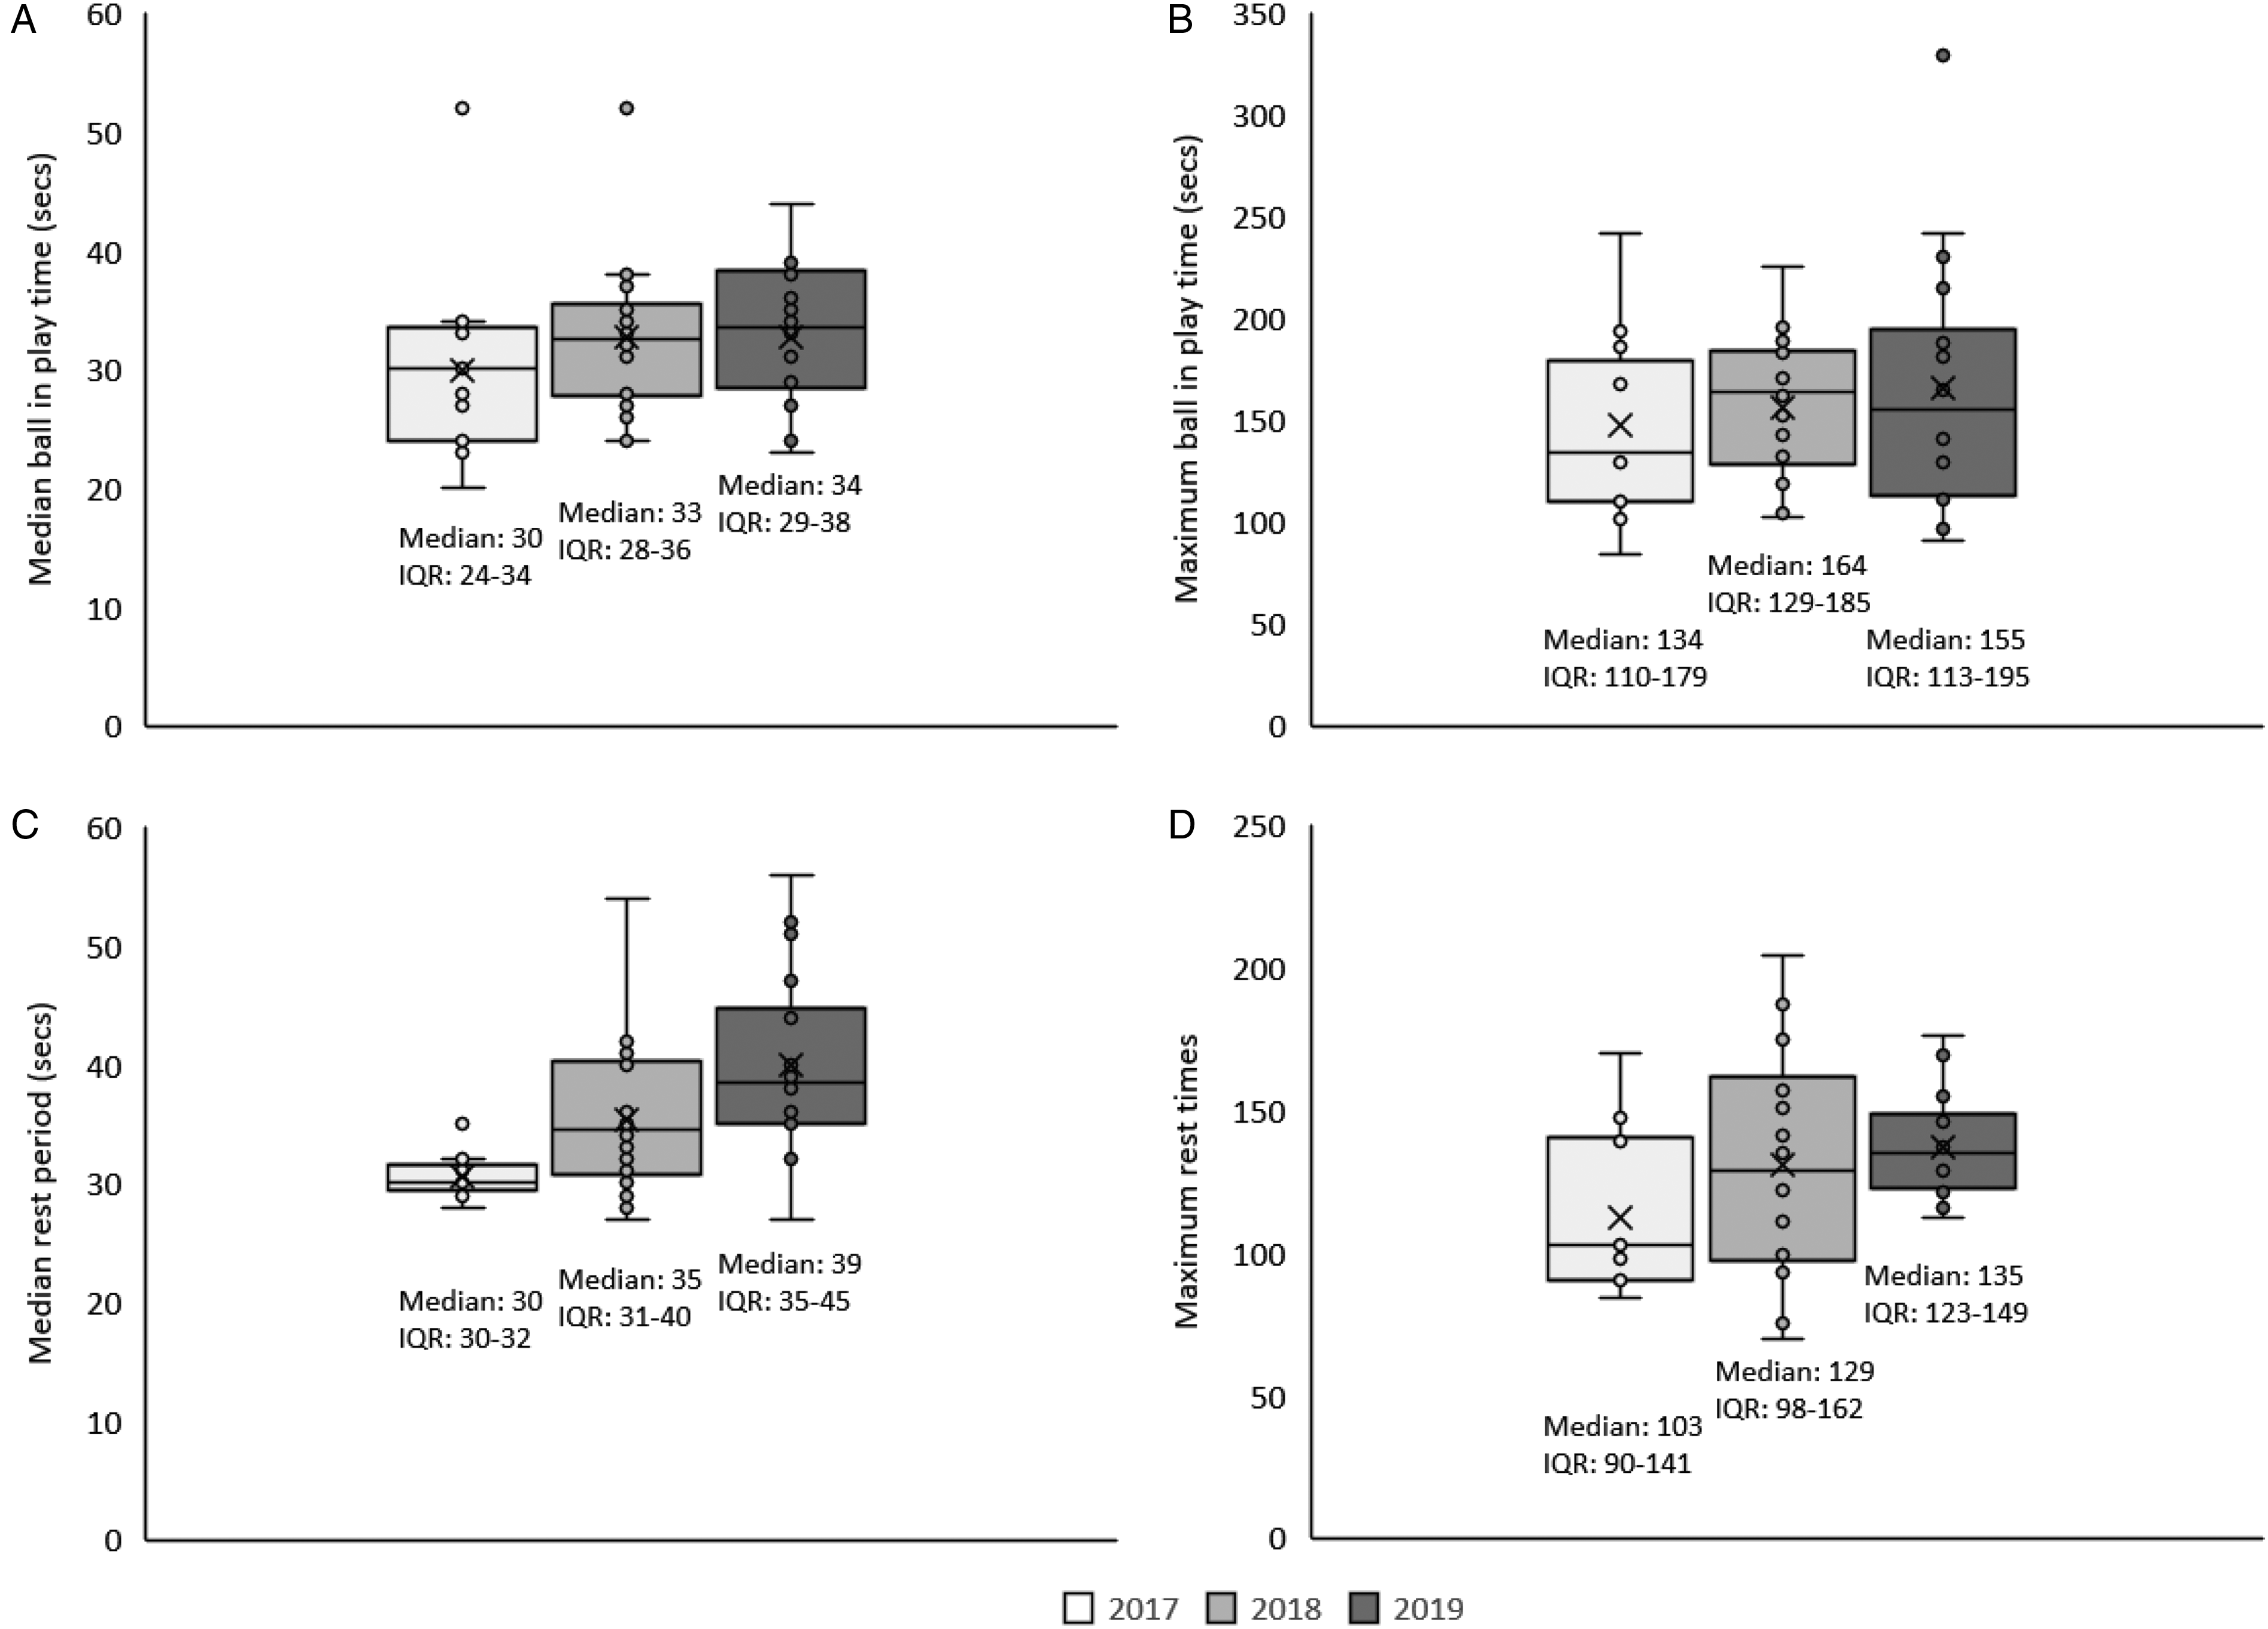
(a) Median ball in play time (b) Maximum ball in play time (c) Median rest period (d) Maximum rest period. Each data point represents one game. The box represents the 25th percentile (lower line), 75th percentile (upper line) and the median (middle line). The whiskers represent the minimum and maximum values excluding any outliers which are single points, away from the main data.
Descriptive summary of match events by quarter, half and total. Values are mean per match and 95% confidence intervals.
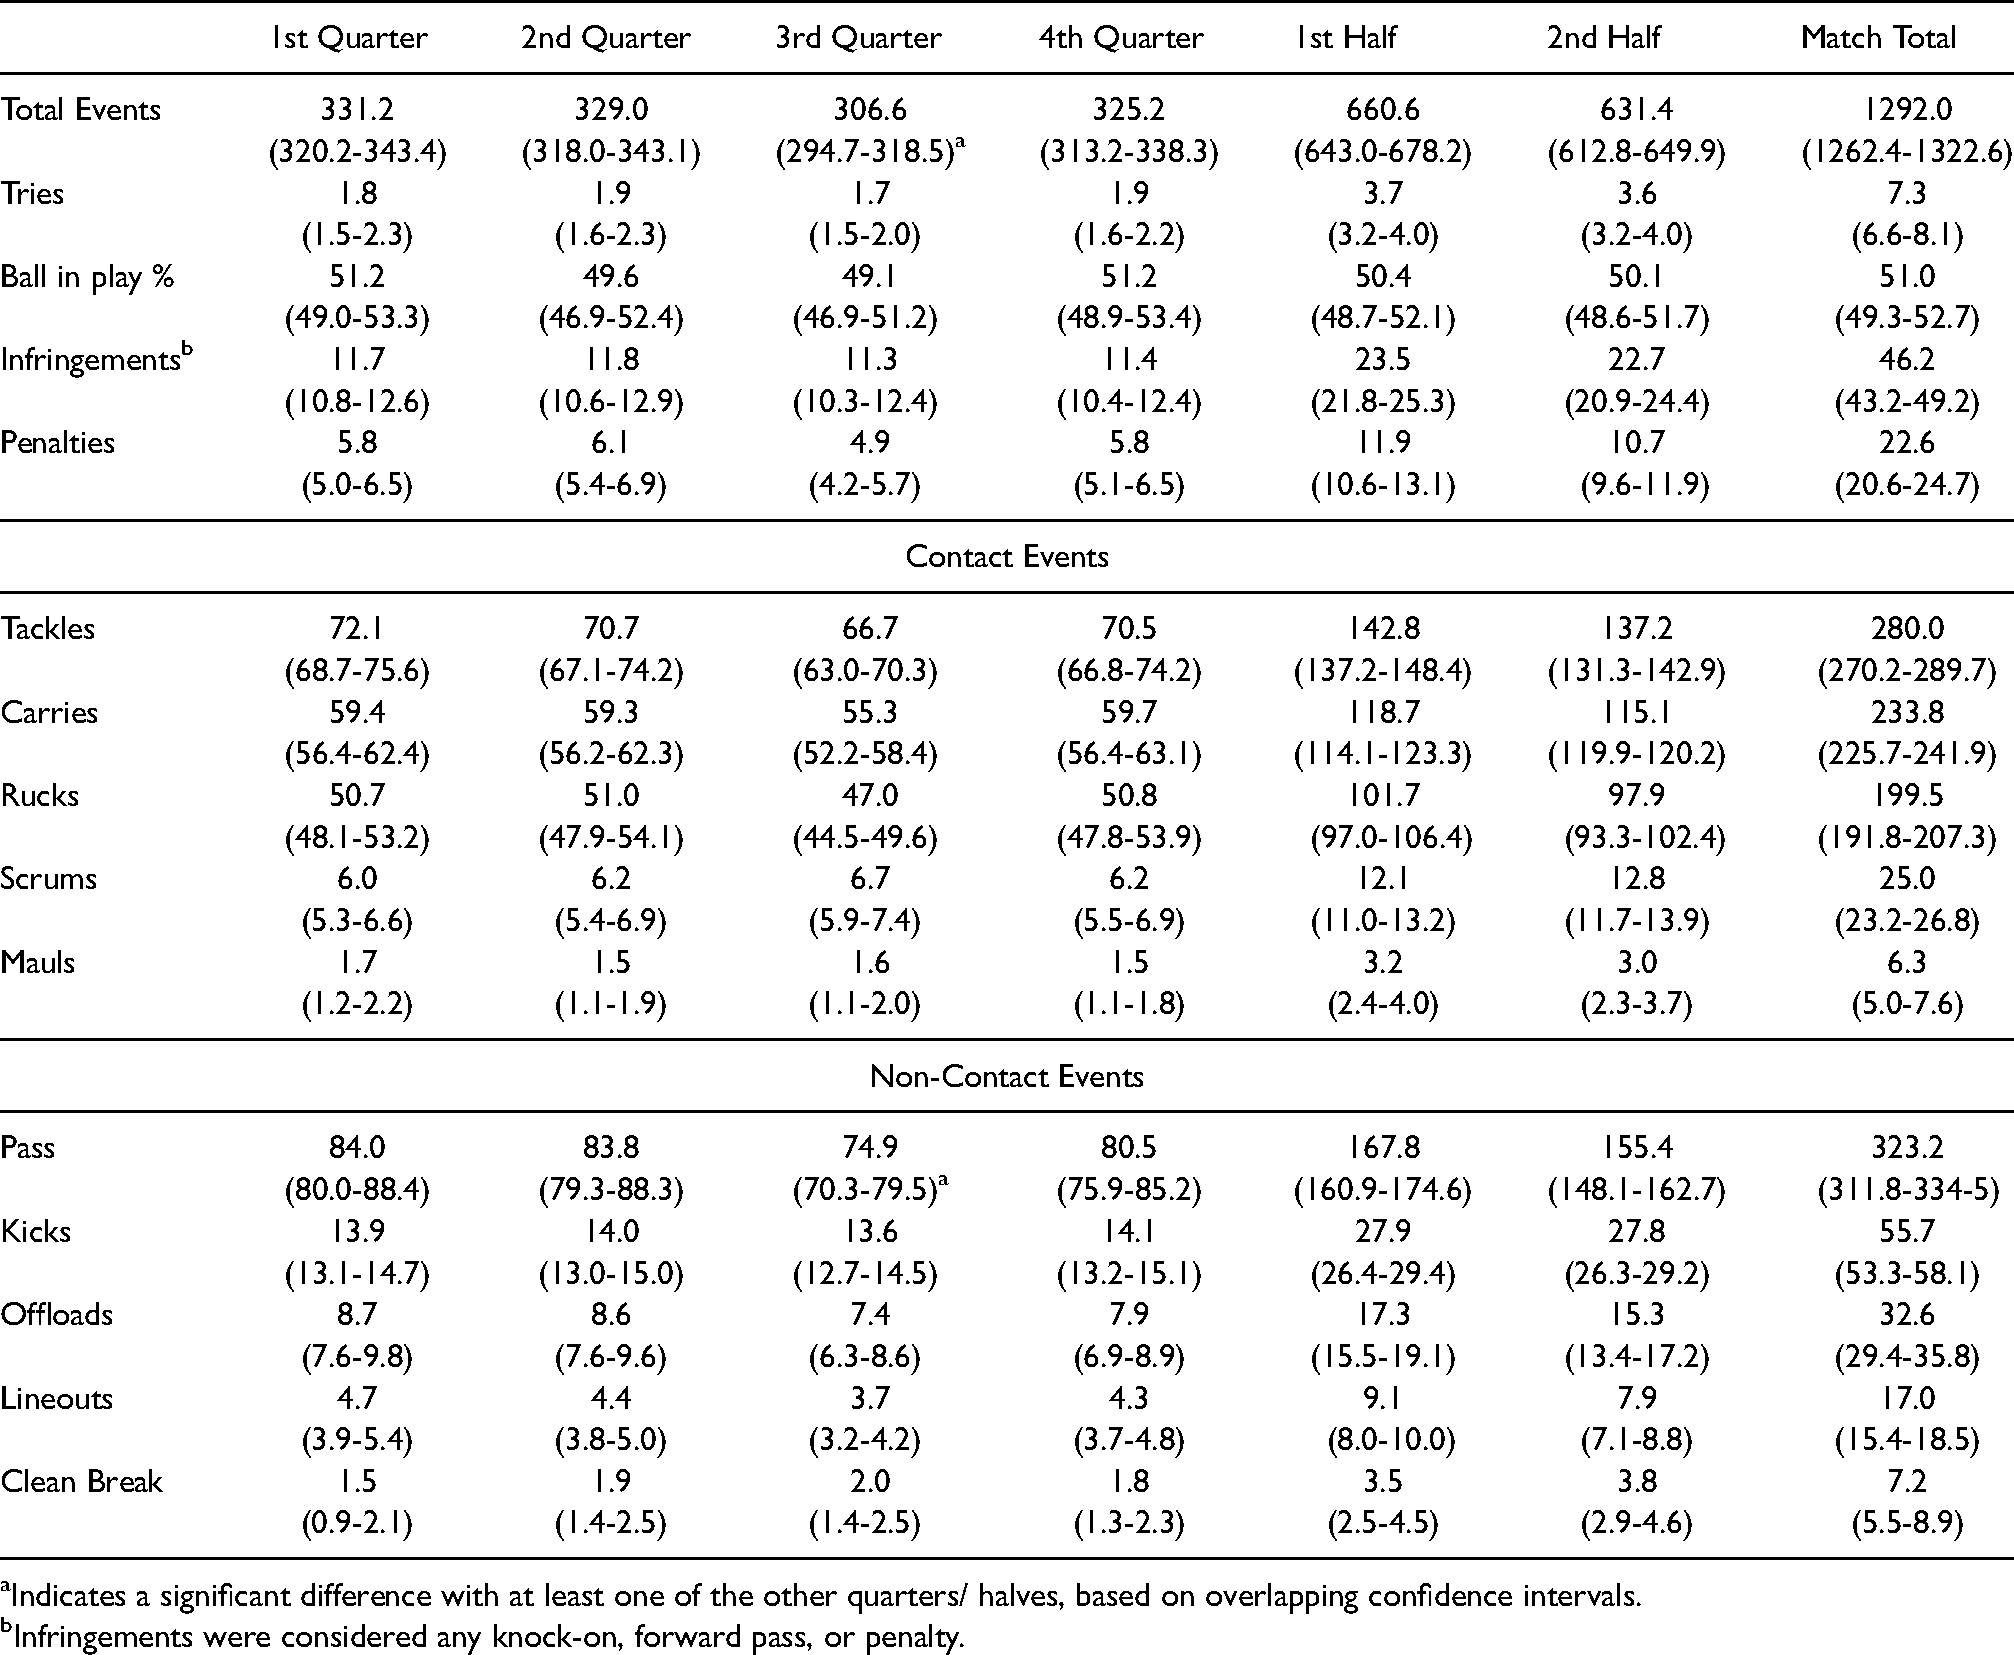
Indicates a significant difference with at least one of the other quarters/ halves, based on overlapping confidence intervals.
Infringements were considered any knock-on, forward pass, or penalty.
Contact Events
The tackle was the most frequent match contact event with a mean of 280.0 tackles per match (95% CIs: 270.2-289.7). This was followed by carries into contact (233.8; 95% CIs: 225.7-241.9), rucks (199.5; 95% CIs: 191.8-207.3), scrums (25.0; 95% CIs: 23.2-26.8) and mauls (6.3; 95% CIs: 5.0-7.6; Table 2). These events occurred at a consistent rate across the game (Table 2). Of the total scrums (n=1199), 77% were won and 9% were lost, while 8% and 5% were reset or collapsed, respectively. When comparing contact events across seasons there were significant differences between seasons for the scrum, the tackle and mauls during the regular season and the tackle, ruck and carries in the playoffs (Table 3). Comparing between fixture types demonstrated significant differences between rucks (2018), tackles (2019) and carries (2019: Table 3). Risk ratios between events demonstrating significant differences between seasons for either regular season or playoff are presented in Table S1.
Descriptive summary of match events per match, stratified by seasons and fixture type. Values are mean per match and 95% confidence intervals.
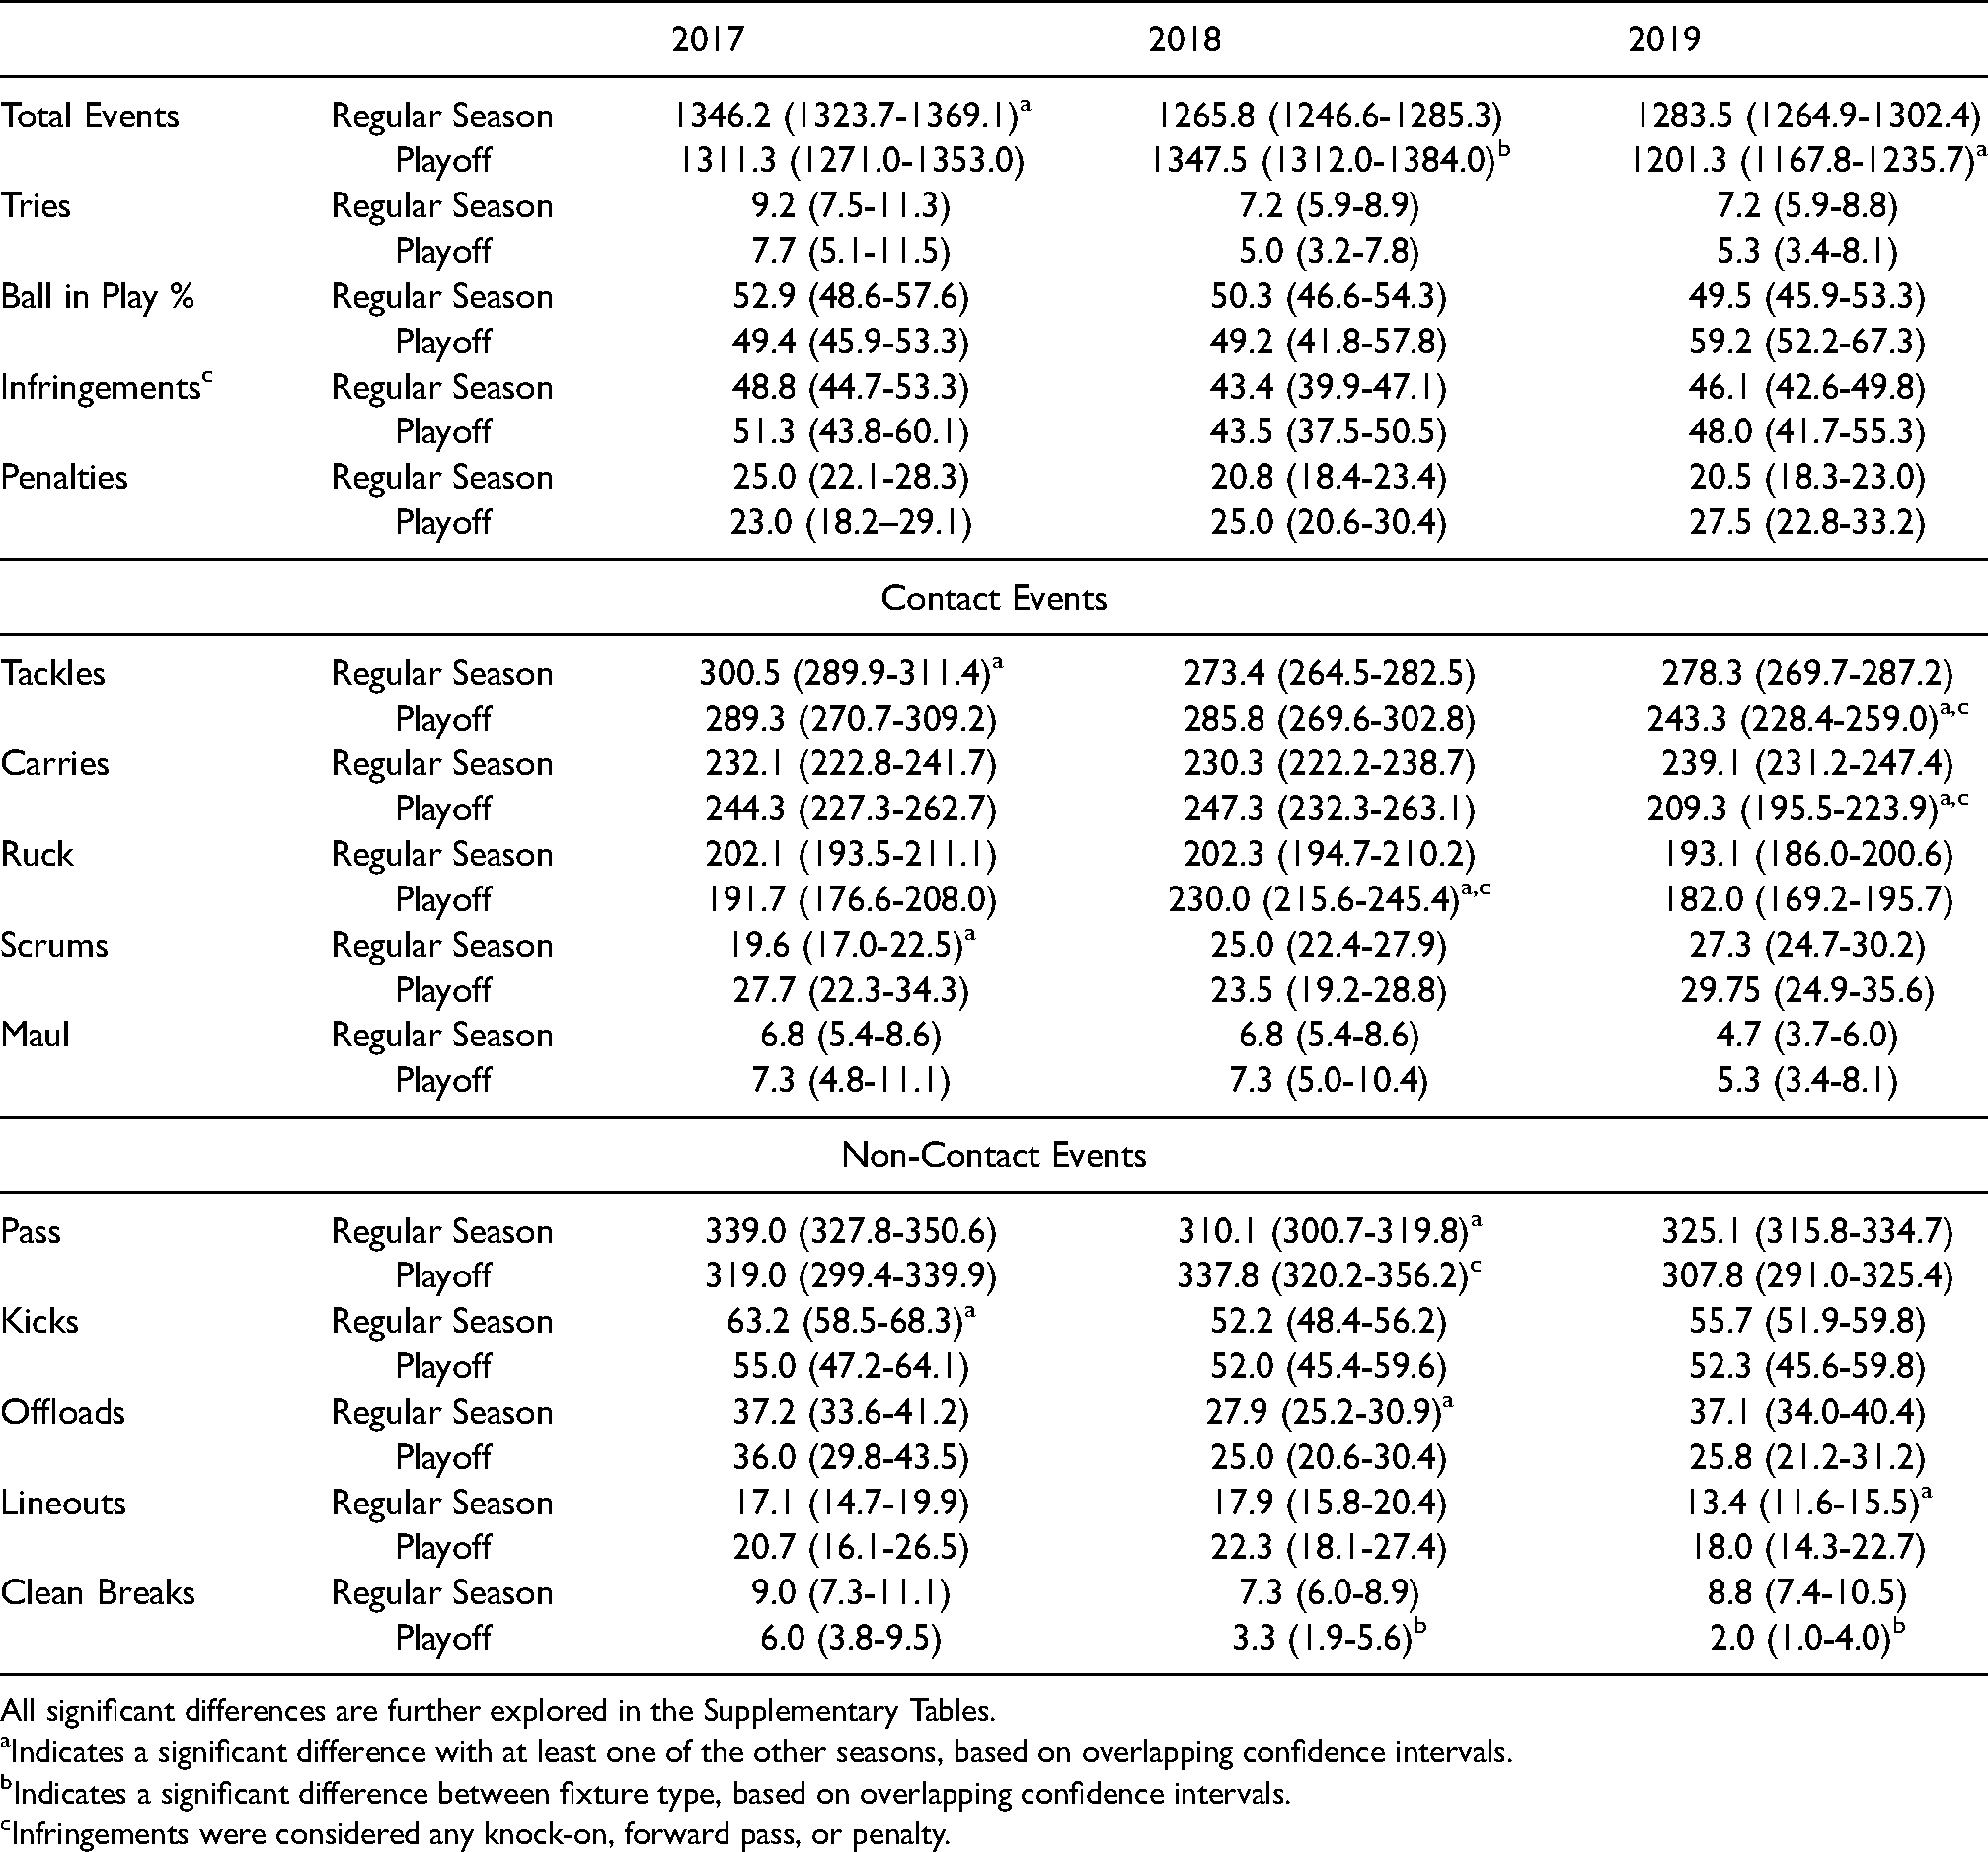
All significant differences are further explored in the Supplementary Tables.
Indicates a significant difference with at least one of the other seasons, based on overlapping confidence intervals.
Indicates a significant difference between fixture type, based on overlapping confidence intervals.
Infringements were considered any knock-on, forward pass, or penalty.
Non-contact events
The most frequent non-contact match events were passes (323.2 per match; 95% CIs: 311.8-334.5). This was followed by kicks (55.7; 95% CIs: 53.3-58.1), tackle offloads (32.6; 95% CIs: 29.4-35.8), lineouts (17.0; 95%CIs: 15.4-18,5), and clean breaks (7.2; 95% CIs: 5.5-8.9). Of the 2672 kicks recorded, 24% were to touch, 22% were to the field, 21% were a ‘tap and go’, 19% were to hand, 13% were conversions, and 1% were attempts on goal from penalties. Of the 815 lineouts, 82% were contested, while 18% were not. In 37% of lineouts, there were seven players involved, 22% included six players, 29% included 5 players, and 11% included 4 players. The ball was typically thrown to the front (48%), followed by middle (36%) and back (16%). Seventy-seven percent of lineouts were won, while 23% were lost. When comparing non-contact events between seasons there were significant differences between kicks, lineouts, passes and offloads in the regular season (Table 3). Across seasons, there were significantly more passes during the playoffs (2018: Table 3). Risk ratios between events demonstrating significant differences between fixture types are presented in Table S2.
Penalisation and infringements
On average there were 46.2 (95% CIs: 43.2-49.2) infringements, which includes 22.6 (95% CIs: 20.6-24.7) penalties per game (Table 2). There were no differences across quarters or halves in either match event. Of the 1086 penalties conceded, there were 21 which warranted the issuing of a yellow card (2%), while no red cards were issued. There were no significant differences between seasons or fixture type for infringements or penalisation (Table 3).
Discussion
This study is the first to examine the frequency and distribution of match events in non-international women's rugby union. When examining the number of events during different periods of the game, the distribution of events was largely consistent across all quarters and halves. Neither the season, nor the fixture type were consistently associated with differences in match event count per game; however there were several cases of one-off significant differences between groups. This study provides coaches with a reference guide to the number of match events players may be exposed to during non-international women's rugby union as well as providing researchers with a set of reference values for the number of match events in the varsity level of the game, to target known high-risk and frequent match events in the game for injury risk mitigation strategies.
As in many sports, the time which players are involved in active gameplay is less than the actual length of the match itself. Unlike some sports (e.g. Ice Hockey), where the clock may stop when the ball/ puck is not in play, in rugby, the match time is always running unless stopped by the referee for an injury, video review and in some cases sending a player off the field. The ball in play time associated with international women's rugby union has been shown to have risen gradually over the course of the last three Rugby World Cups (RWC), with the ball in play for 44%, 45%, and 51% of the 80-min game time for the 2010, 2014 and 2017 competitions, respectively; which was also higher than the ball in play reported for the men's 2015 RWC (44%) 2 . Interestingly, the data from the varsity cohort of Canadian varsity women's rugby players in this study (51%, 95%CIs: 49-53) was the same as that of the 2017 women's RWC 2 , with the spread of the ball in play time being similar across all quarters of the game (49%-51%: Table 2). Of the 51% ball in play time, this was comprised of median periods of ball in play of 31 s (Figure 1(a)), followed by median periods of rest of 35 s (Figure 1(c)), indicating a near one-to-one work to rest ratio. The longest period of ball in play across all three seasons was 5 min 29 s in length, while the median longest ball in play period across all matches was 2 min 14 s (1B). These times are important to consider when preparing athletes for the demands of the game, as these are the maximal periods of exposure (referred to as ‘worst case scenarios’) and often vary substantially from what are considered the average game demands 12 . Previous studies in both women's and men's rugby have reported on the physical demands based on ‘worst case scenarios’ of 2 min 45 s 13 and 2 min 32 s to 2 min 41 s 12 (depending on position) for women's and men's international players respectively. While direct comparison cannot be made given the differences in the standard of play, this does allow us to identify what might be expected of these players during these longest bouts of rugby gameplay. Importantly, the difference in the length of ‘worst case scenarios’ (31 and 18 s less in our sample vs international women 13 and men 12 respectively) is notable and indicates the lower demands placed on players at the varsity level compared with the international game, during these most extended passages of play. Examining the women's international data specifically, we can begin to understand the running and contact demands for players during these periods of play, with players exposed to between 107-121 m/min of running and between 0.91-1.43 collisions per minute, depending on position 13 . While these may not be the same in the context of the varsity population, this provides us with a range of values to keep in mind when conditioning and preparing athletes for the sport. However, it is recognised that further research is required to examine these more specific ‘worst case scenario’ demands in the context of the physical demands (e.g., distance run, sprint distance, collisions) within these time periods in the non-international context.
The tackle in rugby union is not only a crucial skill from an individual and team performance perspective but also from an injury risk mitigation perspective, accounting for 36% 6 and 43% 8 of all injuries in international women's and men's rugby union, respectively. While extensive research has examined the intricacies of tackle technique and injury risk factors [predominantly in men's rugby 4,5,9,14,15], there is very little recent data reporting the frequency with which tackles occur in rugby union match play. The small number of studies that do report tackle rates per game are conducted in men's professional population and appear to show a substantial increase in the number of tackles occurring per match over time. Data from the 2003/04 and 2005/06 seasons in professional men's rugby reported rates of 221.0 (95% CIs: 215.9-226.2) tackles per game 14 . More recently, data for the 2018/19 season shows an average of 284 tackles per game (142 per team), which was reported as an incremental rise since the 2013/14 season 16 . When examining the women's game, there appears to be no comparative data currently available in either the international women's or non-international women's game. In the Canadian varsity cohort examined within the current study, the rate of tackles per game was 280.0 (95%CIs: 270.2-289.7) and therefore very similar to that reported more recently in professional men's rugby 16 . The average number of tackles did not differ significantly between game quarters or halves and no consistent differences existed from season to season or from regular season to playoff games. Despite no consistent trends (consistently higher or lower for one fixture type or season), there were significant differences between individual seasons and fixture types in several of the comparisons (Table 3). The significant differences seen between some seasons and some fixture types cannot be attributed to any one style of play or law change which may have altered the way teams played in a given period. Therefore, the differences appear to be fluctuation between seasons and fixture types only, as opposed to meaningful trends in the data. Previous longitudinal comparisons of match events in the professional game have shown consistent upwards or downwards trends in certain match events spanning the 2010, 2014 and 2017 World Cups 2 , however our comparisons were done over just three years which may have not been long enough to identify whether trends existed over and above season to season variation.
While the average number of tackles per game was 280, this ranged from an average of 243 tackles in 2019 playoff fixtures to 301 tackles per game for 2017 regular season fixtures. Importantly, it must be considered that these values are averages and are likely to be unevenly distributed across playing positions, with backs having previously been shown to cover more distance at higher speeds, while forwards are exposed to greater contact demands 17 , These differences should be accounted for when considering injury risk mitigation strategies and player conditioning. Further to this, in recent seasons, several studies in the professional men's game have been undertaken to identify key tackle characteristics associated with injury 4,5,18. As a result of these studies, law trials targeted at reducing the injury risk in the tackle have been introduced and evaluated in the men's game 19,20. While the number of tackles occurring in the men's professional game and the women's game appear similar based on the data from this study, it is not clear whether the exact mechanisms of injury are the same and therefore risk mitigation strategies in the women's game should be evidence-informed based on analysis of the women's game.
There are a number of differences in the frequency of match events between the current study and those reported in women's international rugby 2 . The largest difference between the two levels was in the number of kicks undertaken, with the varsity cohort in this study kicking an average of 56 times per game (Table 2), over two times higher than in the international game, with an average of 26 in the last RWC 2 . While this difference is interesting and noteworthy, it is not clear what kicks were included in the World Rugby analysis and given the high proportion of kicks in this study recorded as a “tap and go”, it is with caution we make this comparison. However, even excluding the “tap and go” events, there were still a substantially higher number of kicks within the non-international cohort. Interestingly, the number of lineouts was higher in the international game (21 per game: 2) compared with the varsity group (17: Table 2) which indicates and supports the finding that only 24% of the kicks found touch, while a substantial portion of kicks were to the field (22%), to hand (19%) or used to restart play using a ‘tap and go’ (21%). The large number of kicks relative to the international game as well as the higher number of scrums [25 per games in varsity compared to 18 in international women 2 ] may be somewhat accounted for by the number of infringements and penalties conceded in the varsity game. The higher number of scrums can be accounted for by the high number of infringements (considered any knock-on, forward pass, or penalty) in the varsity game, however direct comparison to the international game is difficult as there is no reported count of knock-ons or forward passes. This finding is unsurprising given the skill differences between those playing the highest level of the game at a RWC compared with the collegiate women's league in our cohort. Two final comparisons between the two levels of the game demonstrate fewer passes per game [323 vs 341 2 ] between the varsity and international games, as well as the number of rucks and mauls, which when combined equal 205 in the varsity group and 230 in the international group 2 . Again, although speculative, it is postulated that this could be due to the lower speed of the game at the varsity level, meaning that each breakdown is longer and therefore, less rucks and passes occur due to the lower speed with which the ball is presented for another phase of play.
There are some limitations associated with this study which must be considered when interpreting the results. Firstly, as with all video-based studies in varsity settings, the analysis of footage is limited to one angle with mixed technical ability of the videographer as well as quality of the image. This may have made it difficult for the coder to see events which occurred on the opposite side of the pitch, meaning close quarter action, such as a pick and go may have been missed. Furthermore, as this video was not filmed for the purposes of research, at times the image was zoomed in too far or not far enough to distinguish between certain event counts as well as two games missing periods of time (1 and 5 min respectively). Despite these issues, the camera footage was of sufficient detail, whereby only one out of 49 videos had to be excluded due to challenges with footage quality, leaving a total sample of 48. A second limitation of this study was that identification of player shirt numbers was often restricted and therefore players could not ne stratified by position. While this is not an issue in the context of total games counts, as presented in this study, it is important in the context of player preparation to have a good understanding of how many match events each positional group may be expected to encounter. Future studies could potentially explore the opportunity to match video analysis of events data with other data sources including Global Positioning Systems (GPS) to add further context to the physical demands of match play for this population. Finally, as with all studies conducted in one specific environment, the generalisability of the study findings is somewhat limited to Canadian women's varsity rugby union players. Despite this, given the dearth of literature available currently in the women's game, this study provides an early representation of what might be seen outside of international contexts.
This study aimed to describe match events in varsity women's rugby union to outline the demands placed on the players and determine whether the pattern of play is similar to that in the men's game. Understanding the match demands of female rugby may help better inform and optimise injury risk mitigation and performance strategies in the female game. While the study did outline and identify some differences between the international and non-international forms of the game, largely the patterns of match events were similar to those previously reported. By highlighting the number of match events, this study provides coaches with a reference point on which to condition their players for the demands of the game. Furthermore, this study provides researchers with some contextual data around the number of events occurring per game, allowing for a greater understanding of key areas of the game which could be targeted for injury risk mitigation. In particular, the high frequency with which the tackle occurs during the game, as well as the known high risk of injury in rugby 6 highlights a key area of the game which should be targeted for primary injury prevention in women's rugby.
Footnotes
Acknowledgements
We would like to acknowledge the support of the CanWest league as well as the University of Calgary Dinos Athletics for their permission to use these videos for the purpose of informing a safer game. The Sport Injury Prevention Research Centre is one of the International Olympic Committee Research Centers for the Prevention of Injury and Protection of Athlete Health.
Author Contributions
SWW, IJS, CC, CAE designed the research study and formed the research questions and obtained the data for analysis. Expert opinion and advice on the design an implementation of the study was provided by MH, SPR and SH. Data coding was undertaken by SWW, IJS, CC, NP, JC, BS and MH. Data analysis and interpretation as well as important valuable feedback was provided by all authors at multiple stages of the analysis as well as on multiple version of the final manuscript.
Funding
This work was supported by a Canada Research Chair (Tier 1) in Concussion (PI C Emery, the Faculty of Kinesiology, and Alberta Children's Hospital Research Institute, University of Calgary)
Disclosure statement
The authors have no financial interests or benefits to disclose as a direct result of this work.
Data availability statement
There is no dataset publicly available for this study.