
Abstract
Two prototype eco-friendly 96-microwell spectrophotometric methods with high throughput for the determination of pemigatinib (anticancer drug) in Pemazyre® tablets were developed. The two methods involved in microwell one-step formation of colored charge transfer complexes upon interaction of pemigatinib, as an electron donor, with two different benzoquinone electron acceptors: 2,5-dihydroxy-3,6-dichloro-1,4-benzoquinone (chloranilic acid) and 2,3-dichloro-5,6-dicyano-1,4-benzoquinone. The molar ratios of charge transfer complexes, determined by Job’s method, were found to be 1:1. Computational density functional theory analysis of charge transfer complexes confirmed a π→π* single-electron transfer mechanism. An additional hydrogen bond in the chloranilic acid complex was established, further stabilizing the assembly. Conversely, in the 2,3-dichloro-5,6-dicyano-1,4-benzoquinone complex, only the π-stacking interaction is present, with the intramolecular NH···N hydrogen bond remaining intact. The interactions were performed on 96-well transparent plates, and the absorbances of the charge transfer complexes were measured at 530 and 465 nm for pemigatinib–chloranilic acid and pemigatinib–2,3-dichloro-5,6-dicyano-1,4-benzoquinone complexes, respectively. The microwell spectrophotometric method procedures were refined and validated following the International Council of Harmonisation (ICH) standards. The limits of detection of the methods were 8.5 and 4.1 µg well−1 for chloranilic acid and 2,3-dichloro-5,6-dicyano-1,4-benzoquinone methods, respectively. These methods proved highly reliable for assessing pemigatinib in Pemazyre® tablets and ensuring uniformity. The eco-friendliness/greenness of the microwell spectrophotometric methods was confirmed by three distinct metrics. The methods’ one-step reactions and capacity for processing numerous samples simultaneously contribute to their high-throughput capabilities. In conclusion, this study represents the first two facile, green, and high-throughput microwell spectrophotometric methods for pemigatinib analysis for quality control purposes. In addition, it is the first work exploring the interactions of pemigatinib with chloranilic acid and 2,3-dichloro-5,6-dicyano-1,4-benzoquinone.

Keywords
Introduction
Pemigatinib (PGT), a new kinase inhibitor, was approved by the US-FDA for the management of advanced cholangiocarcinoma and refractory myeloid/lymphoid neoplasms. 1 PGT affects the fibroblast growth factor receptors (FGFR 1, 2, and 3). 2 It also shows inhibitory effects on FGFR4, albeit at concentrations roughly 100-fold greater than those needed for FGFR1-3 inhibition. PGT blocks the phosphorylation and signalling of FGFR1-3, reducing the viability of cancer cells that have FGFR-related amplifications and fusions, leading to constant FGFR signalling. This ongoing signalling is known to aid the growth and survival of cancer cells. 2 The chemical structure of PGT is given in Figure 1.

The chemical structures of pemigatinib (PGT), 2,5-dihydroxy-3,6-dichloro-1,4-benzoquinone (chloranilic acid: CLA), and 2,3-dichloro-5,6-dicyano-1,4-benzoquinone (DDQ).
Currently, few analytical methods exist for quantifying PGT in laboratory-prepared synthetic mixtures, as well as pharmaceutical and biological specimens.3-7 While chromatographic methods are known for their selectivity and sensitivity, they come with significant limitations such as the slow analysis times that hinder sample throughput, the high costs associated with the equipment and its operation and maintenance, and the use of large quantities of costly and environmentally/health hazardous organic solvents in the mobile phase. On the other hand, the traditional spectrophotometric analysis uses cuvettes and volumetric flasks in a subsequent analysis routine. This procedure consumes large volumes of organic solvents and offers limited throughput. As a result, these methods fail to align with the principles of green analytical chemistry (GAC) and sustainability, and they do not meet the needs of high-throughput analysis in the pharmaceutical manufacturing. These limitations make the reported methods less suitable for pharmaceutical quality control purposes, especially in developing countries. Thus, there is a strong incentive to develop an alternative green and miniaturised method with higher throughput.
Microwell spectrophotometric methods (MW-SPMs) are gaining recognition as an eco-friendly alternative for pharmaceutical analysis.8,9 Their main benefit lies in the reduced volumes of samples and reagents needed, which cuts down on waste and lowers the costs associated with solvents and reagents. By adopting these microscale techniques, laboratories can also lessen their reliance on harmful chemicals and solvents, contributing to a more sustainable practice. MW-SPMs are versatile enough to be applied across different sectors of the pharmaceutical industry.10-12 Moreover, they are well-suited for automation, which can be achieved with robotic systems, thus increasing efficiency, minimising errors, and conserving time and labour. These benefits have made microwell spectrophotometry increasingly popular not just in the pharmaceutical sector but in other areas as well. It is worth emphasizing that this work introduces the first two green microwell spectrophotometric methods for quantifying PGT in its marketed tablet form, Pemazyre®, for pharmaceutical quality control purposes.
Charge transfer complexes (CTCs) are essential in many scientific areas, including spectrophotometric analysis.13-15 PGT’s chemical structure, as shown in Figure 1, features amine nitrogen and ether and morpholinyl oxygen atoms capable of electron donation, making them suitable for CTC formation with electron acceptors. To date, there have been no studies on PGT’s charge transfer interactions. This study aims to fill this gap by exploring PGT’s charge transfer reactions with electron acceptors and utilising these findings to develop MW-SPMs for PGT analysis. Notably, 2,5-dihydroxy-3,6-dichloro-1,4-benzoquinone (chloranilic acid: CLA) and 2,3-dichloro-5,6-dicyano-1,4-benzoquinone (DDQ) are among the most responsive benzoquinone electron acceptors, reacting instantly even under mild conditions, 16 as depicted in Figure 1.
This research introduces two novel MW-SPMs for quantifying PGT in Pemazyre® tablets. These methods relied on the formation of colored CTCs in microscale reactions of PGT with CLA and DDQ. The process is carried out in clear 96-well plates, with the resulting solution’s absorbance measured at 530 nm for CLA and 465 nm for DDQ using an absorbance microplate reader. Both MW-SPMs are in line with the principles of GAC and are designed for high-throughput operations prevalent in the pharmaceutical sector.
Our interest in developing a spectrophotometric method for PGT stems from its proven clinical efficacy and therapeutic value in treating advanced cholangiocarcinoma (bile duct cancer) and relapsed or refractory myeloid/lymphoid neoplasms associated with rearrangements in FGFR1, as well as the recent approval of its Pemazyre® tablets. This has created an immediate demand for a precise and straightforward method to determine PGT in its bulk powder form and tablet formulations. Spectrophotometry was chosen due to its widespread adoption in the pharmaceutical industry, attributed to its simplicity and compatibility with automated systems capable of processing numerous samples. This is essential for quality control measures like content uniformity and dissolution tests for solid dosage forms. Given the absence of any existing spectrophotometric methods for PGT in the literature, this further motivated our pursuit of such a method for PGT.
CT interactions are foundational to numerous spectrophotometric methods used in pharmaceutical quality control.13,14,17-20 PGT’s chemical structure, as depicted in Figure 1, includes electron-donating sites such as amino nitrogen atoms of ether/morpholinyl oxygen atoms, which are candidates for forming CTCs with electron acceptors. However, literature reviews reveal that PGT’s CT interactions have yet to be explored. This study aims to fill this gap by creating a CT-based spectrophotometric method for PGT. CLA and DDQ, shown in Figure 1, are versatile reagent known for their effectiveness in various chemical contexts.21,22 They are commercially available, easy to handle, stable, soluble, and typically result in non-toxic byproducts. Both CLA and DDQ are highly effective electron acceptors due to their electron-deficient structures. CLA contains two electron-withdrawing carbonyl groups, while DDQ features additional electron-withdrawing cyano and chloro groups. These properties make them highly reactive toward electron-rich compounds, facilitating efficient CTC formation. While other electron acceptors (e.g. tetracyanoethylene or iodine) were considered, CLA and DDQ were selected due to their superior reactivity, stability, and the intensity of the resulting CTCs. For example, iodine-based acceptors often suffer from volatility and lower stability, while tetracyanoethylene may not provide the same level of sensitivity. Furthermore, CLA and DDQ form stable and intensely colored CTCs due to the strong π-π* transitions facilitated by their planar structure and electron-deficient nature. These characteristics make CLA and DDQ ideal candidates for studying their CT interactions with PGT and for developing new spectrophotometric methods for its determination.
Traditional CT-based spectrophotometric analysis often relies on volumetric flasks and/cuvettes, which limit the number of samples that can be processed, and requires significant volumes of expensive reagents/solvents, potentially posing toxicity risks to analysts. 23 Such practices do not align with the principles of GAC, which advocate for more environmentally friendly approaches.24-26 Therefore, this study aimed to develop innovative, eco-friendly CT-spectrophotometric methods that offer higher throughput. Our laboratory has successfully implemented an absorbance microplate reader to develop microwell-based spectrophotometric methods.10-12,27 These methods allow for the efficient quantification of active pharmaceutical ingredients with high throughput and reduced solvent use. Building on this success, we sought to adapt this green methodology for the analysis of PGT.
Experimental
Apparatus
The analysis employed a double-beam UV-Vis spectrophotometer (UV-1800, Shimadzu Corporation, Kyoto, Japan). For the microwell-based analysis, an absorbance microplate reader (ELx808, Bio-Tek Instruments Inc., Winooski, USA), operated via the accompanying KC Junior software, was used.
Chemicals and materials
PGT standard material with a purity of ⩾99%, was obtained from the MedChem Express (Princeton, NJ, USA). Pemazyre® tablets (Incyte Corporation, Wilmington, Delaware, USA) were kindly donated by the Saudi FDA (Riyadh, Saudi Arabia), and they were labelled to contain 13.5 mg of PGT per tablet. CLA and DDQ were purchased from Sigma-Aldrich Chemicals Co. (St. Louis, MO, USA). Corning® 96-well transparent assay plates were acquired from Merck & Co. (Rahway, New Jersey, NJ, USA). Solvents and other materials were obtained from Fisher Scientific (California, CA, USA).
Preparation of standard PGT solutions
A stock solution of PGT at a concentration of 1 mg mL−1 was prepared by dissolving 10 mg of PGT in 10 mL of methanol. This solution was further diluted with methanol to obtain various concentrations of PGT, appropriate for the planned experiments.
Determination of association constants
A series of PGT solutions with concentrations ranging from 6.2 × 10⁻⁶ M to 1.24 × 10⁻⁴ M were prepared in methanol. These solutions were then mixed with fixed concentrations of CLA (2.4 × 10⁻⁴ M) and DDQ (2.2 × 10⁻⁴ M) and allowed to react for approximately 5 min at room temperature (25 ± 2 °C). The absorbance of each reaction mixture was measured, and the data were used to construct Benesi-Hildebrand plots. 28 These plots illustrate the relationship between 1/[D] with [A]/A, where [D] represents the molar concentration of the acceptor (CLA and DDQ), and [A] is the absorbance of the complex. Regression analysis was performed to determine the association constants of the CTCs, following the method described by Benesi-Hildebrand. 28
Determination of reaction stoichiometry
The Job’s method was utilized for the determination of the stoichiometry of CTCs of PGT with both CLA and DDQ. 29 For the study, solutions of PGT and acceptors were prepared at equimolar concentrations (5 × 10⁻³ M) in both cases of interactions of PGT with CLA and DDQ. Different microliter volumes of these solutions were combined in the microwells to create varying PGT:acceptor ratios (0:200, 20:180, 40:160, . . ., 160:40, 180:20, 200:0). The absorbance of each mixture was then measured and graphed against the mole fraction of PGT. Job’s plots derived from these measurements provided insight into the stoichiometric relationships in the PGT interactions with CLA and DDQ.
Procedures of MW-SPMs
In the experiment, 100 µL samples of a PGT standard solution, containing PGT concentrations varying from 5 to 250 µg, were placed into the wells of an analysis plate. Following this, 100 µL of a 0.1% (w/v) solution of CLA or DDQ was added to each well. The mixtures were then left to react for 5 min at a room temperature of 25 ± 2 °C. The absorbances of the solutions were measured at wavelengths of 530 nm for CLA and 465 nm for DDQ using an absorbance microplate reader.
Assessment of MW-SPA procedures greenness
Three assessment tools were employed to evaluate the environmental sustainability/greenness of the MW-SPMs. The application of these tools for operational assessment is outlined in the subsequent sections.
Analytical eco-scale tool
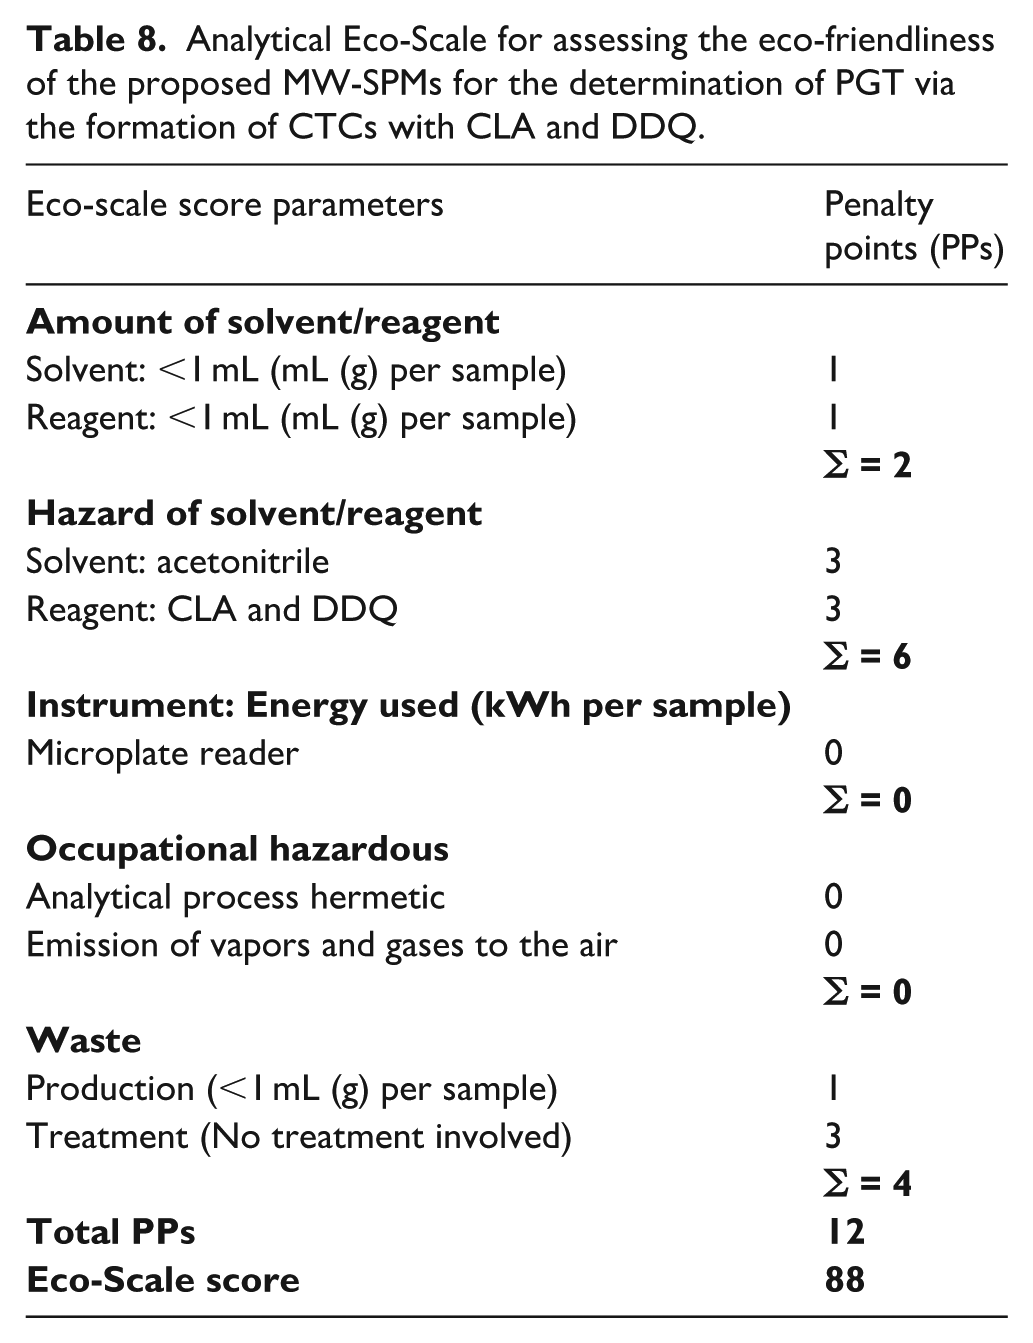
The Analytical Eco-Scale (AES) tool 30 assesses the environmental impact of an analytical procedure using four criteria: (1) the solvents and reagents involved, (2) the energy usage of the instruments, (3) potential occupational hazards, and (4) the amount of waste generated. Each criterion is assigned penalty points based on its environmental harm. These points are deducted from a perfect score of 100, which represents an ideal green assay. The AES then categorises the eco-friendliness of the procedure into three levels: green (a final score above 75), reasonably green (a final score between 50 and 75), and inadequate green (a final score below 50).
Green analytical procedure index
The Green Analytical Procedure Index (GAPI) tool 31 offers a detailed evaluation of the ecological footprint of analytical procedures, from sample collection to waste disposal. It assesses 15 aspects: (1) sample collection/preparation, (2) preservation, (3) transportation, (4) storage, (5) method type (direct/indirect), (6) extraction scale, (7) solvents/reagents for extraction, (8) additional treatment, (9) reagent/solvent quantities, (10) health hazards, (11) safety risks, (12) instrument energy use, (13) occupational hazards, (14) waste volume, and (15) waste management. These parameters are visually represented in a 15-section pictogram, color-coded as green for eco-friendly, yellow for moderate, and red for non-eco-friendly processes.
Analytical greenness
The analytical greenness (AGREE) metric tool, 32 the latest addition for evaluating the greenness of assays, is a straightforward and user-friendly software that delivers clear and interpretable outcomes. It bases its greenness evaluation on the 12 GAC principles encapsulated in the acronym “SIGNIFICANCE,” as elaborated in its foundational paper. The software generates a circular pictogram divided into 12 segments, each colored from deep green (value = 1) to deep red (value = 0) based on their environmental impact. An overall greenness score, a fraction of one, is automatically calculated and displayed at the center of the pictogram.
Computational calculations
The Conformer–Rotamer Ensemble Sampling Tool (CREST) is a program designed for conformational sampling at the extended tight-binding level GFN-xTB. 33 A specialized application of CREST is the sampling of aggregates (also referred to as NCI mode), which is particularly useful for identifying different conformations of noncovalently bound complexes and analyzing their fragment arrangements. The optimization of the aggregates was performed without symmetry constraints using the RI-BP86-D4/def2-TZVP level of theory34-37 within the Turbomole 7.7 program [f]. 38 Molecular electrostatic potential (MEP) surfaces, molecular orbitals, and spin density plots were visualized using GaussView 6.0 39 based on the cube files generated by Turbomole 7.7.
Content uniformity testing for Pemazyre® tablets
Content uniformity assessment for Pemazyre® tablets was conducted in line with the United States Pharmacopoeia (USP). 40 Briefly, 10 tablets were analyzed using the two proposed MW-SPMs to determine the PGT content across all tablets. The acceptance value was the computed and evaluated against the maximum permissible value for content uniformity in 10 units of solid dosage form.
Results and discussion
Reactions and absorption spectra
The absorption spectrum of PGT solution (2.05 × 10⁻⁵ M, in methanol) is shown in Figure 2, and it shows one distinct absorption peak 290 nm. When PGT reacted with CLA and DDQ, the solutions changed to violet and red colors, respectively. The absorption spectra revealed distinct bands with peaks at 530 and 465 nm for the interactions with CLA and DDQ, respectively (Figure 2(A)). The band intensities increased in direct proportion to the PGT concentrations, confirming the interactions between PGT and the two acceptors. Given that CLA can exist as either a purple (HA−) or pale violet (A2−) form, the violet reaction product with PGT indicated the formation of the HA− form of CLA. The absorption bands’ profiles matched those of the radical anions of CLA and DDQ documented in prior research. 16 These findings suggest that PGT’s interactions with CLA and DDQ are CT interactions. This was further corroborated when the addition of a mineral acid (HCl) to the mixtures resulted in the loss of color, supporting the CT nature of these interactions. In this process, PGT served as the electron donor, while CLA and DDQ acted as π-electron acceptors. The reactions took place in methanol, leading to the creation of CTCs (D-A), which then dissociated to yield the colored radical anion of the acceptor (A•−):


(a) The absorption spectra of PGT (2.05 × 10⁻⁵ M) and the reaction mixtures of PGT with CLA (PGT-CLA) and DDQ (PGT-DDQ). The mixtures contained a fixed concentration of PGT (5.13 × 10⁻⁴ M) and a fixed concentration of CLA (2.4 × 10)−4 and DDQ (2.2 × 10)−4. (b) Tauc plots of energy (hυ) against (αhυ)2 against for CTCs of PGT with CLA and DDQ. All solutions were prepared in methanol.
Characteristics of CTCs
The CTCs formed by interactions of PGT with CLA and DDQ were analyzed for their band gap energy (Eg) and other related spectroscopic and electronic properties, following established procedures.22,41 The Eg, which is the energy difference between the complex’s highest occupied molecular orbital (HOMO) and lowest unoccupied molecular orbital (LUMO), was calculated using Tauc plots for the PGT-CLA and PGT-DDQ CTCs, as shown in Figure 2(B). The complexes with CLA and DDQ exhibited Eg values of 2.0 and 1.9 eV, respectively. These low Eg values suggest that the electron transfer from PGT to CLA and DDQ is efficient, not requiring high-energy light, thus making these reactions well-suited for the development of spectrophotometric methods for PGT.
The electronic constants and properties of the CTCs formed between PGT and both CLA and DDQ were calculated, with the results presented in Table 1. The significant association constants and the negative Gibbs free energy values, derived from the Benesi-Hildebrand plots (Figure 3(a)), suggest that the interactions between PGT and the acceptors proceed readily, resulting in highly stable CTCs. Moreover, the substantial molar absorptivity (ε) values for both CTCs demonstrate their potential for developing sensitive spectrophotometric methods to measure PGT.
Spectroscopic parameters for CTCs of PGT with CLA and DDQ.

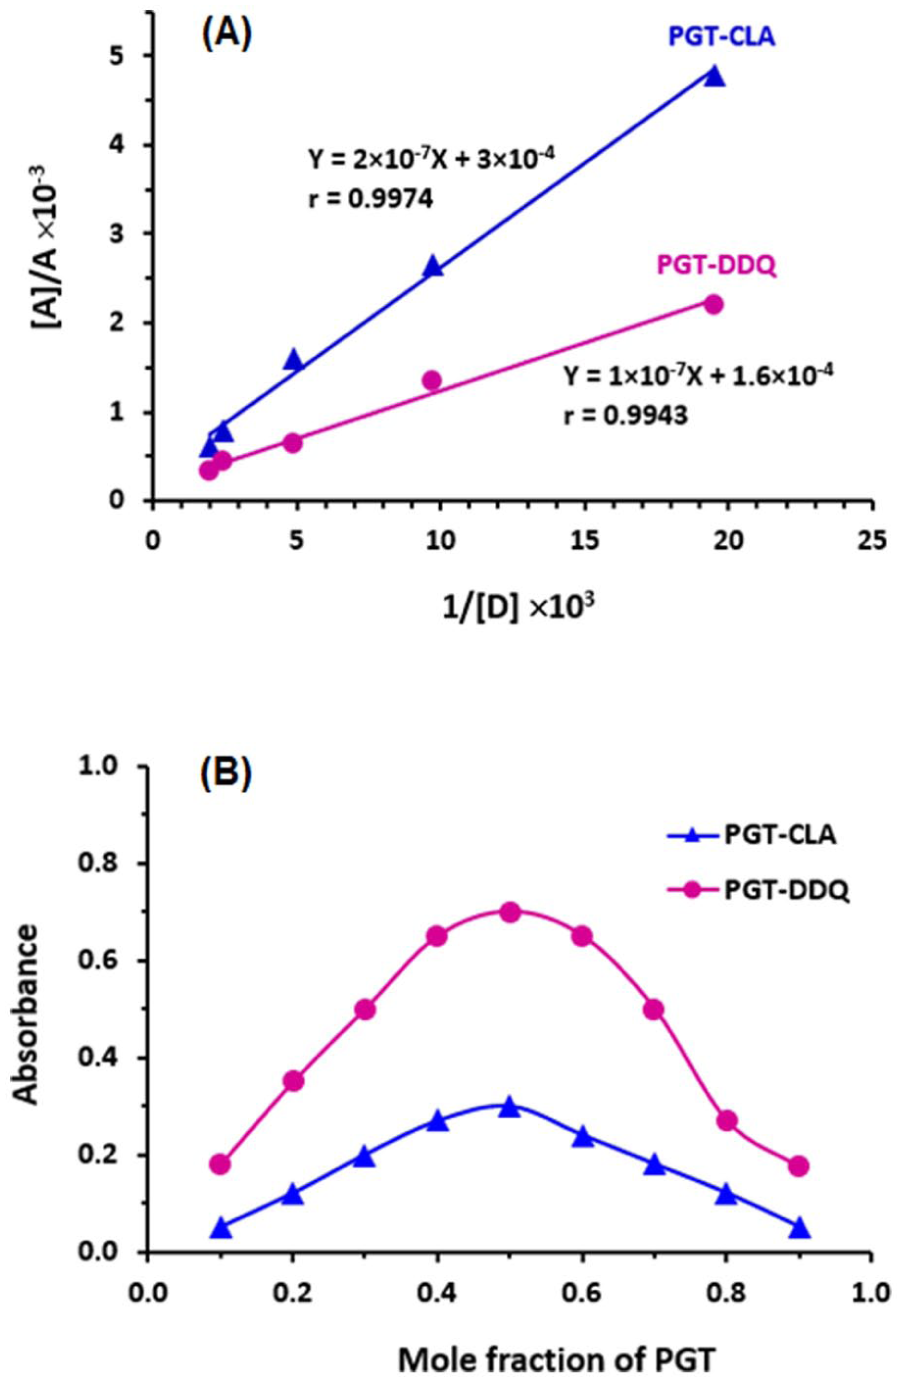
The Benesi–Hildebrand (A) and Job’s (B) plots for the formation of the CTCs of PGT with CLA (▲) and DDQ (•). In panel (A): the linear fitting equations and their correlation coefficients (r) are given on the plots. [A], A, and [D] are the molar concentration of the acceptor reagent (CLA or DDQ), the absorbance of the CTC, and molar concentration of PGT, respectively.
The stoichiometric ratios of CTCs of PGT with CLA and DDQ were determined to be a 1:1 for both CTCs, as established by Job’s method (Figure 3(b)). This ratio suggests that a single molecule of CLA or DDQ interacts with one electron-donating site on the PGT molecule.
Computational analysis
Initially, the PGT molecule was energy minimized, and charges were calculated. Table 2 summarizes the atom types, numbers, and their calculated charges on energy minimized PGT. We investigated the binding modes of the complexes between PGT and either CLA or DDQ using DFT calculations at the RI-BP86-D4/def2-TZVP level of theory. First, we computed the molecular electrostatic potential (MEP) surfaces of all three molecules, as shown in Figure 4.
Atom types, numbers, and their calculated charges on energy minimized PGT.


MEP surfaces of PGT (a), CLA (b), and DDQ (c). Energy values at selected points are given in kcal mol−1. Isovalue 0.001 a.u.
Since PGT is conformationally rich, we initially employed the CREST (Conformer–Rotamer Sampling Tool) program, which is highly effective for efficiently and automatically exploring molecular conformational space. CREST identified 647 possible conformers/rotamers, and the global minimum was subsequently reoptimized at the RI-BP86-D4/def2-TZVP level of theory.
The MEP analysis of PGT in Figure 4(a) reveals that the MEP minimum is located at the oxygen atom of the pyrimidinone ring (–38 kcal mol−1), followed by the nitrogen atom of the pyridine ring. The nitrogen atom of the morpholino ring does not exhibit significant electron density, as it forms an intramolecular hydrogen bond with the pyrrole ring. The MEP maximum is located at the hydrogen atom of the pyrrole ring (+25 kcal mol−1). Notably, the MEP over the pyridine and pyrimidinone rings is negative (–9 and –8 kcal mol−1, respectively). The three fused rings (pyrrole, pyridine, and pyrimidinone) form a planar surface, making them ideal for interactions with the planar, electron-deficient CLA and DDQ molecules.
The MEP surfaces further confirm that CLA and DDQ exhibit large, positive MEP values over the center of their rings (24 and 43 kcal mol−1, respectively). In the case of CLA, the MEP maximum is located at the phenolic hydrogen atoms (+40 kcal mol−1), and for DDQ the maximum is located over the ring center.
Considering the 1:1 stoichiometry observed experimentally, we investigated the formation of dimeric assemblies prior to the single-electron charge transfer. Utilizing the noncovalent interaction (NCI) module of the CREST program, we explored the most favorable orientations for both assemblies. Specifically, 892 possible dimers were computed for the PGT···CLA interaction and 541 for PGT···DDQ. The most stable dimer for each PGT···CLA and PGT···DDQ assembly, as identified by the CREST-NCI program, was subsequently re-optimized using the RI-BP86-D4/def2-TZVP level of theory.
The optimized geometries, shown in Figure 5, reveal that the supramolecular complexes formed before charge transfer are primarily stabilized by π···π stacking interactions, where the electron-deficient ring is positioned over the bicyclic aromatic system (indole moiety). In the CLA complex, an additional hydrogen bond is established between the phenol group and the nitrogen atom of the morpholino ring, further stabilizing the assembly. Conversely, in the DDQ complex, only the π-stacking interaction is present, with the intramolecular NH···N hydrogen bond remaining intact. These findings suggest that the most probable charge transfer mechanism follows a π(PGT)→π*(CLA/DDQ) pathway.

RI-BP86-D4/def2-TZVP optimized complexes of PGT···CLA (a) and PGT···DDQ (b). Distances in Å.
To support this hypothesis, we analyzed the HOMO of the PGT molecule (Figure 6(a)), which is primarily localized on the π-system of the indole ring, with minor contributions from the conjugated nitrogen atom of the pyrimidinone ring. The LUMO of CLA and DDQ molecules is also a π-type molecular orbital (the LUMO of DDQ is shown in Figure 6(b) as a representative example), further supporting the π(PGT)→π*(CLA/DDQ) charge transfer mechanism upon supramolecular dimer formation. In addition, the spin density plot of the PGT radical cation reveals significant delocalization of the unpaired electron over the indole ring, the conjugated nitrogen atom of the pyrimidinone, and to a lesser extent, the 2,6-difluoro-3,5-dimethoxyphenyl ring. This further corroborates the proposed π(PGT)→π*(CLA/DDQ) single-electron charge transfer process.

(a) Plot of the HOMO of PGT. (b) Plot of the LUMO of DDQ. (c) Spin density plot of PGT radical cation. Isovalues used are 0.04 a.u. for the MOs and 0.004 a.u. for the spin density.
Optimization of conditions for the development of MW-SPMs
For refining MW-SPMs, experiments were performed to identify factors affecting reaction outcomes and absorbance readings. Using 96-well plates and methanol as a solvent, absorbance was recorded at 530 nm for CLA and 465 nm for DDQ. Varying concentrations of CLA and DDQ from 0.01% to 0.5% (w/v) showed increasing absorbance, peaking at ~0.1% (w/v) (Figure 7(A)). Beyond this concentration, the absorbances remained constant in the case of CLA; however, they decreased in the case of DDQ. Thus, a 0.1% (w/v) concentration was selected for further experiments involving both acceptors. Reactions at room temperature were immediate and stable for 30 min for both CLA and DDQ (Figure 7(B)). At long reaction times up to 40 min, the absorbances remained constant for DDQ; however, they decreased for CLA. For obtaining readings with better precision, the absorbances were measured after 5 min from the reaction beginning.

The effect of CLA (▲) and DDQ (•) concentrations (A) and time (B) on their CT interactions with PGT for the development of MW-SPMs for PGT.
Validation of MW-SPMs
Linear range and sensitivity
Calibration curves were constructed through linear regression of the absorbance data against PGT concentrations. These curves, along with their equations, are depicted in Figure 8. The calibration data derived from these equations can be found in Table 3. The methods showed a linear response for PGT concentrations ranging from 10 to 250 μg well−1, with a determination coefficient (r2)of 0.9997 for CLA, and 5 to 150 μg mL−1, with a determination coefficient (r2)of 0.9995 for DDQ.

The calibration curves for the determination of PGT by MW-SPMs via the formation of CTCs with CLA (▲) and DDQ (•). The linear regression equations and their determination coefficients (r2)are given on the calibration lines.
The regression parameters for the determination of PGT by the proposed MW-SPMs via the formation of CTCs with CLA and DDQ.

In adherence to the International Council of Harmonisation (ICH) guidelines for validating analytical procedures, 42 the sensitivity of the MW-SPMs was assessed by determining their limits of detection (LOD) and limits of quantitation (LOQ). The LOD and LOQ were calculated using the standard deviation (SD) of the intercept and the slope of the calibration curve, where LOD = 3.3 × (SD of the intercept/slope) and LOQ = 10 × (SD of the intercept/slope). The LODs were established at 8.5 and 4.1 μg well−1 for the CLA and DDQ methods, respectively. In addition, the LOQs were established at 25.7 and 12.4 μg well−1 for the CLA and DDQ methods, respectively (Table 3).
Precision and accuracy
The precision of the MW-SPMs was verified by analyzing PGT solution samples at 3 varying levels of concentrations (low, medium, and high), as detailed in Table 4. The relative standard deviations (RSD) were calculated, yielding intra-day and inter-day precision with RSDs between 1.2% to 1.8% for CLA and 0.8% to 1.6% for DDQ, confirming the methods’ precision.
The precision and accuracy of MW-SPMs for the determination of PGT via the formation of CTCs with CLA and DDQ.
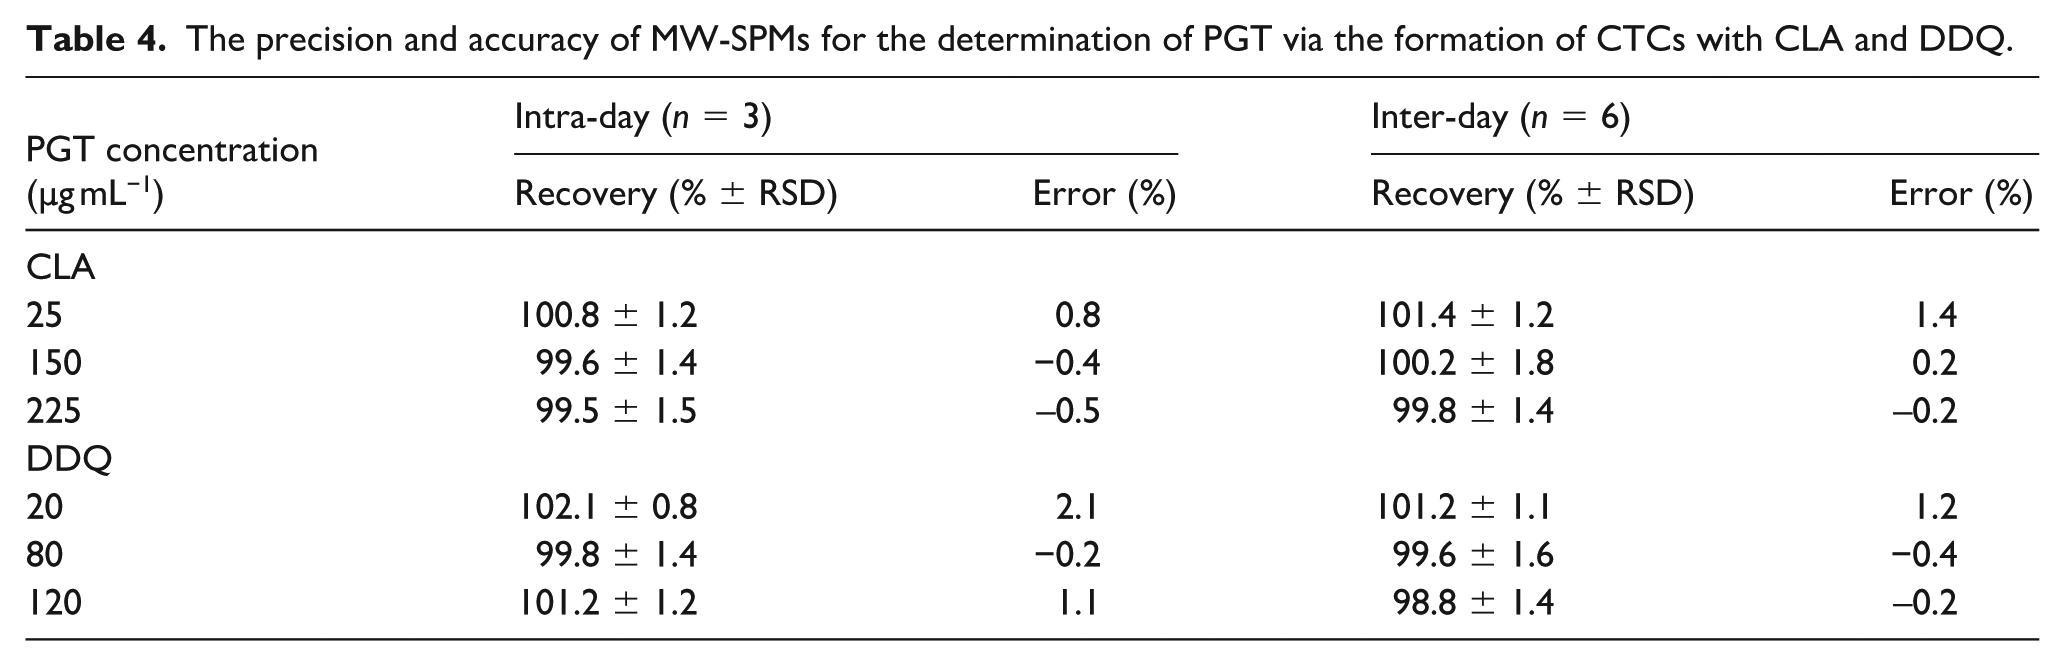
The accuracy was assessed through recovery studies for PGT solutions containing known nominated concentrations. The percentage recovery was calculated by comparing the measured concentration to the nominated concentration. The recovery rates for CLA and DDQ methods range from 99.5% to 101.4% and 98.8% to 102.1%, respectively. The error margins were minimal, further attesting to the methods’ accuracy. These findings are detailed in Table 4.
The high levels of precision and accuracy of both MW-SPMs were attributed to several key factors: (1) Small volume reactions: both MW-SPMs use very small volumes (100 µL) of reagents and samples, which reduces the variability that can occur with larger volumes. This ensures that the conditions of each well are more uniform and consistent. (2) Simultaneous samples manipulation: use of microwell plates, multi-channel pipettes for sampling and mixing, and simultaneous samples handling minimizes experimental error and leads to more consistent and accurate results. (3) Standardized equipment: The use of standardized equipment, like microplate reader ensures that measurements are consistent across different assays and over time. (4) Optimized simple protocols: Protocols for both MW-SPMs were rigorously refined and optimized for the specific one-step reactions helps in achieving accurate results. (5) Controlled environment: The reactions in microwell analysis are conducted in a controlled environment, which limits external factors that could affect the reaction, such as temperature fluctuations or evaporation.
Robustness and ruggedness
The robustness of the MW-SPMs was tested by slightly altering method variables like CLA and DDQ concentrations and reaction time, as detailed in Table 5. These minor changes had minimal impact on the performance of the methods. Recovery rates for the CLA method were between 99.6% and 101.8%, and for the DDQ method, they were between 98.5% and 100.9%. Precision, indicated by RSD values, was within 1.2% to 1.6% for CLA and 1.3% to 1.8% for DDQ. These results support the reliability of these MW-SPMs for regular PGT analysis.
The Robustness and ruggedness of the proposed MW-SPMs for the determination of PGT via the formation of CTCs with CLA and DDQ.
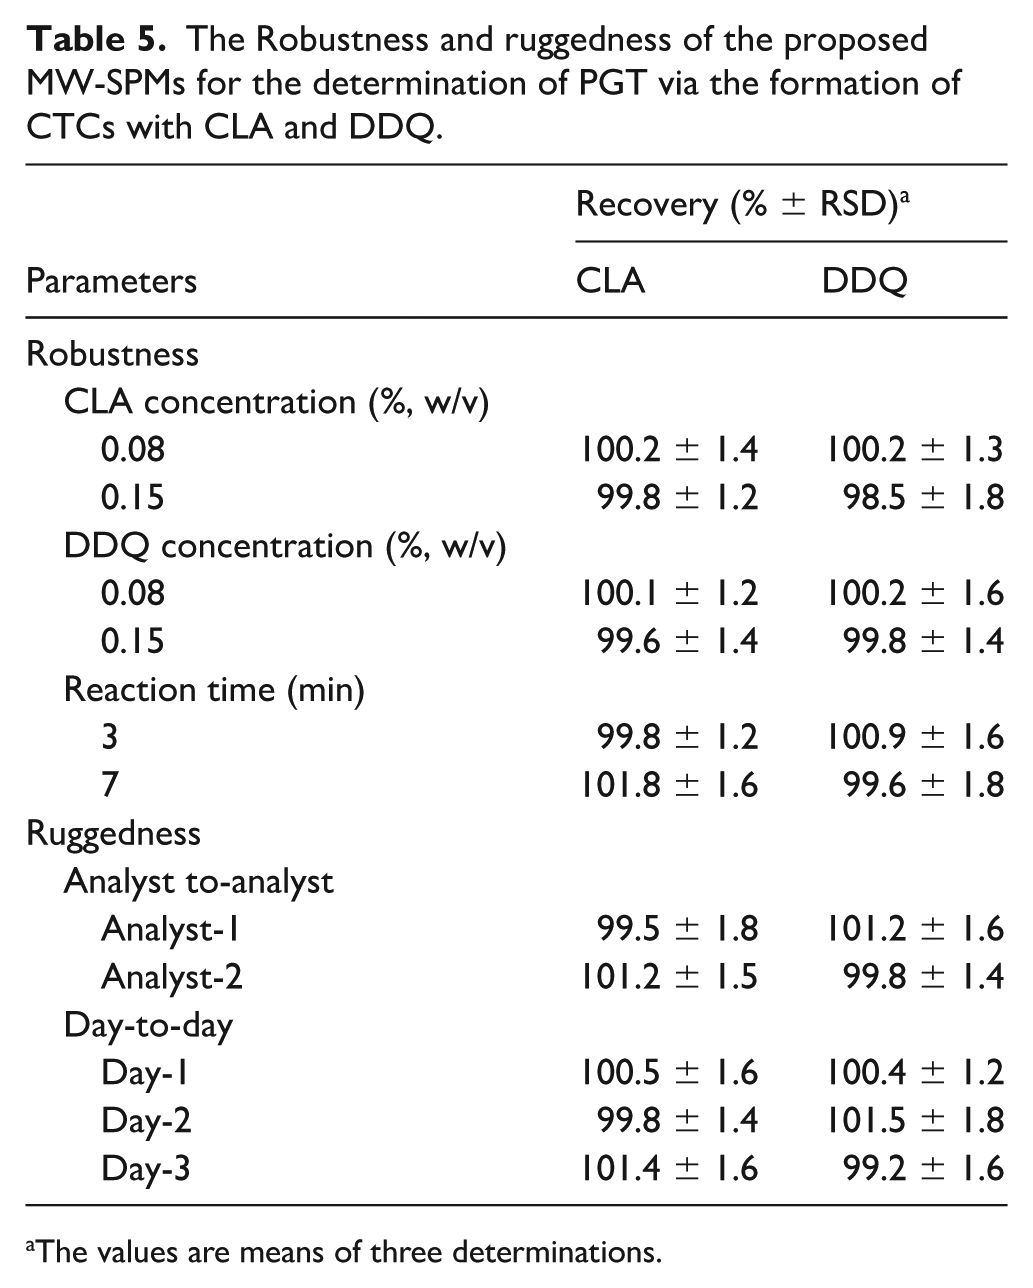
The values are means of three determinations.
The ruggedness of the methods was confirmed by having two analysts independently conduct the procedures over three separate days. The consistency of the results, with RSD not surpassing 1.8% for both CLA and DDQ methods, highlights the methods’ reproducibility and reliability, regardless of the analyst or day of execution.
Analysis of Pemazyre® tablets and content uniformity testing
The validation outcomes affirmed the effectiveness of the MW-SPMs for quantifying PGT in Pemazyre® tablets. These methods were utilized to measure PGT levels in tablets at specified concentrations. According to Table 6, the average label claim percentages were found to be (100.4% ± 0.9%) and (99.6% ± 1.2%), for the interactions with CLA and DDQ, respectively. Such high percentages validate the MW-SPMs’ capability for the accurate and precise quantification of PGT in Pemazyre® tablets.
Applications of MW-SPMs for the quantitation of PGT in Pemazyre® tablets via formation of CTCs with CLA and DDQ.

Average of three determinations.
To confirm the reliability of analysis in terms of accuracy and precision, we have conducted a comparative analysis using a previously reported validated method (microwell spectrofluorimetric method) 3 as a reference method to determine the concentration of PGT in the same tablet sample. 43 The mean label claim percentage was found to be 101.8% ± 1.5%. This result was statistically compared with those obtained by the proposed methods involving CLA and DDQ. The comparison was performed using t- and F-tests to evaluate any significant differences in accuracy and precision, respectively. The calculated t-values were found to be 1.3862 and 1.9837 for CLA and DDQ methods, respectively. These values were lower than those of the tabulated t-values (1.4000 and 2.200, respectively) at a 95% confidence level. These results indicate that there is no significant difference between the results of our developed methods and the reference method at a 95% confidence level. This confirms that our methods are accurate for the determination of PGT. The F-test values were also calculated and found to be 2.7778 and 1.5625 for CLA and DDQ methods, respectively. These values were smaller than the tabulated F-value (9.28) at their respective degree of freedom (3) at the 95% significance level, indicating no significant difference in the precision of both CLA and DDQ methods with the reference method. In addition, the interval hypothesis test was applied to the data. It was found that the p-values (0.5294 and 0.7805 for CLA and DDQ methods, respectively) were larger than the significance level of both methods, indicating the acceptance of the hypothesis.
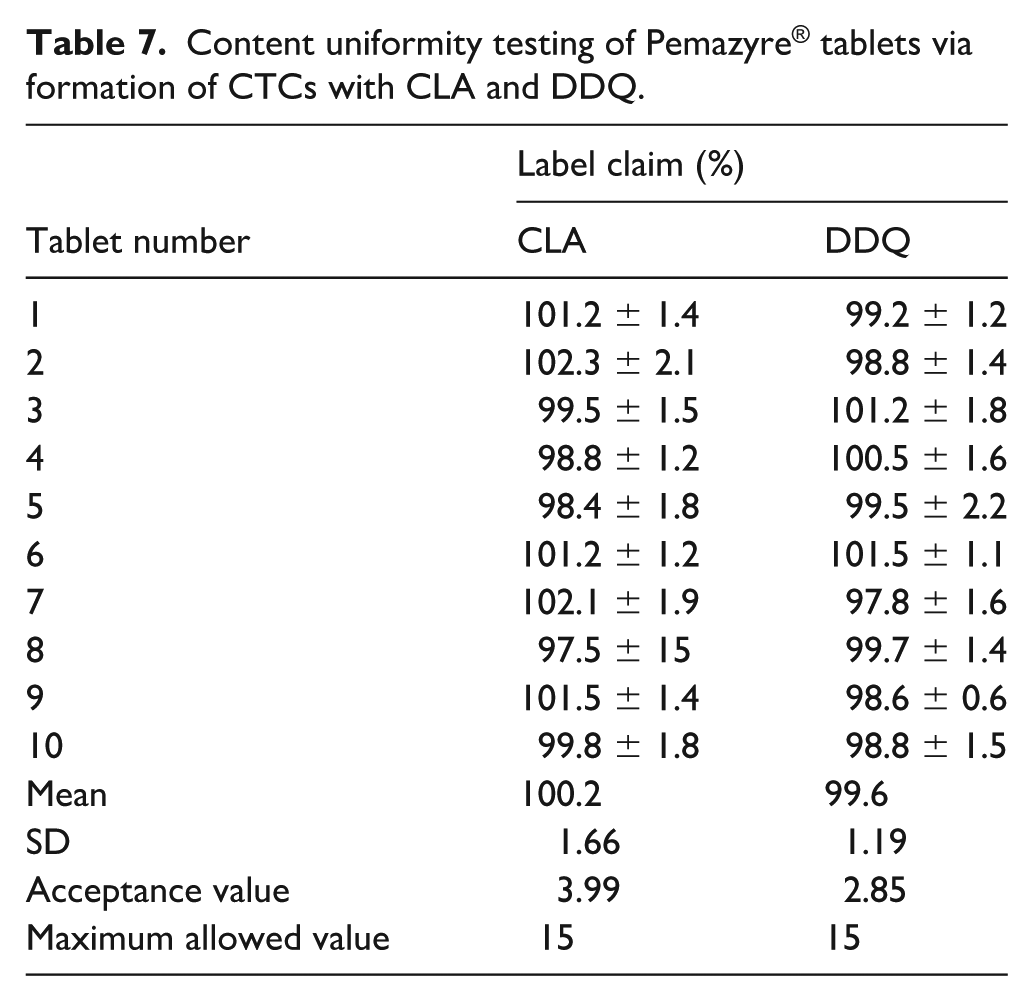
In the content uniformity test, each of the 10 tablets was assessed separately using the CLA and DDQ methods to determine their PGT content. The resulting acceptance values were 3.99 and 2.85 for CLA and DDQ methods, respectively (Table 7). These values are below the maximum allowable value of 15, which substantiates the consistent uniformity of PGT content across the tablets.
Content uniformity testing of Pemazyre® tablets via formation of CTCs with CLA and DDQ.
Eco-friendliness/greenness of MW-SPMs
Typically, microwell methods, assisted by microplate readers, are in line with Green Analytical Chemistry (GAC) due to their scaled-down analytical procedures. These methods require less sample and reagent volumes, leading to lower waste production than traditional methods. The eco-friendliness of the proposed MW-SPMs was gauged using three comprehensive tools: AES, 19 GAPI, 20 and AGREE. 21 Given that CLA and DDQ are chemically similar and the MW-SPMs share operational conditions, both methods underwent equivalent eco-friendliness/greenness evaluations.
The AES results, detailed in Table 8, show that using 100 µL of methanol solutions of PGT and reagent (CLA and DDQ) incurred a minimal penalty of 2 points. The total penalty points (PPs) for the hazardous nature of the chemicals (solvent and reagent) used were 6. No penalties were assigned for energy consumption or occupational hazards, as they met GAC standards. Waste generation and disposal received 1 and 3 points, respectively, due to the small amount of waste produced, which was not treated. The overall penalty points totalled 12, yielding an Eco-scale score of 88, indicating that the microwell-based methods are highly eco-friendly, as they scored well above the 75-point threshold for excellent environmental performance.
Analytical Eco-Scale for assessing the eco-friendliness of the proposed MW-SPMs for the determination of PGT via the formation of CTCs with CLA and DDQ.
The GAPI tool’s pictogram (Figure 9), which assesses 15 parameters across 5 categories, shows three parameters (1, 7, and 15) in red. Parameter 1 is red because sample collection/preparation was offline, parameter 7 is due to the use of methanol, and parameter 15 is for untreated waste. Parameters 5 and 6 are yellow, reflecting the assay’s quantitative nature and microscale extraction. The other parameters are green, complying with green procedure standards.
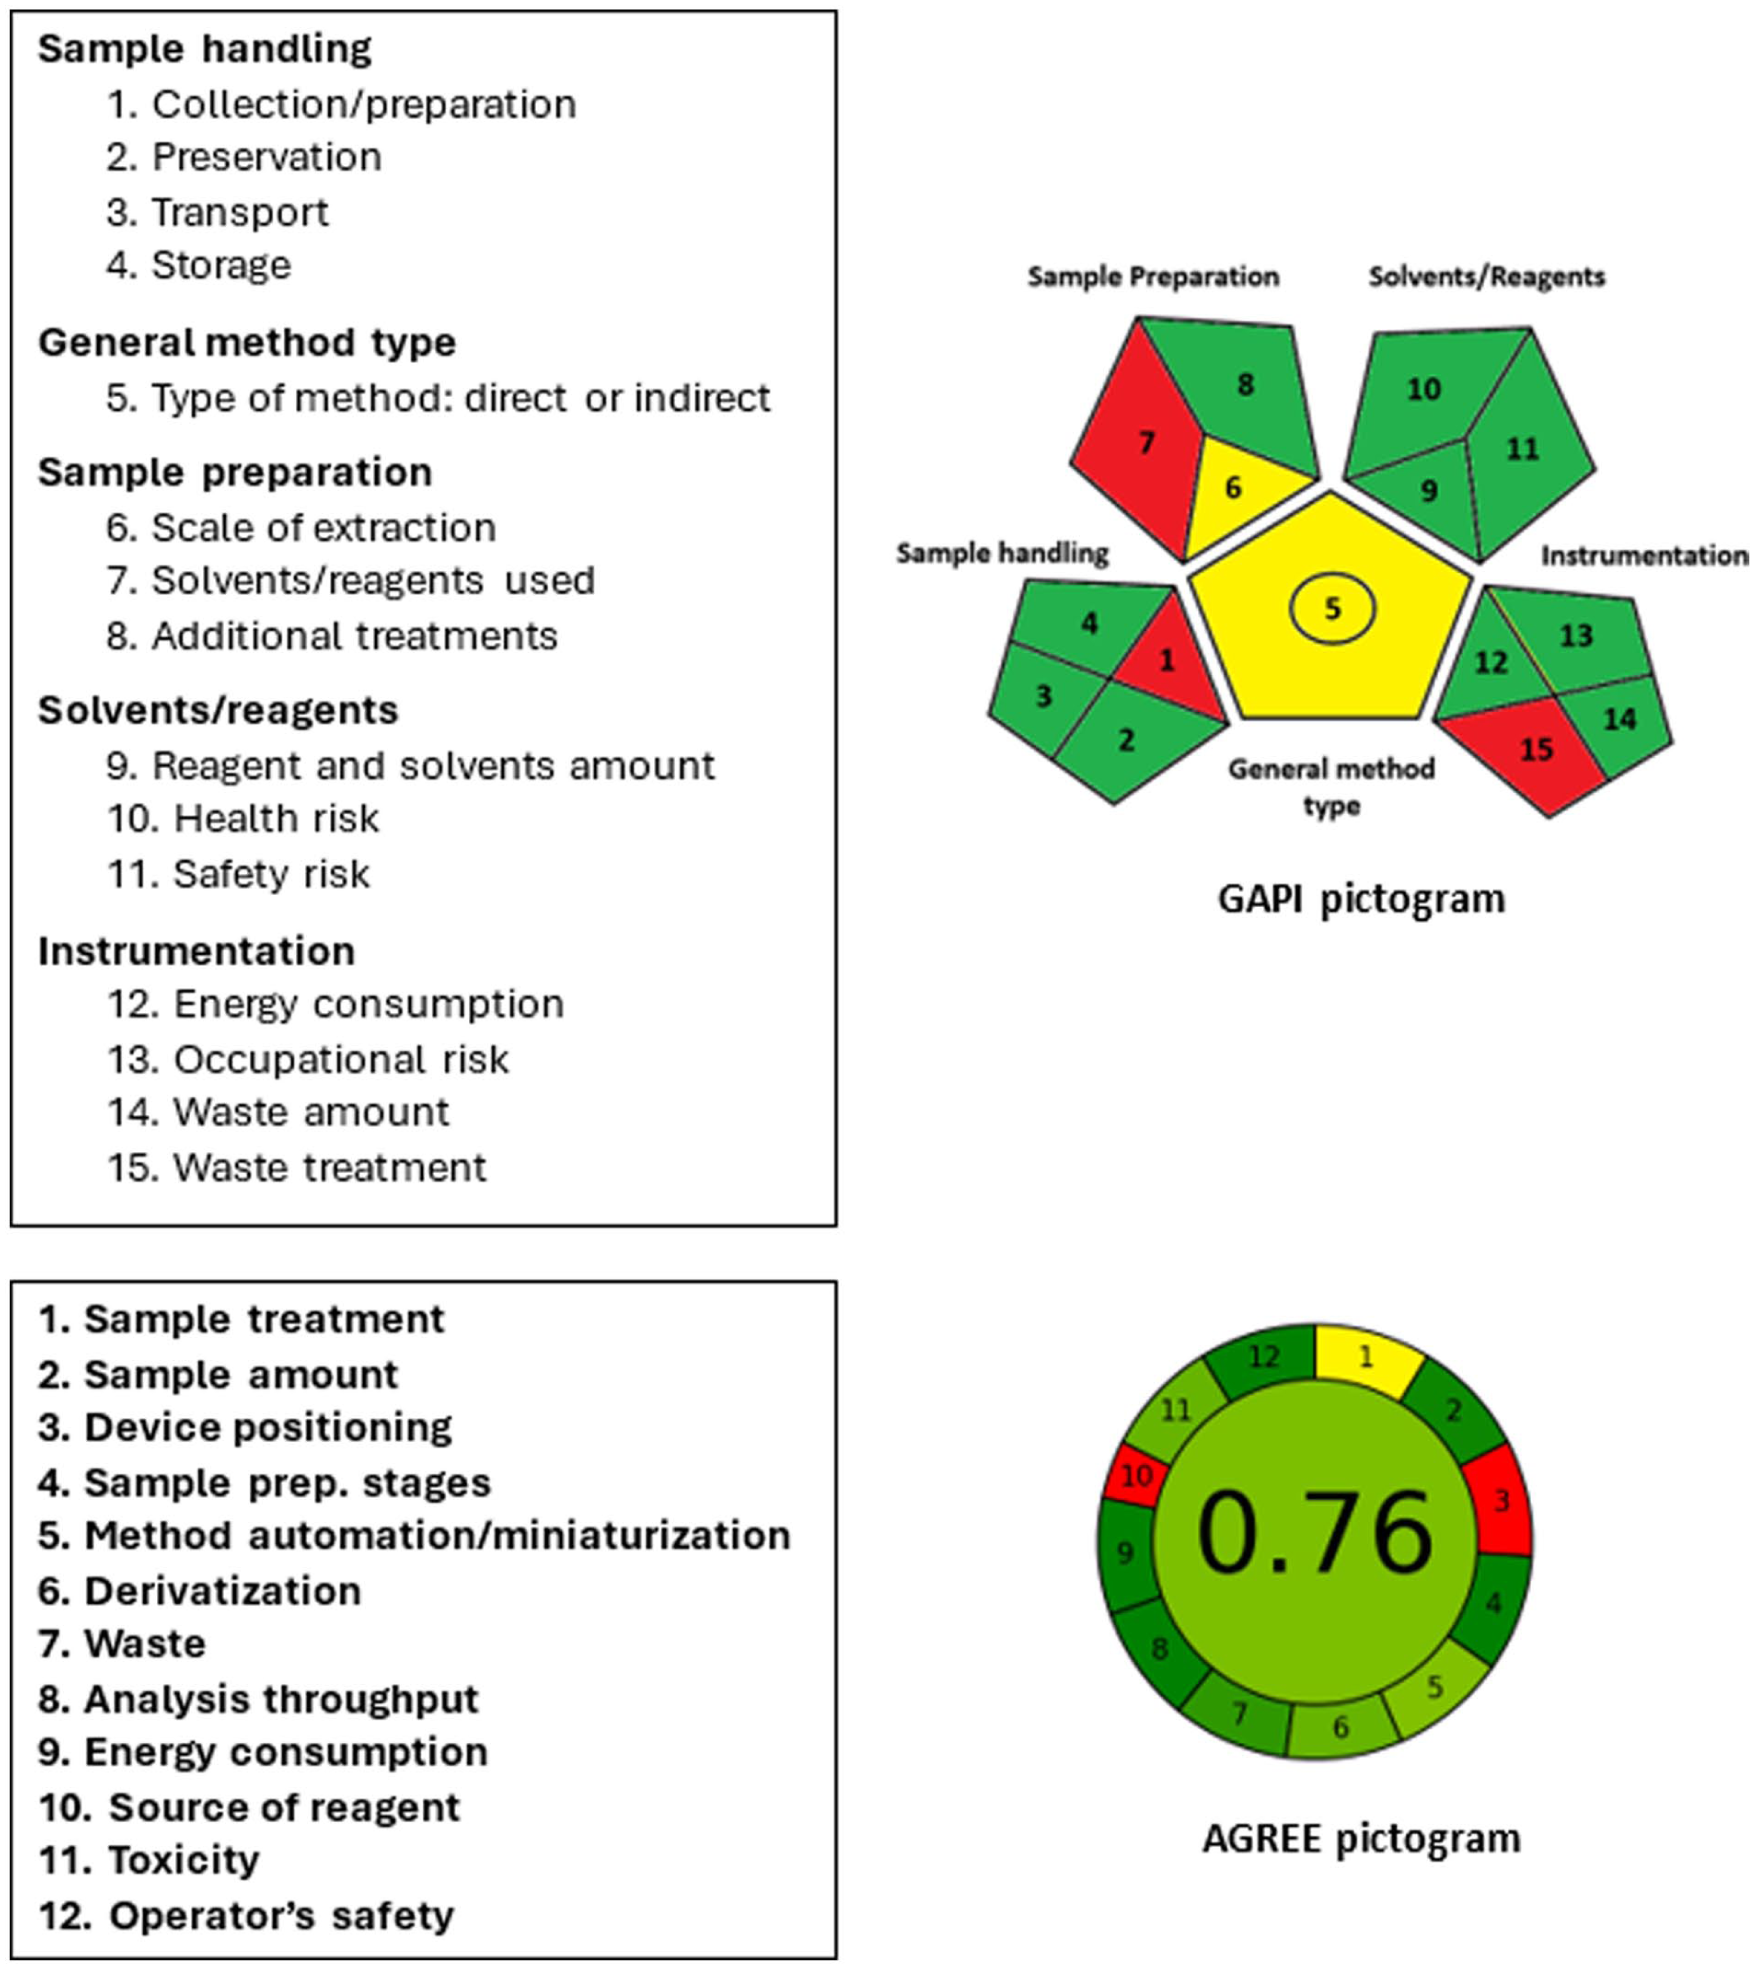
Results of GAPI and AGREE metric tools for assessment of the greenness of the proposed MW-SPMs for the determination of PGT.
The assessment results using the AGREE tool are shown in the pictogram given in Figure 9. Parameter 1, which refers to sample treatment, is highlighted in yellow because it was manually executed. Parameter 3, related to device positioning (online or offline), and parameter 10, associated with the reagent source, are both represented in red. The analysis was conducted offline using a plate reader, and CLA and DDQ were used as a chemical source of reagents. The remaining parameters are indicated in green. The overall score achieved is 0.76 out of 1, indicating a high degree of greenness for the methods.
To summarize, the results obtained from the three assessment tools offer conclusive evidence regarding the environmentally friendly and greenness nature of the proposed MW-SPMs for PGT. These results also demonstrate their adherence to the principles of GAC.
High throughput of MW-SPMs
Microwell-based techniques are highly recommended in pharmaceutical analysis for their capacity to concurrently analyze and handle numerous individual samples with great efficiency. In assessing the throughput of the proposed MW-SPMs, analysts used 96-well plates with a designated reaction time of 5 min for both CLA and DDQ. It was practical for an analyst to process at least 5 plates together in a batch. This setup allowed for the processing of 2880 samples every hour, calculated as 5 plates × 96 wells × 5 rounds h−1. The processing of such a number of samples imposes the high-throughput characteristic to these microwell methods. Moreover, throughput can be further increased by using plates with more wells—384, 1536, or 3456—and by incorporating automated machinery or robotic systems. These enhancements can substantially boost throughput, facilitating the analysis of an even greater number of samples in the same amount of time.
Conclusion
UV-Vis spectrophotometric studies proved the formation of CTCs between PGT and CLA or DDQ, with molar ratios of 1:1. The association constant of the CTCs and other electronic properties indicated the ease of complex formation and its stability. Computational calculations suggested the likely interaction site on the PGT molecule for CTCs formation with CLA and DDQ and a π→π* single-electron transfer mechanism. These CTCs have unique absorption bands at 530 nm for CLA and 465 nm for DDQ complexes. The emergence of these colored CTCs laid the groundwork for developing the first two MW-SPMs to analyze PGT in its tablets. The developed methods were optimized, refined, and validated according to ICH criteria. The methods showed a linear response for PGT concentrations ranging from 10 to 250 μg well−1 for CLA, and 5 to 150 μg well−1 for DDQ. The quantitation limits were 25.7 and 12.4 µg well−1 for CLA and DDQ methods, respectively. Noticeably, the established approaches represent the first study exploring the CTCs of PGT with CLA and DDQ and its employment in the development of sustainable microwell-based spectrophotometric methods for PGT analysis. These methods have numerous merits, involving high-throughput capabilities, permitting the analysis of several samples within a short time, and adherence to the GAC principles. To conclude, the developed methods pave the way to a valuable and sustainable tool for ensuring the quality assurance of PGT tablets.
Footnotes
Acknowledgements
The authors extend their appreciation to the Ongoing Research Funding program (ORF-2025-1167), King Saud University, Riyadh, Saudi Arabia, for funding this work.
Author contributions
N.M.H. and M.S.A. contributed equally to the study conception and design, methodology, formal analysis and investigation, data collection and analysis; Computational analysis was performed by A.F. Writing—original draft preparation was performed by M.S.A. and I.A.D. The writing—reviewing and editing of the revised manuscript were done by all authors. Funding acquisition, resources and supervision of the manuscript were done by I.A.D. All authors read and approved the final manuscript.
Ethical considerations
Not applicable.
Consent to participate
Not applicable.
Consent for publication
Not applicable.
Funding
The authors disclosed receipt of the following financial support for the research, authorship, and/or publication of this article: The Ongoing Research Funding Program (ORF-2025-1167), King Saud University, Riyadh, Saudi Arabia
Declaration of conflicting interests
The authors declared no potential conflicts of interest with respect to the research, authorship, and/or publication of this article.
Data availability statement
The study data and materials are available with the corresponding author on a reasonable request.