
Abstract
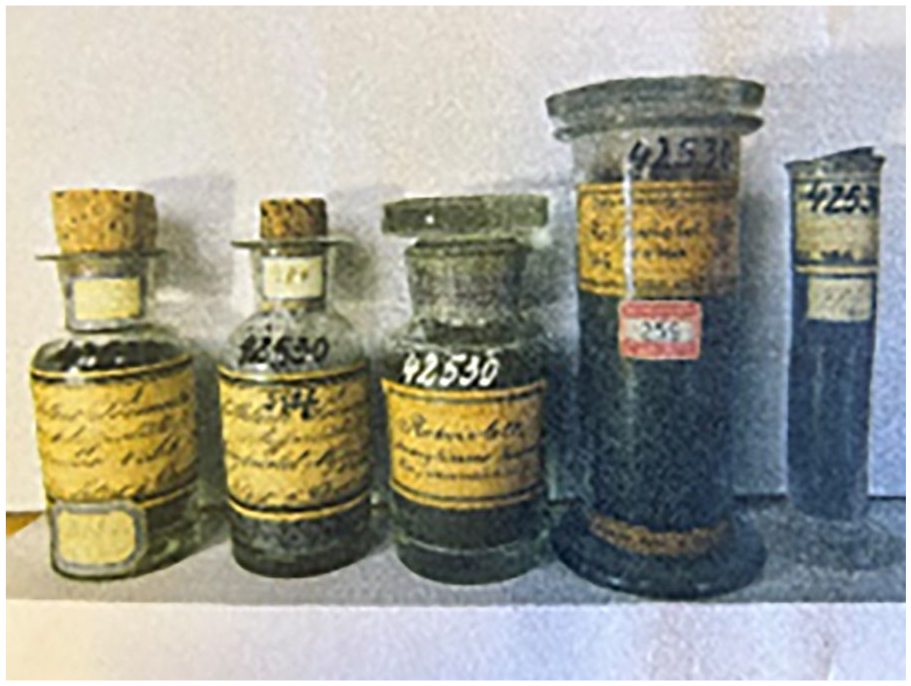
Five historical green dyes from the Historische Farbstoffsammlung, Technical University of Dresden, have been analysed by liquid chromatography – mass spectrometry (LC-MS). The dyes were determined to be formed by the alkylation of either crystal violet or rosaniline and contained both doubly and singly charged ions. One sample had a spread of higher molecular weight doubly charged ions reminiscent of the alkylation of a Hofmann violet. Malachite green was the dye present in one sample.
Introduction
The beginning of industrial organic synthesis was led by Perkin 1 mauveine in 1856 then F-E Verguins fuchsin (or rosaniline) in 18592–6 followed by Hofmann’s 7 and Lauth’s8,9 violet dyes in the 1860s. The dye and its transformations of interest in this paper is fuchsin or rosaniline since alkylation, by heating with methyl bromide or iodide, gives first a violet dye 10 but this can be also alkylated to a green dye.11–14 According to the account given by Fox, 11 Albert Chatelaine improved the work of the Read Holliday & Sons 15 patent and used pure methyl violet (crystal violet) as starting material in place of rosaniline to give methyl green. The Colour Index describes Holliday’s methyl green as ethylhexamethyl-para-rosaniline bromide. 11 According to Perkin, in the preparation of Hofmann’s violet from the alkylation of rosaniline, a valuable green dye was isolated which was supplied to dyers as iodine green.12,13 The process was improved by Keisser12,13 in France. A number of marketed green dyes remain obscure. These include aniline green, 16 aldehyde green, 17 Paris green, or Lauth’s 18 green. Malachite green came later in 1878 and was made from 1,1,1-trichloromethylbenzene, N,N-dimethylaniline, and AlCl3. 19 Perkin12,13 green was described but no patent reference has been found. The historic green dyes studied in this paper were prepared from rosaniline2–6 (Figure 1) or crystal violet20,21 by alkylation with methyl or ethyl bromide or iodide either in the 19th century or early 20th century.

Molecular structure of fuchsin or rosaniline homologues.
Discussion
Five methyl green dyes from the museum collection in Dresden were analysed by liquid chromatography – mass spectrometry (LC-MS). 22 Figure 2 shows the proposed molecular structures, chemical formulae, and molecular weights of doubly charged molecular ions. Figure 3 shows the proposed molecular structures, chemical formulae, and molecular weights of singly charged molecular ions. Some compounds occur repeatedly in more than one sample so the molecular structures are grouped together.

Proposed doubly charged green dyes.
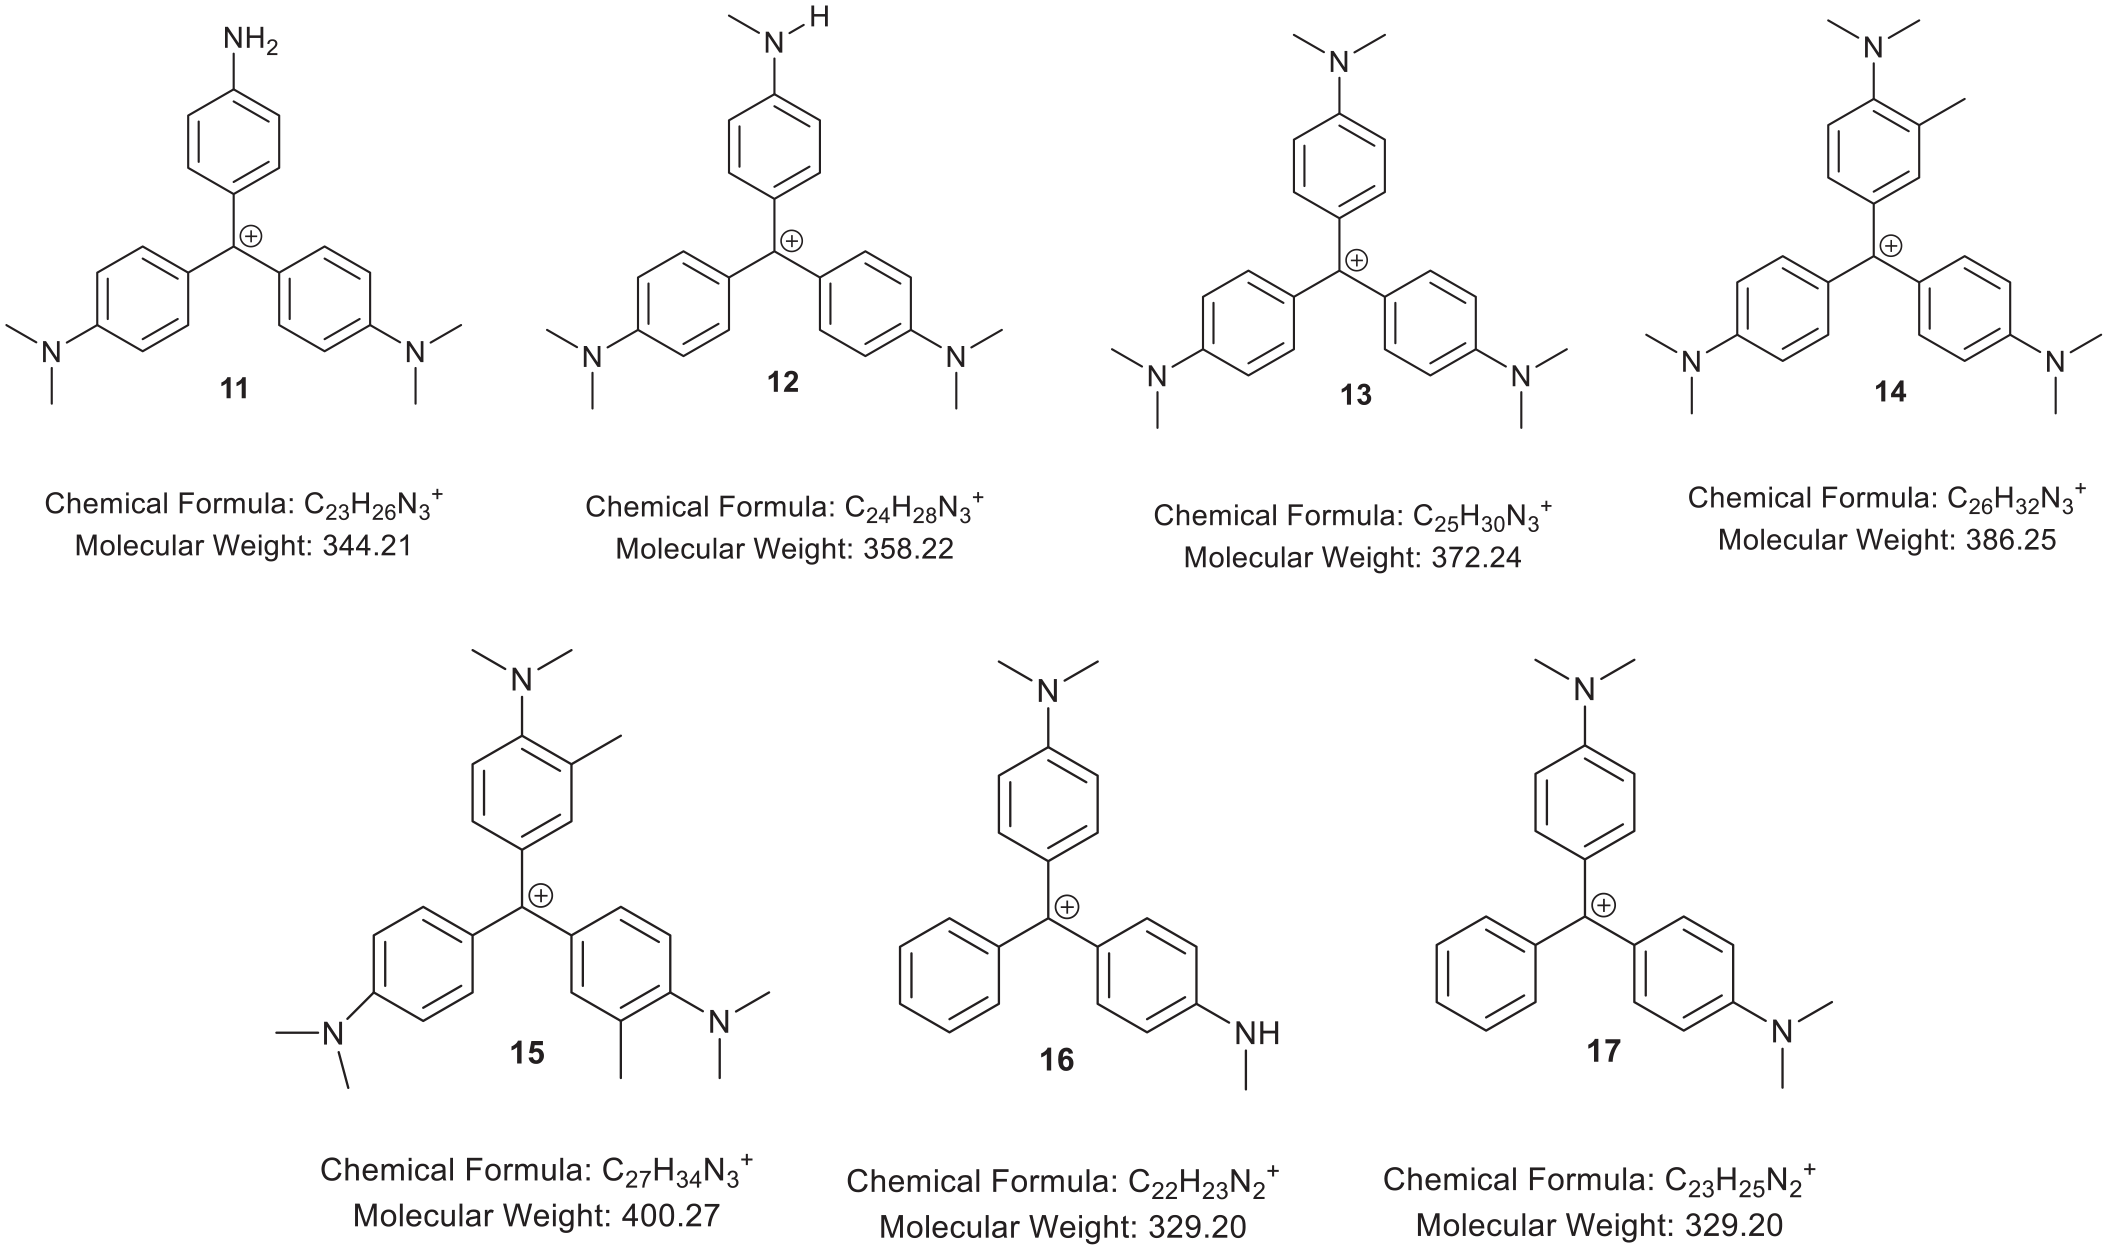
Proposed singly charged violet dyes (11-15) and green dyes (16-17).
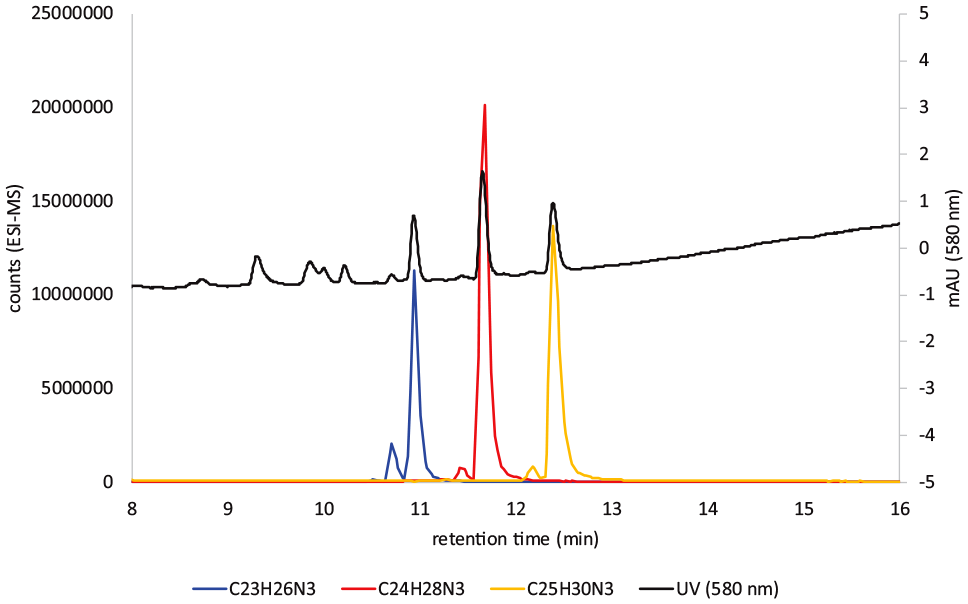
Sample 1: C.I. 42556; Jodgrün; Theodor Peters Chemnitz (derived from rosaniline)
The LC-MS chart of doubly charged ions is shown in Figure 4, and the data are summarised in Table 1. Three compounds were present, compounds

Sample 1: UV at 580 nm, EIC of M2+ ions for compounds
Mass spectral data for the compounds in Figure 4 which are doubly charged ions.


Sample 1: UV at 580 nm, EIC of M+ ions for compounds
Mass spectral data for the compounds in Figure 5 which are singly charged ions.

Sample 2: C.I. 42556; Jodgrün; unknown manufacturer (derived from rosaniline)
The LC-MS chart is shown in Figure 6, and the data are summarised in Table 3. This chart contains compound

Sample 2 UV at 580 nm, EIC of M+ ions for compounds
Mass spectral data for the compounds in Figure 6 which are singly charged ions.

Sample 3: C.I. 42585; Methylgrün; Theodor Peters Chemnitz (derived from a Hofmann violet)
The LC-MS chart is shown in Figure 7, and the data are summarised in Table 4. The chart has compounds

Sample 3: UV at 580 nm, EIC of M2+ ions for compounds
Mass spectral data for the compounds in Figure 7 which are doubly charged ions.


Sample 3: UV at 580 nm, EIC of M+ ions for compounds
Mass spectral data for the compounds in Figure 8 which are singly charged ions.

Sample 4: C.I. 42585; Lichtgrün gelblich; Merck
Does not show any meaningful data.
Sample 5: C.I. 42585; Methylgrün; Timmersdorf (derived from crystal violet)
The LC-MS chart of doubly charged ions is shown in Figure 9, and the data are summarised in Table 6. Three compounds

Sample 5: UV at 580 nm, EIC of M2+ ions for compounds
Mass spectral data for the compounds in Figure 9 which are doubly charged ions.

Sample 5 UV at 580 nm, EIC of M+ ions for compounds
Mass spectral data for the compounds in Figure 10 which are singly charged ions.

Conclusion
Five samples of green dyes from the Historische Farbstoffsammlung, Technische Universität Dresden, Dresden, were analysed by LC-MS. These green dyes were originally noted by Perkin12,13 as a side product in vats for alkylating rosaniline to make violet dyes. The dyes were determined to come from the methylation or ethylation of either rosaniline or crystal violet. The use of crystal violet gives a purer product. Although crystal violet is a purer starting material than an alkylated rosaniline, the analysis of by-products with the main dye suggests that partial demethylation of crystal violet or N,N-dimethylaniline with AlCl3 occurred in the synthesis. Sample 1 is methylhexamethyl-para-rosaniline. Sample 2 is malachite green. Sample 3 is methylhexamethyl-para-rosaniline, ethylhexamethyl-para-rosaniline and related homologues. A likely synthesis is the alkylation of rosaniline to a Hofmanmn violet then further alkylation because the product is a mixture of doubly charged ions. Sample 4 is not a soluble, organic green dye like these. Sample 5 is methylhexamethyl-para-rosaniline. In these studies, samples of Paris green 18 and Aldehyde green were not present.16,17 However, sample 4 is green and pigmentary so might be a different like one of these whose structures are less clear and possibly polymeric.
Experimental
Infrared (IR) spectra were recorded on a diamond-attenuated total reflection (ATR) Fourier transform infrared (FTIR) spectrometer. Ultraviolet (UV) spectra were recorded using a Perkin Elmer Lambda 25 UV-Vis spectrometer with EtOH as the solvent. High-resolution mass spectra were obtained at the University of Wales, Swansea, using an atmospheric solids analysis probe (ASAP) (positive mode) instrument: Xevo G2-S ASAP. Melting points were determined on a Cole-Palmer Stuart microscope.
Methyl-green dyes from museum collection in Dresden
Sample 1: C.I. 42556; Jodgrün; Theodor Peters Chemnitz
Sample 2: C.I. 42556; Jodgrün; unknown manufacturer
Sample 3: C.I. 42585; Methylgrün; Theodor Peters Chemnitz
Sample 4: C.I. 42585; Lichtgrün gelblich; Merck
Sample 5: C.I. 42585; Methylgrün; Timmersdorf
LC-MS instrument
Separation: 5F-phenyl (Kintex) 150 *4.6 mm
Eluent A: 0.1% formic acid in water
Eluent B: 0.1% formic acid in methanol
Eluent C: 0.1% formic acid in acetonitrile
Gradient: 100% A, in 15 min 60% B+ 40% C, hold 10 min, reset
DAD-detection: 190 – 700 nm; 580 nm extracted
MS: Agilent 6546 q-TOF, positive mode, 4 kV capillary voltage, fragmentor 110 V, skimmer 1 45 V, auto MS/MS (extraction window 1.3 m/z, exclusion after 2 spectra, CID: 10, 20,40), reference masses enabled
Footnotes
Declaration of conflicting interests
The author(s) declared no potential conflicts of interest with respect to the research, authorship, and/or publication of this article.
Funding
The author(s) received no financial support for the research, authorship, and/or publication of this article.