
Abstract
To develop a better process for synthesizing sodium percarbonate and getting separation of the sodium salt, the equilibrium of the ternary system Na2SO4–H2O2–H2O and Na2CO3–H2O2–H2O at 5 °C was determined using the isothermal method, and the appropriate synthesis conditions for sodium carbonate from a theoretical perspective was discussed. The Na2SO4–H2O2–H2O system phase diagram contains one co-saturated point of Na2SO4·0.5H2O2·H2O and Na2SO4·10H2O. The Na2CO3–H2O2–H2O system phase diagram contains three crystal zones: Na2CO3·10H2O crystallization field, 0Na2CO3·1.5H2O2·H2O crystallization field and Na2CO3·2H2O2·H2O crystallization field. According to the phase diagram, the suitable raw material ratio of sodium percarbonate synthesis was obtained, to get the maximum of product yield, the optimal mass ratio of Na2CO3 to 30% H2O2 is 0.609.

Introduction
In the process of producing aluminum oxide by the Bayer process, various carbonate minerals (Ca2CO3, Ca2CO3·Mg2CO3) exist in the raw materials (bauxite, limestone, and alkali).1–3 They are easily decomposed during leaching, which can convert sodium hydroxide produced in the production process into sodium carbonate. Due to the effect of air agitation, sodium aluminate in the solution is acidified by CO2 in the air to generate a large amount of sodium carbonate, which accumulates significantly, and most of the red mud that cannot be digested by the sintering method will be stacked after mixed conveying, resulting in a significant increase in alkali consumption. The presence of sulfur elements in bauxite and the use of alkali and water materials cause the concentration of chloride and sulfate ions in the solution to gradually increase. As the solution concentration increases, the solubility of sodium carbonate and sodium sulfate decreases sharply.4–6 Therefore, during the process of mother liquor evaporation, sodium carbonate and sodium sulfate will crystallize and precipitate due to the sharp decrease in solubility, and the accumulation of a large amount of sodium salt crystals will mainly be discharged with the red mud, making it impossible for them to be reasonably utilized and separated, becoming a major common problem faced by the Bayer process for producing aluminum oxide. Each ton of aluminum oxide produced generates 1–1.8 tons of red mud, and global production of 6
Considering that there is a high content of sodium carbonate in the red mud, synthesizing and preparing sodium percarbonate has become a reasonable choice for its utilization. Sodium percarbonate, as a new type of oxygen-based bleach, consists of Na2CO3 and a certain concentration of H2O2.7,8 It is non-toxic and does not cause any irritation under dilute conditions, making it environmentally friendly in practical applications. At the same time, sodium percarbonate in solution can easily decompose into sodium carbonate and H2O2. H2O2 can continue to react in an alkaline solution, producing water and oxygen, showing significant bleaching characteristics. In addition, sodium percarbonate is non-toxic and harmless, and can maintain the original color of fabrics. Therefore, it is extremely effective in synthetic fiber washing, tableware and food disinfection, fresh-keeping fruits, and sewage treatment, and has significant application effects.
Depending on the manufacturing method of sodium percarbonate, the product form and specifications will differ. The preparation methods are mainly divided into dry and wet methods. The dry synthesis method involves the rapid formation of sodium percarbonate crystals by mixing anhydrous sodium carbonate and high-concentration H2O2 together in a short period of time. A potential drawback of this method is that heat generation during the reaction can cause decomposition of H2O2, leading to a loss of active oxygen and reduced product purity. In addition, the product has poor flow properties, and the method involves high energy consumption and equipment pollution, so its use in industrial production is limited. The wet method involves saturating a sodium carbonate solution with a 30% H2O2 solution and reacting the two components at an appropriate temperature to generate sodium percarbonate. The resulting product is further processed through crystallization, separation, and drying to obtain the final product. The wet method is advantageous, in that, it is easy and simple to operate. Other wet methods that are currently widely used include solvent method, spray drying, and salt precipitation. However, it leads to certain levels of decomposition loss of H2O2 and sodium percarbonate at the high temperature during reaction, crystallization and drying, resulting in low product quality and stability. In addition, the high energy consumption and equipment pollution are also limiting factors for this method, which is usually used for small-scale production. To obtain the phase equilibrium data of the quaternary system, the ternary subsystems included in the system must first be conducted. In this study, the equilibrium data of the ternary system Na2SO4–H2O2–H2O and Na2CO3–H2O2–H2O at 5 °C was determined using the isothermal method, and the appropriate synthesis conditions for sodium carbonate from a theoretical perspective was discussed. 9
Results and discussion
The phase equilibrium of ternary system Na2SO4–H2O2–H2O at 5 °C
The phase equilibrium data obtained from the experimental study of the ternary system are presented in Table 1, and a detailed diagram based on these data can be found in Figure 1. In addition, the composition of the saturated residue was analyzed using infrared (IR) spectroscopy, as shown in Figure 2.
Phase equilibrium data of Na2SO4–H2O2–H2O ternary system at 5 °C.

G: Na2SO4·0.5H2O2·H2O; S10: Na2SO4·10H2O.
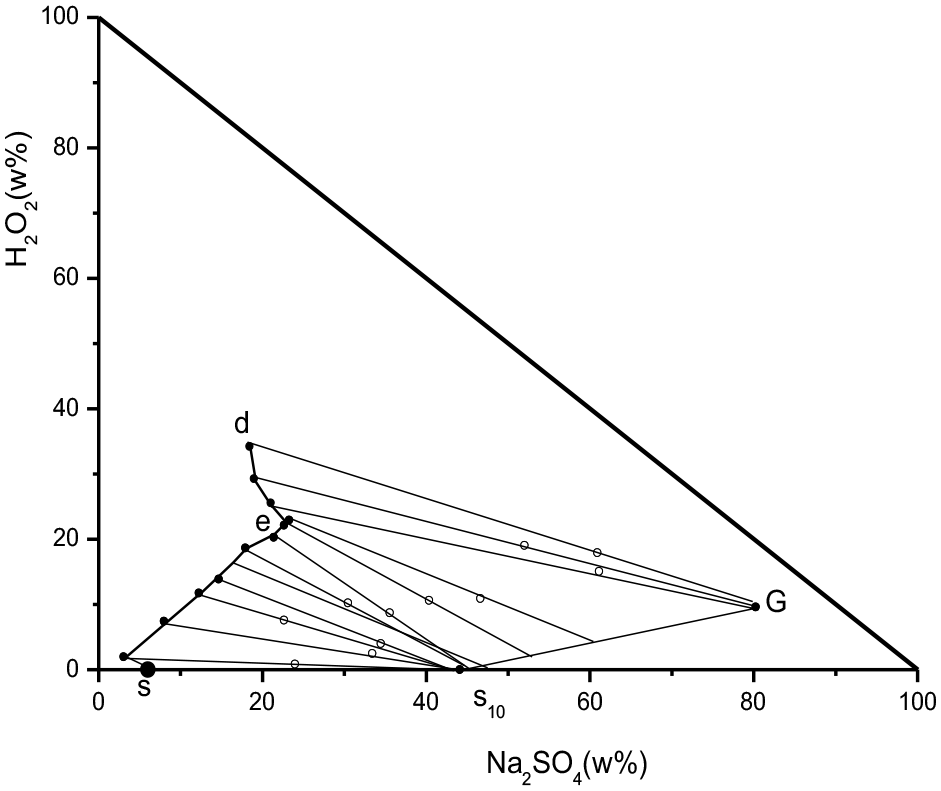
Phase diagram of Na2SO4–H2O2–H2O ternary system at 5 °C.

Infrared characterization of the co-saturation point of the Na2SO4–H2O2–H2O ternary system.
In the above figure, s10 represents the composition point of Na2SO4·10H2O, G represents the composition point of Na2SO4·0.5H2O2·H2O, and s point is the saturation solubility composition point of Na2SO4 at 5 °C, with a mass fraction of 5% for Na2SO4 obtained from literature. The ternary system has a common saturation point “e”, which is the common saturation of Na2SO4·10H2O and Na2SO4·0.5H2O2·H2O. There are two crystallization zones, s1se is the crystallization zone of Na2SO4·0.5H2O2·H2O, and eGd is the crystallization zone of Na2SO4·0.5H2O2·H2O.
According to the literature, the absorption peak at 2800–3600 cm–1 in the IR spectrum coincides with the O–H absorption peak of intra-molecular hydrogen bond coupling. The change in characteristic wave numbers is related to the amount of H2O2 in the sample. This region is caused by the stretching vibration of H2O2 and H2O. Since the measured sample is moist residue, it contains not only H2O2 but also a large amount of water. There is a weak absorption peak at 1390–1611 cm–1, which is the vibration absorption peak of intermolecular hydrogen bond H–O, caused by the bending vibration of H–O–O. This indicates that the sample contains an H–O–O bond. The absorption peak of the O–O stretching vibration at 877 cm–1 moves to a weak absorption at 981 cm–1 in the low-frequency direction in the IR spectrum of this moist residue.
The phase equilibrium of ternary system Na2CO3–H2O2–H2O at 5 °C
The experimental results of the phase equilibrium of the Na2CO3–H2O2–H2O ternary system are shown in Table 2, and the phase diagram is plotted in Figure 3.
Phase equilibrium data of the Na2CO3–H2O2–H2O ternary system at 5 °C.

B: Na2CO3·1.5H2O2·H2O; C: Na2CO3·2H2O2·H2O; N10: Na2CO3·10H2O.

Phase diagram of Na2CO3–H2O2–H2O ternary system at 5 °C.
The phase diagram of the system contains two eutectic points and three crystallization regions. Points A, B, and C represent the composition points of Na2CO3·10H2O, Na2CO3·1.5H2O2·H2O, and Na2CO3·2H2O2·H2O, respectively. Point “s” is the saturation solubility of Na2CO3 at 5 °C, and the mass fraction of Na2CO3 at saturation dissolution was found to be 8.67% according to the literature. e1 represents the eutectic point between Na2CO3·10H2O and Na2CO3·1.5H2O2·H2O, while e2 represents the eutectic point between Na2CO3·1.5H2O2·H2O and Na2CO3·2H2O2·H2O. The BE1E2 region is the crystallization region of Na2CO3·1.5H2O2·H2O, and the solid phase precipitated at any point in this region is sodium percarbonate. The CE2D region is the crystallization region of Na2CO3·2H2O2·H2O, and the solid phase precipitated at any point in this region is Na2CO3·2H2O2·H2O. The SE1D region is the crystallization region of Na2CO3·10H2O. The larger crystallization region of Na2CO3·1.5H2O2·H2O at this temperature indicates that sodium percarbonate is easier to be generated at this temperature.
Suitable conditions for the synthesis of sodium percarbonate based on the phase diagram of Na2CO3–H2O2–H2O ternary system
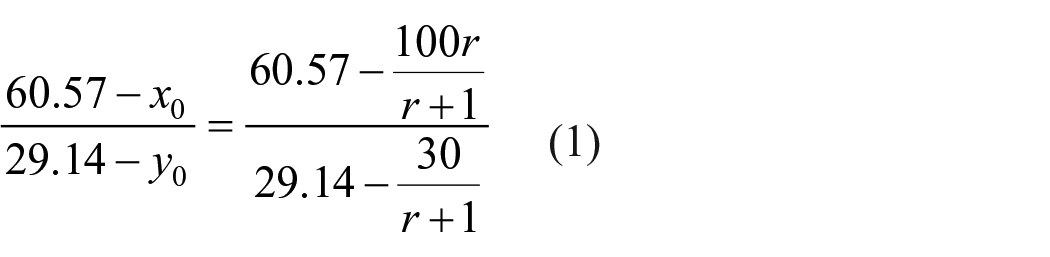
According to the phase diagram Figure 3, the suitable conditions for synthesizing sodium percarbonate at 5°C are discussed. The calculation analysis is shown in Figure 4. Since the H2O2 used is mostly low-concentration aqueous solution, to increase the concentration of H2O2 and the yield of sodium percarbonate, only Na2CO3 and H2O2 aqueous solution are used as input materials. With 1 kg of 30% H2O2 as the feeding benchmark, the feed point must be on the NH line, and the NH line equation is given

Calculation and analysis of Na2CO3–H2O2–H2O ternary system phase diagram at 5 °C.
Set up the feed point is h (x, y), that is,
Assuming that the mass of produced solid sodium percarbonate is w (kg), according to the conservation of mass of sodium carbonate, there are

Yield of the product sodium percarbonate

By solving the set of equations mentioned above, the values of r, w, and η of any liquid-phase composition point (x0, y0) on the solubility curve of sodium carbonate can be obtained. The results of sodium carbonate yield of different liquid-phase composition points and the corresponding feed material ratios are summarized in Table 3. It can be concluded that, when the sodium carbonate yield reaches its maximum at 5 °C, the formula ratio r is 0.609, and the sodium carbonate yield is 91.29%.
Different formula points and corresponding product yields at 5 °C.

According to the literature, 10 the feed mass ratio (Na2CO3: 30% H2O2) for the maximum yield of synthesizing sodium percarbonate at 25 °C is 0.661, with a product yield of 78.46%. It can be seen that there is an optimal formulation ratio for the reaction at a certain temperature. The optimal formulation ratio varies at different reaction temperatures, and the maximum yield obtained is also different. Lower reaction temperatures are more conducive to improving the yield of sodium percarbonate. Therefore, the reaction should be conducted at a lower temperature, and the feedstock ratio should be controlled to ensure the maximum product yield in production.
Sodium salt separation using the Na2CO3–Na2SO4–H2O ternary phase diagram
The phase equilibrium data of the ternary subsystem Na2CO3–Na2SO4–H2O in the quaternary system studied in this article were obtained from both literature and experiments, 11 and the phase diagram was plotted as shown in Figure 5.

Phase diagram of the Na2CO3–Na2SO4–H2O ternary system at 5 °C.
In Figure 5, s10 represents the point of Na2SO4·10H2O substance composition. N10 represents the point of Na2CO3·10H2O substance composition. Points s and n are the points of saturation solubility of Na2SO4 and Na2CO3 at this temperature, respectively. Point E is the point of co-saturation of Na2SO4·10H2O and Na2CO3·10H2O. ess10 is the crystalline zone of Na2SO4·10H2O, and nN10 e is the crystalline zone of Na2CO3·10H2O.
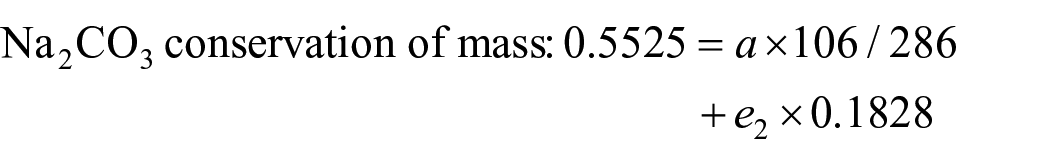
The chemical composition of red mud of Bayer process from an alumina plant was analyzed to obtain the sodium salt content in the red mud, in which the Na2CO3 content was 55.25%. The Na2SO4 content was 16.23%, and the NaCl content was 0.154%. The H2O content was 27.75%, and a small amount of filtered metal impurities were also contained. Since the content of NaCl and metal impurities in this red mud is very small. Only the separation of two salt components, Na2CO3 and Na2SO4, are considered in the phase equilibrium separation study. The analytical calculation procedure is shown in Figure 6.
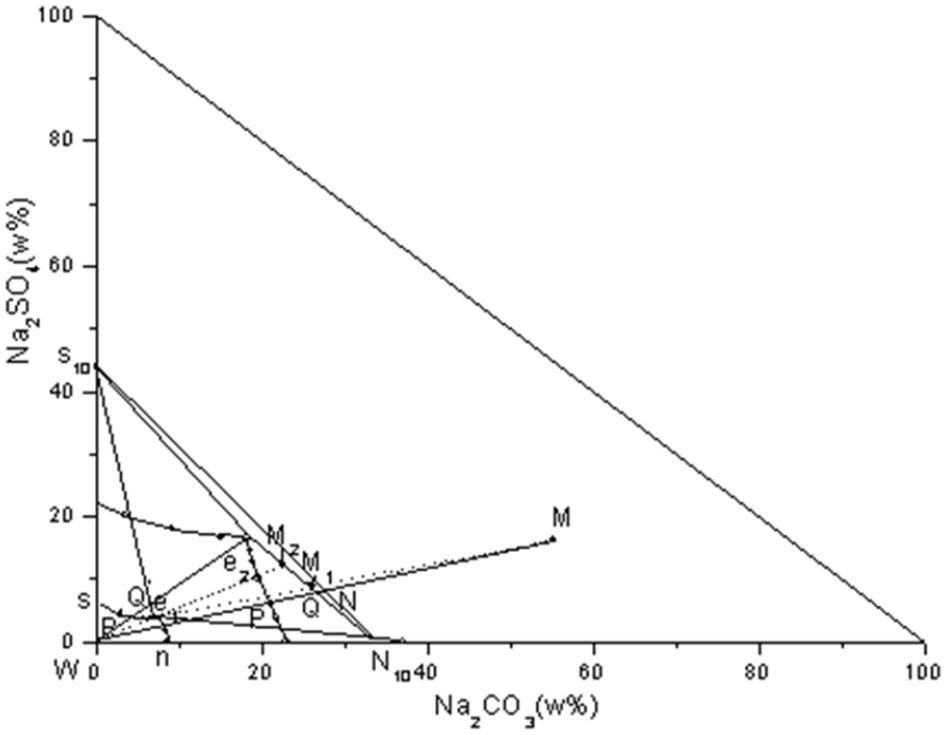
Phase diagram analysis of Na2CO3–Na2SO4–H2O system at 5 and 25 °C.
Figure 6 shows the phase diagram of the ternary system Na2CO3–Na2SO4–H2O at low temperatures of 5 and 25 °C. In Figure 6, there are Na2SO4·10H2O and Na2CO3·10H2O co-saturation points e1 and e2. No complex salts were generated at this temperature. Ss10e is the crystalline zone of Na2SO4–10H2O. nn10e is the crystalline zone of Na2CO3·10H2O, and s10 N10e is the zone where the two solid phases coexist. Point M is the red mud sample composition point (55.25, 16.23), which is in the all-solid-phase zone, solid-phase dehydrated state. So, water was added to it to N to dilute the sample. Reaching the point N is close to the Na2CO3·10H2O crystallization zone at 25 °C. Therefore, water is added to the sample at 25 °C, so that, the system point extends the motion of the MW line and enters the Na2CO3·10H2O crystallization zone. The N → Q stage is in the co-dissolution zone of Na2CO3·10H2O and Na2SO4·10H2O, with the liquid phase e2. The addition of water to the point Q dissolves all the Na2SO4·10H2O in the sample. The system point arrives at the N10 crystallization zone, which is in the full solid-phase zone, with solid-phase dehydration. The Na2CO3·10H2O solid phase is obtained more fully. If the mother liquor e2 at the Q point is directly cooled to 5 °C, it can be seen that the e2 point is still in the zone of co-precipitation of Na2CO3·10H2O and Na2SO4·10H2O at 5 °C, which will lead to the impurity of the obtained product. Therefore, before cooling, continue to add water to the e2 point to the Q’ point. Then, cool it to 5 °C, and it can be cooled after the cooling of the largest amount of S10. The mother liquor e1 was obtained after separation. In summary, the analysis of the 25 °C with the addition of water to dissolve the sample to get the largest amount of Na2CO3·10H2O, the mother liquor diluted and cooled to 5 °C to get the largest amount of Na2SO4·10H2O.
For the volume calculation of the above graph, using 1 kg of sample M as the basis for the calculation, let the amount of water added to the point Q at 25 °C be w1 kg, to obtain N10 product mass of a. The mass of the mother liquor is e2.
Then, the total material is conserved:

Solve for
Let the amount of water added to dilute the mother liquor be w2, the mass of the product S10 obtained after cooling and separation be b. The mass of the mother liquor be e1.
Then, there is total material conservation:


Solve


After cooling and separation, the mother liquor e1 still contains Na2CO3 and Na2SO4, which should be reasonably utilized to improve the yield of the product. From the above figure, it can be seen that e1 point is in the unsaturated zone of 25 °C phase diagram, indicating that the mother liquor still has the ability to dissolve salt at this temperature. Therefore, consider using the mother liquor e1 instead of water to dissolve the raw materials. Through the analysis of the diagram, it can be seen that the optimal dosage point for the intersection of the line of e1M and N10e2 of the intersection point M1. Calculate the quality of the mother liquor e0.
The remaining 1.296 kg of mother liquor was calculated and analyzed as follows:
Evaporated water w3 = 0.9116 kg
After evaporation of water, the product N10 is obtained in the amount of a1 = 0.03705 kg.
Amount of mother liquor e2: e2 = 0.3474 kg
For mother liquor e2 dilution water addition w4 = 0.6324 kg
After cooling, the product S10 is separated and the amount of b1 = 0.05 kg.
Once again the amount of residual mother liquor e1 is 0.9298 kg


It can be seen that after the recycling of the remaining mother liquor e1, the recovery of both sodium salts can be improved. However, the amount of diluted water added during the whole process (1.856 + 0.6324 kg) is greater than the amount of water evaporated (0.9116 kg). There must be a solution generated. So, there will always be a mother liquor e1 in the system, the theory of the mother liquor can be evaporated several times, dilution, cooling, and separation to improve the recovery of sodium salt products as much as possible. However, taking into account the actual operation in production and the cost and other factors, the number of mother liquor circulation generally depends on the actual situation. The above analyses and calculations show that the theoretical guidance of using the ternary 5 and 25 °C phase diagram for production is feasible.
Conclusion
The phase equilibrium solubility data of the ternary systems Na2SO4–H2O2–H2O and Na2CO3–H2O2–H2O at 5 °C were determined by isothermal method and plotted as a phase diagram. The Na2CO3–H2O2–H2O system exists one point of co-saturation for sodium sulfate hydrate and Na2CO3·2H2O2·H2O co-saturation, and crystalline zones of the two solid phases were determined. The Na2CO3–H2O2–H2O system has two points of co-saturation, which are co-saturation of sodium carbonate hydrate and sodium percarbonate, and co-saturation of sodium percarbonate and Na2CO3·2H2O2·H2O. The crystallization zones of the three solid phases were determined and the crystallization zone of the sodium percarbonate solid phase was larger at this temperature. The optimum feed dosage mass ratio (Na2CO3:30% H2O2) for the synthesis of sodium percarbonate at this temperature was determined to be 0.609. The maximum yield of sodium percarbonate achieved at this time was 91.29%, which is greater than the maximum yield of the product at 25 °C documented in the literature. This indicates that the synthesis of sodium percarbonate is suitable to be carried out at low temperature.
According to the Na2SO4–Na2CO3–H2O ternary experimental data at 5 °C and literature data to draw phase diagram. Combined with the analysis of the phase diagram of the system at 25 °C, it was discussed that it was appropriate to use the solid phase of sodium carbonate hydrate precipitated by dilution at high temperature for red mud samples. The solid phase of sodium carbonate hydrate was then diluted and cooled to low temperature to obtain the solid phase of sodium sulfate hydrate. The remaining mother liquor can continue to leach red mud samples and be recycled. This increases the recovery of the solid phase and improves the degree of separation of the sodium salt from the sample.
Experimental
Materials
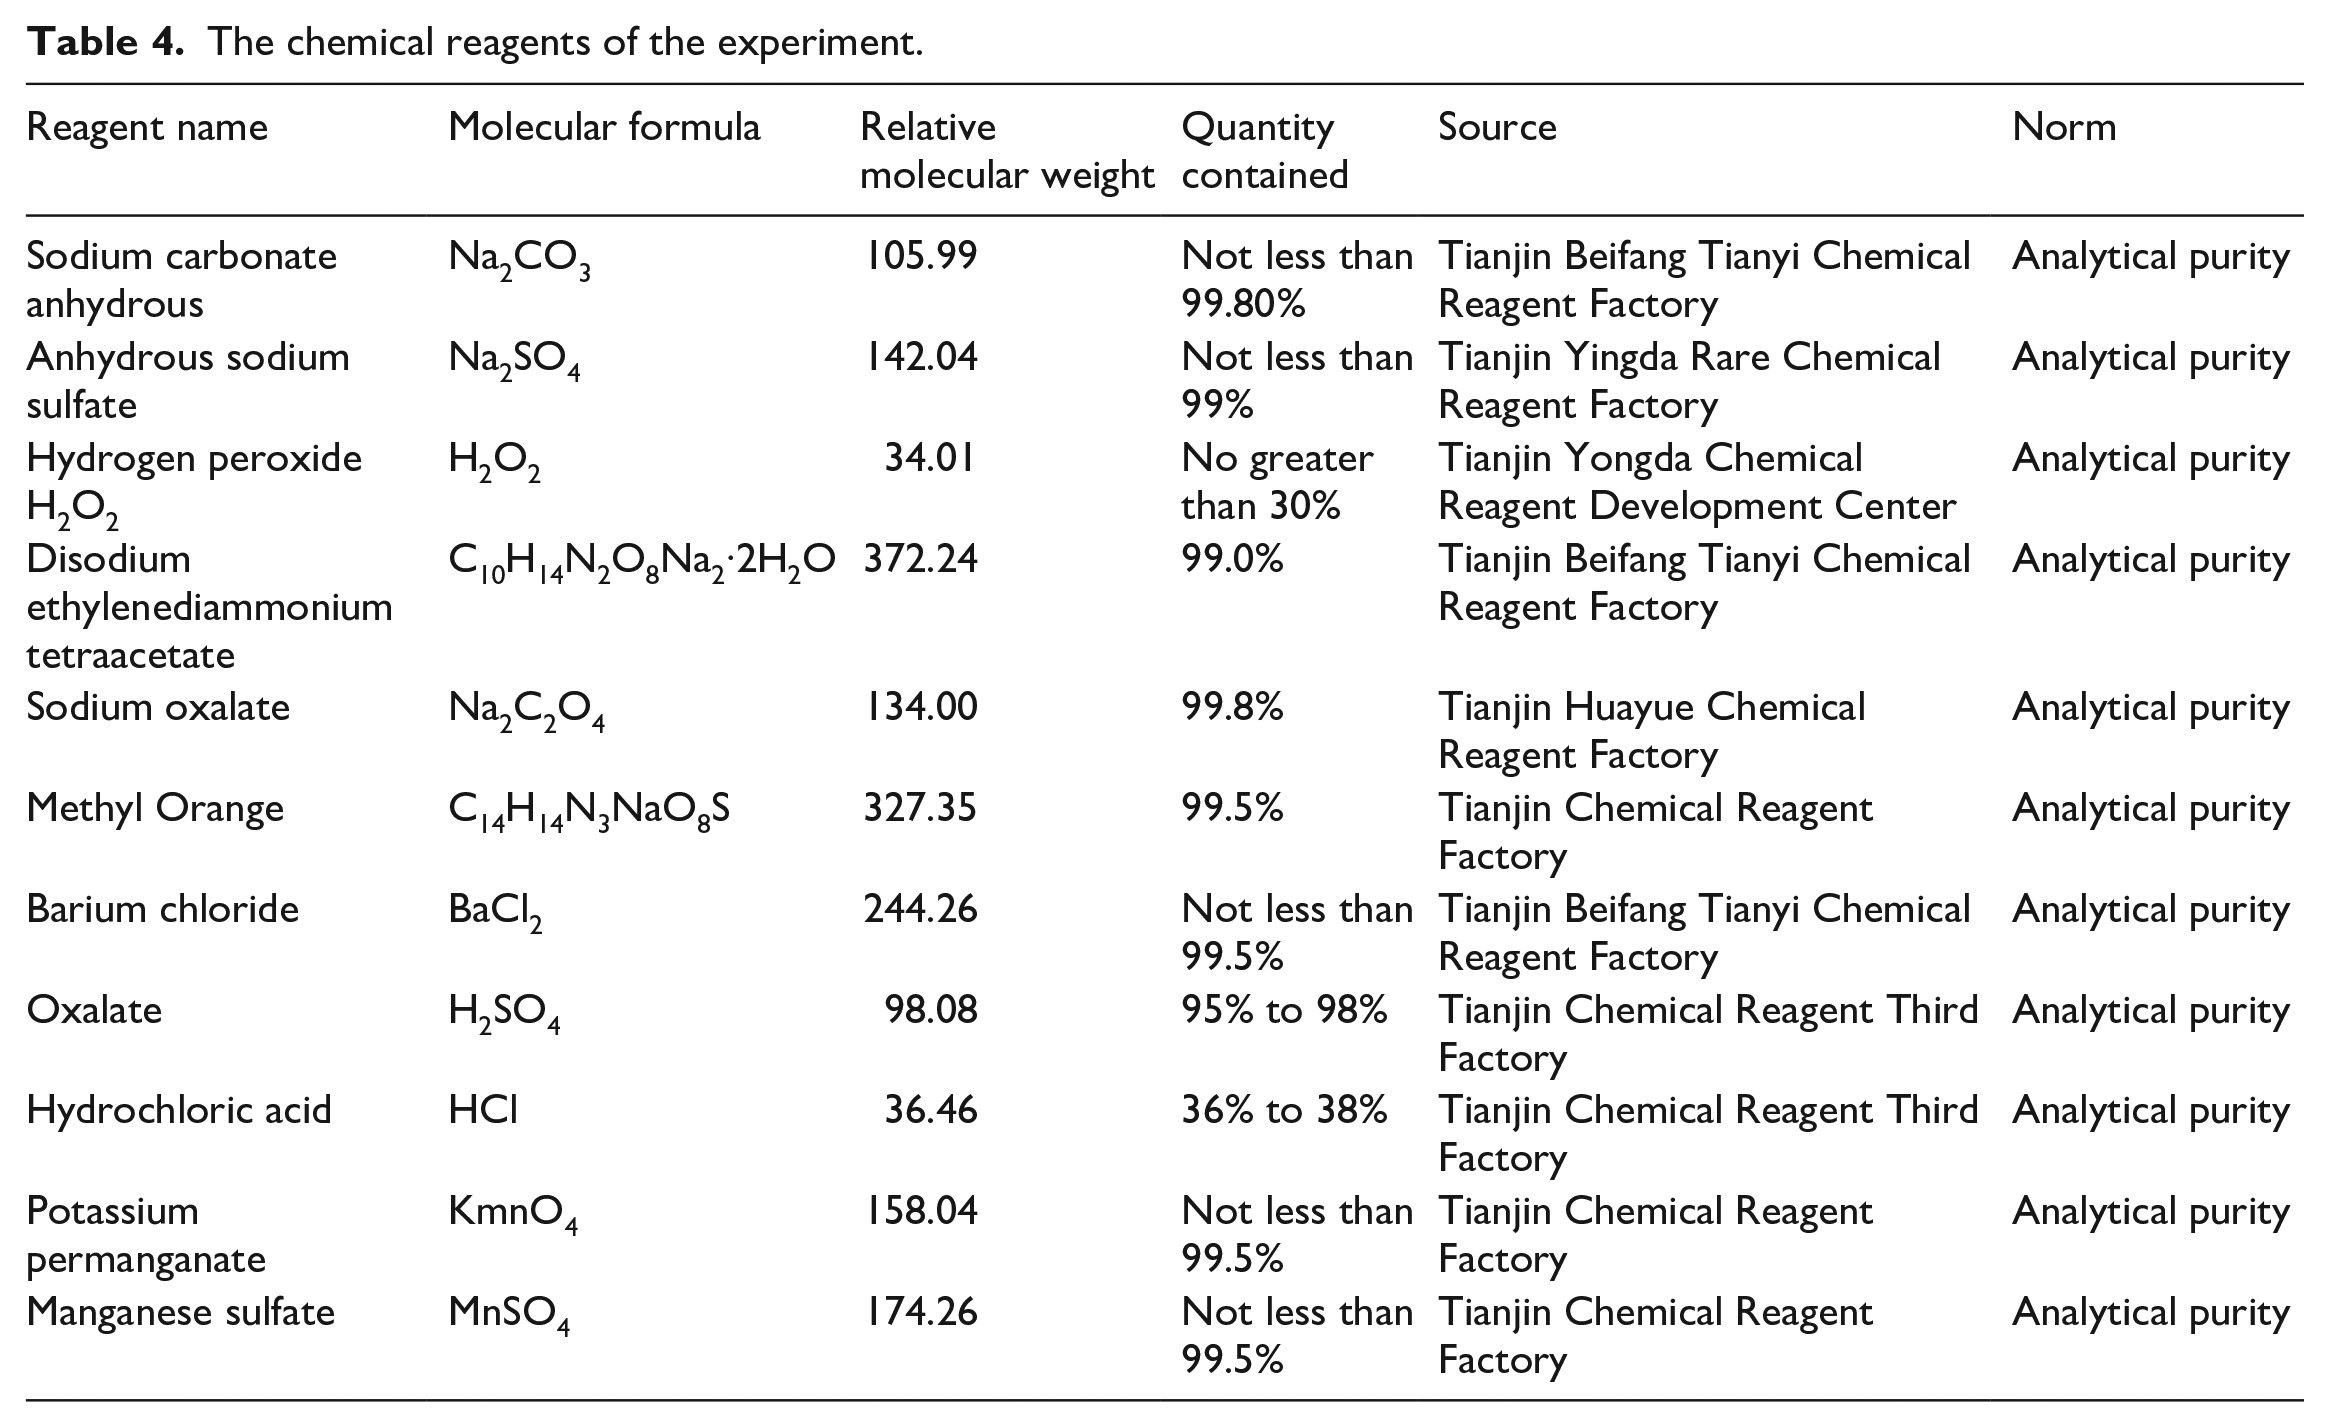
The chemical reagents used in this experiment are shown in Table 4.
The chemical reagents of the experiment.
The experimental apparatus used in this experiment is shown in Table 5.
Experimental apparatus.

Apparatus and experimental procedure
The experiments were carried out using atmospheric isothermal wet slag method to determine the phase equilibrium data of the electrolyte—non-electrolyte—water system, solubility determination experimental setup is shown in Figure 7. The glass tube containing samples was placed in a thermostatic water bath with a temperature control accuracy of ±0.1 °C, and to ensure that the reactant solution in the glass tube was completely submerged. The glass tube was 30 mL in volume and the mouth was closed with a rubber stopper with a stirring rod to avoid water evaporation during the experiment.

Experimental set-up for phase equilibrium solubility determination by isothermal method: (1) constant temperature bath, (2) spot contact thermometer, (3) thermometer, (4) electric stirrer, and (5) reactor.
Determination of phase equilibrium time: the reactor will be adjusted to a temperature of 5 °C, and until the temperature is stable to 5 ± 0.1 °C. Accurately, weigh a certain amount of sodium carbonate, sodium sulfate, hydrogen peroxide added to the reaction vessel, which will be placed in a constant temperature water bath. Open the stirring device. Take out the appropriate amount of liquid phase every period of time to analyze and determine the chemical composition of the solution to be unchanged when the composition of liquid phase to prove that the system has reached Equilibrium. The time to equilibrium was measured to be 5 h.
Phase equilibrium experimental steps to ternary system as an example: the temperature of the constant temperature water bath device is controlled at 5 ± 0.1 °C, and the solubility of sodium carbonate at 5 °C as the basis for data. According to the liquid phase saturated with sodium carbonate, the electronic balance accurately weighing the calculated amount of anhydrous sodium carbonate. Add disodium ethylenediaminetetraacetate in a 5% ratio as a stabilizer, with a pipette to take the preparation of the composition of the water and hydrogen peroxide solution added to the reactor, fixed in a constant temperature water bath stirring. Stirring in a water bath, the reaction time is 5 h. Then, stop stirring, and rest for a period of time, until the solution stratification is obvious. Take out the upper layer of clear liquid and the lower layer of wet residue into the weighing dish, weighing. Afterwards, the diluted solution of clear solution and wet residue were poured into 250 mL volumetric flask and diluted to scale. Two 50 mL dilutions were taken out to determine the content of sodium carbonate and hydrogen peroxide. According to the experimental data to determine the liquid phase and wet residue composition point in the phase diagram. The amount of sodium carbonate and hydrogen peroxide was changed continuously to obtain different liquid-phase composition points, and the complete phase equilibrium curve was plotted.12–16
Characterization
The solid-phase composition was tested by a combination of chemical analysis and IR spectroscopy and X-ray diffraction. The content of each component in the wet slag is first analyzed chemically, and the point is plotted in the dry salt map. 17 If the composition of a solid phase is close to a certain solid phase, IR spectroscopy or X-ray diffraction analysis can be used to determine the composition of the substance, and then accurately determine the composition of the solid phase.
Footnotes
Declaration of conflicting interests
The author(s) declared no potential conflicts of interest with respect to the research, authorship, and/or publication of this article.
Funding
The author(s) disclosed receipt of the following financial support for the research, authorship, and/or publication of this article: Funded by Science Research Project of Hebei Education Department (QN2024083).