
Abstract
It has been observed experimentally that the output voltage profiles are exponential of two types: rising or decaying; the structure of these profiles is controlled by the mobility of charges: ions and electrons. A comparison between the arrival times of electrons at electrode τe, and ions at double-layer τi, allows determining the shape of these signals. The electrons produced by the photon–dye interaction reach the cathode increasing the output voltage. The ions in the electrolyte are moved by the charge on the electrodes forming the electrical double layer; these ions reduce the output voltage: electrons and ions produce opposite effects. These two charge accumulations produce double layers on both sides of the electrode–electrolyte interface forming double-layer capacitors. The numerical values of several cell parameters (energy, electric field, charge density, capacitance) were estimated, and it was found that they depend on κ; the inverse of the thickness of the double layer λ = κ−1; because κ is a large number, double-layer capacitors are suitable for storing large amounts of energy which is associated with chemical capacitance Cμ. Two dyes were used: brazilwood and cochineal, Al3+ as a mordant, and Na+-metasilicate as brightener. A model was included to describe and fit oscillations in the voltage profiles that appear due to an abrupt illumination. An expression was obtained for Cμ as a function of the voltage.

Introduction
Dye-sensitized solar cells (DSSCs) based on natural dyes have unbeatable advantages: they are friendly to the environment, easily manufactured, allow an increasing production with reduced costs, and easily disposable without toxic environmental damage.1–3 Additional benefits include the immense variety of natural dyes that exist in nature with almost unlimited availability, and its reduced costs.4,5 Practically, all these properties enter into an ecological scheme, a policy focused on global environmental conservation. However, natural dye-based cells have two severe drawbacks: low efficiency and short lifetimes; for these reasons, this type of cells has not been commercialized; 6 however, these problems are only temporary and do not overshadow the great benefits that this type of cell would bring humanity.
It is generally accepted that natural dyes are less resistant to solar radiation than synthetics. This is because the natural dyes are removed from a medium that has the appropriate chemical environment and appropriate sustainability; it is not enough to anchor the dye with the substrate to stabilize it and increase its lifetime. However, from Gratzel in 1991 to the present day, very interesting results have been achieved by improving vital parts of the cells: one of these is the electrolyte which is very important because it is in physical contact with both electrodes, and it is there where the transport of charge takes place;7,8 it is this charge transportation that we are looking for to support our modern technology. One of the important aspects in the case of electrolyte is liquid; this makes its manufacture complicated, expensive, and of short duration; however, this physicochemical problem will eventually be solved efficiently. In this field, there are interesting results; with a copper-based electrolyte, it was possible to obtain an impressive efficiency of 32%. 9 Solid or semi-solid (gel) electrolytes are interesting alternatives because they reduce evaporation and facilitate cell fabrication. Currently, in the laboratory, it is possible to obtain an efficiency of 14%; 10 this reasonably high efficiency has been achieved by improving the electrolyte and other parts of the cell; however, the rapid development of solid-state electrolyte allows to see important advances in a near future.
Other important aspects include the amount of dye impregnated in the mesoporous, which has to be as large as possible to have a large number of available electrons; this is related to the thickness and morphology of the mesoporous; 11 this is important since it is intended that all dye molecules absorb photons from solar radiation. From ancient times, Mesoamerican cultures have used certain compounds to stabilize color in fabrics such as cotton, wool, and leather;12,13 they found that controlling the interaction between the dye and the fabric, the lifetime can be increased; this interaction is carried out through the use of polyvalent metal ions which anchor the dye with the substrate to stabilize it; commonly used metal ions are Zn2+, Sn2+, and Al3+.14,15
Antecedents and theoretical considerations
DSSC operation
It is important to know the main processes that take place inside the photocells to clarify the role played by the ions added by mordant and brighteners; a brief description of charge transport processes will be discussed:
The anode was covered with a mesoporous internally and externally impregnated with the dye.
Electrons emitted by the dye–photon interaction go to the conduction band of the mesoporous and circulate through the external circuit until the cathode.
The dye molecules must be chemically linked to the mesoporous through appropriate metal ions to improve their color stability and lifetime.
Electrons are transported back from the cathode to the dye to reduce it; I3−/I− mediated this.
A carbon layer is deposited on the cathode as a catalyst to improve the capture and transport of electrons.
Ionic transport and electrical double layer formation
The electrons produced by the dye eventually reach the cathode after a time τe; this is practically constant because the light intensity and electrolyte are the same; however, there is a dependency with the type of dye because this is responsible for emitting the electrons. The electrons at the electrode produce a field
Since there are different types of ions (Na+, K+, Al3+, Sn2+) with different charges, sizes, and concentrations, the times τi required for these ions to reach EDL are different. The ionic transport is modeled as a series of jumps to appropriate neighboring sites to accommodate the jumping ion; this type of transport has a peculiar feature, the obstruction effect: when there is a multitude of ions around the jumping ion, they block the jump reducing the conduction: the ionic conduction depends on the concentration. The blocking effect can be modeled by introducing a factor proportional to ni in the numerator of the expression for τi: an increment in ni increases τi.
The net electric field ET = Ee − Ei is responsible for moving the ions to EDL with a force

ni was introduced into the numerator for the blocking effect, and Ci replaced it; it was also assumed in equation (1) that ne is larger than ni. Ci represents the five concentrations of the additives C1–C5 used in the manufacturing of the cells. Comparing τi and τe allows determining the shape of the output profiles.
Electric charge accumulation involves high internal energies due to strong repulsive forces; this means that there is a minimum distance between charges dmin allowed by the available energy: small distances between charges correspond to large values of energy; this fact limits the maximum concentration of charges that can be accumulated in a finite space and provides information with respect to the structure to the charge accumulation. When ions move toward the charged surface, the first layer (Stern layer) begins to fill until the distance between charges reaches dmin, and the filling stop; the rest of the charges goes to the next second layer, which is filled respecting dmin; this process continues filling successive layers as close as possible to the interface; in this way, the EDL is formed: the restriction imposed by dmin produces nonuniform ion distribution with a diffuse double-layer (DL) structure. The Stern layer and a few adjacent layers form the EDL of thickness λ, and κ = λ−1; the DL of ions is in contact with the interface.
The thickness of DL depends on various ion parameters: charge (valence), size, and concentration; numerical values of λ have been reported for different valences in dilute conditions; 16 they are in the range of [2.5 × 10⁻¹⁰–10−8] m, corresponding to values of κ in the range [108–4 × 10⁹] m−1. When the electrons arrive at the electrode, they accumulate similarly to the ions in the EDL; then, two double layers are formed on both sides of the interface. These layers are very thin (on the order of few nanometers) and separated for an even shorter distance, on the order of the thickness of Stern layer λSL (<λ); due to this, there is a very strong attractive force FDL between the two DLs which stabilizes them producing a very tight and orderly packing of charges, electrons, and ions. 16 As will be discussed in the following sections, the attractive force FDL between DLs depends quadratically on κ, that is, FDL ~ κ2; that is, there is a factor of at least 1016 in the force between DLs. This type of structure can store large amounts of energy and charge reaching saturation and producing very intense electric fields in small volumes (Aλ).
The times required to form DLs determine, to a large extent, the shape of the output voltage; as τe is constant (except when the dye is changed), only the time τi will be considered. In the filling process, the amount of charge accumulated increases with time but at different speeds: fast at the beginning and slower at the end; this is because the traveling charges have to overcome the field produced by the charges already accumulated: the rate at which the charges are deposited depends on the charges already deposited: (dqi/dt) = cte (qoi − qi); if qi increases, (qoi − qi) decreases along with dqi/dt; the solution of this equation with the condition qi = 0 when t = 0 is

These are not the output voltages; Vo = Ve − Vi is the quantity measured experimentally.
Characteristic shapes of output voltage profiles
The shape of the output voltage depends on how fast any of DLs are formed, which in turn depends on the characteristics of the ions, particularly in their mobilities; “slow ions” are those that have large size, low charge, and high concentration, while “fast ions” are those that have small size, high charge, and low concentration. There are two possible cases: the first corresponds to slow ions (τi > τe); a considerable time is required for these ions to reach and form EDL; then, they do not interfere with the rate the electrons are deposited in the electrodes increasing the output voltage: V = Ve, and from equation (2a),

In the second case for fast ions (τi < τe), they reach and form, in short times, EDL; however, a threshold voltage Voe is required to initiate the ionic transport and once initiated, these ions quickly reach EDL while Voe remains practically constant; then, V = Voe − Vi, and from equation (2b),

The time τe, important for slow ions, controls properties of rising profiles, while the time τi, important for fast ions, controls properties of decaying profiles. Since the additives introduce different types of ions with different size, charge, and concentrations, it is required a double-exponential function to fit the profiles:


where BL is the baseline corresponding to DC component.
The times τ1 and τ2 are related, but not equal, to the arrival times τe and τi. It is necessary to include in these equations a term to fit the oscillations observed in the profiles.
Numerical values of double-layer capacitor parameters
A capacitor is a device that stores energy in an electric field in a finite region of space. In traditional capacitors, the electric field is delimited using metallic objects placed in specific positions; however, for double-layer capacitor (DLC), there are no metallic borders that delimit the electric field, but in its place is the structure of the DL which, by itself, plays that role: the DL does not produce a well-defined edge but a diffuse one; then, DLC is not a typical electrostatic capacitor, but one with chemical (or physicochemical) origins. Due to the restrictions imposed by the minimum distance between charges in a charge accumulation, double layers will be formed on both sides of the interface, one of the ions and the other of electrons and, in both cases, the charges are ordered and tightly packed near saturation, allowing to store large amounts of energy. DLCs have important technological applications in the design of devices that allow large amounts of energy to be stored in reduced volumes: diffuse layers of opposite signs placed on both sides of the interface form DLCs with the electric field limited to small volumes of the order of 2Aλ where λ is the thickness of the DL and κ = λ−1:

The assumptions in the Debye–Huckel theory are fulfilled in the case of ionic and electronic double layers; because the volume of the charges was not taken into account, both double layers are similar for monovalent ions. The DLs on both sides of the interface stabilize each other by a strong mutual attraction. The intensity of the electric field in the double layer has been reported for different ion concentration and valences,
16
resulting in the range [6 × 10⁶–1.5 × 10⁹] V/m and for monovalent 2.3 × 10⁷ V/m; these values correspond to intense fields. The force between two charged plates of a capacitor is given by
In the interior of a cell, three capacitors are formed, two CDL = C1 = C3 = εA/2λ, and one Celec = C2 = εA/a = εA/(d − 2λ) = εA/d; for example, for d = 1 mm for Celec, CDL is between 5 and 6 orders of magnitude bigger with respect to Celec. The total capacitance CT is as follows:

Energy, electric field, capacitance, and charge density were estimated numerically (Table 1) to have an idea of the potential that DLC has in energy storage; to do this, some values have to be assigned to various physical quantities: κ is in the range [108–4 × 10⁹] m−1; then, it is assigned the value of κ = 109; Ѱo is in the range [10–100] mV; then, Ѱo = 0.05 V; the area will be chosen of 2 × 2 cm2 A = 4 × 10⁻⁴ m2.
Estimated values of energy density u, electric field E, charge density ρo, and capacitance C.

On EDL, but mainly in the Stern layer, of thickness λSL which is in direct contact with the interface, is where the ions are adsorbed and tightly packed near saturation; the tightly packed condition forces the ions to be at the distance of the closest approach dmin which is achieved if the area occupied by an ion is of the order of 10 nm2 With this information, it is possible to calculate the surface charge density:
Because the volume where E has significant values is very small, the energy density u will be reported in addition to U. The energy stored in the DLs on both sides of the interface was determined using
Regarding the electric field, as E depends on the position, it is reported the average value: <E>DL in the range [0–λ] and <E>elec in the range [λ–(d − λ)]. E was obtained from
These numerical values support the aforementioned that a large amount of energy can be stored in DLCs where the electric field is very intense with high capacitance and charge; the DL structure with thickness in the range of nanometers, [0.25–10] nm, is very appropriated to store large amounts of energy, with high values for E, Ѱ, ρo, and C. Based on this, it is possible to design high-charge and high-energy capacitors by gathering, in a reduced space, a considerable number of DLCs. Because κ>>>2</συπ>> depends linearly on the valence and concentration equation (5), if the valence z increases, κ increases, and if no increases, κ increases; then, there is a small correction due to the difference in the valence of electrons (z = 1) and ions (z = 1, 2, 3): for monovalent ions (Na+, K+) κi = κe, for divalent (Sn2+) κi = √2κe, for trivalent (Al3+) κi = √3κe; these corrections have to be made depending on the ions present in the system.
Chemical potential of charged particles
The Debye–Huckel theory provides an expression of the potential:

and, using the Poisson equation,

where ρo = z2e2noѰo/kT with units C/m3.
CDL is the capacitor that contributes the most to Cμ, and since CDL depends on the voltage V, it is possible to obtain the dependence of Cμ on V; this is important because V can be measured experimentally. To obtain this dependence, it is necessary to determine first the chemical potential μ of a reference ion j surrounded by ni ions in the DL; these ions follow the Boltzmann distribution law:

Even when the charges are diluted, the system cannot be considered ideal due to the strong long-range interaction. Because Ѱ and ρ decay very quickly with distance, the reference charge j has a high probability of being adsorbed on the Stern layer (x = 0); then, the distance x in Ѱ(x) and ρ(x) equations (7) and (8) is measured from the interface.
The chemical potential μ of a reference ion j surrounded by ni-free ions in the DL depends on the ionic strength, the medium’s dielectric properties, the ions’ charge, and the thickness of the DL. 17 Assuming that the ion j is initially isolated in solution and, suddenly, the electrical interaction is switched on, the change in the chemical potential Δμj = μj − μo is given by: 17

where a = dmin, zj, and qj are the valence and the charge of the ion, and κ = 1/λ. μ strongly depends on the thickness of the double layer κ>>>−1. Solving for κ and defining β = zjqj2/4πε:

Chemical capacitance Cμ
The chemical capacitance Cμ is defined as:

where μi is the internal chemical potential. The Boltzmann distribution law can take different forms according to the expression for the energy; in this particular case, it is possible to write:
From the equations (12) and (13), it is obtained:

Cμ depends directly on the parameter more important of the double layer: κ. In the Debye–Huckel approximation, the potential Ѱ is assumed small, zeѰ << kT; then, Ѱ = Ѱo [1 − κx + . . .] and the voltage V = Ѱo − Ѱ, measured from the interface, can be replaced in expression in equation (9):
This form of the Boltzmann distribution law is more appropriate since V is measured in the laboratory. The definition of Cμ involves
where

where

Schematic illustration of the dependence of Ln (C) as a function of V; the linear central part of the sigmoid curve corresponds to Cμ.
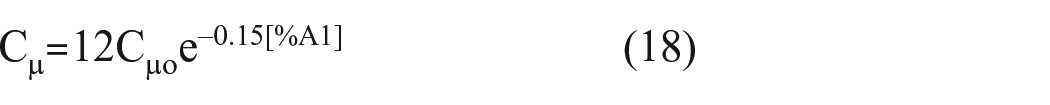
It has also been possible to obtain the dependence of Ln(Cμ) with the Al3+ concentration [Al3+] for cochineal–alum samples; the idea is to obtain the dependence of the output voltage as a function of [Al3+] and, because Cμ depends on the output voltage, it is possible to obtain the relation Cμ-[Al3+]. Figure 2(b) shows a linear relationship between the output voltage V and [Al3+]: V = 0.02 − 0.001 [Al3+] (R = 0.97978); using this equation and equation (16), it is possible to obtain:

Voltage profiles of (a) cochineal–metasilicate, (b) cochineal–alum, and (c) brazilwood–metasilicate; the profiles were shifted for clarity; the dark stage was omitted.
This expression is plotted in Figure 3(b). In Figure 1, the straight line Ln(Cμ)-V has a positive slope, but in the case Ln(Cμ)-[Al3+], the slope is negative (Figure 3(b). As mentioned, Al3+ are fast ions producing decaying profiles; these profiles reach, in short times, their final voltage Vo = Ve − Vi; then, if [Al3+] increases, Vi increases, and Vo decreases; for this reason, the slope in Figure 3(a) has a negative slope; this negative slope also produces a negative slope in the Ln(Cμ)-[Al3+] graph (Figure 3(b)).

(a) The voltage V as a function of [%Al] for cochineal–alum samples and (b) Cμ as a function of V was obtained from equation (16).
Mathematical model of unstable oscillations
A mathematical model is reported to describe the unstable oscillations on top of the output voltage profiles when the cell is exposed to an abrupt dark-to-light transition. 19 This model is based on two forces working in opposition. The dye–photon interaction produces electrons released from the dye, leaving it with a net positive charge; these charges stretch the dye molecules creating an elastic recovery force felas. The stretched molecules overlap, resulting in a local increment in the segments’ concentration given place to an osmotic pressure fosmotic that tries to move them away to reduce the concentration gradient; these forces are responsible for the oscillations. This model is based on the Flory–Krigbaum theory developed to study the steric stability of colloids. 16 Based on this model, it is possible to obtain an expression for the oscillations: x(t) = xo/[1 + axsin 2 (ωxt + δx)], which was included in equations (4a) and (4b):

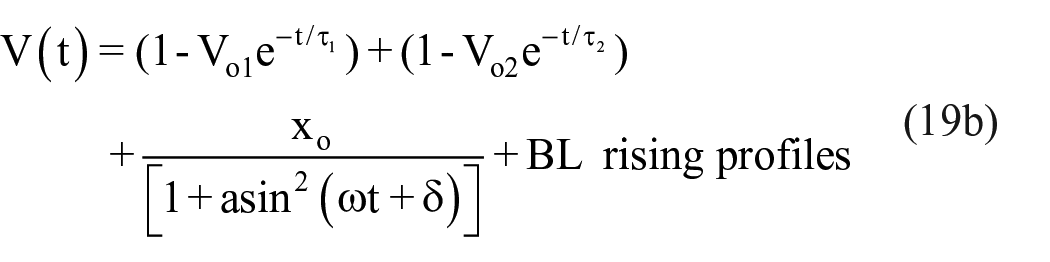
xo and a are related to the oscillation amplitude, ω and δ= are related to the angular frequency and phase.
Experimental
Materials
DSSCs were fabricated as reported elsewhere: 20 two natural dyes were used, cochineal and brazilwood, alum as a mordant, and sodium metasilicate as a brightener. A cochineal mother solution was prepared by mixing 0.2 g of dried cochineal insects finely ground with 10 mL of distilled water; the mixture was heated to boiling to reduce the volume to 8 mL and stored in a closed glass container for 24 h to obtain a dye concentration of 25 mg/mL. Regular pieces of brazilwood of 2 to 3 cm were used; the red part was separated from the light-yellow part and grounded using a rasp-file tool until a fine powder was obtained; as before, 0.2 g of red powder was added to 10 mL of distilled water, and the mixture was heated to boiling to reduce the volume to 8 mL and stored in a close container for 15 days to release the dye completely; the brazilwood-based red color mother solution has a concentration of 25 mg/mL. Both suspensions were homogenized using an ultrasonic bath for 40 min and filtered using a Whatman paper filter. Five different additive/dye concentrations were prepared: C1 = 2.5, C2 = 7.5, C3 = 9.4, C4 = 14.0, and C5 = 19.0, all in mg/mL.
Cell fabrication
Two conductive transparent electrodes of In2O3:SnO2 were used. The mesoporous was prepared by mixing 2 g of TiO2 nanoparticles of 2 nm (Aldrich) with 8 g of acetic acid at 10%; this paste was spread on one electrode (anode) to form a layer 34.7 μm thick; it was heated to 450 ℃ for consolidation and immersed in the red mother suspension for 1 day for a complete impregnation. The electrolyte was prepared by mixing 10 mL of acetonitrile, 0.5 g of 3-Methoxypropionitrile, 0.128 g of I2, and 0.66 g of LiI. The anode-TiO2 was dried and filled with 2 mL of electrolyte. The cathode was covered with a thin carbon layer as a catalyst, and electrical wires were placed. Finally, the cell was wrapped with parafilm to reduce evaporation.
Electrical characterization
The solar cell was illuminated with a 100 mW/cm2 intensity using a 50 W halogen lamp at the appropriate distance from the cell; two thin transparent glasses separated by 1.2 cm were placed between the lamp and the cell to provide thermal insulation and reduce temperature and evaporation. The cell was kept in darkness for 10 min to reach equilibrium, and suddenly, it was illuminated for 2 s; after this, the light was turned off for 8 s; the voltage was measured in light (hold) and dark (release) situations. The voltage was measured using a digital multimeter USB Steren model MUL605 equipped with data communication software to PC; it has a resolution of 0.1 μA in the 400/600 μA range with an accuracy of ±1.2%; the input impedance was 10 MΩ.
Results and discussion
When the charges arrive at their destinations, electrons to electrode and ions to EDL, they produce local voltages that grow exponentially with time (equations (2a) and (2b):
Figure 2(a)–(c) shows three sets of voltage profiles for cochineal and brazilwood with alum and metasilicate at different concentrations. As can be seen, depending on the size, charge, and concentration of the ions, the profiles can be rising or decaying. These shapes can be explained by analyzing the times τi. According to equation (1), for each type of ion, there are five different concentrations and, consequently, five different arrival times τi; the concentrations are C1 = 2.5, C2 = 7.5, C3 = 9.4, C4 = 14.0, and C5 = 19.0, all in mg/mL. From Figure 2(a) for Na+, RNa = 0.99 Å, this is an ion of intermediate size and small charge so, at low concentrations C1–C3, they move fast, forming EDL in a short time, reducing V and producing a decaying profile; however, at C4, the profile is flat, and at C5, the blocking effect reduces the mobility of the ions, delaying their arrival to EDL and allowing electrons to reach the electrode to increase Vo, producing a rising profile; the arrival times for Na+ are τNa ~ (2.48, 4.95, 9.90, 14.85, 19.80) where the red numbers correspond to decaying, black to flat and blue to rising (see Table 2). From Figure 2(b) for Al3+, RAl = 0.54 Å, this is a fast ion that reduces, in all cases, the voltages producing decaying profiles; the arrival times are τAl ~ (0.45, 0.90, 1.80, 2.70, 3.60). Figure 2(c) shows some differences with respect to Figure 2(a), even when both sets of profiles have Na+ as a common ion; the profiles in Figure 2(c) show some differences with respect to cochineal; for C1–C3, the profiles are markedly decaying, while at high concentrations C4–C5, these are rising profiles. For the sample containing Na (cochineal-Na) at low concentrations C1–C3, the profiles are decaying, at C4 is flat, and at high concentration, C5 is rising. This difference can only come from τe: this time has a dependency on the type of dye since this is the one that emits the electrons; to increase the output voltage, it is required to increase the number of electrons produced; this means that the efficiency to produce electrons must be higher for brazilwood respect to cochineal. In Table 2, it is also reported the shape of the profiles for Sn and cremor tartar. For K+, RK = 1.38 Å, this is an ion of intermediate size with low charge, so at low concentrations (C1–C3), these ions arrive EDL fast, increasing Ei and reducing ET together with Vo, corresponding to decaying profiles; at high concentrations (C4–C5), the blocking effect reduces the ionic transport, leading to rising profiles; the arrival times for K+ are τK ~ (3.45, 6.90, 13.80, 20.70, 27.60). For Sn2+, RSn = 0.71 Å, this is a fast ion that reduces, in all cases, the voltages producing decaying profiles; the arrival times are τSn ~ (0.89, 1.78, 3.55, 5.33, 7.10). From Table 2, it can be seen that values of (R/q) C lower than 14 produce decaying profiles, while values higher than 15 correspond to rising profiles; the transition, corresponding to flat profile, occurs between these values. The comparison between arrival times makes it possible to determine the shape of the output profiles. It was mentioned that time τe is associated with rising profiles (the arrival of electrons to electrode), while τi is associated with decaying profiles (the arrival of ions to EDL); the polarization of the electrodes by electrons is carried out by the redox couple I3−/I− where the ionic radius of I− is 2.2 Å. Using the values obtained by fitting the output profiles of samples of cochineal with Al3+ and K+, it is possible to obtain the ratio of the times (for rising profile with I−)/(for decaying profile with Al3+) resulting 4.2. On the contrary, the ratio RK/RAl = 4.1; the agreement between these two values supports equation (1), that is the linear dependence of τ with R.
Arrival times τi ~ (Ri/qi) Ci for two dyes, cochineal and brazilwood, and four additives: alum, Sn, metasilicate, and cremor tartar.

The times τi are reported for five ion concentrations, C1–C5; red color for decaying, black for flat, and blue for rising profiles.
In Figure 4(a)–(b) are reported oscillations on rising (Figure 4(a)) and decaying (Figure 4(b)) profiles; the discrete points are the experimental data, and the continuous curve the fitting using equations 19a and 19b; as can be seen, both fittings were good (R = 0.99697 and 0.99763); these results support the validity of the model to describe oscillations. The results of the fitting are, for Figure 4(a): Vo1 = 38.0 mV; Vo2 = 44.6 mV; τ1 = 0.02 s; τ2 = 0.62 s; xo = 10.5 mV; a = 4.95; ω = 15.74 s−1; δ = 0.075; and BL = 100.6 mV. For Figure 4(b): Vo1 = 26.04 mV; Vo2 = 6.53 mV; τ1 = 0.065 s; τ2 = 11.67 s; xo = 4.76 mV; a = 15.85; ω = 15.72 s−1; δ = −0.082; and BL = 123.74 mV. The oscillation amplitudes depend on the dye and additives: cochineal-Na and brazilwood-Al cells showed oscillations with low amplitude; this is important because the oscillations can affect, negatively, the equipment connected to the cells when they receive abrupt changes in lighting. The model sketched here contributes to understanding the origin of these nonlinear oscillations, allowing to control their undesirable effects. The oscillation frequency is practically constant for all samples: for cochineal samples, ω = 15.72 ± 0.2 s−1; f = 2.51 Hz, while for all brazilwood, ω = 15.74 ± 0.1 s−1; f = 2.51 Hz; these minor differences in the frequency are due to the intrinsic nature of the stochastic process, small differences in cells construction and color degradation.
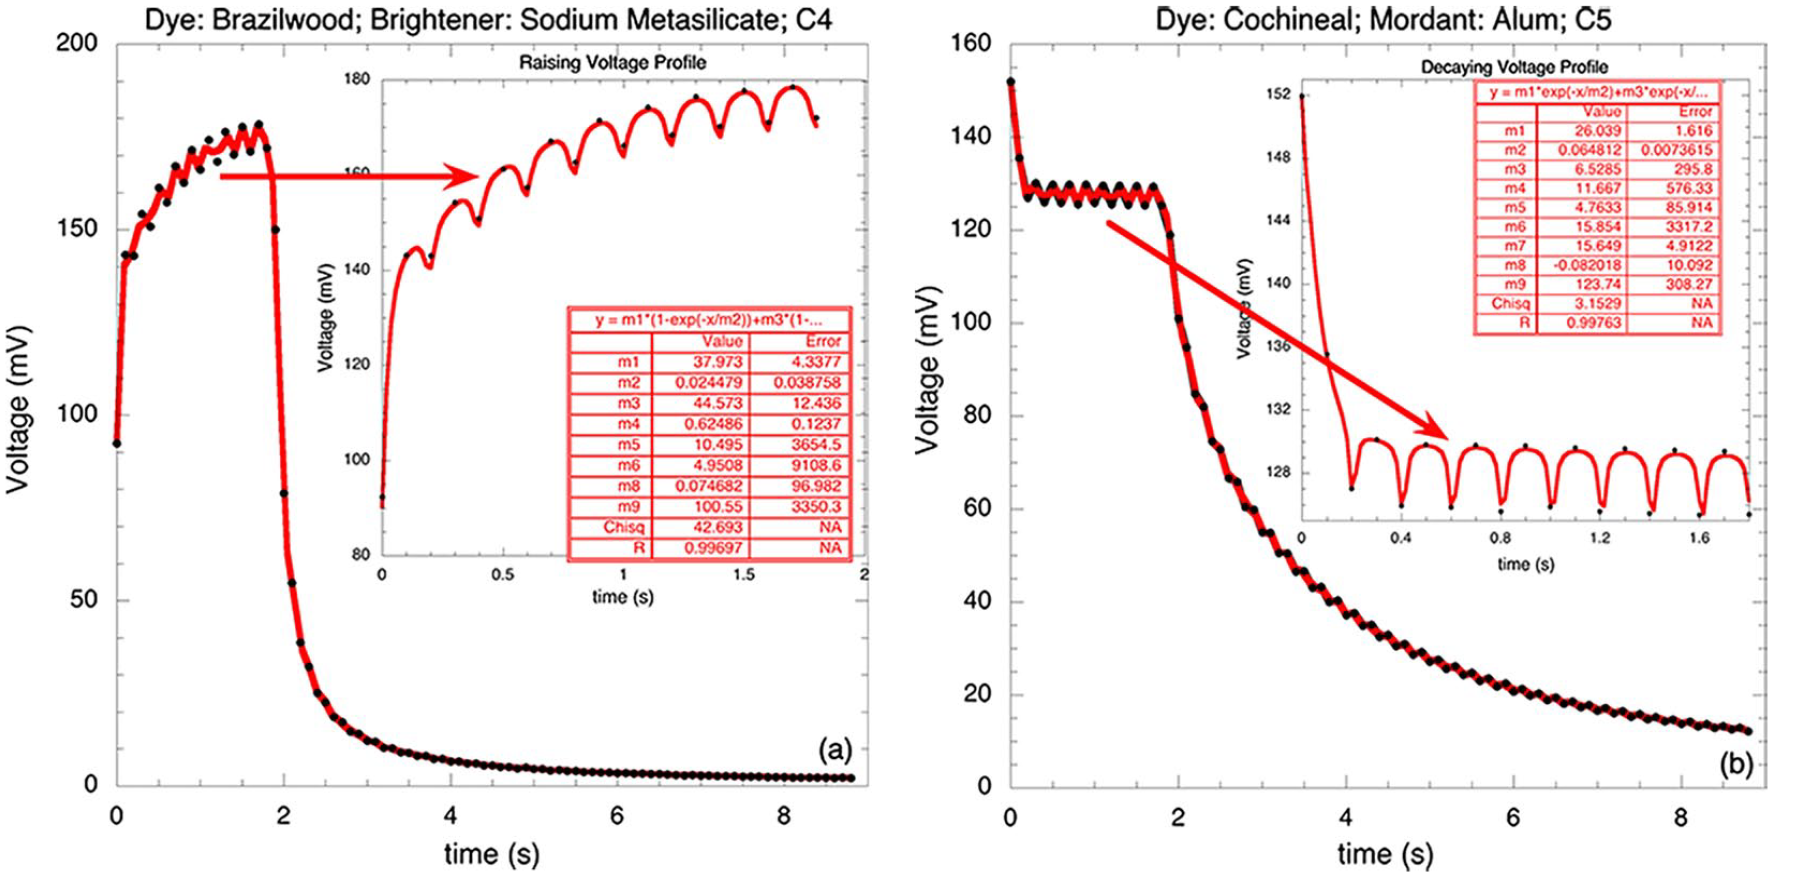
Voltage profiles of (a) cochineal and (b) brazilwood showing the oscillations; the discrete points are experimental, and the continuous line the fitting using equations (19a) and (19b).
The charge density ρ(x) and the electric potential Ѱ(x) decay exponentially according to equations (7) and (8); these equations are valid for electrons and ions. The thickness of the double layers for electrons λe and ions λi is given by equation (5):

where qe = e and qi = zie.
Based on the expression for ρ(x) and Ѱ(x) equations (6) and (7), it was possible to numerically estimate various characteristic parameters of DLCs: charge, energy, capacitance, and electric field. Before illumination, Celec = εA/d, with U = 0 because there are no charges and no electric field; however, when the cell is illuminated, the electrons produce Ee, the ions Ei, the double layers are formed, and the energy is stored. These estimations provide interesting results such as the possibility of storing, in the double layers, large amounts of energy in small spaces (Aλ), and the presence of very intense electric fields in that places. The cell’s interior has two DLCs and an electrostatic one in the central zone. The stored energy in both DLCs is
The chemical potential μ of an electrolyte in the presence of a charged surface depends directly on κ (equation 10); using this dependence and the potential Ѱ, it was possible to obtain a relationship between Cμ and the voltage V:
Conclusion
Several factors control the shape of the output voltage profiles, particularly the characteristics of the added ions: slow and fast ions; in addition, it has been observed that the dye itself has a small contribution to the shape of the profile; this is because it is the dye that produces the electrons that contribute to the output voltage. The reason why slow ions give rise to rising profiles and fast ions produce decaying profiles has been widely discussed. The oscillations in the voltage profiles were fitted using the model reported here; this model allows to determine the factors that control these oscillations. It has been mentioned that DLCs can store considerable amounts of energy; to support this comment, numerical values of several important parameters were estimated; these results show that, for all these parameters, energy, electric field, charge, and capacitance, they depend on κ, which a big number; this dependency allows to affirm that DLC can store large amounts of energy; in addition, in the DL the electric field is very intense; the accumulated charge is high; and the capacitance is also high. It was possible to obtain the dependence of chemical capacitance Cμ on voltage V using the chemical potential of a charge in the double layer:
Footnotes
Acknowledgements
The authors are indebted to Lic. Nancy Retiz for her valuable assistance in the literature review and in the final revision of this document.
Data availability
All data generated or analyzed during this study are included in this article.
Declaration of conflicting interests
The author(s) declared no potential conflicts of interest with respect to the research, authorship, and/or publication of this article.
Funding
The author(s) received no financial support for the research, authorship, and/or publication of this article.