
Abstract
Drug impurities are now seen as a major threat to drug safety around the world, especially when it comes to carcinogenic impurities. Here, we present the first spectrophotometric approach for the quantification of lignocaine and fluorescein in the presence of 2,6-xylidine, lignocaine’s carcinogenic impurity. The approach depends on overcoming unresolved bands through a data processing strategy employing 10 affordable, simple, and sensitive spectrophotometric methods. Fluorescein analysis (1–16 μg mL−1) was performed using direct ultraviolet spectrophotometry (D0) at 478 nm; then, the ratio subtraction method allowed the removal of interference caused by the fluorescein spectrum. From the resulting ratio spectra, 2,6-xylidine (40–160 μg mL−1) can be efficiently determined at 280 nm. However, lignocaine (72–320 μg mL−1) was analyzed using different ultraviolet-based methods, including continuous wavelet transform, ratio derivative by Savitzky–Golay filters, mean centering, second derivative of ratio spectra, ratio spectra difference spectrophotometry, extended ratio subtraction, absorbance subtraction, Q-absorbance ratio, and area under the curve. In line with International Council for Harmonization of Technical Requirements for Pharmaceuticals for Human Use (ICH), the presented approach was evaluated by its coefficients of determination, detection limits, quantification limits, and relative standard deviations. Similarly, the developed approach was assessed for whiteness, greenness, and sustainability using five assessment tools, including National Environmental Method Index, Eco-Scale Assessment, Complementary Green Analytical Procedure Index, Analytical Greenness Metric, and RGB12, offering promising results. Owing to the satisfactory analytical performance, besides the sustainability, affordability, simplicity, and cost efficiency of the presented methods, their application for quality control and in situ analysis in minimal-infrastructure laboratories increases, increasing the surveillance potential.

Introduction
Impurities can pose potentially serious threats when it comes to the production of pharmaceuticals, mainly when working with drugs that include carcinogenic impurities. 1 Impurities encountered in manufacturing can hinder product acceptance. However, impurities found in already-available products can lead to product recalls and regulatory measures. 2 Medicines can hold impurities at any point in the production process, even during storage or shipment. 3 Prioritizing quality early on and through the process can assist producers in maximizing productivity, controlling costs, and minimizing risks. 4 Therefore, there is growing interest in developing simple, cost-effective, and sensitive analytical methods to provide procedures with a way to assess risk, find impurity levels in a variety of therapeutic products, and manage risk during the drug approval process and post-market monitoring.5,6
In this scenario, one of the most extremely carcinogenic impurities that must be avoided during the manufacturing of medicines is 2,6-xylidine (XYL), which has been associated with nasal carcinogenicity and recently, has been linked to urinary bladder cancer with cancer potency factor (CPF) equals 0.0063 mg −1kg day−1.7,8 Furthermore, XYL has been identified by the International Agency for Research on Cancer (IARC) as a potential genotoxin that induces significant DNA alterations. 9 XYL is referred to as lignocaine (LIG) impurity-A in both the British and United States Pharmacopeias.10,11 In addition, XYL is described as LIG’s hazardous product of hydrolytic degradation. 12 Therefore, the development of fast, low-cost, and sensitive methods for LIG/XYL simultaneous detection in LIG pharmaceutical preparations is extremely crucial.
Minims® is a newly approved ocular solution that contains LIG and fluorescein (FLS). LIG, also known as lidocaine, is chemically known as 2-(Diethylamino)-2,’6’-acetoxylidide, and is considered the most commonly used anesthetic drug in daily ophthalmic practice. 13 FLS is chemically known as 3’,6’-dihydroxy spiro [isobenzofuran-1(3H),9’-[9H]xanthen]-3-one and is considered the most commonly used diagnostic ophthalmic dye. 14 The ophthalmic solution contains both LIG and FLS recommended for treatments that call for an anesthetic agent and a disclosure agent, including the Goldmann tonometry, measurement of intraocular pressure, gonioscopy, and other minor eye surgeries. 15 Many analytical techniques have been developed to quantify LIG, such as electrochemical methods,16–21 chromatographic methods,22–28 spectrophotometric methods,29–31 and FLS including, spectrofluorimetry method, 32 a chromatographic method, 33 and spectrophotometric method. 34 Meanwhile, no methods have been reported that can simultaneously quantify LIG and FLS in a co-formulated eye solution. Thus, the development of fast, low-cost, and sensitive methods for the simultaneous detection of LIG and FLS is still interesting.
The fulfillment of a holistic approach and the development of sustainable, innovative, validated analytical techniques aiming for various goals have raised significant issues in quality control units. 35 Therefore, scientific societies have recently emphasized implementing the concepts of GAC (green analytical chemistry) and WAC (white analytical chemistry) in their workflow. 36 Recently, for assessing “greenness,” numerous methods have been developed following the 12 GAC principles, like the NEMI (National Environmental Method Index), 37 the ESA (Eco-Scale Assessment), 38 the ComplexGAPI (Complementary Green Analytical Procedure Index), 39 and the AGREE (Analytical GREEnness Metric). 40 All the aforementioned assessment tools attempt to combine a score or a graphical result with certain criteria related to the degree of environmental friendliness of the method being used. Moreover, for assessing “whiteness,” numerous different algorithms have been newly established, such as the multi-criteria decision analysis (MCDA), HEXAGON, red, green, and blue (RGB) algorithm, and RGB12 algorithm. 41 Interestingly, among all algorithms, the RGB12 algorithm is preferred due to its simplicity and easiness to use, in addition to the ability of the RGB12 algorithm to provide scores to assess how well the technique complies with each of the 12 WAC concepts. 42 However, the ease with which the principles of GAC and WAC can be satisfied depends on the analytical technique employed; for example, chromatographic methods fail to establish an analytical approach to satisfy GAC and WAC because they require the consumption of a significant amount of hazardous organic solvents and complicated sample treatment in addition to high-energy consumption and use of extremely sophisticated and expensive instruments. 43 Thereby, there is an urgent need to develop innovative nonchromatographic, simple, sustainable, and green-and-white analytical methods.
In this context, ultraviolet (UV)-spectrophotometric methods have been proven to be effective analytical tools and appropriate for satisfying the requirements of both the GAC and the WAC owing to their simplicity, sensitivity, selectivity, ease of use, low cost, low solvent consumption, stability, reproducibility, and eco-friendliness. 44 Therefore, the present work has four objectives. The first is to offer the first, cost-efficient, and sensitive UV-spectrophotometric approach for rapid detection and quantification of LIG, its extremely carcinogenic impurity, XYL, and FLS without any prior separation. The second aim is to inspire the use of UV-spectrophotometric methods as a potent analysis tool for establishing a green-and-white analytical technique that can be used for routine quality control even in the presence of a potential impurity as an alternative to nongreen and extremely high-cost traditional methods. The third aim is to develop a greenness and whiteness profile assessment of the methods using the NEMI, ESA, ComplexGAPI, AGREE, and RGB12 assessment tools. Ultimately, the use of proposed methods for the determination of the studied drugs in aqueous humor.
Results and discussion
Currently, an ophthalmic solution containing both LIG and FLS is available on the market, known as (Minims®) and is recommended for the Goldmann tonometry, measurement of intraocular pressure, gonioscopy, extraction of foreign bodies from the eyes, corneal and conjunctival operations, and other minor eye surgeries owing to their anesthetic and disclosing effects. The purpose of this presented work was to develop environmentally friendly spectrophotometric methods that are accurate, simple, low-cost, and specific for the estimation of LIG and FLS in their ophthalmic solution and aqueous humor, as well as in the presence of potential carcinogenic impurities-A, XYL, without any previous separation. By comparing the UV zero-order spectra of LIG, FLS, and XYL, as shown in (Figure 1), we revealed that FLS is free of any interference from LIG or XYL in the wavelength range 312–530 nm. However, LIG and XYL had a lot of overlap, which made it hard to directly measure them. In the end, this challenge was overcome by manipulating the UV spectra and employing several distinct spectrophotometric methods for multi-component analysis. In this study, 10 various spectrophotometric methods for the simultaneous quantification of LIG, FLS, and XYL are outlined, each of which is simple, affordable, rapid, and accurate. These methods included the direct UV method (for FLS), the ratio subtraction method (RSM) accompanied by the direct UV method (for XYL), as well as continuous wavelet transform (CWT), ratio derivative by Savitzky–Golay filter (RD-SGF), MC, second derivative of ratio spectra (DD2), ratio spectra difference spectrophotometry (RD), extended ratio subtraction (ERS), absorbance subtraction (AS), Q-absorbance ratio (QA), and area under the curve (AUC) methods (for LIG).

The overlay zero-order UV absorption spectra of pure LIG, XYL, FLS, and the obtained spectra of the laboratory-prepared mixture (80, 80, and 5 μg mL−1), respectively, against double-distilled water as a blank.
Methods development and optimization
Selection of solvent
To analyze LIG, FLS, and XYL, various solvents with varying levels of polarity, such as ethanol, methanol, distilled water, and acetonitrile, additionally, aqueous solvents having varying pH, such as 0.1 M NaOH, borate buffer pH 8, acetate buffer pH 4, and 0.1 M HCl, were put to the test. The intensity of absorption and solubility properties of distilled water were significantly superior to those of other solvents. In addition, to make the developed approach as environmentally friendly as possible, we decided to prepare the LIG, FLS, and XYL solutions using distilled water.
Selection of divisors
Various concentrations of the divisor were tested, and those of 5 μg mL−1 for FLS and 60 μg mL−1 for XYL were subsequently found to be optimal in terms of mean recovery percentage, signal-to-noise ratio, reliability, and sensitivity.
Characteristics of the methods
RSM
El-Bardicy et al. 45 proposed a technique known as ratio subtraction to find the component in overlay mixtures that has the shortest extended-spectrum. This method has been further developed for the separation of multi-component drug mixtures, such as those involving a binary or ternary combination, or for use in the presence of drug impurities or degradation products. 31 The real objective for employing this technique was to eliminate FLS interference. Once a mixture (X + Y) is used, (X) [LIG + XYL] and (Y) [FLS], and the spectrum of FLS (Y) is much more extended, as shown in Figure 1, acquisition of original spectra of (X) [LIG + XYL] could be carried out by dividing the zero-order absorption spectra of the ternary mixture by (5 μg mL−1) of standard FLS (Y’ = divisor), providing novel ratio spectra indicating X/Y’ + Y/Y’ (plateau region), then the second step was subtraction, where the obtained ratio spectra after division were reduced by subtracting the absorbance in the constant area Y/Y’ (312–530 nm), as shown in Figure 2. Ultimately, the divisor (Y’) was multiplied by the acquired curves after subtraction to provide the original spectra of (X) [LIG + XYL], as shown in Figure 3. The resulting LIG + XYL mixture was further effectively resolved, XYL was estimated at 280 nm, free of any interference from LIG, as shown in Figure 3. After that, the LIG was estimated using methods (II–IX).
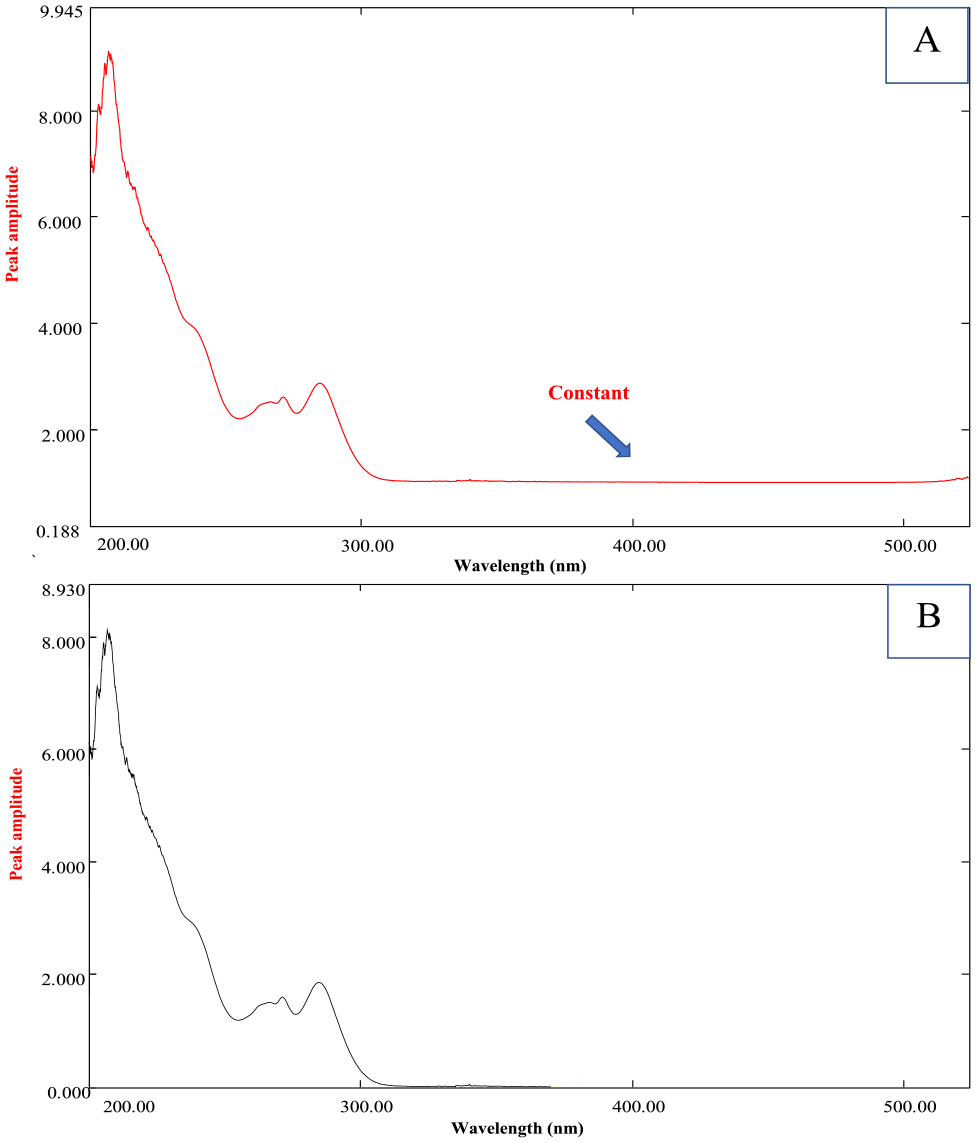
Ratio spectrum of the laboratory-prepared mixture of LIG, XYL, and FLS (80, 80, and 5 μg mL−1). (a) After division on 5 μg mL−1 of FLS as a divisor and (b) after subtraction of the constant.

Zero-order absorption spectra of LIG (80 μg mL−1), XYL (80 μg mL−1), and the final spectrum of the laboratory-prepared mixture of LIG, XYL, and FLS (80, 80, and 5 μg mL−1) by the proposed ratio subtraction method after multiplication by the divisor 5 μg mL−1 of FLS.
Method (II): CWT method
To find a zero-crossing point that can be used to resolve the interference caused by LIG and XYL, the zero-order absorption spectra were transformed using the wavelet domain. 46 Numerous wavelet families with varying scaling factors were investigated. A second-order Coiflet wavelet family (Coif2) with a scaling factor of 20 was chosen because it produced the strongest resolved signals with a zero-crossing point at 248.6 nm, as shown in Figure 4. This enables an accurate estimation of LIG concentrations at 248.6 nm free of XYL interference, as shown in Figure 5.
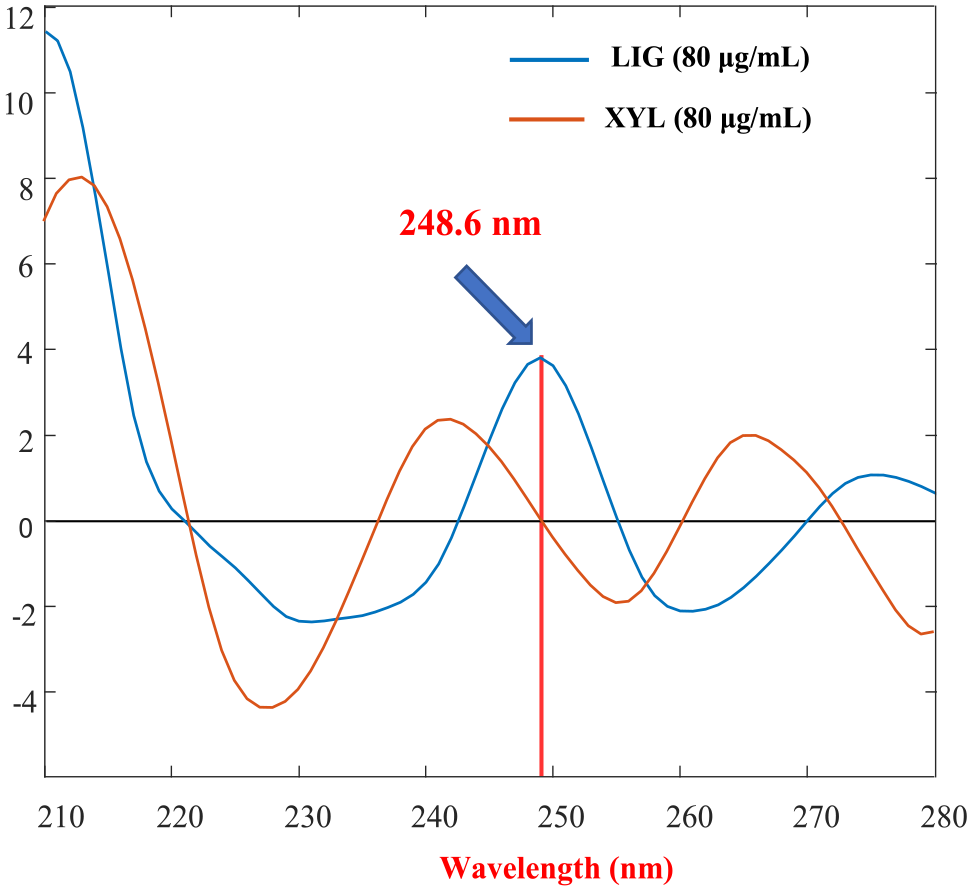
Spectra of CWT-Coif2 of LIG and XYL.

Spectra of CWT-Coif2 of LIG at different concentrations (72–320 μg mL−1).
Method (III): RD-SGF method
Using the SGF, the ratio spectra were changed into their first derivatives. 46 This was done to eliminate the interference of XYL. The calculation of the SG coefficients involved three different parameters, each of which was subjected to optimization. These parameters are the polynomial level, window size, and wavelength at which the readings were carried out. Multiple variations of these parameters were attempted. Once the estimated coefficients for the drug provide a precise and accurate estimate, the optimal parameters for LIG are chosen. Interestingly, the best-denoised derivative spectra were acquired when a first-order derivative with a 20-point window and a quadratic model filter was applied, as shown in Figure 6. This enables an accurate estimation of LIG concentrations at 270 nm, free of XYL interference.

Application of the first derivative using Savitzky–Golay filters on the ratio spectra of LIG.
Method (IV): mean centering method
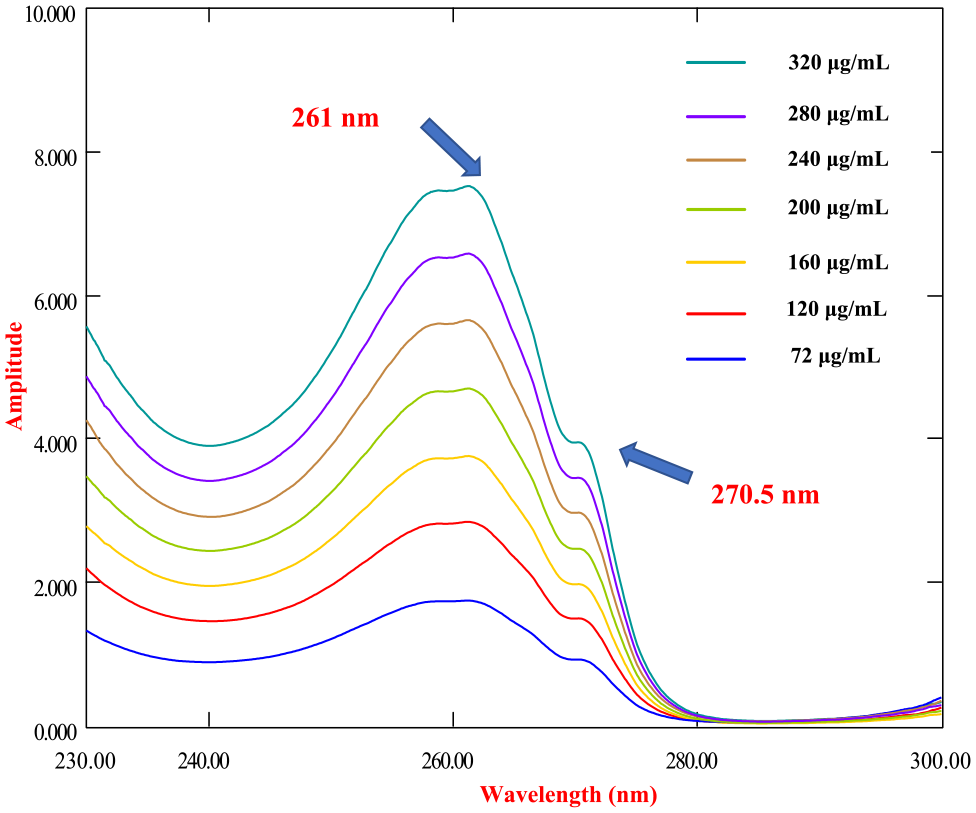
By achieving mean centering (MC) of the ratio spectra, this technique was able to eliminate the interference caused by XYL, since XYL remains constant throughout this manipulation. 46 It is important to note that the entire spectrum will have an impact on the final results of this method because the MC value will be subtracted from the total. As a result, selecting a data set that focuses only on relevant information is an important first step. For optimal results, we centered the ratio spectra over the range of 260–300 nm, as shown in Figure 7. This enables an accurate estimation of LIG concentrations at 261 nm, free of XYL interference.

Mean centering of the ratio spectra of LIG at different concentrations.
Method (V): DD2 method
In this method, the second derivative of the ratio spectrum has been calculated. Several different tests were performed to identify the best parameter of this method. 47 The first derivative of the ratio spectra was evaluated, but no distinct peaks were found, so the second derivative of the ratio spectra was used. Multiple variations of the scaling factor and Δλ were attempted. As shown in Figure 8, the best-denoised derivative spectra with the highest DD2 amplitude were obtained when a second-order derivative with a scaling factor of 100 and Δλ = 8 nm was used. This enables an accurate estimation of LIG concentrations at 277.5 nm, free from XYL interference.

The second derivative of the ratio spectra of LIG at different concentrations using Δλ = 8 nm and scaling factor = 100.
Method (VI): ratio spectra difference method
By investigating the difference between a pair of wavelengths in the ratio spectra, this method eliminated XYL interference. 46 For the XYL, this difference is equal to zero, and its proportions are direct to the LIG. The selection of the two wavelengths at which the measurements were carried out is the most important step. Hence, multiple pairs of wavelengths were attempted. As shown in Figure 9, the best results were obtained at 270.5 and 261 nm (ΔP270.5–261).
Ratio spectra of LIG at different concentrations using (60 μg mL−1) of XYL as a divisor.
Method (VII): ERS method
The XYL spectrum interference was eliminated by the ERS method. 45 The method has relied on the observation that once the spectra of a binary mixture, LIG (A) and XYL (B), overlap, the spectrum of B is significantly more extended than the spectrum of A, as shown in Figure 3; we can obtain the original spectra of A by dividing the zero-order absorption spectra of the LIG and XYL mixture by 60 μg mL−1 of standard XYL (B’ = divisor), providing novel ratio spectra indicating [A + B]/B’. The second step was subtraction, where the obtained ratio spectra after the division were reduced by subtracting the absorbance in the constant area B/B’ (280–300 nm) since LIG (A) possesses no absorbance in this area, as shown in Supplementary Figure 4S. Ultimately, the divisor (B’) was multiplied by the acquired curves after subtracting to provide the original spectra of (A). Based on this spectrum, LIG (A) at 262.6 nm was successfully determined, as shown in Supplementary Figure 5S.
Method (VIII): absorbance subtraction method
This method is based on calculating the absorbance factor. 48 The absorbance values of XYL at 266.5 and 280 nm were collected over (40–160 μg mL−1), and the absorbance factor was determined [A266.5/A280]. By multiplying the absorbance of the mixture at 280 nm by the absorbance factor, we were able to determine the absorbance of XYL at 266.5 nm. Ultimately, we were able to acquire the LIG absorbance at 266.5 nm by subtracting the XYL absorbance at 266.5 nm from the absorbance of the mixture, as well as we were able to determine the LIG concentration by applying the regression equation at 266.5 nm (λiso), as shown in Supplementary Figure 6S.
Method (IX): QA method
In this method, we depend on the absorption ratio in a pair of chosen wavelengths, one at λiso (λ1) and the other being the λmax of one of the two components (λ2). The absorbance values were determined at 262.6 nm (λmax for LIG) and 266.5 nm (λiso) among 72–320 μg mL−1 for LIG and among 40–160 μg mL−1 for XYL. Both LIG and XYL’s absorptivity values (a) were calculated, after that we use absorptivity values (a) and the absorbance ratio at two chosen wavelengths to estimate the concentration of LIG in the mixture using the following equations 49

where m is the mixture, Qm = Amax/Aiso, QLIG = amax/aiso, QXYL = amax/aiso, Amax is the absorbance of the sample at λmax for LIG (262.6 nm), Aiso is the absorbance of the sample at iso-absorptive wavelength 266.5 nm, and aiso is the absorptivity at iso-absorptive wavelength 266.5 nm.
Method (X): AUC method
The respective areas of LIG and XYL under the curves were measured over the ranges (261–265) and (269–272) nm, as shown in (Supplementary Figures 7S and 8S). The concentration of LIG was determined employing “Cramer’s Rule” and the “Matrix Method,” 50 which involved the analysis of absorptivity values (b) and areas under the curve (AUCs) for each component at the chosen wavelength ranges. Consider a mixture that consists of X (LIG) and Y (XYL). The following information about the mixture can be obtained by analyzing the spectra of the two individual components:
The sum of the AUCs of the individual components for a given wavelength range is equivalent to the total AUC for a mixture at the particular wavelength range in question. The following equation can be used to calculate the AUC for a mixture that includes components X and Y:


Now, the equations that were previously discussed can also be expressed as follows


where


The concentration of X (LIG) can be calculated as follows after Cramer’s rule and the matrix method have been applied

Comparative study
After considering the discussed methods for LIG determination, the RD and AUC methods emerge as the simplest and most direct techniques for estimating LIG in the presence of XYL. These methods require analyzing the spectra only once, without the need for additional derivatization or centering steps. However, the selection of an appropriate wavelength pair or range demands careful attention to achieve optimal results, making it a time-consuming process. For low-complexity methods, both QA and AS stand out, but they are limited to situations with an iso-absorptive point. However, the ERS method presents challenges in mathematical implementation and has limited applicability due to the absence of spectrum extension in many cases. To overcome this drawback, both MC and RD-SGF methods offer promising solutions, although each method has its own set of restrictions. The RD-SGF method requires specialized software for processing ratio spectra and involves optimization of multiple parameters in SG coefficient calculation. Similarly, the MC method requires precise wavelength range selection. In contrast, CWT presents a powerful signal-processing technique capable of resolving overlapped signals, offering numerous wavelet families to choose from. This versatility has made CWT a popular choice for signal-processing applications. However, it also necessitates the use of specialized software. Overall, each technique exhibits distinct strengths, but its applicability relies on the specific demands of the chemical research and the available resources. We trust that this in-depth analysis will assist researchers in choosing the most fitting method for their particular analytical objectives.
Methods validation
ICH guidelines were applied for methods validation. 51
Linearity and range
The spectrophotometric approach was applied to quantify FLS, LIG, and XYL. Calibration graphs were constructed, and the linear range was found to be 1–16 μg mL−1 for FLS, 72–320 μg mL−1 for LIG, and 40–160 mL−1 for XYL, as shown in Supplementary Figures 1S–3S. The results showed satisfactory linearity. The regression coefficients are shown in Table 1.
Validation sheet and regression parameters of FLS, XYL, and LIG by the proposed methods.

FLS: fluorescein; XYL: Xylidine; LIG: lignocaine; D0: zero-order absorption spectra; CWT: continuous wavelet transform; RD-SGF: ratio derivative by Savitzky–Golay filter; MC: mean centering; DD2: second derivative of ratio spectra; RD: ratio spectra difference; ERS: extended ratio subtraction; AS: absorbance subtraction; QA: Q-absorbance ratio; AUC: area under the curve; RSD: relative standard deviation; LOD: limit of detection; LOQ: limit of quantification.
Average of three determinations for three concentrations repeated three times.
The intraday (n = 3) relative standard deviation of three concentrations repeated three times within the day.
The interday (n = 3) relative standard deviation of three concentrations repeated three times in three successive days.
Limit of detection and limit of quantification
Both limit of detection (LOD) and limit of quantification (LOQ) reflect the least concentration that analytical methods are capable of reliably quantifying. Thus, LOQ and LOD are measures of methods sensitivity. LOQ and LOD were measured using these equations: LOD = σ3.3/S, LOQ = σ0/S, as shown in Table 1.
Accuracy
The accuracy was determined by calculating the % R. The high accuracy of the presented methods was confirmed by the satisfied % R for FLS, LIG, and XYL, as shown in Table 1.
Precision, repeatability, and intermediate precision
The precision was assessed by calculating the percentage relative standard deviation (RSD). Intermediate precision and repeatability were both evaluated by carrying out an analysis of three separate samples in triplicate on one day and three separate days, respectively. The RSD% was computed, and the results showed that it was less than 2%, as shown in Table 1.
Specificity and interference study
The spectrophotometric approach was used to estimate the FLS, LIG, and XYL in the laboratory-prepared combinations, the results are presented in Supplementary Table 1S, which provides exceptional selectivity. Moreover, to determine whether or not the procedure was valid, we employed the standard addition technique, as shown in Supplementary Table 2S.
Application
Analysis of Minims® ophthalmic solution
The proposed spectrophotometric methods were utilized to analyze the various ratios of LIG and FLS in their marketed eye drops. The obtained results, which are illustrated in Supplementary Table 3S, were used to inform the accuracy of the presented methods. The results were very reliable with those obtained through the application of the reported methods.31,34 According to the results of statistical tests such as the analysis of variance (ANOVA), F-test, and Student’s t-test, there was not a substantial variation in the analytical efficiency in terms of accuracy and precision and, respectively, as shown in Supplementary Tables 3S and 4S.
Analysis of LIG and FLS in aqueous humor
Due to the high sensitivity of the methods that were proposed, it was possible to determine both LIG and FLS simultaneously in the aqueous humor, as shown in Supplementary Table 5S.
White/green analysis
Five assessment tools, including NEMI, ESA, ComplexGAPI, AGREE, and RGB12, were employed to assess and compare the whiteness and greenness of the suggested methods to that of pharmacopeial method. 11 In light of the findings that were obtained, the suggested method can be doubtlessly rated superior to the pharmacopeial method in terms of greenness, whiteness, sustainability, and analytical effectiveness, as well as economical and practical considerations, as shown in Table 2.
Comparison of the greenness and whiteness profiles of proposed and pharmacopeial methods using NEMI, ESA, ComplexGAPI, AGREE, and RGB12 tools.

NEMI: National Environmental Method Index; ESA: Eco-Scale Assessment; GAPI: Green Analytical Procedure Index; AGREE: Analytical GREEnness Metric; RGB: red, green, and blue; PPs: Penalty points score.
ComplexGAPI assessment evaluated using Analytical ComplexGAPI Metric approach and software. 39
AGREE assessment evaluated using Analytical GREEnness Metric approach and software. 40
RGB12 whiteness assessment evaluated using Analytical RGB12 algorithms. 42
Evaluation of the greenness profile of the methods
The development of analytical procedures that take into account green chemistry (GC) concerns is currently the top priority for the analytical community. For instance, the GAC aims to make analytical methods efficient in terms of cost, to be fully automated, to call for a reduced number of sample operations, and to generate a smaller amount of waste, in addition to reducing or eliminating the consumption or production of dangerous chemicals. Recent years have seen the development of a number of qualitative, semi-quantitative, and quantitative approaches for assessing greenness. These methodologies were developed following the 12 GAC principles. The AGREE, ESA, NEMI, and ComplexGAPI evaluation methodologies were used to determine how environmentally friendly the presented approach was. Interestingly, Supplementary Figure 9S elucidates the distinctions between the various tools and the characteristics of each tool that were taken into consideration.
Greenness evaluation following NEMI
NEMI is a traditional tool, as well as one of the first qualitative methods available, that contributes to the process of determining greenness, 37 as shown in Supplementary Figure 10S. It offers a four-quadrant circle, labeled as corrosive, hazardous, PBT (persistent, bio-accumulative, and toxic), and waste that is filled in green if certain criteria are attained, including (1) according to Environmental Protection Agency’s (EPA) Toxics Release Inventory (TRI) Agency, chemicals utilized in the methods are not classified as a PBT, (2) according to the Resource Conservation and Recovery Act’s (RCRA) U, P, F, D, or TRI hazardous waste lists, chemicals utilized in the methods are not classified as hazardous, (3) the pH is not corrosive (between 2 and 12), and (4) the waste amount is less than 50 g. For the proposed approach, we developed NEMI pictograms, as shown in Table 2. The greenness of the suggested approach immediately stood out, since four of the quadrants were colored green, satisfying four NEMI criteria.
Evaluation of greenness following ESA
A new comprehensive semi-quantitative tool for assessing the greenness of the methodology. 38 It depends on subtracting points, called penalty points, for analytical process parameters that do not align with the 12 GAC concepts. An optimal greener analysis has a higher score (nearer to 100). The ESA scores of the suggested methods were determined, as shown in Table 2. The greenness of the suggested approach immediately stood out which was evidenced by its high ESA score of 91 points. A summary of the penalty points for analytical process parameters is shown in Supplementary Materials (Supplementary Figure 11S).
Greenness evaluation following ComplexGAPI
More recently, the new semi-quantitative ComplexGAPI tool succeeded in attracting the interest, confidence, and acceptance of the chemical society, as it is a simple tool that improves the current GAPI metric by inserting an extra hexagonal area into the original GAPI graph depending on the parameters of CHEM21 that represent the steps and procedures that take place before the general analytical methodology and the final analysis, 39 as shown in Supplementary Figure 12S. Thus, it can cover every step of analytical methods, including the collection of samples, transportation, preservation, and storing, in addition to the preparation of samples, and final analysis, as well as those steps and procedures that take place before the analytical methodology. Above all, the ComplexGAPI tool has shareware software for producing ComplexGAPI pictograms to make using the tool easier. Interestingly, from green to yellow to red, the produced pictogram can be employed to assess and quantify each step before the general analytical methodology and the final analysis. The presented methods were green in respect of green pictograms and the E-factor. The proposed methods showed a lower E-factor (equal to 1), which indicates that the lower the waste generation, the greater the positive environmental impact, and the higher the sustainability, proving that the presented methods are superior in terms of greenness, as shown in Table 2.
Greenness evaluation following AGREE
AGREE is the most trend greenness evaluation metric. 40 It is thorough (by including all 12 principles of GAC), flexible (by allowing for weighting), simple to understand (the result is a colored pictogram), and straightforward to apply (with available free software). The 12 important principles are referenced in the input parameters, which can be given various weights to provide some flexibility. The 12 input parameters are converted into a final score with a range of 0–1. The result is a graph that resembles a clock with a score and color in the center representing the final score. The score can vary from dusky green (=1) to dusky red (=0). Before creating comprehensive assessments with multi-colored diagrams, we first recorded the crucial information for the suggested methods and those that were previously reported in pharmacopeia regarding the 12 parameters of the GAC, as shown in Supplementary Figures 13S and 14S. The graphs in Table 2 demonstrate the exceptional greenness of the proposed methods, which received a score of 0.82 showing superior green effectiveness.
Evaluation of the whiteness of the presented methods
In June 2021, PM Nowak and his colleagues offered an easy-to-use and quantitative whiteness evaluation tool, called RGB12 tool which offers an easy-to-understand assessment of the methods following the 12 WAC considerations and calculates the sustainability level in terms of whiteness assessment. 42 The RGB12 algorithm is comprised of a total of 12 different algorithms, all of which are organized under the overarching categories of four red, four green, and four blue. The green group (G1–G4) addresses the most significant GAC parameters, including toxicity and the number of reagents and waste, as well as the amount of energy consumed and the impacts on humans, animals, and/or genetic modifications (GMO). The second group is the red group (R1–R4) which addresses the validation parameters, including the scope of application, accuracy, LOD, precision, and LOQ. The third group is the blue group (B1–B4) which addresses cost efficiency, time efficiency, and practical/economic requirements. The ultimate actual value of “whiteness,” which measures how well the methods complies with the concepts of WAC, is determined by adding the marks received by the methods for every one of the three areas/colors using the RGB algorithm. The proposed methods show exceptional whiteness with a score of 90.8, as shown in Table 2, demonstrating that the presented methods have various advantages in terms of greenness, whiteness, sustainability, and analytical effectiveness, as well as economical and practical considerations, as shown in Supplementary Figure 15S.
Conclusion
In conclusion, innovative, sensitive, cost-effective, simple, and highly selective spectrophotometric methods have made it possible to quickly detect and measure FLS, the most commonly used ophthalmic diagnostic dye, and LIG, the most commonly used anesthetic agent, in the presence of XYL, LIG’s carcinogenic impurity-A, in newly Food and Drug Administration (FDA)-approved co-formulated eye solution and aqueous humor without any pretreatment or separation. Five assessment tools, including NEMI, ESA, ComplexGAPI, AGREE, and RGB12, were used to assess the whiteness and greenness of the suggested methods. In light of the findings that were obtained throughout the research, the suggested methods can be doubtlessly rated superior to the other methods in terms of greenness, whiteness, sustainability, and analytical effectiveness, as well as economical and practical considerations, which remarkably confirms the ability of the developed approach to be applied for routine quality control and in situ analysis in minimal-infrastructure laboratories, increasing the proposed approach’s surveillance potential. Furthermore, it inspires the use of spectrophotometric methods as a potent analysis tool for establishing a green-and-white analytical technique that can be used as an alternative to nongreen and extremely high-cost traditional methods.
Experimental
Apparatus
The apparatus consists of dual-beam UV-Vis Shimadzu Spectrophotometer (Kyoto, Japan, UV-1800 PC) with UV-Probe software UV-Probe (version 2.21). The scanning was employed by 1 cm quartz cuvettes with a rate of 2800 nm min−1, and the data interval equaled 0.1 nm. The CWT, RD-SGF, and MC methods were performed in MATLAB® R2013b. Using Microsoft Excel, F-test, Student’s t-test, and one-way analysis of variance (ANOVA) were carried out.
Chemicals and reagents
Lignocaine hydrochloride (LIG) (99.79%) was kindly supplied by DBK Pharmaceutical Company (Zone 11 block 12014 Obour city, Cairo, Egypt). XYL (98.86%) was provided by Sigma-Aldrich (Germany). Fluorescein sodium (FLS) (99.70%) was kindly provided by Sigma Pharmaceutical Company (Moubarak Industrial City, Menofia, Egypt). Minims® ophthalmic solution (batch no. H24366), manufactured by (Bausch & Lomb Ireland Ltd, Surrey, UK) was purchased from a local pharmacy, labeled to include 4% (w/v) LIG and 0.25% (w/v) FLS. Made-up aqueous humor was formulated to simulate human aqueous humor. 52 All solutions of the experiment were made with double-distilled water from a Millipore Milli-Q deionized system (Burlington, MA, USA), and each experiment was carried out at the typical room temperature.
Standard and working solutions
Stock solutions of LIG, XYL, and FLS were prepared in double-distilled water at concentrations of 2, 1, and 0.25 mg mL−1 of each, respectively. Subsequently, LIG, XYL, and FLS working solutions were prepared in double-distilled water at concentrations of 400, 200, and 25 μg mL−1 of each, respectively. The acquired solutions were reliable enough that they could be kept in a blackish glass container in the refrigerator at 8°C for approximately 4 weeks.
Laboratory-prepared mixtures of varying proportions of LIG, XYL, and FLS
To obtain mixtures with varying ratios of LIG, XYL, and FLS, the aliquots were carefully transferred from their matching working solutions to a series of 10-mL volumetric flasks, and the remaining volume was filled with double-distilled water.
Procedures
LIG, XYL, and FLS spectral characteristics
A blank of double-distilled water was used to record the zero-order (D0) absorption spectra of LIG, XYL, and FLS at concentrations of 80, 80, and 5 μg mL−1, respectively, as shown in Figure 1.
Construction of calibration graphs
A series of volumetric flasks with a capacity of 10 mL each was filled with aliquots of LIG, XYL, and FLS that had been accurately transferred from their respective working solutions. Final concentrations of 72–320 μg mL−1 for LIG, 40–160 μg mL−1 for XYL, and 1–16 μg mL−1 for FLS were obtained by filling the volume with double-distilled water. From 200 to 530 nm, the zero-order (D0) absorption spectra of the yielded solutions were monitored and recorded. In addition, plotting absorbance values versus cited drug concentrations allowed for the derivation of calibration graphs as well as regression equations, as shown in Supplementary Figures 1S–3S.
Method (I): direct zero-order UV method for FLS
FLS was quantified at 478 nm, free of interference from LIG and XYL, employing the calibration graph and the affiliated regression equation, which can be found in section “Construction of calibration graphs.”
FLS interference elimination by RSM
In all the presented methods, the interference of FLS was eliminated by employing the RS method in three steps using 5 µg mL−1 of FLS as a divisor. The first step was division, where the recorded spectra of the ternary mixtures LIG, XYL, and FLS were divided by 5 µg mL−1 of FLS as a divisor. The second step was subtraction, where the obtained ratio spectra after the division were reduced by subtracting the absorbance in the constant area (312–530 nm). Ultimately, the divisor was multiplied by the acquired curves after subtraction, and the resulting spectra were recorded.
Direct UV method for XYL
From the ratio spectra obtained after the removal of FLS by the RS method, XYL was determined at 280 nm, free of any interference from LIG employing the calibration graph and affiliated regression equation, which can be found under section “Evaluation of the whiteness of the presented methods.”
Method (II): CWT method for LIG
As mentioned above, LIG’s zero-order absorption spectra were obtained in the range (72–320 μg mL−1). In a MATLAB environment, these spectra were processed into the wavelet domain using (Coif2) and a scaling factor of 20. Plotting the wavelet coefficient of the converted signals at 248.6 nm against the corresponding concentrations allowed for the derivation of calibration graphs as well as the regression equation.
Method (III): ratio derivative by Savitzky–Golay filters method for LIG
As previously mentioned, LIG’s zero-order absorption spectra in the range (72–320 μg mL−1) were obtained. The ratio spectra are then acquired by dividing LIG’s zero-order absorption spectra by XYL divisor spectrum (60 μg mL−1). Using MATLAB, a 20-point window size, and a quadratic model filter, the first derivative of the acquired ratio spectra were applied using the SGF method. Plotting the SGF amplitude at 270 nm versus the corresponding concentrations allowed for the derivation of calibration graphs as well as the regression equation.
Method (IV): MC method for LIG
As described in section “2.5.2.5,” the LIG ratio spectra were acquired. In the MATLAB environment, LIG ratio spectra were mean-centered. The calibration graph for LIG was constructed by plotting the MC values of the spectra at 261 nm versus the corresponding concentrations of LIG, and the regression equation was computed.
Method (V): DD2 method for LIG
As described in section “
Method (VI): ratio spectra difference method for LIG
As described in section “2.5.2.5,” the LIG ratio spectra were acquired. The difference in amplitudes at 270.5 and 261 nm (ΔP270.5–261) was calculated. Plotting (ΔP270.5–261) against the corresponding concentrations allowed for the derivation of calibration graphs as well as the regression equation.
Method (VII): ERS method for LIG
For LIG quantification, the XYL spectrum was eliminated by employing the ERS method. Direct quantification of LIG was achieved by graphing the amplitude of the obtained spectra at 262.6 nm versus the matching concentrations.
Method (VIII): absorbance subtraction method
The absorbance of LIG in the range of 72–320 μg mL−1 was recorded at 266.5 nm (λiso), and a calibration graph was acquired by associating the absorbance at λiso to the matching concentrations.
Method (IX): QA method for LIG
The absorbance of LIG and XYL was measured at 262.6 nm (λmax for LIG) and 266.5 nm (λiso) between 72–320 μg mL−1 and 40–160 μg mL−1, respectively. The calibration graphs were acquired, and absorptivity values were calculated for both LIG and XYL. The concentration of LIG in their ternary mixture was determined using the absorptivity values and the absorbance ratio.
Method (X): AUC method for LIG
Using the built-in UV-Probe software, the area under the LIG curves was calculated between 72 and 320 μg mL−1, and a calibration graph was acquired by relating the AUC to the associated concentrations.
Application to laboratory-prepared mixtures
FLS was quantified, free of any interference from LIG and XYL, at 478 nm. In all the methods presented, to remove the FLS spectrum, the recorded spectra of ternary mixtures were divided by 5 µg mL−1 of FLS as a divisor. The acquired ratio spectra after division were reduced by subtracting the absorbance in the content area (312–530 nm). Ultimately, the divisor was multiplied by the acquired curves after subtraction, and the resulting spectra were recorded. The steps outlined in section “Construction of calibration graphs” were then implemented.
Application of the methods presented for the quantification of LIG and FLS in Minims® ophthalmic solution
According to the label, Minims® ophthalmic solution contains 4% (w/v) LIG and 0.25 (w/v) FLS. One milliliter of Minims® eye drops was poured into a volumetric flask of 100 mL. Required concentrations of 400 and 25 µg mL−1 for LIG and FLS, respectively, were obtained by diluting the fluid to the correct volume using double-distilled water. To get the required concentrations within the allowed ranges, double-distilled water was used to dilute aliquots of the dosage form solutions. The methods detailed in section “Construction of calibration graphs” were then used. To determine whether or not the approach yielded accurate results, the recovery, denoted as % R, was calculated and the standard addition technique was employed.
Application to aqueous humor
In a series of 10 mL volumetric flasks, an aliquot (1 mL) of aqueous humor was transferred. Quantitative additions of the LIG and FLS working solution were applied in the working concentration range, and the mixture was vortexed for 2 min. The methods outlined in section “Construction of calibration graphs” were then implemented.
Supplemental Material
sj-docx-1-chl-10.1177_17475198231195811 – Supplemental material for A sustainable data processing approach using ultraviolet-spectroscopy as a powerful spectral resolution tool for simultaneously estimating newly approved eye solution in the presence of extremely carcinogenic impurity aided with various greenness and whiteness assessment perspectives: Application to aqueous humor
Supplemental material, sj-docx-1-chl-10.1177_17475198231195811 for A sustainable data processing approach using ultraviolet-spectroscopy as a powerful spectral resolution tool for simultaneously estimating newly approved eye solution in the presence of extremely carcinogenic impurity aided with various greenness and whiteness assessment perspectives: Application to aqueous humor by Khalid A.M. Attia, Ahmed El-Olemy, Ahmed Emad F. Abbas and Sherif M. Eid in Journal of Chemical Research
Footnotes
Declaration of conflicting interests
The author(s) declared no potential conflicts of interest with respect to the research, authorship, and/or publication of this article.
Funding
The author(s) received no financial support for the research, authorship, and/or publication of this article.
Supplemental Material
Supplemental material for this article is available online.
References
Supplementary Material
Please find the following supplemental material available below.
For Open Access articles published under a Creative Commons License, all supplemental material carries the same license as the article it is associated with.
For non-Open Access articles published, all supplemental material carries a non-exclusive license, and permission requests for re-use of supplemental material or any part of supplemental material shall be sent directly to the copyright owner as specified in the copyright notice associated with the article.