
Abstract
Diphenyl fumarate is synthesized from maleic anhydride and phenol under solvent-free conditions. The structure of the product is characterized by FTIR, 1H NMR, and 13C NMR. The molecular structure is optimized using the density functional theory approach at the B3LYP/6-311G(d,p) level and the structural parameters are analyzed. Theoretical vibrational frequencies are investigated at the same level; the 1H NMR and 13C NMR are simulated using the default gauge-independent atomic orbital method at the B3LYP/6-31G(d) level and the solvation model density implicit continuum solvation model for chloroform; chemical shifts are scaled using scaling factors available on the cheshirenmr.info website (accessed 12 September 2021). In addition, the UV-Vis absorption and fluorescence emission are simulated using the time-dependent method at the PBE38/6-311G(d,p) level. All the calculated spectral values are compared with the experimental data. A generally good agreement between the experimental and theoretical results is found. The results reveal diphenyl fumarate as a candidate substrate for small-molecule organic fluorophores with a large Stokes shift. This work provides a detailed experimental and theoretical study on the structural and spectral properties of diphenyl fumarate, and thus provides proof for the novel applications of diphenyl fumarate and its derivatives.
Keywords
Introduction
Diphenyl fumarate is an aryl unsaturated carboxylic ester. Due to its large conjugated structure, it has good electronic properties and can be used for the preparation of photosensitive materials, photosensitive elastomer compositions, 1 and thermal recording materials. 2 Furthermore, it can participate in the Diels–Alder reactions for the synthesis of complex molecules, 3 and can also undergo the Michael additions or act as the Michael acceptors, 4 addition to 1,3-dipolarophiles,5,6 and coordination with metals for synthesizing functionalized molecules. 7
Diphenyl fumarate is generally prepared by the reaction of phenol and fumaryl dichloride. 8 If fumaryl dichloride is replaced with maleic anhydride, it is more likely to afford diphenyl maleate as the main product. 9 Because fumaryl dichloride is often obtained from maleic acid 10 or maleic anhydride, 11 the synthesis of diphenyl fumarate directly from maleic anhydride is still attractive.
Although there are a few reports on the structure of diphenyl fumarate,12,13 the differences between the structures of diphenyl fumarate in different conformations have not been described. Diphenyl fumarate is an important photosensitive material, but its absorption and emission spectra have not yet been reported in detail. In this work, to further understand the relationship between the structure and properties of diphenyl fumarate, and to expand its application range, a method for synthesizing diphenyl fumarate from maleic anhydride is discussed, and the structures of the different conformations of diphenyl fumarate are simulated. Experimental and theoretical studies on its spectral properties including infrared, NMR, ultraviolet absorption, and fluorescence emission are conducted. This work provides a new method for the synthesis of diphenyl fumarate, a detailed analysis of its structure and spectral properties, and speculates on its electronic properties. The results are expected to probe the relationship between structures and luminescence properties and to benefit the molecular design of aryl unsaturated carboxylic acid esters. At the same time, the reliability of the theoretical calculation method used in this work is verified by experimental results; therefore, it can be used to simulate the structures and properties of diphenyl fumarate analogs.
Results and discussion
Synthetic method
In this work, diphenyl fumarate was synthesized using phenol and maleic anhydride in the presence of KOH under solvent-free conditions. A plausible mechanism is depicted in Scheme 1. When the reaction temperature was increased to a high level, both phenol and maleic anhydride melted into liquids, and the KOH used could be partially dissolved in this melted liquid, eliminating the need for solvents. Phenol is expected to react with KOH to form potassium phenoxide, which will then attack maleic anhydride to form the salt of phenoxy maleic acid. The potassium salt of phenoxy fumarate acid may form as a result of subsequent isomerization caused by the high temperature; the excess phenol in the system is expected to protonate this salt with subsequent nucleophilic addition to it, and the addition product is assumed to undergo dehydration to produce the final product. As there are no solvents in this low-comelted system, the reaction temperature may be further increased, which is more favorable for the isomerization of diphenyl maleate into phenyl fumarate because fumarate is more stable than maleate. Furthermore, a higher temperature causes the water to be eliminated more efficiently, enabling the product to be produced more easily.

A plausible mechanism for the reaction.
Optimized molecular structures
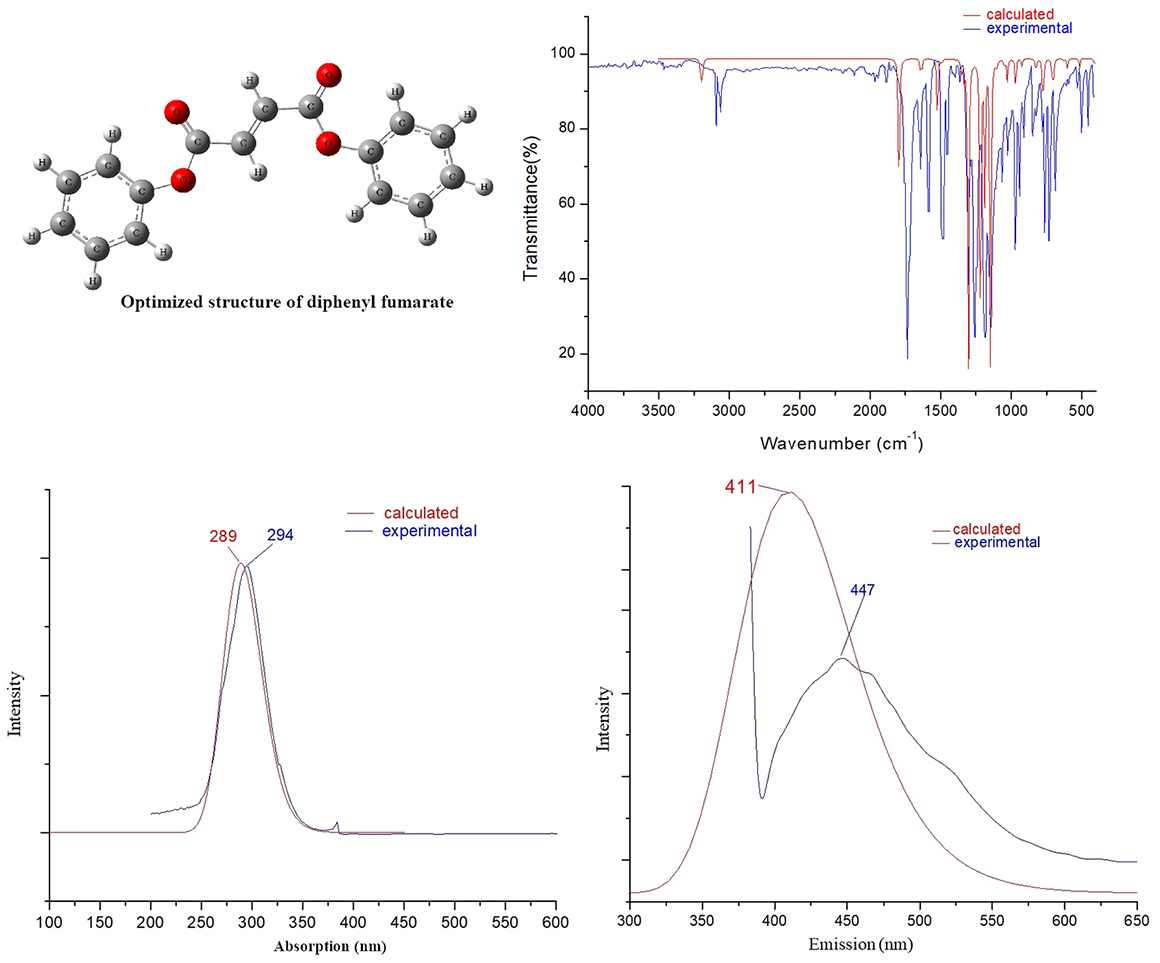
There are three conformations of diphenyl fumarate, and the optimized structures are shown in Figure 1. In Figure 1, (a) shows the structure in which both the two C=O are in s-cis conformation to the C=C bond, (b) shows the structure in which one C=O is in s-cis conformation to the C=C bond and the other C=O is in s-trans to the C=C bond, and (c) shows the structure in which both the two C=O groups are in s-trans conformation to the C=C bond. Comparing the energies of these structures, it is found that structure (a) is the most stable with the Gibbs free energy differences of 14.7 and 9.8 kJ mol−1 from (b) and (c), respectively. As a result, only structure (a) was studied in this work, and the corresponding structural parameters were listed in Supplemental Table S1.

The optimized conformational structures of diphenyl fumarate.
From Figure 1(a) and Supplemental Table S1, it can be seen that the structure is centrosymmetric with the midpoint of the C=C bond as the inversion center. Each bond in the phenyl ring and the ester group on the left-hand side of the structure in Figure 2(a) corresponds to a bond of the same length on the right-hand side of the structure. For example, the bond length of C1–C2 on the left-hand side phenyl ring is 1.39 Å, and the bond length of C21–C23 in the right-hand side phenyl ring is also 1.39 Å; C1–H7 on the left phenyl ring corresponds to C23–H28 in the right-hand side phenyl ring with both bond lengths being 1.08 Å. In addition, both C15–O31 and C17–O19 are 1.36 Å in length, and both C=O bond lengths are 1.20 Å.
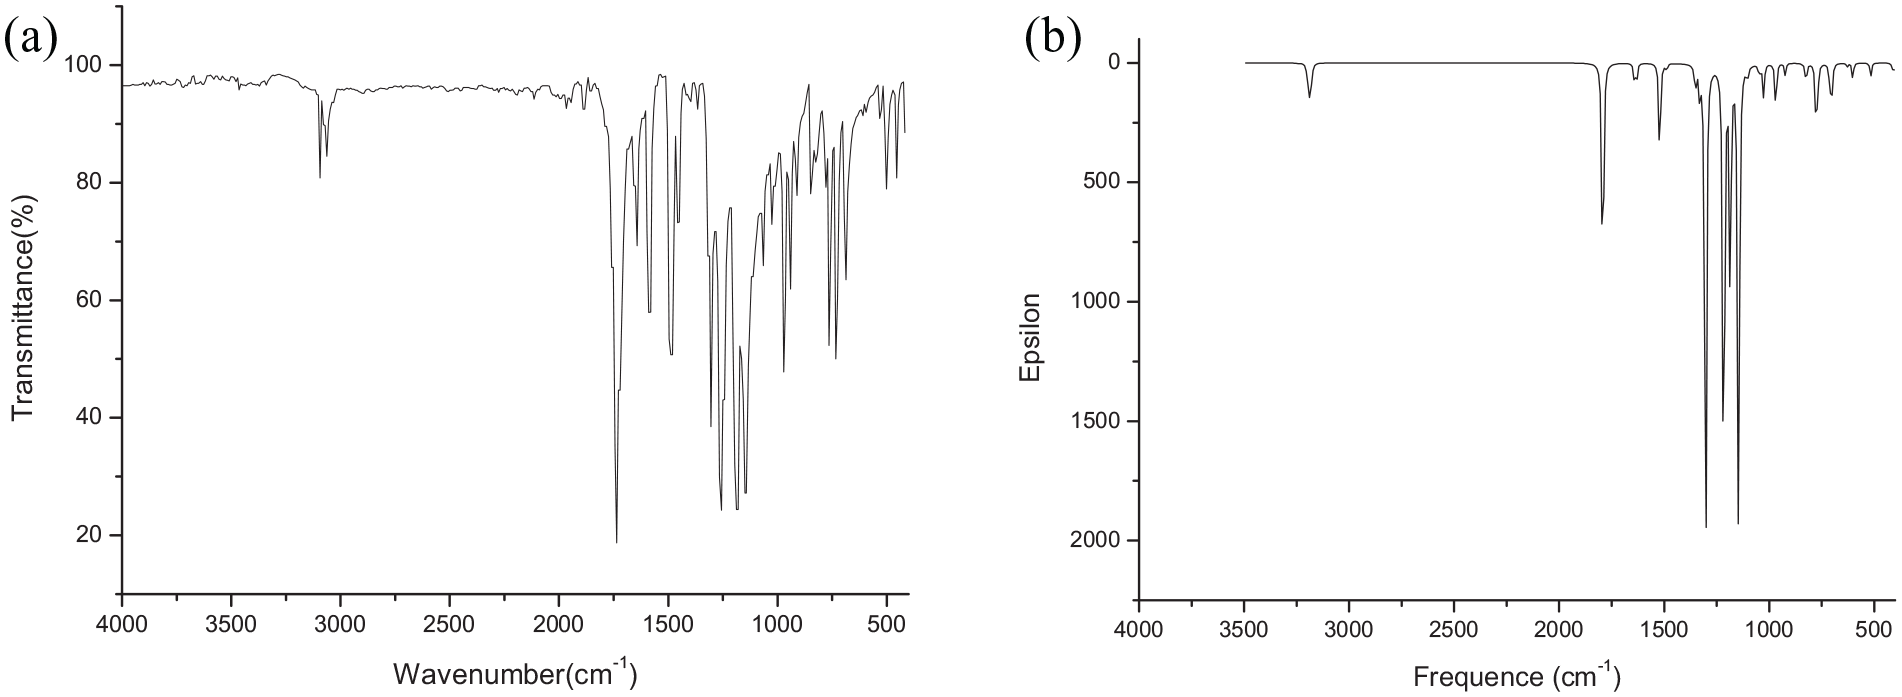
Calculated and experimental IR spectra of diphenyl fumarate: (a) (Exp.) and (b) (Cal.).
The two C–C(O)–C bond angles in the phenyl rings are slightly larger than 120°, while the other C–C–C bond angles in the phenyl rings are slightly less than 120°; all the C–C–H bond angles in the phenyl rings are larger than 120°. The oxygen atoms bonded to the phenyl rings make the rings partially deformed. Both O=C–O bond angles are 125.59°, the two O=C–C bond angles are 125.55°, and the two O–C–C bond angles are 108.86°.
The dihedral (D) angles in the phenyl rings are close to 0°, indicating that the atoms on the phenyl rings are basically in the same plane. D (31,3,4,5) is 177.17°, and D (19,20,22,25) is 177.17°, indicating that the phenyl rings are not in the same plane as the ester groups. D (16,15,12,13) is −0.52°, and D (18,17,13,12) is 0.52°, showing that the ester groups are basically in the same plane with the C=C bond.
Vibrational assignments
The observed and simulated IR spectra are shown in Figure 2. Theoretical (unscaled and scaled) and experimental vibrational frequencies (cm−1), peak intensities (km mol−1), and the corresponding assignments for the vibrational modes are gathered in Supplemental Table S2. Comparing the experimental spectrum to that calculated in Figure 2, it is easy to see that the calculations provide a good frequency match with the observed spectra, although certain intensities do not match. B3LYP is the best functional for predicting vibrational frequencies; however, measuring the experimental infrared intensities is problematic due to overlapping bands, resonances, intensity sharing, and other factors. 14 In addition, there are certain peaks in the experimental spectrum between 1500 and 1800 cm−1 that do not match the simulated frequency data. This is because anharmonic couplings between fundamental vibrations and overtones, as well as combination bands of other modes, are not taken into account in the computations.
Taking into account the agreement between the theoretical and experimental vibrational frequencies, it is suggested that the density functional theory (DFT) method with the hybrid B3LYP functional is still dependable for the prediction of IR spectra of diphenyl fumarate and its analogs.
The C–H stretching vibrations of aromatic structures often occur in the range of 3030–3100 cm−1. The phenyl C–C stretching vibrations generally appear at 1450, 1500, 1580, and 1600 cm−1 in the IR spectrum with variable intensities. 15
For diphenyl fumarate, the theoretical frequency at 3084 cm−1 is attributed to the C–H stretching vibration of the phenyl ring. The calculated frequencies of 1306, 1471, 1577, and 1587 cm−1 are assigned to the aromatic C–C stretching vibrations and are in agreement with the experimental absorptions of 1311, 1481, 1581, and 1589 cm−1. In general, for unsaturated esters, the C=O stretches of α, β-unsaturated esters appear at 1715–1730 cm−1, and the C–O stretches appear as two or more bands in the region 1000–1300 cm−1. 16
The computed frequency at 937 cm−1 is assigned to the C–O stretching vibration of ester groups, which is mixed with the out-of-plane bending vibration of the phenyl rings while the C–O, C=O stretching vibrations contribute to the signals appearing at 1108 and 1733 cm−1, respectively. These simulated signals correspond to the experimental absorptions at 941, 1126, and 1736 cm−1, respectively.
The =C–H stretching occurs from 3000 to 3100 cm−1; the C=C stretching occurs in the 1640–1675 cm−1 range; the trans alkene =C–H bending mode appears at 960–980 cm−1 with a strong signal, while the cis alkene =C–H bending mode absorbs infrared radiation at 675–730 cm−1 weakly. 17
The predicted values of 3095 and 3098 cm−1 for diphenyl fumarate, which is exceedingly low in intensity, correlate to the =C–H stretching. They are compatible with the observed values of 3102 and 3111 cm−1. The calculated value of 1650 cm−1 corresponds to the C=C stretching of the vinyl group based on the vibrational modes assignments performed using the animation option of GaussView 05 graphical interface for Gaussian program. However, the intensity of this value is zero because of the symmetric molecular structure. For this reason, no experimental signal is assigned for this vibration. The calculated values of 1108 and 1260 cm−1 correspond to the C–H wags of CH=CH–, which are consistent with the experimental values of 1126 and 1257 cm−1. The computed frequency of 995 cm−1 corresponds to the out-of-plane bending of C–H bonds on the trans –CH=CH– unit, which is in accordance with the experimental value of 972 cm−1 and can be used to identify the trans configuration of the –CH=CH– moiety.
NMR chemical shifts
The NMR values drawn from the observed spectra are described as follows: 1H NMR (600 MHz, CDCl3): δ = 7.49–7.43 (m, 4H), 7.35–7.26 (m, 4H), 7.24–7.18 (m, 4H). 13C NMR (151 MHz, CDCl3): δ = 163.07, 150.72, 134.84, 129.64, 126.70, 121.12.
In Supplemental Figure S1, the 1H NMR spectrum of this product is compared to a reference’s spectra of the cis- and trans-isomers of diphenyl 2-but-2-enedioate; the comparison shows that the 1H NMR spectrum of the product obtained in this work is nearly identical to that of the reference’s trans-isomer of diphenyl 2-but-2-enedioate, confirming that the product is diphenyl fumarate. The assignments are further defined with the help of calculated results.
The computational chemical shifts were obtained by following the scaling method recommended by Tantillo and co-workers. 18 A comparison between the experimental and calculated values together with the peak assignments is shown in Supplemental Tables S1 and S2. Normally, the protons on a phenyl ring are expected to exhibit NMR signals in the region of 6–8 ppm, the proton on the carbon of a phenyl ring which is attached to a –OCOR group appears at 7.0–8.0 ppm, and protons of a vinyl group which is bonded to a –COOR group give signals at 5.5–8 ppm. 19
The calculated 1H NMR chemical shifts are listed in Table 1. The calculated signal at 7.66 ppm is generated by the two ortho-phenyl protons, which are closer to the C=O group in the structure than the other two ortho-protons. The calculated signal of 7.43 ppm is produced by the two meta-phenyl protons which are closer to the C–O group than the other two meta-protons, with both resonances corresponding to the experimental signals at 7.49–7.43 ppm. The calculated signal at 7.40 ppm is generated by the two meta-phenyl protons, which are closer to the C=O group in the structure than the other two meta-protons, while the signal at 7.24 ppm is due to the two para-protons on the phenyl ring and corresponds to the experimental signals at 7.35–7.26 ppm. The calculated signal at 7.10 ppm is generated by the two vinyl protons and that at 6.97 ppm is produced by the two ortho-phenyl protons, which are closer to the C–O group; these signals correspond to the experimental resonances at 7.18–7.24 ppm. Each group of experimental signals presents as a multiplet because some signals overlap.
A comparison of the theoretical and experimental values of the 1H NMR chemical shifts of diphenyl fumarate.

A comparison of the theoretical and experimental values of the 13C NMR chemical shifts for diphenyl fumarate is listed in Supplemental Table S2. The carbons on a phenyl ring normally give NMR signals in the region of 110–130 ppm. The carbon on a phenyl ring bonded to an oxygen atom of an ester group gives a signal at 130–160 ppm, the carbon of a vinyl group bonded to the C=O of an ester group gives a signal at 105–160 ppm, and the carbon of an ester group appears at 165–180 ppm. 20
The calculated 13C NMR chemical shifts are listed in Table 2. Supported by the above information and as indicated by the calculated values, the observed chemical shift of 163.07 ppm is assigned to the signals generated by the two C(=O) groups (C17, C15) which correspond to the calculated value of 163.25 ppm, the signal at 150.72 ppm is assigned to C(–O–C=O) (C3, C20) with the calculated value being 151.45 ppm; 134.84 ppm is assigned to –C=C– (C12, C13) with the calculated value of 138.21 ppm; 129.64 ppm is assigned to the four phenyl carbon atoms at meta positions among which two (C5, C25) correspond to the calculated value of 128.76 ppm and the other two (C1, C23) correspond to the calculated value of 128.38 ppm; 126.70 ppm is assigned to the two phenyl carbon atoms (C6, C27) at para positions with the calculated value of 124.79 ppm; 121.12 ppm is assigned to the four phenyl carbon atoms at ortho positions of which two (C2, C21) correspond to the calculated value of 120.22 ppm and the other two (C4, C22) correspond to the calculated value of 118.84 ppm.
A comparison of the theoretical and experimental values of the 13C NMR chemical shifts of diphenyl fumarate.

The results indicate that almost all the calculated chemical shifts are in excellent agreement with the experimental data except for that of C4 and C22. This may be the result of a negligible contribution from the other two conformations.
UV-Vis absorption and fluorescence spectra
Frontier molecular orbitals, specifically the highest occupied molecular orbital (HOMO) and the lowest unoccupied molecular orbital (LUMO), are very important in elucidating the spectral properties. For this reason, the frontier molecular orbitals of the molecule plotted by the GaussView are depicted in Figure 3. It can be seen that the HOMO orbitals are mostly localized on the phenyl rings, and partially located on the ester groups and the –CH=CH– group, while the LUMO orbitals are mostly located on the –CH=CH– and ester groups.
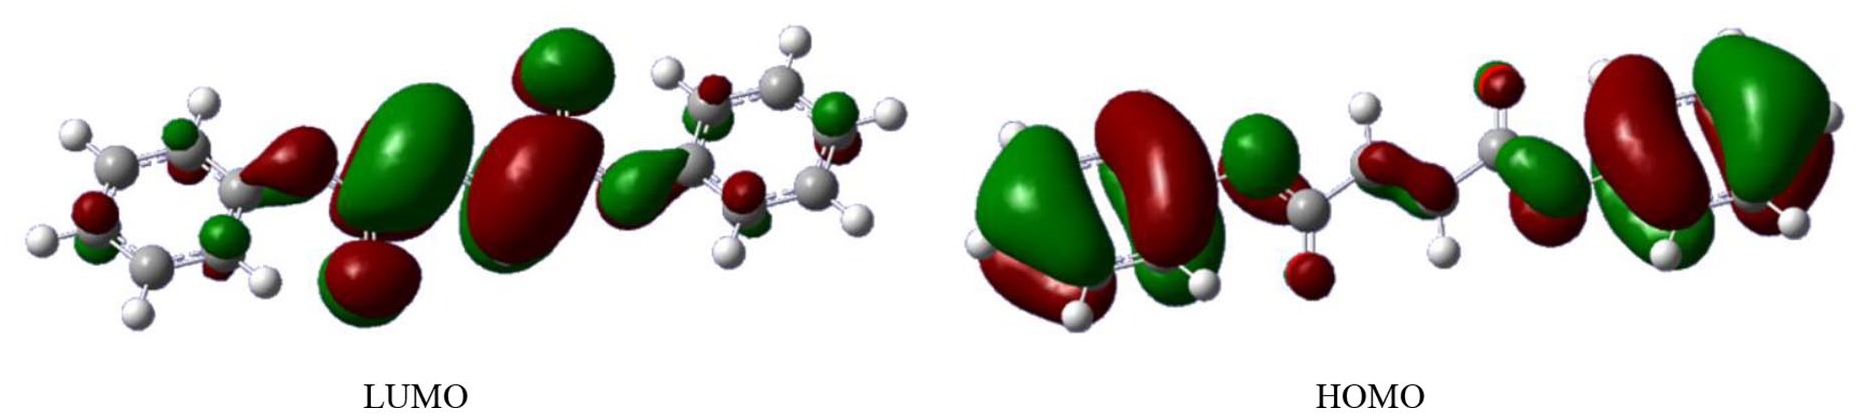
Frontier molecular orbitals of diphenyl fumarate.
According to the analysis of molecular orbital ingredients, it can be seen that when the electron transition goes from the ground state to the excited state, the electron transfers from the phenyl rings to the –CH=CH– and ester groups. Because the shape of the HOMO is different from that of the LUMO, the energy gap (4.30 eV) is relatively broad and the transition of the electrons from the HOMO to the LUMO is not so easy. It can be deduced that by raising the electron density of the phenyl ring or by reducing that of the vinyl group, the energy gap of the frontier MOs can be narrowed; thereby both the light-absorption and light-emission efficiency may be improved. This information provides support for the design of more useful molecules having similar structures to diphenyl fumarate.
The experimental absorption spectrum of diphenyl fumarate is shown in Figure 4. The calculated UV-Vis absorption spectrum was determined using the conventional time-dependent (TD)-DFT procedure on the ground state geometries at the PBE38/6-311gG(d,p) level. The results in Figure 4 show that diphenyl fumarate has maximum absorption at 294 nm in the UV-Vis region experimentally. The calculated results show that the excitation energy (289 nm, 4.30 eV, f = 0.4108) for the singlet state S1 (HOMO → LUMO 97.7%) is very close to this experimental absorption. This maximum absorption peak is located at the near-ultraviolet zone, which can be attributed to the transfer from the ground state to the first excited state, the corresponding electron transition is mainly from HOMO to LUMO, and the transfer is π–π* based on the orbit symmetry. The simulated spectrum exhibits excellent agreement with the experimental one.
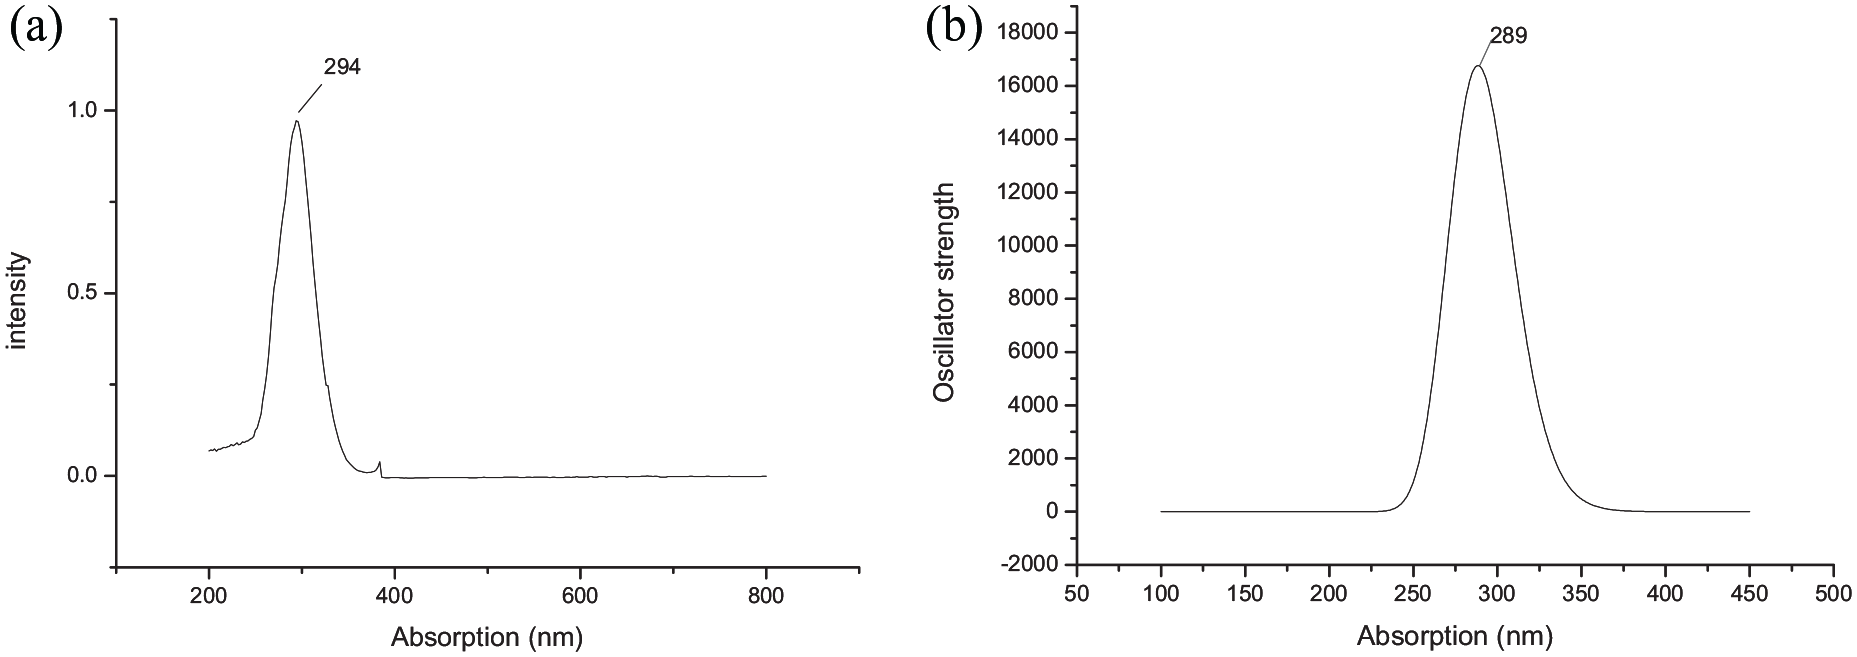
UV-Vis absorption spectra of diphenyl fumarate (a) observed (in solid-state) and (b) calculated.
The experimental and simulated fluorescence spectra of diphenyl fumarate are shown in Figure 5. The fluorescence emission spectrum is simulated using the TD-DFT method at the same level as with absorption but on the excited state geometries. The fluorescence emission of diphenyl fumarate is observed at 447 nm, and the computed value of 411 nm (3.02 eV, f = 0.1207) for the singlet state S3 (HOMO-2 ← LUMO 98.1%) is in good agreement with the experimental values with only a 36 nm difference. The maximum emitting peak corresponds to the transfer from the first excited state to the ground state, with the corresponding electron transition from LUMO to HOMO-2.

Fluorescence spectra of diphenyl fumarate (a) observed (in solid-state) and (b) calculated.
Conclusion
In this study, diphenyl fumarate has been synthesized via a new method under solvent-free conditions starting from phenol and maleic anhydride. Its structure was characterized by FTIR and NMR. Theoretical studies using the DFT/B3LYP method with the 6-311G(d,p) basis set were applied to investigate the optimized geometric parameters, while vibrational frequencies were analyzed at the same level. Three conformational structures were optimized and the results revealed that the most stable structure occurs when both the two C=O groups are in s-cis conformation relative to the C=C bond. The 1H and 13C NMR chemical shifts of diphenyl fumarate were calculated based on the most stable conformational structure at the B3LYP/6-31G(d)//B3LYP/6-31G(d)SMD-CHCl3 level with a forward scaling correction using scaling factors available from the cheshirenmr.info website (accessed 12 September 2021). The theoretical vibrational frequencies and chemical shift values are in good agreement with the experimental results.
The optical absorption and emission properties have also been discussed theoretically and experimentally. The TD-DFT method at the PBE38/6-311G(d,p) level was applied to simulate the absorption and emission spectra. The experimental results show that diphenyl fumarate absorbs UV light with a maximum intensity at 294 nm and exhibits emission in the UV region at 447 nm. A large Stokes shift is found therein. It is known that a large Stokes shift is a very important attribute of a fluorophore because of the self-quenching occurring in fluorophores with a small Stokes shift. 20 Therefore, diphenyl fumarate can be used as a candidate substrate for small-molecule organic fluorophores for imaging and sensing. What is more, the theoretical results are in good agreement with the experimental values. This proves that the selected theoretical methods are feasible for predicting the structures and spectral properties of structurally similar compounds and consequently for the accurate theoretical designing and characterization of structures, and for evaluation of the spectral properties for new structurally similar compounds.
Synthesis and experimental methods
All the chemicals used were of analytical reagent grade obtained commercially and were used as received without further purification unless otherwise stated.
Synthetic procedure
Phenol (1.88 g, 0.02 mol) and KOH (0.17 g, 0.003 mol) were placed in a round-bottomed flask equipped with an air condenser. The flask was heated in an oil bath set at 60 °C. When the KOH had dissolved, the temperature was raised to 150 °C, and maleic anhydride (1.47 g, 0.01 mol) was added to the flask. The temperature was maintained at 150 °C for 3 h. After that, ethyl acetate (10 mL) was added to dissolve the mixture, the solution was filtered under vacuum, and the filtrate was washed with 10% sodium hydroxide solution (2 × 10 mL) and water (2 × 10 mL). The organic fraction was dried over MgSO4 and then condensed with a rotary evaporator to give a crude product. The crude product was recrystallized from ethyl acetate to afford the product as a white solid (1.83 g, 68%), m.p. 162–163 °C (Spatz 21 m.p. 160–162 °C).
Analysis
The FTIR spectrum of the product (KBr pellets) was recorded on a Thermo Electron Nexus 670 spectrophotometer in the range of 400–4000 cm−1. The 1H NMR and 13C NMR spectra were obtained using a Bruker AV600 NMR spectrometer with tetramethylsilane (TMS) as an internal standard in chloroform (CDCl3). The UV-Vis absorption spectrum was recorded on a Thermo Nicolet Evolution 500 spectrometer in solid-state. The fluorescence spectrum was recorded with an Edinburgh fluorescence lifetime spectrometer 920 in solid-state; the range for recording the fluorescence emission was from 330 to 700 nm, and the excitation wavelength was set at 373 nm. All these spectra were obtained at room temperature.
Computational details
Gaussian 09 software was used for the theoretical study on the properties of diphenyl fumarate. 22 Calculations on molecular structures and vibrational frequency were carried out with the DFT method at the B3LYP/6-311G(d,p) level. All frequencies were checked to confirm that the optimized structures obtained were true minima of the potential energy hypersurface. The IR spectrum was simulated using the calculated values scaled by 0.9668 as in NIST Chemistry Webbook. 23 The calculated vibrational signals were assigned by employing the animate vibration function and the normalized displacement vectors visualized by the GaussView program. The potential energy distribution (PED) calculations were performed using the normal mode as displacements in redundant internal coordinates (option: freq = intmodes) in the Gaussian 09 software package. 24
1 H NMR and 13C NMR were simulated using the default gauge-independent atomic orbital (GIAO) method at the B3LYP/6-31G(d) level. 25 Chloroform solvation effects were simulated using the solvation model density (SMD) implicit solvation model. 26 The chemical shifts were empirically scaled to remove the systematic error, following the recommendation of Tantillo and co-workers. 18 The chemical shifts were calculated by the equation: δ = (intercept − σ)/(−slope). σ represents the calculated values. The scaling factors of “intercept” and “slope” are generated by utilizing the database and slightly modified shell scripts available on the website at http://cheshirenmr.info (accessed 12 September 2021). For B3LYP/6-31G(d)SMD-CHCl3 in G09, the slope is −1.0157 and the intercept is 32.2109 for 1H NMR; the slope is −0.9449 and the intercept is 188.4418 for 13C NMR.
The UV-Vis absorption and fluorescence emission spectra of the title compound were computed by the TD-DFT method at the PBE38/6-311G(d,p) level. 27 The UV-Vis absorption spectrum was determined on the ground state geometries. Frontier orbitals on the ground state were analyzed to show the distribution and transition of electrons. The emission from the excited to the ground state, corresponding to a fluorescence process, was computed with the same procedure but with the optimized excited-state structure. 28
Supplemental Material
sj-docx-1-chl-10.1177_17475198221085550 – Supplemental material for Synthesis, spectral analysis, and theoretical investigations of diphenyl fumarate
Supplemental material, sj-docx-1-chl-10.1177_17475198221085550 for Synthesis, spectral analysis, and theoretical investigations of diphenyl fumarate by Mingxue You, Weiqian Liao, Genlai Zhou and Yihui Bai in Journal of Chemical Research
Footnotes
Declaration of conflicting interests
The author(s) declared no potential conflicts of interest with respect to the research, authorship, and/or publication of this article.
Funding
The author(s) disclosed receipt of the following financial support for the research, authorship, and/or publication of this article: The authors are grateful for the financial support from the Zhejiang Provincial Natural Science Foundation of China (LY20B020006) and the Science and Technology Planning Project of Jinhua City, Zhejiang Province, China (2021-4-380).
Supplemental material
Supplemental material for this article is available online.
References
Supplementary Material
Please find the following supplemental material available below.
For Open Access articles published under a Creative Commons License, all supplemental material carries the same license as the article it is associated with.
For non-Open Access articles published, all supplemental material carries a non-exclusive license, and permission requests for re-use of supplemental material or any part of supplemental material shall be sent directly to the copyright owner as specified in the copyright notice associated with the article.