
Abstract
To remove graphene oxide contaminant from aqueous solution, laterite was used as an adsorbent to conduct batch adsorption experiments on graphene oxide aqueous solutions. The effects of pH, adsorbent mass, graphene oxide initial concentration, contact time, and temperature on graphene oxide adsorption by laterite were studied predominantly. The results show that graphene oxide adsorption by laterite strongly depends on pH, the kinetic data conforms to the second-order kinetic model, and the isotherm data are in line with Langmuir and Freundlich models. Moreover, temperature increment is more conducive to improving the adsorption capacity. Combined with scanning electron microscopy, transmission electron microscopy, atomic force microscopy, Fourier transform infrared spectroscopy, X-ray diffraction, X-ray photoelectron spectroscopy and Raman microscopic tests, the internal changes of samples before and after adsorption were further revealed. The comprehensive analysis of the above experimental results shows that laterite is a good material, which can effectively remove graphene oxide contamination from aqueous solutions.

Introduction
As a new nanomaterial, graphene oxide (GO) is a monolayer or multi-layer graphene derivative formed by the exfoliation of graphite oxide. Its lamellar structure contains a variety of oxygen-containing groups, 1 such as epoxy groups, hydroxyl groups, carboxyl groups, and so on, which makes GO more active. Because of its unique structure and excellent properties, GO has been widely used in many fields, and its output has been increasing year by year.2–4 However, it is inevitable that GO will flow into water during mass production and use, causing water pollution and entering the organisms through water circulation. Physical and chemical reactions and biological effects may occur in organisms, resulting in biological toxicity. 5 Therefore, the impact of GO on organisms has become one of the research hotspots for environmental science, and a large number of relevant experimental studies on the biological toxicity of GO have been conducted.6–8 Duch et al. 9 applied GO solutions to the lungs of mice. The results showed that GO could accelerate the production of reactive oxygen species in mitochondria, thereby activating the pathways of inflammation and cell apoptosis, causing severe and sustained damage to the lungs of mice. Hu et al. cultured the protozoan Euglena with different GO concentrations for 10 days, and found that increased malondialdehyde content and enhanced antioxidant enzyme activity in the culture medium could cause oxidative stress, thereby inhibiting the growth of Euglena. 10 Bianco cultured Caenorhabditis elegans with PEG-containing GO solution, and found that intracellular ROS were produced, which reduced the resistance of Caenorhabditis elegans and led to its death. 11 Chen studied the toxic effects of GO on zebrafish embryos, and found that a high GO concentration could cause a decrease in the hatching speed of zebrafish embryos, and had a certain inhibitory effect on cell growth. 12 In addition, GO could also produce a shielding effect on algae, reduce photosynthesis, and lead to growth inhibition and apoptosis of algal cells. 13
The above research results show that GO has certain toxic effects on organisms. Therefore, the removal of residual or leaked GO contamination from aqueous solution is a significant research topic. At present, the commonly used methods for water pollution control mainly include ion exchange, chemical precipitation, extraction, and adsorption.14–17 Among these, the adsorption method applies adsorbents to adsorb pollutants in the water body, and then the adsorbents are desorbed to achieve the effect of water purification 18 Compared with other methods, it has the advantages of low cost, convenient operation, and high removal rate. 19 Therefore, the adsorption method has a wide range of application prospects in water pollution control. However, in the process of adsorption, there are some other problems such as high cost of adsorbents or low adsorption capacity of traditional adsorbents, which has become an important target for water pollution control in seeking more cost-effective adsorbents. 20
The existing raw materials for removing GO have high production costs and complex processes.21,22 However, laterite is a natural soil, which does not need to be made and used. Moreover, laterite can be used for the direct removal of many anions such as phosphates, arsenic, fluoride, and so on. 23 However, to our knowledge, no one has studied the adsorption of GO by red soil. In this paper, laterite is mainly used as a new type of adsorbent material, and the effects of pH, adsorbent mass, GO initial concentration, contact time, and temperature on GO adsorption by laterite are analyzed in detail. The samples before and after adsorption were further characterized in combination with microscopic tests, so as to control water pollution and protect the ecological environment.
Analysis on the performance of GO adsorption by laterite
Effect of pH
Seven bottles of a GO aqueous solution with a GO initial concentration of 60 mg L−1 were prepared, a certain amount of laterite was added, and pH was adjusted at 3–9 in turn. In each, the initial laterite mass was 50 mg. The prepared mixed solutions were subjected to ultrasonic irradiation for half an hour, shaken for 1 h, and then stood for 18 h (T = 303 K). Through the ultraviolet–visible (UV–Vis) spectrophotometer measurements and zeta potential test, the results shown below were obtained. Figure 1 shows the effect of pH on GO adsorption by laterite from Qe (adsorption capacity), R (adsorption rate), and Kd (distribution coefficient). Figure 2 shows the effect of pH on the zeta potential of GO and laterite/GO aqueous solutions.

Effect of pH on graphene oxide (GO) adsorption by laterite (T = 303 K).

Effect of pH on zeta potential of graphene oxide (GO), laterite/GO aqueous solution (T = 303 K).
It can be seen from Figure 1 that with an increase of pH, the Qe, R, and Kd of GO adsorption by laterite decreases from 53.5 mg g−1, 89.1%, and 8.2 to 11.7 mg g−1, 21.1%, and 0.2, respectively, indicating that the stronger the acidity, the better the adsorption performance. The main reasons may come from the following two aspects: first, the more acidic the conditions are, the stronger the aggregation ability of GO itself, resulting in less GO suspended in the solution; 24 second, the more acidic the conditions are, the positive charge on the surface of laterite increases, and the electrostatic attraction with the negatively charged GO becomes stronger so that the GO content of the supernatant is reduced 25 It can be seen from Figure 2 that the zeta potential of GO aqueous solutions drops from −20.1 to −49.3 mv with an increase in pH, indicating that GO in aqueous solution is negatively charged, and the stronger the acidity, the more conductive to GO aggregation. Similar to GO aqueous solutions, the potential of laterite/GO aqueous solutions drops from −12.3 to −39.6 mv with the increase in pH. However, the overall potential of laterite/GO aqueous solutions is much higher than that of GO aqueous solutions, indicating that the incorporation of laterite has a great influence on the electric potential of GO aqueous solutions, leading to more unstable GO in the aqueous solution. 26 Through the above experimental results, the performance of GO adsorption by laterite is best when pH = 3. Therefore, pH = 3 was selected to study the effect of adsorbent mass on GO adsorption.
Effect of adsorbent mass
Five bottles of a GO aqueous solution with GO initial concentration of 60 mg L−1 were prepared, and laterite with different masses were added in sequence. The laterite mass was 30, 40, 50, 60, and 70 mg and the solutions adjusted to pH = 3. The prepared mixed solutions were subjected to ultrasonic irradiation for half an hour, shaken for 1 h, allowed to stand for 18 h (T = 303 K), and then studied with an UV–Vis spectrophotometer. Figure 3 shows the effect of laterite mass on GO adsorption.

Effect of laterite mass on graphene oxide (GO) adsorption (pH = 3, T = 303 K).
It can be seen from Figure 3 that with the increase of laterite mass, the adsorption capacity of GO by laterite drops from 80.3 to 39.9 mg g−1, and the adsorption rate rises from 80.3% to 92.3%. At a given GO initial concentration, as the laterite mass increases, the adsorption capacity gradually decreases, and the adsorption rate gradually increases. The main reason is that the increase of laterite mass can provide greater surface area and more adsorption sites. 27 In consideration of the economic efficiency of the adsorbent, a laterite mass of 50 mg with a pH = 3 was selected to study the effect of GO initial concentration on GO adsorption.
Effect of GO initial concentration
Five bottles of GO aqueous solutions with GO concentrations of 20, 40, 60, 80, and 100 mg L−1 were prepared and a certain laterite mass was added. The laterite mass was 50 mg and the solutions had a pH = 3. The prepared mixed solutions were irradiated using ultrasonic radiation for half an hour, shaken for 1 h, allowed to stand for 18 h (T = 303 K), and studied using a UV–Vis spectrophotometer. Figure 4 shows the effect of GO initial concentration on GO adsorption.

Effect of graphene oxide (GO) initial concentration on GO adsorption (laterite mass = 50 mg, pH = 3, T = 303 K)
It can be seen from Figure 4 that when pH = 3, as the GO initial concentration increases from 20 to 100 mg L−1, the adsorption capacity of GO by laterite increases from 18.3 to 81.9 mg g−1, whereas the adsorption rate and distribution coefficient decrease from 91.4% and 10.6 to 81.9% and 4.5, respectively, indicating that the increase of GO initial concentration can increase the adsorption capacity of GO by laterite. The main reason is that the greater the GO initial concentration, the more negative charge on the surface, the stronger the electrostatic attraction between GO and the surface of laterite, the greater the possibility of collision and contact with the active sites on laterite, thus the adsorption capacity will be greatly improved. However, at the same time, for a fixed adsorbent mass, increasing GO initial concentration will easily enhance the adsorption capacity, 28 resulting in a decrease in the adsorption rate and distribution coefficient of GO adsorption by laterite.
Adsorption kinetics, isotherms, and thermodynamic analysis
Adsorption kinetics
The adsorption process is the process of collision and contact between the adsorbent and the adsorbate, which is closely related to the contact time. According to the adsorption mechanism research mentioned above, the adsorption performance of GO by laterite is best when the pH = 3. In this paper, the adsorption kinetics were studied under the condition of pH = 3. Figure 5 shows the curve of GO adsorption by laterite over time.
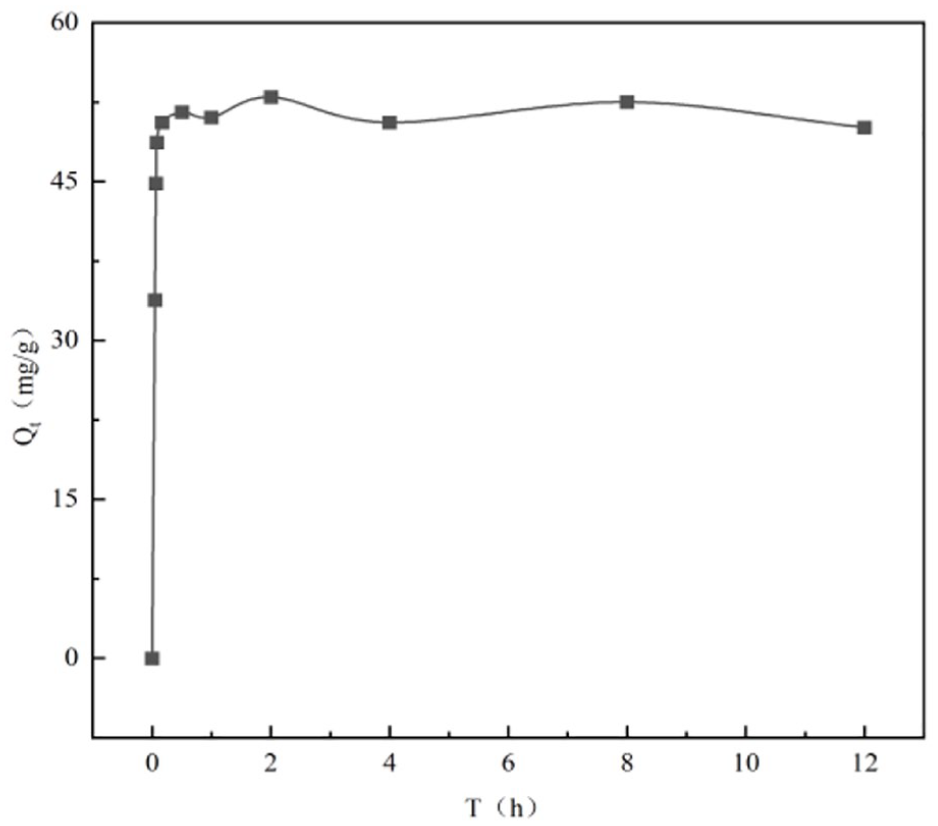
The change curve of graphene oxide (GO) adsorption by laterite over time (laterite mass = 50 mg, pH = 3, T = 303 K).
It can be seen from Figure 5 that the adsorption equilibrium time for GO adsorption by laterite is relatively short, about 1 h, and the equilibrium adsorption capacity is about 53.0 mg g−1. According to the curve relating contact time t and adsorption capacity Qt, equations (4) and (5) can be used to obtain the first-order and second-order kinetic model of GO adsorption by laterite as shown in Figures 6 and 7, respectively.

First-order kinetic model of graphene oxide (GO) adsorption by laterite (laterite mass = 50 mg, pH = 3, T = 303 K).

Second-order kinetic model of graphene oxide (GO) adsorption by laterite (laterite mass = 50 mg, pH = 3, T = 303 K).
Through the above first-order and second-order kinetic models of GO adsorption by laterite, the corresponding parameters can be obtained as shown in Table 1.
Parameters of the first-order and second-order kinetic model of graphene oxide (GO) adsorption by laterite.
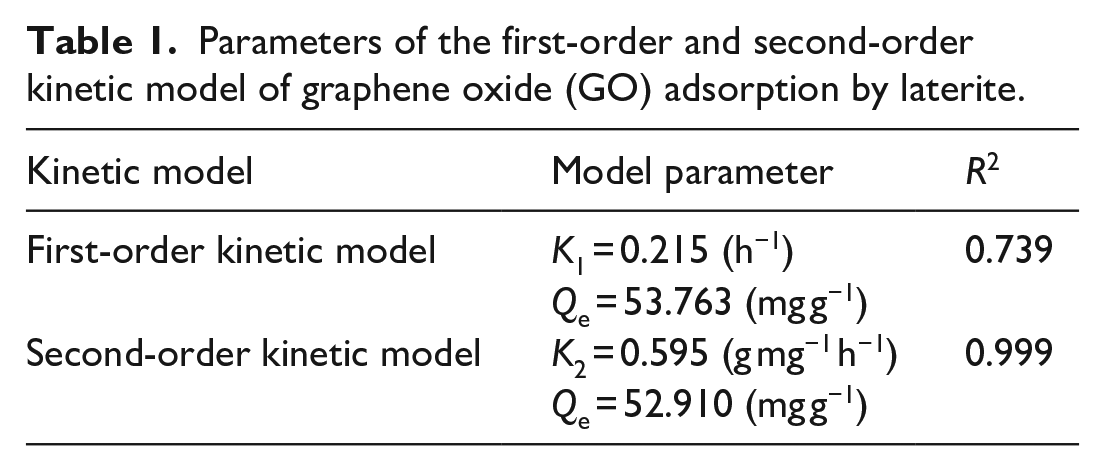
It can be seen from Table 1 that the accuracy R2 of the first-order kinetic model of GO adsorption by laterite is 0.739, and that of the second-order kinetic model is 0.999. The accuracy of the second-order kinetic model is greater than that of the first-order kinetic model, and the theoretical equilibrium adsorption capacity obtained by the second-order kinetic model fitting is closer to the actual equilibrium adsorption capacity, indicating that the second-order kinetic model can more truly reflect the kinetic law of GO adsorption by laterite, and the entire adsorption process is mainly controlled by physical and chemical adsorption. 29
Adsorption isotherm
The adsorption mechanism of GO by laterite was further analyzed. In this paper, the isotherm model with different GO initial concentrations of 20, 40, 60, 80, and 100 mg L−1 and at different temperatures of 303, 313, and 323 K was studied. Figure 8 shows the effect of GO initial concentration on GO adsorption by laterite at different temperatures.
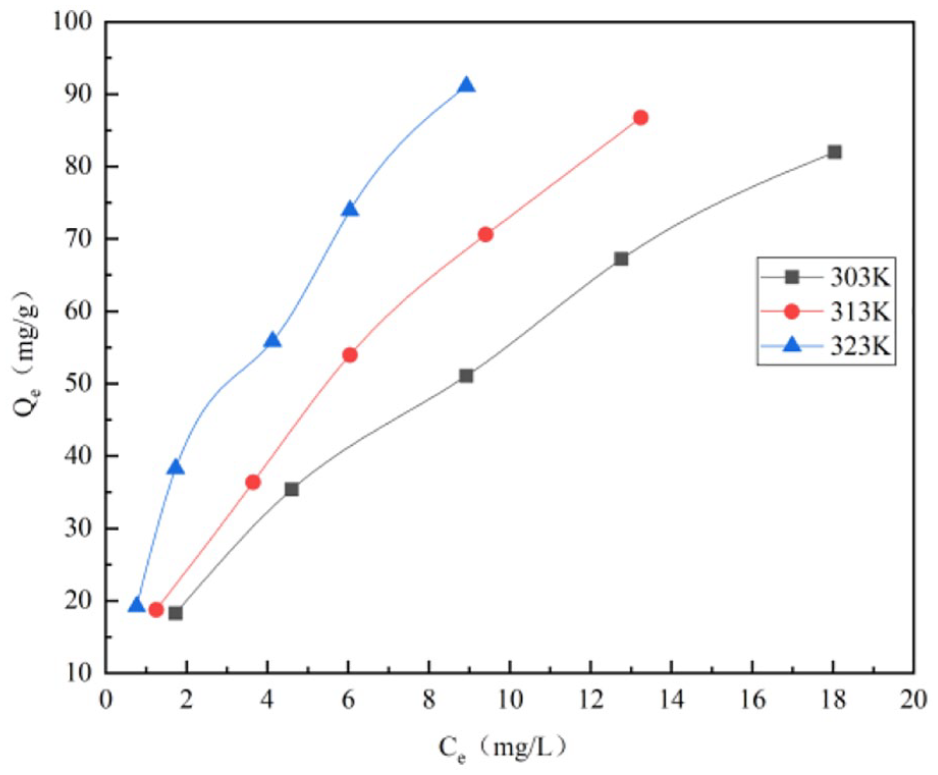
Effect of graphene oxide (GO) initial concentration on GO adsorption at different temperatures (laterite mass = 50 mg, GO initial concentration = 20, 40, 60, 80, and 100 mg L−1, pH = 3, T = 303, 313, and 323 K).
It can be seen from Figure 8 that at different temperatures, as the GO initial concentration increases from 20 to 100 mg L−1, the adsorption capacity of GO by laterite increases with the increase in the equilibrium residual concentration of GO. When the temperature is controlled at 303, 313, and 323 K, the minimum adsorption capacity reaches 18.2, 18.8, and 19.2 mg g−1, and the maximum adsorption capacity reaches 82.9, 87.1, and 92.0 mg g−1, respectively, indicating that the temperature increment is conducive to GO adsorption by laterite. Using the mathematical equations (6) and (7) of adsorption isotherms, the Langmuir and Freundlich isotherm models of GO adsorption by laterite are obtained as shown in Figures 9 and 10, respectively.
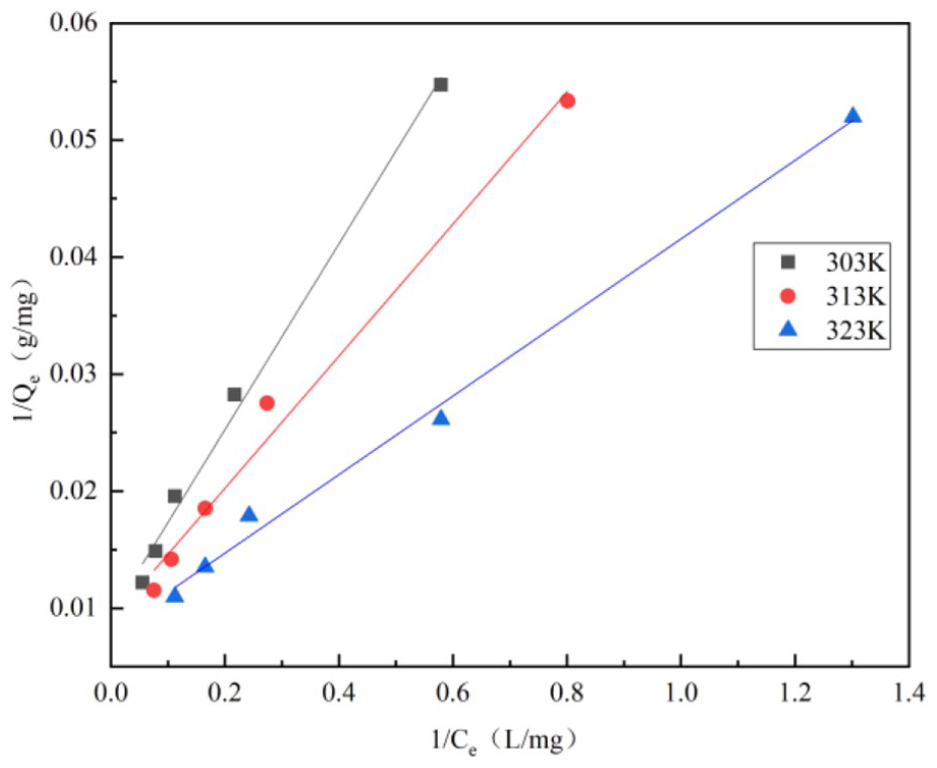
Langmuir isotherm model of graphene oxide (GO) adsorption by laterite (laterite mass = 50 mg, GO initial concentration= 20, 40, 60, 80, and 100 mg L−1, pH = 3, T = 303, 313, and 323 K).

Freundlich isotherm model of graphene oxide (GO) adsorption by laterite (laterite mass = 50 mg, GO initial concentration= 20, 40, 60, 80, and 100 mg L−1, pH = 3, T = 303, 313, and 323 K).
Through the above Langmuir and Freundlich isotherm model fittings, the corresponding parameters can be obtained, respectively, as shown in Table 2.
Parameters of Langmuir and Freundlich isotherm model of graphene oxide (GO) adsorption by laterite.

It can be seen from Table 2 that the fitting accuracy R2 of the Langmuir and Freundlich isotherm models of GO adsorption by laterite are relatively high, indicating that the adsorption process is in line with the Langmuir and Freundlich isotherm models. According to the Langmuir isotherm model, when the temperature is controlled at 303, 313, and 323, the saturated adsorption capacity Qm is 106.4, 111.1, and 125.0 mg g−1, respectively, indicating that the temperature increase is conductive to GO adsorption by laterite. In the Freundlich isotherm model, the concentration index
Adsorption thermodynamics
At different temperatures and with different GO initial concentrations, the thermodynamics of GO adsorption by laterite can be further analyzed by studying the isotherm of GO adsorption by laterite. Using the mathematical equation (8) of adsorption thermodynamics, the linear relationship between lnKd and 1/T of GO adsorption by laterite can be obtained as shown in Figure 11.

Linear relationship between lnKd and 1/T of graphene oxide (GO) adsorption by laterite (laterite mass = 50 mg, GO initial concentration = 20, 40, 60, 80, and 100 mg L−1, pH = 3, T = 303, 313, and 323 K).
It can be seen from Figure 11 that in the adsorption process, the higher the temperature and the greater the GO initial concentration, the greater the value of lnKd, and the better the adsorption effect of GO by laterite. Using the mathematical formula of adsorption thermodynamics as shown by equation (9), the adsorption thermodynamic parameters of
Thermodynamic parameters of graphene oxide (GO) adsorption by laterite.

It can be seen from Table 3 that the adsorption enthalpy
Micro characterization
Scanning electron microscopy and transmission electron microscopy characterization
Figure 12 shows the scanning electron microscopy (SEM) morphology and transmission electron microscopy (TEM) transmission images of GO and laterite/GO samples. From the SEM of GO (Figure 12(a)) and laterite/GO (Figure 12(b)) samples, it can be seen that GO has a lamellar folded structure similar to paper but with a thick surface, which is because the original sp2 hybridized structure of carbon atoms on the surface of graphene is transformed into a sp3 hybridized state due to oxidation, leading to the collapse of the original planar state and the transformation to a folded shape. 31 However, when GO is adsorbed by laterite, the surface of laterite/GO samples obviously show a fold-like flake shape, indicating that GO is adsorbed by laterite. From the TEM of GO (Figure 12(c)) and laterite/GO (Figure 12(d)) samples, it can be seen that the lamellar structure of the GO samples is thicker and presents a typical two-dimensional lamellar structure, while the surface of the laterite/GO samples after adsorption transmit a lamellar structure similar to GO and are folded, which further illustrates that GO has a certain degree of adsorption by laterite.

(a, b) Scanning electron microscopy (SEM) and (c, d) Transmission electron microscopy (TEM) of graphene oxide (GO) and laterite/GO samples, respectively.
Atomic force microscopy characterization
Figure 13 shows the three-dimensional height topography and histogram of GO and laterite/GO samples. From the three-dimensional height topography of GO (Figure 13(a)) and laterite/GO (Figure 13(c)) samples, it can be seen that the maximum height difference of GO and the laterite/GO samples are 59.5 and 147.1 nm, respectively, indicating that the surface thickness of the laterite/GO samples is much larger than that of the GO samples. From the histograms of GO (Figure 13(b)) and the laterite/GO (Figure 13(d)) samples, it can be seen that compared with the histogram of the GO samples, the peaks of the laterite/GO samples are sharper and more concentrated at one point, and the surface is smoother, indicating that GO has a certain degree of adsorption by laterite.

(a, c) Three-dimensional height topography and (b, d) histogram of graphene oxide (GO) and laterite/GO samples, respectively.
X-ray diffraction characterization
The X-ray diffraction (XRD) patterns are overwhelmingly used for the estimation of the structures of nano materials.
32
Figure 14 shows the XRD of laterite, GO, and the laterite/GO samples. It can be seen from the figure that GO samples have a strong broad diffraction peak at

Three-dimensional height topography and histogram of graphene oxide (GO) and laterite/GO samples. a.u.: arbitrary unit.
Fourier transform infrared spectroscopy characterization
Figure 15 shows the Fourier transform infrared spectroscopy (FTIR) spectra of laterite, GO and laterite/GO samples. It can be seen from the figure that GO has a strong adsorption broad peak at the wavelength of 3413 cm−1, which is mainly due to the stretching and bending vibrations caused by the OH groups of the water molecules attached to the surface of GO. 35 Those at wavelengths 1618 and 614 cm−1 are mainly the C=O and C=C stretching vibration peaks. 36 The peaks at the wavelengths 1401 and 1118 cm−1 may be caused by the stretching vibrations of RCOOH and C–OH. 37 Comparing the FTIR spectra of laterite, GO, and the laterite/GO samples, the functional groups show little change, and those of the laterite/GO samples after adsorption are similar to those of the laterite samples. On the contrary, the peak intensity of laterite/GO is significantly lower than that of laterite and GO, which may be why laterite and GO are superimposed on each other, indicating that the surface of GO is more extensively covered by laterite.

FTIR spectra of laterite, graphene oxide (GO), and laterite/GO samples.
X-ray photoelectron spectroscopy characterization
Figure 16 shows the X-ray photoelectron spectroscopy (XPS) spectra (Figure 16(a)) and C1s peak (Figure 16(b)) of GO and laterite/GO samples. It can be seen from Figure 16(a) that compared with the energy spectrum of GO samples, laterite/GO samples have more Fe, Si, and Al, which is mainly because laterite contains more Fe, Si, and Al. It can be seen from Figure 16(b) that GO has three peaks during the C1s peak fitting process, and their binding energies are 284.8, 286.8, and 287.5 ev, respectively, corresponding to the C–C, C–O–C and O–C=O groups.38–40 When laterite adsorbs GO, the O–C=O binding energy of the laterite/GO samples increases by 1.1 ev compared to that of the GO samples, that is 288.6 ev. At the same time, the C–C peak area is greatly increased. Therefore, in the adsorption process, the interaction of the laterite/GO samples is mainly realized through O–C=O and C–C bonds. 41

(a) XPS spectra and (b) C1s peak of graphene oxide (GO) and laterite/GO samples. a.u.: arbitrary unit.
Raman characterization
Figure 17 shows the Raman scattering patterns of GO and the laterite/GO samples. It can be seen from the figure that GO has obvious characteristic peaks at Raman displacements of 1359 and 1595 cm−1, which are consistent with D and G bands reported in the literature.42,43 The appearance of a D band peak is related to the structure, amorphous carbon, and edge of GO, and the peak position detected by the G band corresponds to the first-order scattering of the E2g mode of the sp2 carbon domain. 44 The Raman scattering pattern of the laterite/GO samples also shows a characteristic peak similar to that of the GO samples, indicating that GO is adsorbed by laterite.

Raman scattering patterns of graphene oxide (GO) and laterite/GO samples. a.u.: arbitrary unit.
Conclusion
In this paper, the adsorption performance of GO by laterite was systematically studied through batch experiments. Various characterization methods (SEM, TEM, AFM, FTIR, XRD, XPS, Raman) were used to further characterize the samples before and after adsorption by adsorption kinetics, isotherms, and thermodynamics research methods. The following meaningful conclusions were obtained:
Under the optimal conditions (pH = 3, laterite mass = 50 mg, T = 303 K, GO initial concentration = 60 mg L−1), the adsorption reaches equilibrium, the removal rate, adsorption amount, distribution coefficient of GO adsorption by laterite reach 88.3%, 53.0 mg g−1, and 7.6, respectively.
In the kinetic model, GO adsorption by laterite reaches equilibrium in about 1 h, and the adsorption model is more in line with the second-order kinetic model. In the isotherm model, GO adsorption by laterite conforms to the Langmuir and Freundlich models, and temperature increases are beneficial to GO adsorption. In the thermodynamic model, it is shown that GO adsorption by laterite is an endothermic spontaneous process.
The internal changes of samples before and after GO adsorption by laterite are explained through the microscopic test results, which further prove that the GO is adsorbed well by laterite.
In conclusion, laterite has a good adsorption effect in removing GO contamination from aqueous solutions, which plays a vital role in reducing the biological toxicity of GO in the natural environment. At the same time, in the foreseeable future, with the wide application prospects of GO, thanks to the natural and widespread existence of laterite in nature, the characteristics of no secondary processing and no secondary pollution to the environment greatly increase the efficiency of the adsorption operation, and the potential of laterite to adsorb GO is inestimable.
Experimental materials and methods
Materials
This experiment is divided into two parts: one is the adsorption test and the other is the microscopic characterization of samples before and after adsorption. During the adsorption test, laterite was selected as the adsorbent material, which was collected from Yunnan Province and dried in an oven for 24 h, and then passed through a 2 mm sieve. GO aqueous solution was selected as the adsorbate produced by Suzhou Tanfeng Graphene Technology Co., Ltd., with a concentration of 2 mg mL−1. First, 1.5 mL of GO aqueous solution was transferred into the reagent bottle using a pipette, 18 MΩ cm deionized water was then added to make it reach 50 mL, and then 0.1 mol L−1 NaOH/HCl was used to adjust the pH of GO aqueous solution in the reagent bottle. Then, a certain mass of laterite was added. The mixed solution was ultrasonic for half an hour, and shaken for 1 h, and the reagent bottle was placed in a thermostat for 18 h. Finally, 1.0 mL of the supernatant in the reagent bottle after standing was absorbed with a pipette, diluted to 25 mL deionized water, and fully shaken. The absorbance of samples was measured with an UV–Vis spectrophotometer at a wavelength of 221 nm. According to this process, the effect of pH, adsorbent mass, GO initial concentration, contact time, and temperature on GO adsorption by laterite were studied, respectively.
Microscopic characterization was mainly performed by SEM (Empyrean), TEM (JEM-2100F), atomic force microscope (AFM, SPA400), XRD (Empyrean), FTIR (NEXUS), XPS (Thermo ESCALAB 250XI), and Raman spectroscopy (Raman, Lab RAM HR800). Among them, SEM, TEM, and AFM are mainly used to study the appearance and morphology of the sample, XRD is used to analyze the crystal structure of the sample, FTIR is used for the identification of the sample functional groups, XPS is used to detect the electronic structure and element composition of the sample, and Raman spectroscopy is used to analyze the molecular structure of the sample.
Test methods
Removal rate, adsorption capacity, and distribution coefficient were used to evaluate the adsorption performance of GO by laterite in this study. Through the analysis of adsorption kinetics, isotherms, and thermodynamics, the adsorption characteristics of GO by laterite can be more specifically understood. The basic mathematical formulae are shown by equations (1)–(3): 45


where
Adsorption kinetics can reflect the relationship between adsorption time and adsorption amount of the adsorbent in the adsorption process, which is also one of the important indexes to evaluate the excellent adsorbent. 46 At present, the commonly used adsorption kinetic models include first-order and second-order kinetic models, and their mathematical formulae are shown by equations (4) and (5):47,48

where
Adsorption isotherm is often used to describe the interaction between adsorbent and adsorbate, and predict the maximum adsorption capacity. At present, the commonly used adsorption isotherm models include Langmuir and Freundlich models, and their mathematical formulae are shown by equations (6) and (7):49,50


where
Adsorption thermodynamics is used to characterize whether adsorption is spontaneous and whether it is an endothermic or exothermic process. It usually needs to be calculated at three different environment temperatures at least, and their mathematical formulae are shown by equations (8) and (9):51,52


where ∆H°, ∆S°, and ∆G° are enthalpy change, entropy change, and Gibbs free energy, respectively; T is Kelvin’s absolute scale of temperature, R is perfect gas constant, which is usually set at 8.314 J mol−1 K−1.
Footnotes
Data availability
The data used to support the findings of this study are available from the corresponding author upon request.
Declaration of conflicting interests
The author(s) declared no potential conflicts of interest with respect to the research, authorship, and/or publication of this paper.
Funding
The author(s) disclosed receipt of the following financial support for the research, authorship, and/or publication of this paper: This research was funded by the National Natural Science Foundation of China (41772311) and the National Natural Science Foundation of China (52179107).