
Abstract
Improving the anti-carbon deposition and anti-sintering ability under the premise of maintaining high catalytic activity is the core issue of Ni-based catalysts applied in CO methanation reactions. To address this issue, a La0.75A0.25NiO3/SiO2 (A = Ce, Sr, Sm, and Ca) catalyst is prepared via a citric acid complexation method. XRD results show that the substituted elements (Sr, Sm, and Ca) enter the LaNiO3 lattice and partially replace the A-site element La. The reduced Ni0 is beneficial to improve the medium temperature activity of the catalyst. The substitution of different elements produces different electronic effects that significantly affect the size of the Ni particles and the interaction between Ni and La2O3. The catalyst with doped Ca2+ as the A-site substituted element demonstrates better adsorption, storage, and migration capabilities for oxygen due to the lattice distortion that easily produces oxygen vacancies. Catalysts doped with Sr, Sm, and Ca as the A-site substituted element produce La2O2CO3 after the reactions, which plays a role in eliminating carbon deposits.

Introduction
The coal-to-natural conversion gas is an important method for the clean utilization of coal, with a key step being syngas methanation. The most practical methanation catalyst is Ni as the active component and Al2O3, SiO2, or ZrO2 as the support.1–7 The coal-based CO methanation reaction is a strong exothermic process. Ni-based catalysts are prone to carbon deposition and sintering under high-temperature conditions, causing catalyst deactivation and hindering their industrial application process.8,9 Therefore, starting from the catalyst structure, researchers have made significant progress in improving the anti-sintering and anti-carbon performance of Ni-based catalysts by reducing the size of Ni0 after reduction, increasing the dispersion of Ni0 in the support, and increasing the oxygen vacancies in the material.10–14
The perovskite composite oxide (ABO3) decomposes after reduction, forming elemental metal (B) and the oxide substrate (oxide of A).15–19 For example, LaNiO3 decomposes into Ni metal particles and La2O3 after reduction. Compared with the traditional Ni-based catalyst, a catalyst with LaNiO3 as the precursor can give a smaller Ni metal particle size and high dispersibility after reduction. The above-mentioned specific reducibility of perovskite makes it widely used in the catalytic fields of carbon hydroxide, CO, NO catalytic oxidation, and photocatalytic hydrogen production.20–23 It is reported during the literature that an Ni-based catalyst with LaNiO3 as the precursor shows good stability during the partial oxidation of methane, CO2 reforming of CH4, steam reforming of CH4, steam reforming of ethanol, and the methanation of CO2.16,24–29
However, perovskite has the inherent defect of a small specific surface area. Taking LaNiO3 as an example, the small specific surface area inevitably causes the reduced Ni to be densely distributed on the La2O3 substrate. However, the reduction temperature of the LaNiO3 increases. For the above two reasons, the catalytic activity of the LaNiO3 catalyst is lower than that of the supported Ni-based catalyst.
The redox characteristics of ABO3 mainly depend on the characteristics of the elements at the A and B sites. A-site elements can be replaced by elements of the same or of different valences to form AxA1-xBO3+ perovskite, usually including La, Sr, K, Rb, Pb, Ba, Ca, and so on.8,30–33 This substitution causes defects in the crystal lattice, increases the mobility of oxygen, and changes the oxidation state of the B-site ion and the acidity and alkalinity of the catalyst surface.
Based on the above, our work reported herein adopts the citric acid complex method and the equal volume impregnation method to combine the precursors in the perovskite-type composite oxide (PTO), and make the PTO-type LaNiO3 crystal grains highly dispersed on the SiO2 support to prepare the supported LaNiO3/SiO2 catalyst. Different elements (Ce, Ca, Sr, and Sm) are used for A-site substitution to realize the doping of auxiliary ions in LaNiO3, such that the two auxiliary ions and the active component ions are highly dispersed and restricted to the precursor crystal grains. The reduced A, A’, and B are in close contact and are highly dispersed on the SiO2 support. The design of ABO3-type catalysts substituted at the A-sites is used to study the influence of the substitution of different elements on the structure of the catalyst, the reduced state of the active components and the catalytic performance, in order to solve or significantly improve the low activity of the perovskite-type CO methanation catalyst.
Results and discussion
Crystalline structures
The XRD patterns of the La0.75A0.25NiO3/SiO2 (A = Sr, Ce, Sm, and Ca) catalyst prepared by ion doping with different additives are shown in Figure 1.
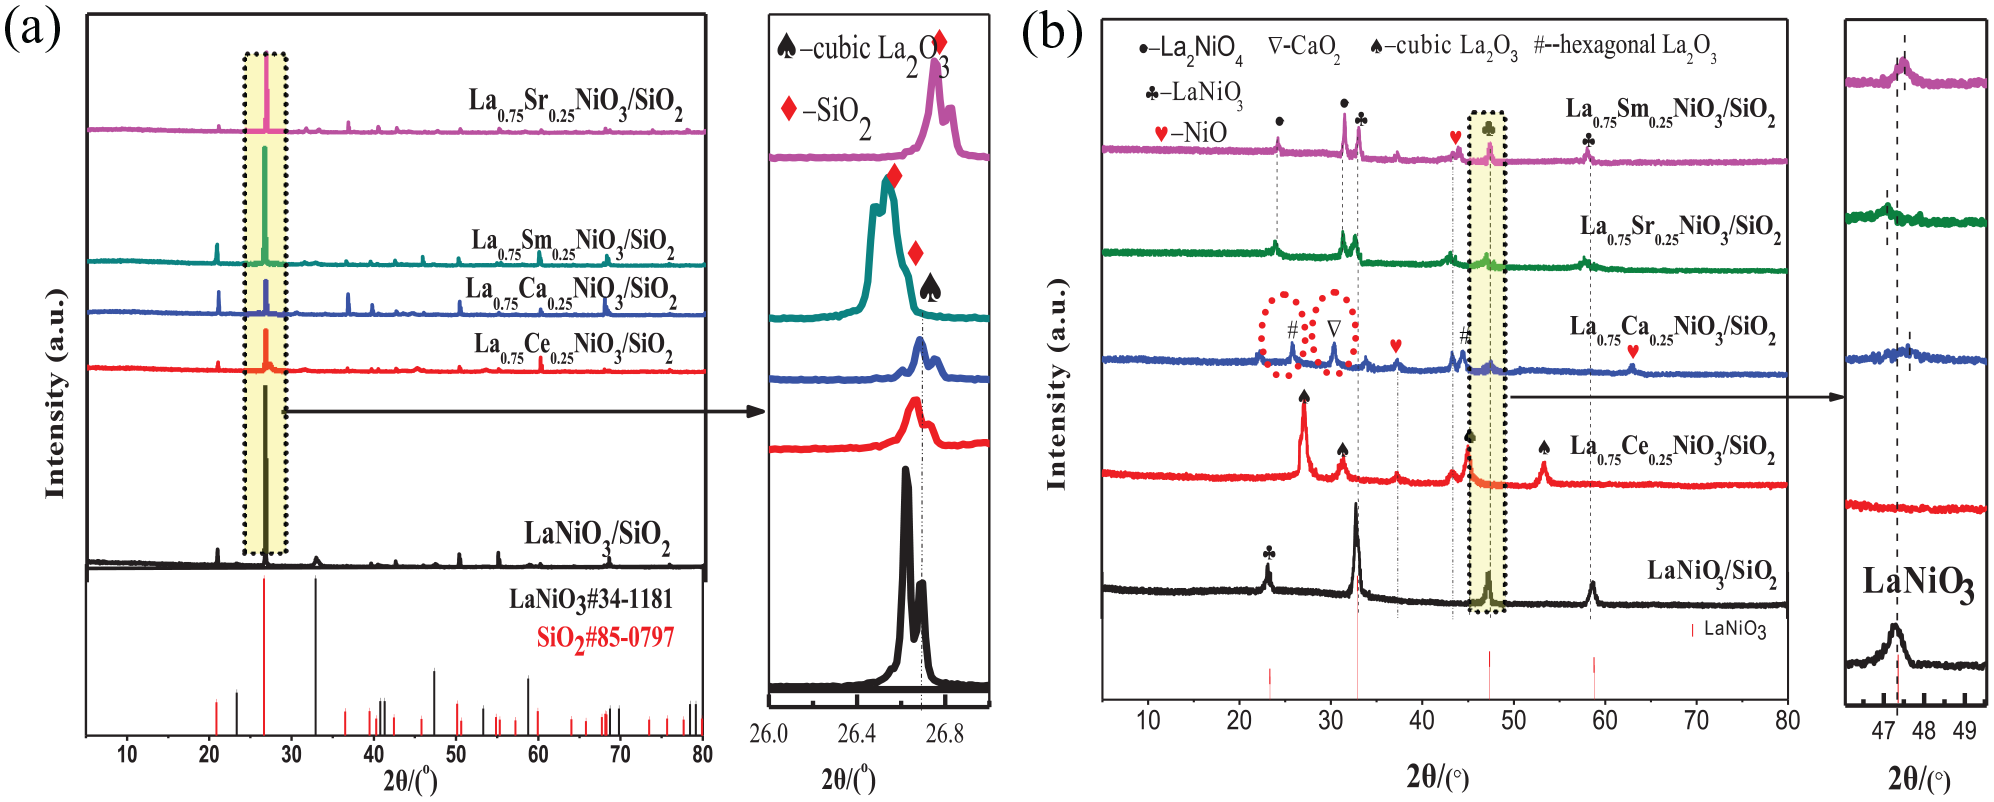
XRD patterns of fresh La0.75A0.25NiO3/SiO2 (A = Sr, Ce, Sm, and Ca) and LaNiO3/SiO2 catalysts. (a) XRD patterns of all the phases and (b) XRD spectrum after SiO2 is removed.
As shown in Figure 1(a), the peaks at 2θ = 23.32°, 32.91°, 47.35° and 69.82° (PDF No. 85-0797) are characteristic diffraction peaks of LaNiO3. The peaks at 2θ = 20.85°, 26.55°, 36.59°, 40.29°, 42.46°, 50.18° and 60.07° (PDF No. 85-0797) are attributed to the characteristic diffraction peaks of SiO2, indicating its higher crystallinity. Due to the high diffraction peak of SiO2, the diffraction peaks of the other phases are not obvious. In order to further study the structures of the other phases, the characteristic peaks of SiO2 are removed for analysis and the result is shown in Figure 1(b).
It can be seen from Figure 1(b) that, except for the Ce-doped catalyst, the peaks at 2θ = 32.77°, 47.35°, and 58.7° are the characteristic peaks of the typical rhombohedral perovskite structure (PDF no. 34-1077), 34 indicating that this method can be used to prepare a relatively pure perovskite structure LaNiO3. The doped Sm, Sr, and Ca catalysts have a shift in the position of the characteristic peak of LaNiO3 at 47.35°, which is closely related to the doping of Sm, Sr, and Ca.35,36
The La0.75Ce0.25NiO3/SiO2 catalyst prepared by Ce doping shows diffraction peaks due to NiO (PDF no. 75-0179) at 2θ = 37.3° and 43.3°, and the diffraction peak of cubic phase La2O3 (PDF no. 04-0856) at 2θ = 27.2°, 31.4°, 45.2°, and 53.5°. However, the diffraction peak of LaNiO3 did not appear, nor was the related diffraction peak of Ce observed. This is consistent with the literature report that a high content of Ce was not easy to incorporate into the perovskite structure. 37 Ce easily enters the La2O3 crystal lattice to form a La–Ce–O solid solution, which causes the crystal lattice to shrink and become a cubic phase La2O3. 38
The La0.75Ca0.25NiO3/SiO2 catalyst prepared by calcium doping showed diffraction peaks due to LaNiO3 (PDF no. 10-0341) at 2θ = 23.3° and 47.2°, and hexagonal diffraction peaks of La2O3 (PDF no. 40-1281) at 2θ = 25.8° and 44.6°. The characteristic peak at 2θ = 30.2° is attributed to CaO2 (PDF no. 03-0865), and a diffraction peak due to NiO appears, indicating that Ca did not completely enter the perovskite structure, and separated phase oxides are produced. The A-site substitution will affect the formation of the ABO3 structure of the perovskite. The influencing factors include (1) A-site ion radius and (2) substitution of A-site ions with different valences, resulting in changes in the valence of B and the size of potential ions. 30 The ion radius of Ca2+ (rCa2+ = 99 pm) is smaller than that of La3+ (rLa3+ = 106 pm), which after doping will cause the average radius of A-site ions to decrease, and cause the allowable factor of the lattice structure to decrease, resulting in lattice distortion. However, the different valence states of Ca2+ and La3+ will also cause distortion, and the aggravated degree of distortion will produce impurity phases.
The catalyst prepared by doping Sr and Sm showed the characteristic peaks of LaNiO3 (PDF no. 79-2448) (PDF no. 33-0711) at 2θ = 33.24°, 58.16°, 32.9°, and 57.89°, respectively. Compared with the LaNiO3/SiO2 catalyst, the 2θ value is slightly shifted. The peak shift phenomenon after doping can directly prove that Sr2+ and Sm3+ replaced La3+ cations and entered the LaNiO3 lattice,39,40 resulting in a change of the lattice parameters (Table 1). At the same time, the characteristic peak of La2NiO4 appeared at 2θ = 24.0° and 31.68°.
PTO lattice parameters of catalysts prepared by doping different elements.

PTO: perovskite-type composite oxide.
Table 1 shows the PTO lattice parameters of the catalyst prepared by doping with different elements. Combined with the XRD results, it can be seen that Ca, Sr, and Sm doping can partially replace La3+ and form a perovskite structure, resulting in changes in the crystal parameters of the La0.75A0.25NiO3/SiO2 catalyst, which is helpful in distributing the NiO active species. The 0.25% Ce failed to enter the perovskite lattice. However, due to the different radius of the doped ions, the positions of the diffraction peaks are different, which is also reflected in the differences in the lattice parameters of each sample.
The XRD spectra of the La0.75A0.25NiO3/SiO2 (A = Sr, Sm, and Ca) and LaNiO3/SiO2 catalysts after reduction are shown in Figure 2.
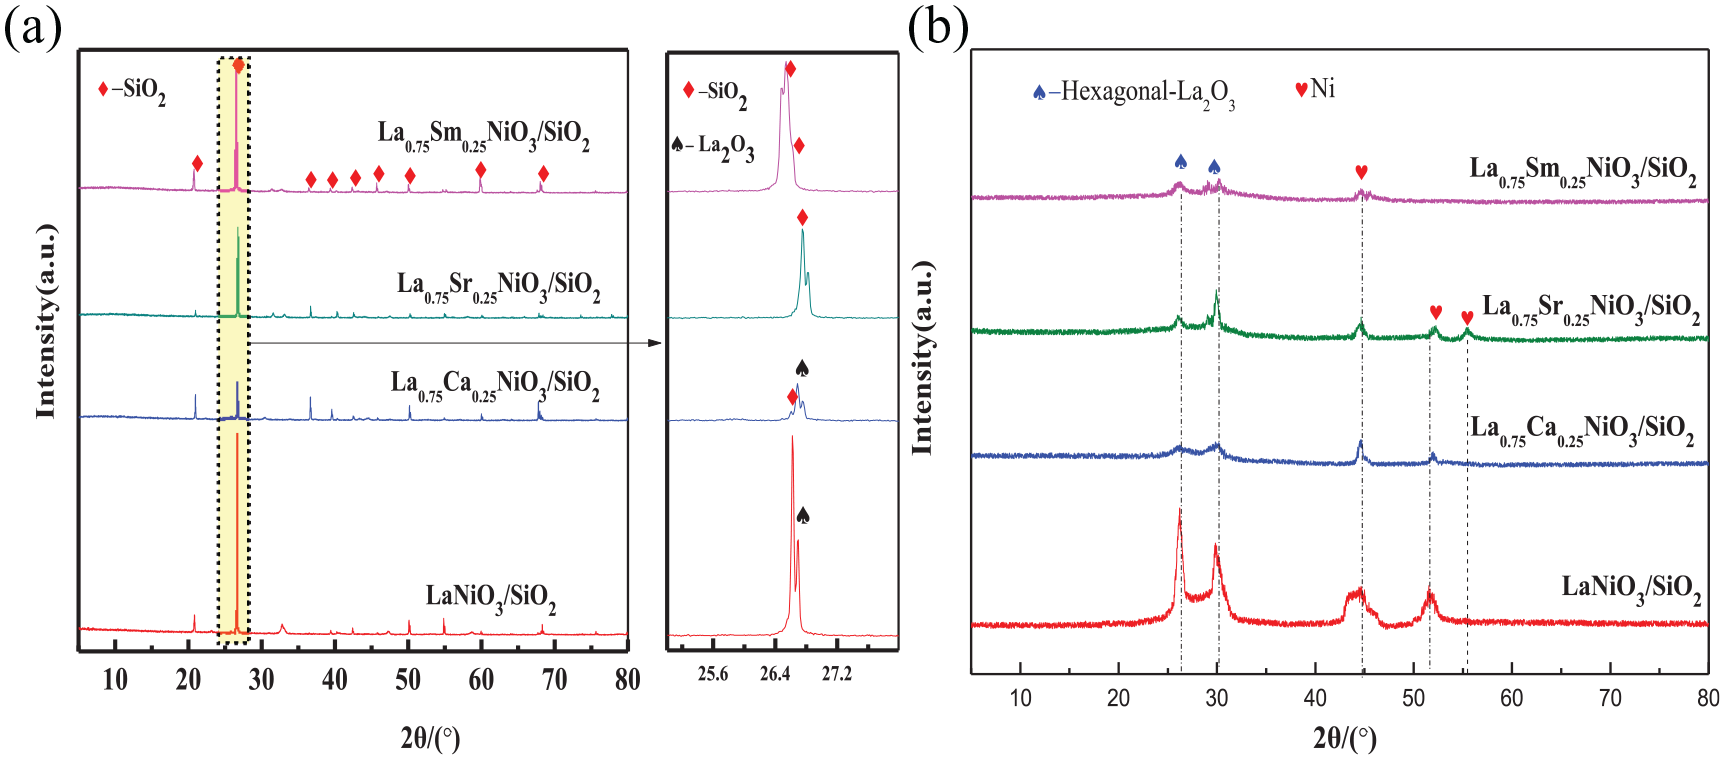
XRD patterns of the La0.75A0.25NiO3/SiO2 (A = Sr, Sm, and Ca) and LaNiO3/SiO2 catalysts after reduction at 650 °C for 1 h with H2. (a) XRD pattern of all phases and (b) XRD spectrum after SiO2 is removed.
As shown in Figure 2(a), all the catalysts showed sharp SiO2 diffraction peaks after reduction, indicating that the SiO2 support remained stable during the reduction process. The XRD spectrum after excluding the SiO2 diffraction peak is shown in Figure 2(b). As can be seen, the La0.75A0.25NiO3/SiO2 (A = Sr, Sm, and Ca) and LaNiO3/SiO2 catalysts showed the characteristic peaks due to the hexagonal phase La2O3 (PDF no. 74-1144) and Ni0 after reduction, but none of the perovskite phase was detected. This indicates that the perovskite structure of the La0.75A0.25NiO3/SiO2 (A = Sr, Sm, and Ca) and LaNiO3/SiO2 catalysts are destroyed during the reduction process, and that La2O3 and Ni are formed. At the same time, there are no related diffraction peaks due to doped elements.
The intensity and sharpness of the diffraction peaks of Ni0 after reduction of the La0.75A0.25NiO3/SiO2 catalyst substituted by different elements are obviously different. The characteristic peaks of the Ni(111) crystal plane are calculated from the Scherrer formula to obtain the average particle size of the Ni particles (Table 2). After reduction of the La0.75Sm0.25NiO3/SiO2 catalyst, the diffraction peak of the Ni particles is too weak to be able to calculate the grain size. As shown in Table 2, compared with reduced LaNiO3/SiO2, the size of the Ni particles of the reduced La0.75Sr0.25NiO3/SiO2 catalyst is significantly reduced, indicating that the substitution of Sr for the A-site element La is helpful for the dispersion of Ni0 on the surface of the support. The Ni0 particle size of the La0.75Ca0.25NiO3/SiO2 catalyst prepared by doping with Ca increases after reduction. This is due to the incomplete doping of Ca, combined with XRD, there is reduction of NiO. It is reported in the literature that the size of the reduced Ni0 particles from NiO is larger than that of reduced Ni0 particles from LaNiO3. 30
Average Ni particle size of catalyst after reduction with different doping elements.

Catalytic performances
The catalytic activity tests on the La0.75A0.25NiO3/SiO2 (A = Sr, Sm, and Ca), LaNiO3/SiO2, LaNiO3, and commercial MCR-2X catalysts are shown in Figure 3. The activities of all the catalysts showed a similar trend with increasing temperature. The CO conversion rate, CH4 selectivity, and CH4 yield increased first and then decreased with an increase in the temperature. The catalytic performance of the doped catalysts also improved. Compared with the commercial catalyst MCR-2X and LaNiO3, the doped catalysts all show better selectivity and yield of CH4 at medium and high temperatures. The La0.75Sr0.25NiO3/SiO2 and La0.75Ca0.25NiO3/SiO2 catalysts prepared by Sr and Ca doping at the A-site have a significantly higher CO conversion rate than the undoped catalyst LaNiO3/SiO2. When the temperature reached 550 °C, the CO conversion rate was above 90%, but when the temperature was higher than 550 °C, the CO conversion rate was lower than LaNiO3/SiO2. Compared with LaNiO3/SiO2, the La0.75Sm0.25NiO3/SiO2 catalyst improved the CO conversion rate only in the middle temperature region.
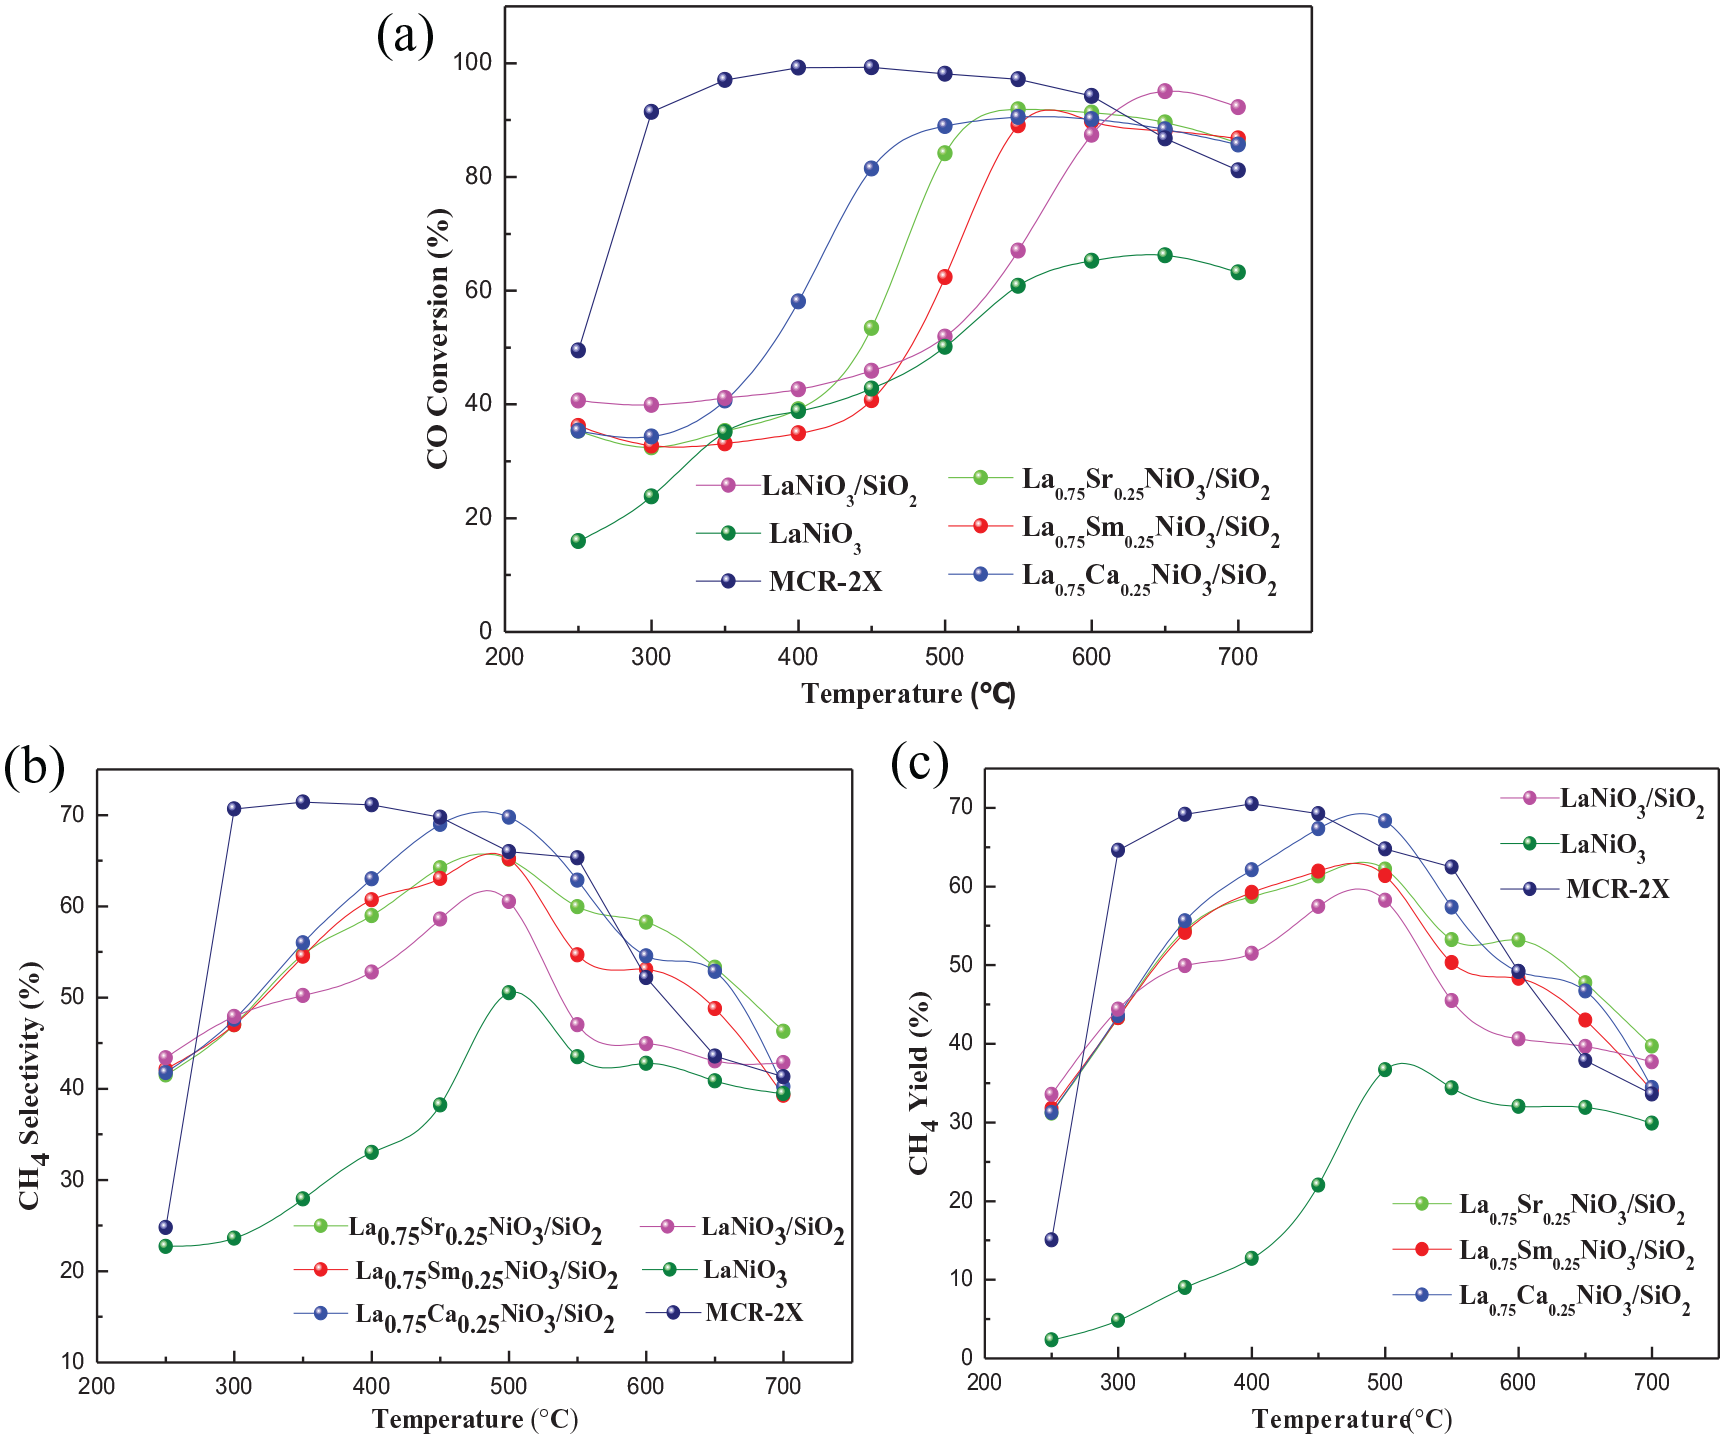
Catalytic performance of La0.75A0.25NiO3/SiO2 (A = Sr, Sm, and Ca), LaNiO3/SiO2, LaNiO3, and commercial MCR-2X catalysts. (a) CO conversion, (b) CH4 selectivity, and (c) CH4 yield.
The methane selectivity (Figure 3(b)) and yield (Figure 3(c)) of the catalyst are significantly improved after the A-site is doped with different elements. As shown in Figure 3, the highest CH4 selectivity is at about 500 °C. When the temperature is lower than 500 °C, the CH4 selectivity increases on increasing the temperature. The three catalysts doped with Ca, Sr, and Sm elements are beneficial to improve the selectivity of CH4 at medium temperature.
Reduction behavior
The cations at the B position (Ni) of the La0.75A0.25NiO3/SiO2 catalyst are reduced to metals, and the cations at the A position (La-A) are converted into the corresponding oxides. 41 It is reported in the literature that the reduction of LaNiO3 oxide is carried out in two steps. The reduction peak between 300 and 450 °C corresponds to the reduction of Ni3+ to Ni2+, forming La2NiO4, and the reduction peak above 450 °C corresponds to the reduction of Ni2+ to Ni0, forming metallic Ni particles.42,43 The restoration steps are as follows 9


Figure 4 shows the reduction of La0.75A0.25NiO3/SiO2 (A = Sr, Sm, and Ca) and LaNiO3/SiO2. For the LaNiO3/SiO2 sample, only two reduction peaks appear at 358 and 504 °C, which is consistent with the reduction of LaNiO3 reported in the literature. The XRD results in Figure 1 also confirmed that the LaNiO3/SiO2 samples prepared had no other impurity phases. The three catalysts substituted with Ca, Sr, and Sm all showed two obvious reduction peaks and a weak shoulder peak. The low-temperature reduction peak near 370 °C is attributed to the reduction of LaNiO3 to La2NiO4 and the reduction of free NiO at 500 °C. The weak small shoulder peak nearby is attributed to the reduction of NiO, formed outside the perovskite structure, to Ni0, and the high-temperature reduction peak above 600 °C is attributed to the continued reduction of La2Ni2O5 reduced to Ni0 at 370 °C. The XRD results show that La0.75Ca0.25NiO3/SiO2 has a relatively obvious heterogeneous NiO diffraction peak, while the La0.75Sr0.25NiO3/SiO2 and La0.75Sm0.25NiO3/SiO2 substituted samples do not exhibit the NiO diffraction peaks. Corresponding to the temperature program reduction (TPR) results, the La0.75Ca0.25NiO3/SiO2 reduce the peak area is the largest at the 503 °C, and the reduction peak spans a wide temperature, presenting a stepped reduction, which is beneficial for the reduction of different types of Ni particles during the process of increasing the reaction temperature, thereby improving the catalytic activity of the catalyst. It is worth noting that the area of the first peak of the substituted La0.75A0.25NiO3/SiO2 (A = Sr, Sm, and Ca) catalyst is significantly increased. Among them, the reduction peak of the Ca2+-substituted La0.75Ca0.25NiO3/SiO2 sample increases most obviously at around 370 °C. Combined with analysis of the XRD results, Ca2+ substitution leads to the formation of separate NiO phases on the surface, prompting the reduction peak at 370 °C to include LaNiO3 to La2NiO4 reduction and reduction of free NiO.
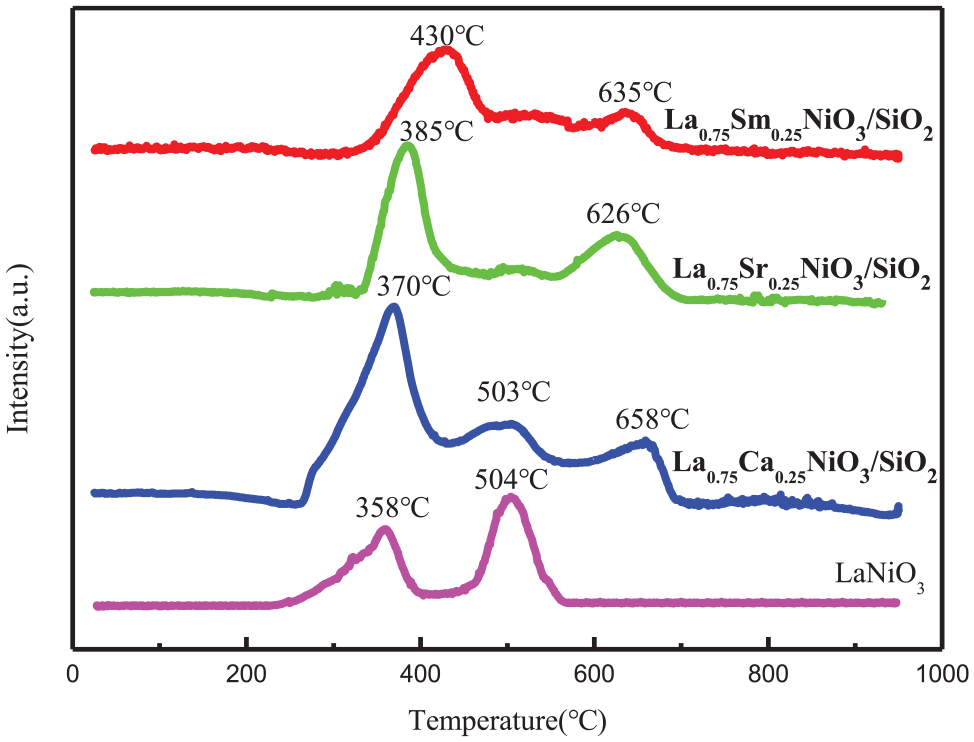
H2-TPR results of the La0.75A0.25NiO3/SiO2 (A = Sr, Sm, and Ca) and LaNiO3/SiO2 catalysts.
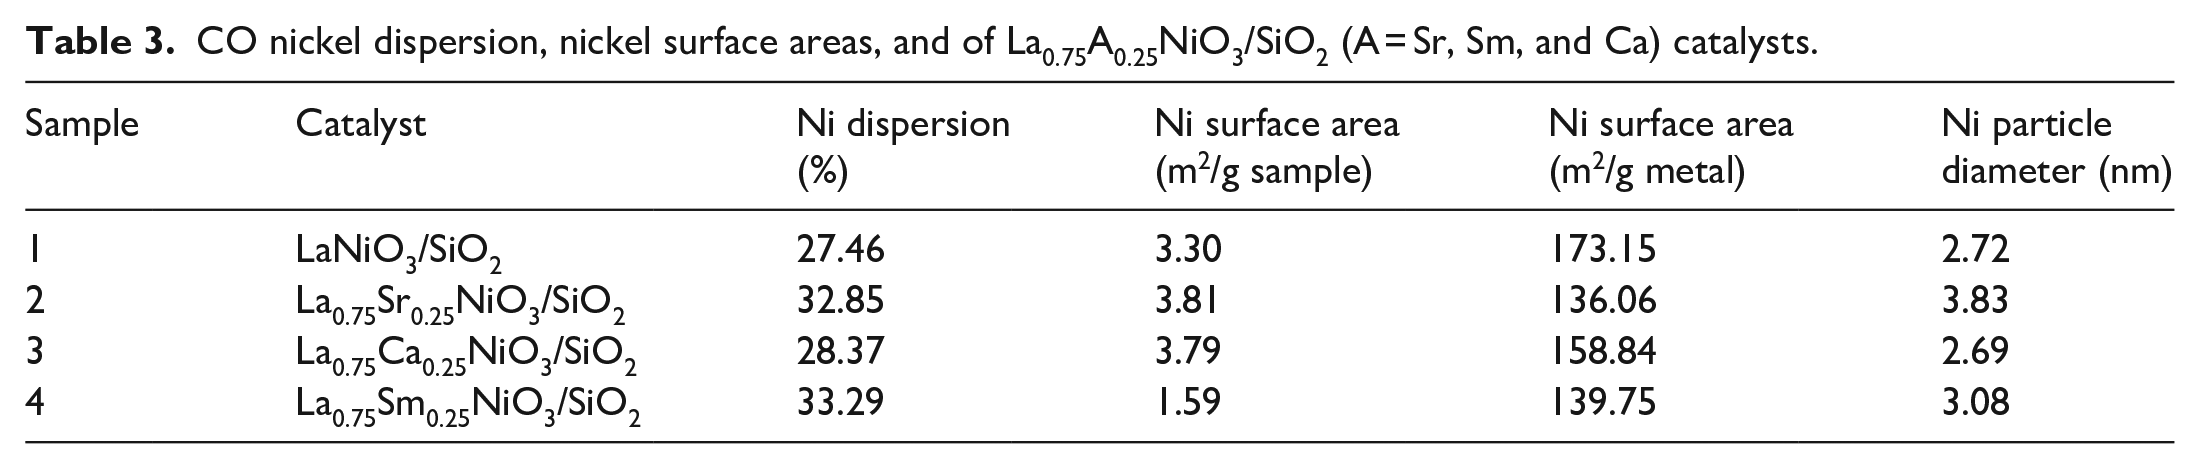
The Ni dispersions on La0.75A0.25NiO3/SiO2 (A = Sr, Sm, and Ca) catalysts calculated by CO chemisorption are summarized in Table 3. All La0.75A0.25NiO3/SiO2 (A = Sr, Sm, and Ca) catalysts exhibit a Ni dispersion of 27.46%−32.85%, resulting in a surface area of Ni metal (1.59−3.30 m2/g sample). In contrast, the Sr-doped catalyst has better Ni particle dispersion, which is consistent with the XRD characterization of the reduced catalyst.
CO nickel dispersion, nickel surface areas, and of La0.75A0.25NiO3/SiO2 (A = Sr, Sm, and Ca) catalysts.
It is reported that A-site substitution can change the B-site valence and oxygen defect concentration, thereby changing the oxidation–reduction performance of the catalyst. 9 The reduction peaks of the three La0.75A0.25NiO3/SiO2 (A = Sr, Sm, and Ca) catalysts after substitution all moved in the high-temperature direction. The increase in the low-temperature reduction temperature is due to the formation and separation of free NiO, which leads to the corresponding Ni3+ and Ni2+ reduction peak moving to the high-temperature direction. Compared with LaNiO3, the high-temperature reduction temperature of the substituted catalysts increased above 600 °C. The high-temperature reduction peak of the Ca2+-substituted La0.75Ca0.25NiO3/SiO2 catalyst was the highest at 658 °C. Furthermore, the substitution of Ca2+ and Sr2+ for La3+ represents a metamorphic substitution. The replacement of the lower oxidation state with the A-site cation will increase the high-valence ratio of the Ni B-site ion, aggravate the deformation of the perovskite octahedral crystal phase, modulate the oxygen behavior of the catalyst and surface oxygen species, increase the difficulty of the reduction of lattice oxygen, and produce oxygen vacancies. The binding activity test showed that Ca2+ and Sr2+ replaced the A-site element La3+, which is an effective strategy to generate oxygen vacancies to improve the mesothermal activity. However, the binding energy of the substituted catalyst Ni2p3/2 will be enhanced, weakening the covalent bond of A–O and increasing the ionic bond of Ni–O, which is consistent with the X-ray photoelectron spectroscopy (XPS) results.
By fitting the XPS curve, the XPS spectra of the La0.75A0.25NiO3/SiO2 (A = Sr, Sm, and Ca) and LaNiO3/SiO2 catalyst samples are given. As shown in Figure 5, the XPS spectrum of La3d shows two double peaks, La3d3/2 and La3d5/2, which are similar in form to standard trivalent La3d and are typical La3+ compounds. The XPS spectrum was fitted to four peaks, located at 834, 838.1, 851.0, and 854.9 eV, which correspond to the La3d5/2cf0, La3d5/2cf1L bond, the La3d3/2cf0 and La3d3/2cf1L bond, and belong to La2O3 and LaNiO3. It is proved that each catalyst has an obvious La3+ compound and a LaNiO3 crystal phase, which indicates that the doped Sm, Sr, and Ca elements can be substituted at the A position, which is also consistent with the XRD characterization.
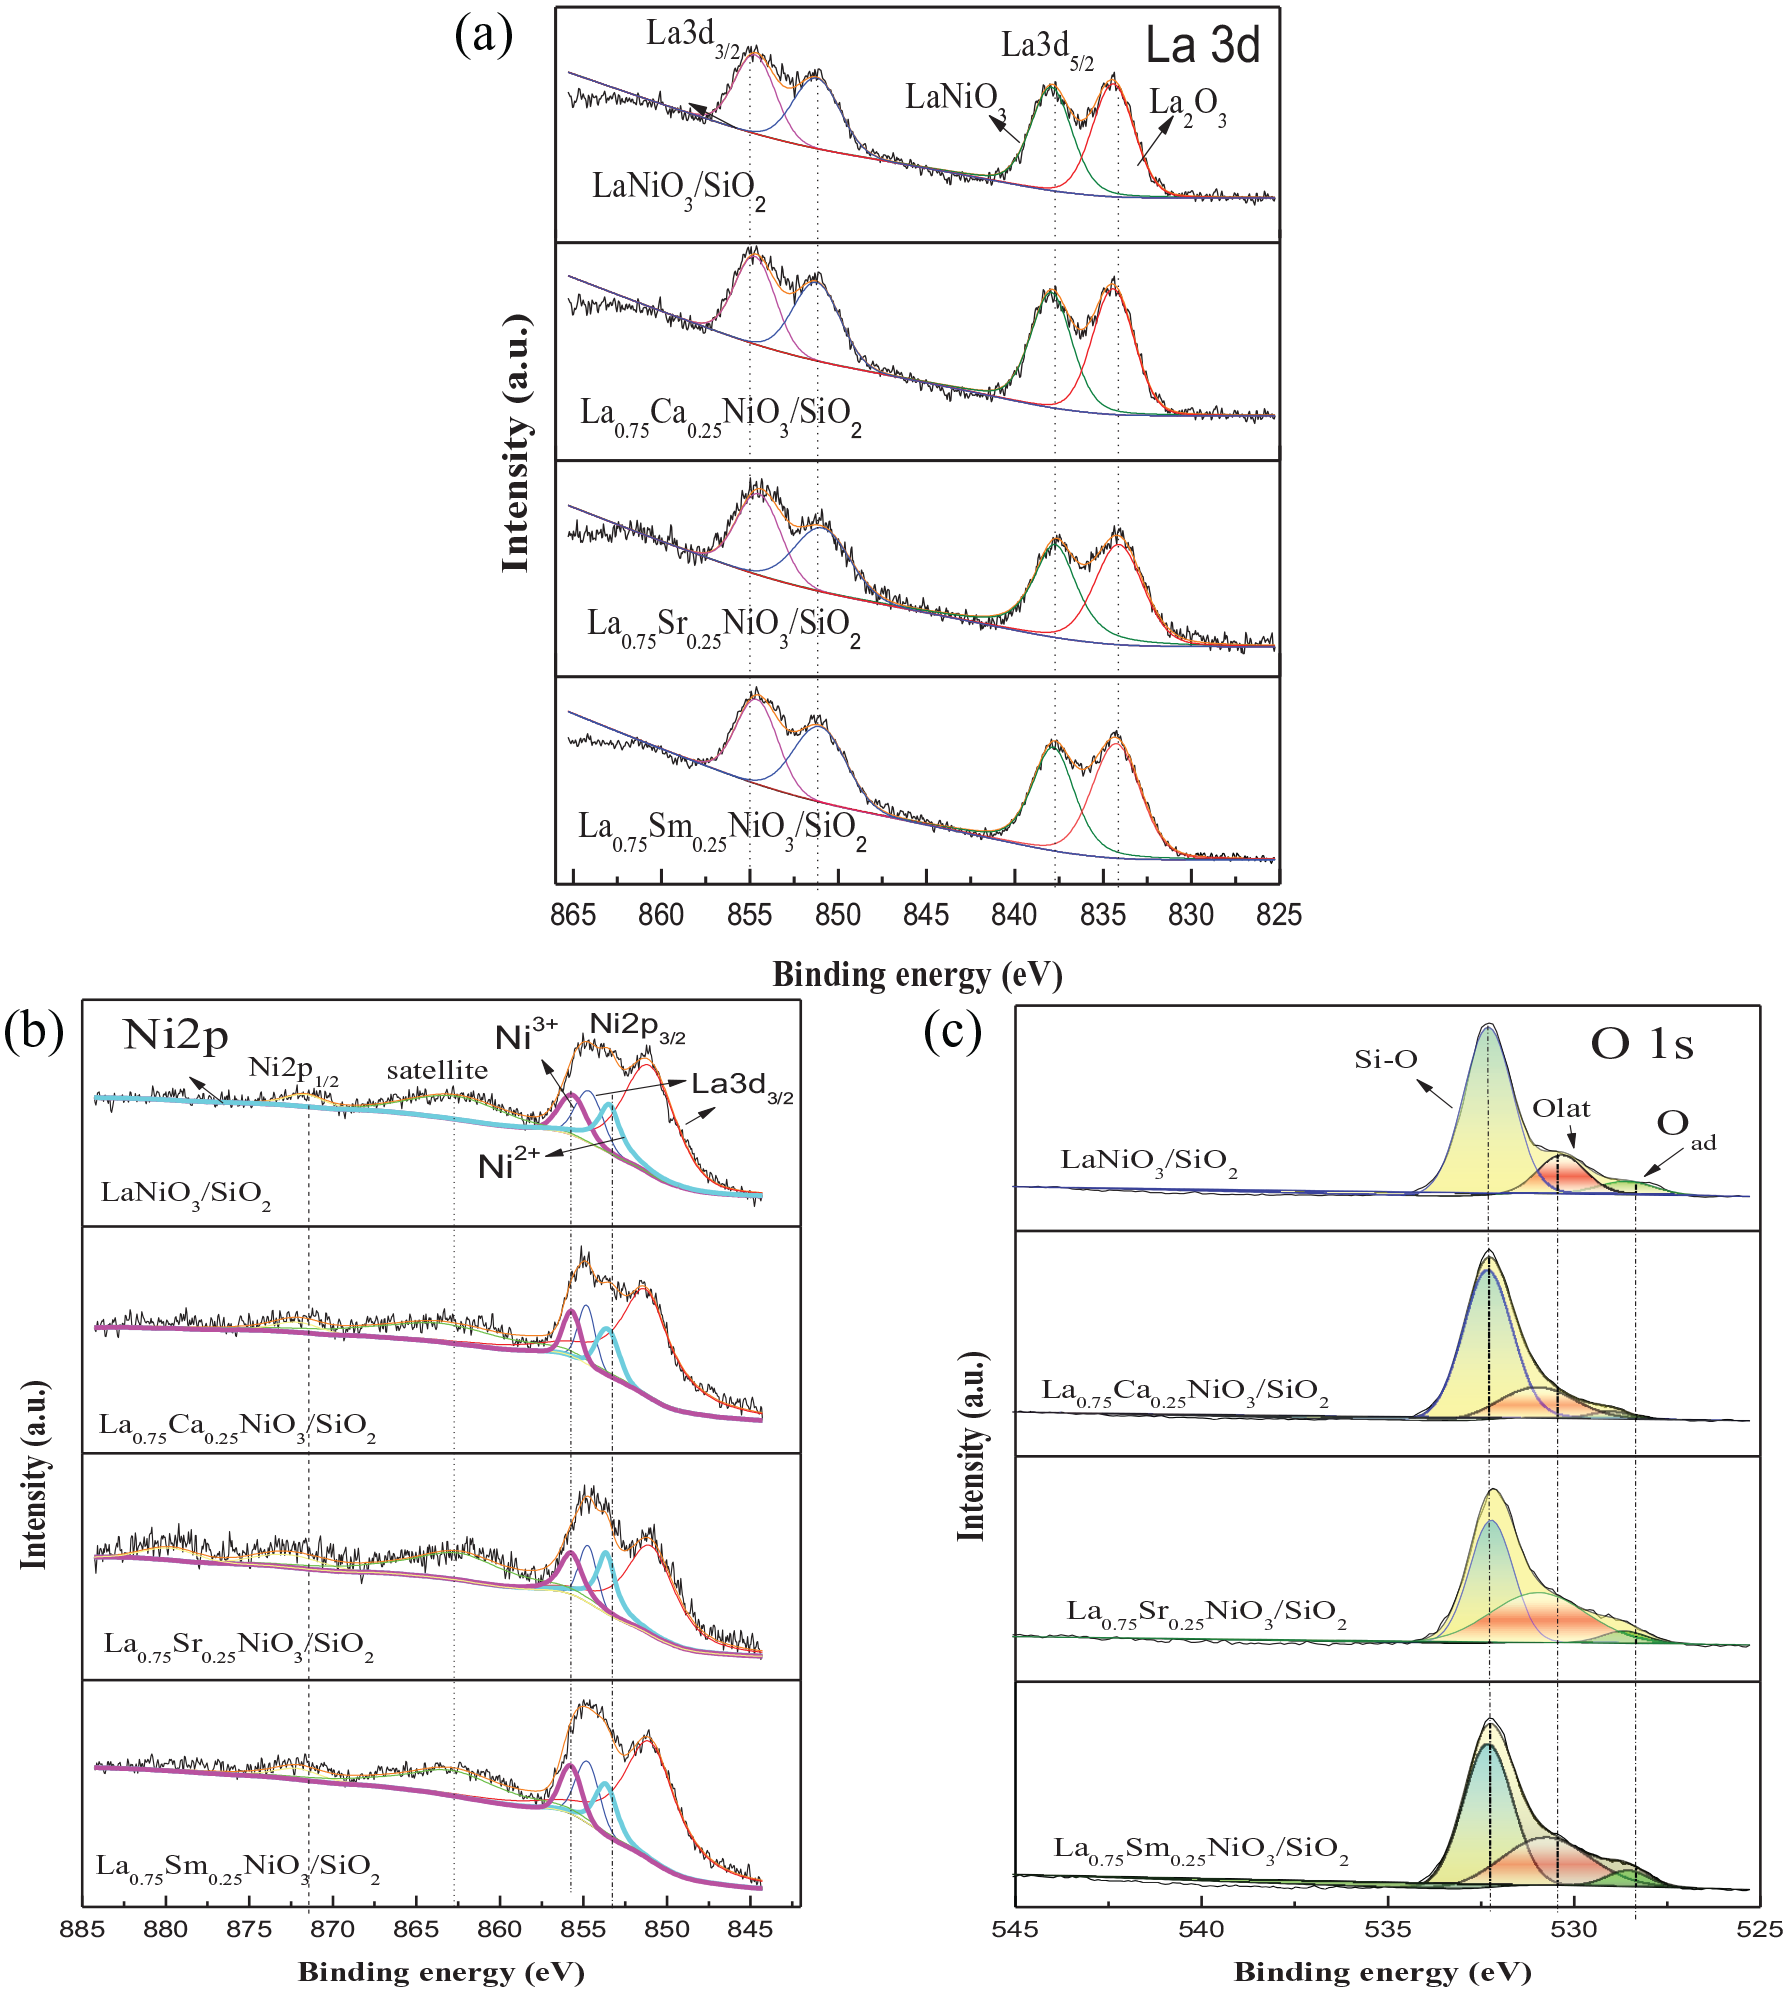
XPS spectra of the La0.75A0.25NiO3/SiO2 (A = Sr, Sm, and Ca) and LaNiO3/SiO2 catalysts. (a) La3d, (b) Ni2p, and (c) O1s.
The XPS spectrum of Ni shows that many of the peaks are similar to the standard Ni2p peaks, which are typical Ni2p peaks (Figure 5(b)). The Ni2p peaks of the LaNiO3/SiO2 catalyst at 853.6 and 855.8 eV correspond to Ni2+ and Ni3+, respectively. 13 The Ni ions in LaNiO3 coexist as Ni2+ and Ni3+. When La3+ is partially replaced with low-valence Ca2+ and Sr2+, the peak area of Ni3+ increases, the content of high-valence Ni3+ increases, and the ratio of Ni3+/Ni2+ increases (Table 4). Compared with the undoped LaNiO3 catalyst, the electron-binding energy of doped Ca, Sr, and Sm elements moves to a higher binding energy direction than that of undoped LaNiO3, which indicates that the ionic bond of Ni–O is enhanced, the interaction force is enhanced, and that the result of TPR consistent.
The binding energy values and Ni concentrations of La0.75A0.25NiO3/SiO2 and LaNiO3/SiO2.

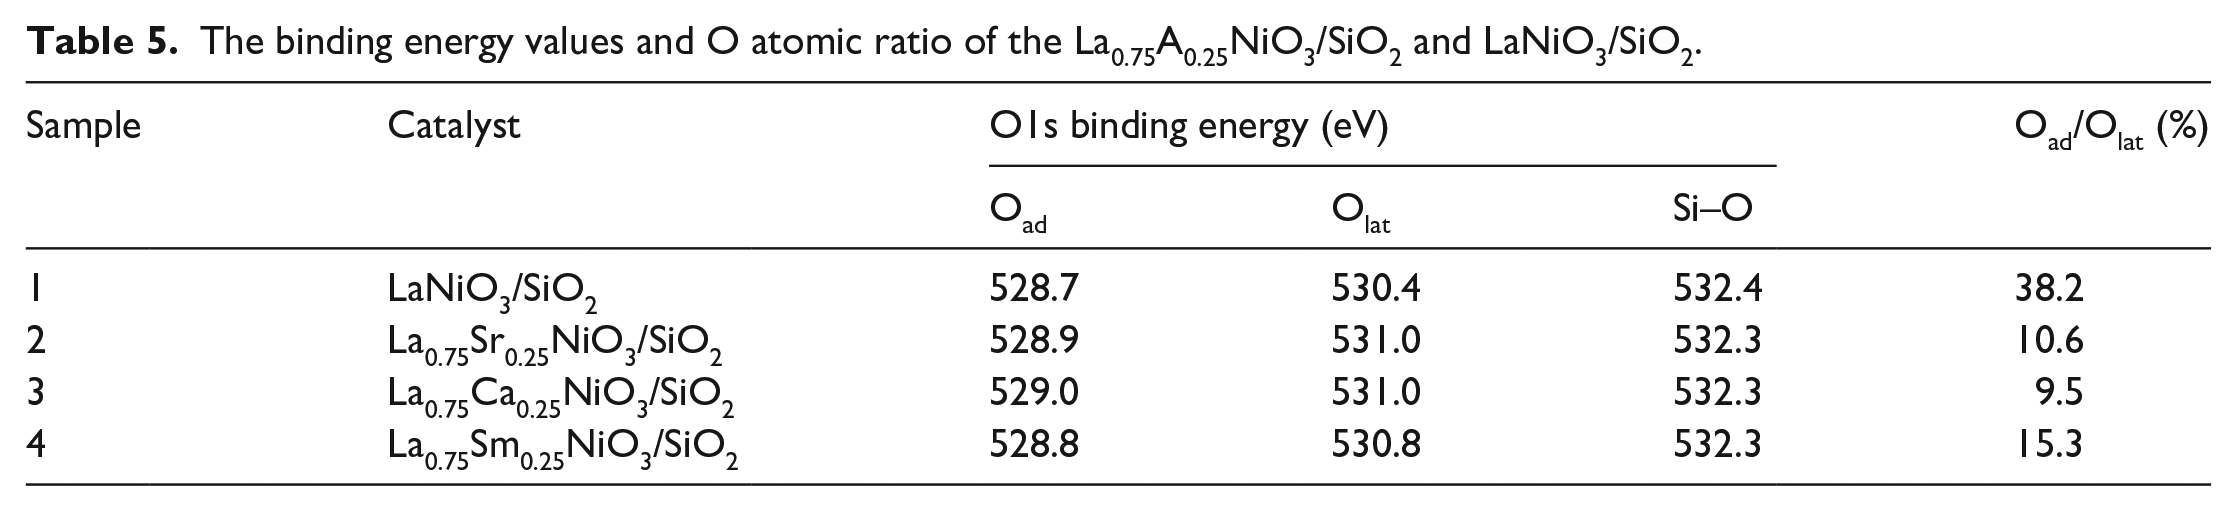
The activity of perovskite-type oxides is strongly affected by the properties of near-surface oxygen species. It can be seen from the O1s spectrum (Figure 5(c)) that in the La0.75A0.25NiO3/SiO2 (A = Sr, Sm, and Ca) and LaNiO3/SiO2 catalyst samples, three obvious O1s binding energy peaks appear. The peak at 528–529 eV is regarded as the lattice oxygen species Oad, which corresponds to the lattice perovskite O2−, 44 and the peak near 530–531 eV corresponds to the surface adsorbed oxygen Olat. 41 The peak near 532.4 eV corresponds to the Si–O bond between SiO2. The Si–O position at 532.4 eV did not change significantly, indicating that the structure of the SiO2 support remained stable before and after doping and was not destroyed. Comparing the peak positions and peak areas of the catalysts, it can be seen that after doping with Sr, Ca, and Sm elements, the peak areas and peak positions of 528.7 and 530.4 eV all move to a high-binding energy, indicating that the doped perovskite ore is more difficult to reduce, which is consistent with the H2-TPR results. At the same time, the area ratio of lattice oxygen and adsorbed oxygen has changed, indicating that doping with different elements affects the existence of oxygen species.
In Table 5, it can be seen that the percentage of lattice oxygen Oad and surface adsorbed oxygen Olat decreases on doping with different elements. Among them, the ratio of Oad/Olat in the Ca-doped catalyst decreased significantly, and the content of adsorbed oxygen Olat increased. This is due to the substitution of Ca2+ for La3+, which distorted the perovskite structure and broke the internal balance of LaNiO3, thereby resulting in the distribution of oxygen not being uniform, and more unsaturated nickel ions and oxygen vacancies are formed. The oxygen vacancies have a promoting effect on the adsorption of oxygen, causing changes in the adsorption of oxygen and lattice oxygen, and conversion between the two. 44
The binding energy values and O atomic ratio of the La0.75A0.25NiO3/SiO2 and LaNiO3/SiO2.
From the results of TPR and XRD combined with the performance test data, it can be concluded that doping with different elements has a significant impact on the structure and performance of the prepared catalyst. Doping with Ca2+, Sr2+, and Sm2+ whose ion radius is close to La3+, doping elements can enter the LaNiO3 lattice and partially replace the A-site element La. After substitution, the reduction temperature increases, the interaction between the active material and the support is enhanced, and the reduced Ni0 is beneficial to improve the mid-temperature activity of the methanation reaction. However, doping with 0.25 wt% Ce3+ cannot successfully replace La at the A-site to form LaCeNiO3, but enters the La2O3 lattice to cause the lattice to shrink, forming NiO and La–Ce–O solid solutions. In XPS, compared with the undoped LaNiO3/SiO2 catalyst, the catalyst doped with Ca, Sr, and Sm moves to a higher binding energy direction, which enhances its interaction force and promotes the covalent double bond and electron interaction. The interaction promotes the dissociation and adsorption of CO.45–47 The perovskite catalysts doped with Ca and Sr elements are more likely to generate oxygen vacancies and have better oxygen adsorption, storage and migration capabilities.
Stability tests
In order to study the stability of the catalysts prepared by doping with different elements, the La0.75A0.25NiO3/SiO2 (A = Sr, Sm, and Ca) and LaNiO3/SiO2 catalysts were tested for their stability at 700 °C, the 0.1 MPa, and 15,000 mL−1 g−1 h (Figure 6). It can be observed from Figure 6 that the La0.75A0.25NiO3/SiO2 (A = Sr, Sm, and Ca) and LaNiO3/SiO2 catalysts show good stability at 700 °C for 30 h, and the CO conversion remains above 85%.

The stability testing of the La0.75A0.25NiO3/SiO2 (A = Sr, Sm, and Ca) and LaNiO3/SiO2 catalysts at 700 °C, 0.1 MPa, 15,000 mL g−1 h−1, 30 h (a) CO conversion and (b) CH4 selectivity.
Catalyst structures after the stability tests
After 30 h of high-temperature catalytic reaction, the diffraction peaks of La2O3 of each catalyst disappeared, and La2O2CO3 appeared at 22.3°, 25.1°, 25.8°, 30.3°, 33.8°, and 56.9° (22-0642) (Figure 7). The diffraction peak of the crystalline phase, La2O2CO3 is formed because La2O3 absorbs the by-product CO2 produced in the reaction. At the same time, La2O2CO3 can react with carbon deposits on the active site, thus playing an important role in removing carbon deposits.

XRD patterns of the La0.75A0.25NiO3/SiO2 (A = Sr, Sm, and Ca) and LaNiO3/SiO2 catalysts after stability sting at 700 °C for 30 h, space velocity of 15,000 h−1.
After the stability test, each catalyst has diffraction peaks due to Ni metal element (PDF no. 01-1260) at 44.5° and 51.8°. The size of the Ni nanoparticles after the reaction was estimated by the Scherrer formula. The results are shown in Table 6. It can be seen from the table that the catalyst prepared by doping elements Ca, Sr, and Sm reacted at 700 °C for 30 h, and the Ni particles became larger, indicating that it is easier to migrate and slightly aggregate in high-temperature environment, but it has little effect on the activity of the catalyst.
Ni particle size in the catalysts before and after the reaction.

The LaNiO3/SiO2 and La0.75Ce0.25NiO3/SiO2 catalysts showed obvious weight gains in the range of 300–600 °C (Figure 8(a)), accompanied by an exothermic peak at the same temperature in the DSC chart, which is due to Ni0 in the catalyst after the reaction reacting with CO2 in the air to form nickel carbonate. As the temperature rises further, the substance decomposes. The catalyst prepared by doping with Ca and Sr shows an obvious exothermic peak at about 600 °C, which is attributed to the burning of graphitic carbon. The catalyst prepared by doping with Ca and Sr shows a significant exothermic peak at about 600 °C, which is also attributed to the burning of graphitic carbon. From Figure 8(a), there is a significant weight loss at about 600 °C, indicating that the catalyst has produced more carbon deposits after the stability test. The catalyst prepared by doping with Sm has no obvious weight loss stage or exothermic peak in Figure 8(a) and 8(b). This is because the lanthanide element Sm has the best plasticity among rare earth metals. The addition of rare earth Sm promotes the conversion of NiO into Ni0, and the presence of elements in the silicon dioxide lattice will generate oxygen vacancies to maintain its electron neutrality. These vacancies make it easier to activate NiO, and weaken the bond between Ni–O, thereby promoting the formation of Ni0, and eliminating carbon deposition.

TG-DSC patterns of the La0.75A0.25NiO3/SiO2 (A = Sr, Sm, and Ca) and LaNiO3/SiO2 catalysts after stability text at 700 °C for 30 h, space velocity of 15,000 h−1. (a) TG patterns of the catalysts and (b) DSC patterns of the catalysts.
Conclusion
In this paper, an La0.75A0.25NiO3/SiO2 (A = Sr, Ce, Sm, and Ca) catalyst was prepared by the citric acid complexation method. The elements Ca, Sr, and Sm successfully partially replaced the A-site element La in LaNiO3. After reduction, the perovskite structure is destroyed, forming hexagonal La2O3 and Ni crystal phases. The Ce element failed to enter the perovskite structure in the Ce element-doped catalyst, but was doped into the La2O3 lattice to form the cubic La–Ce–O solid solution and the NiO separated phase. After reduction, the structure of the La–Ce–O solid solution remained unchanged.
Compared with undoped LaNiO3/SiO2, the catalyst prepared by partially replacing the A-site elements in LaNiO3 with Ca, Sr, and Sm had significantly improved catalytic performance at medium temperature. Among these, the La0.75Ca0.25NiO3/SiO2 catalyst showed the best catalytic performance. When the temperature reached about 550 °C, the CO conversion rate reached more than 90%. This is due to the use of low-valent Ca2+ instead of high-valent La3+ to cause distortion of the catalyst lattice, producing oxygen vacancies so that it exhibits better oxygen adsorption, storage, and mobility. In addition, it has a wide reduction temperature, allowing Ni to interact with the support in various ways. Combined with the XRD and thermogravimetric (TG)-DSC results of each catalyst after the stability test, it can be seen that the catalyst prepared by doping with Sm shows the best anti-sintering and anti-carbon deposition performance, which is related to the small size and high dispersion of Ni particles after reduction of the La0.75Sm0.25NiO3/SiO2 catalyst. This also shows that the substitution of different elements produces different electronic effects, which significantly affect the size of Ni particles and the interaction between Ni and La2O3, as confirmed by Figures 2 and 3.
Experimental
Preparation of SiO2 supports
Commercial silicon oxide was calcined at 700 °C for 5 h at a heating rate of 2 °C/min, and the obtained powder granular material was used as the support.
Preparation of the catalysts
The catalysts are prepared by the citric acid complex method: La(NO3)3·6H2O, Ce(NO3)3·6H2O, Ca(NO3)2·4H2O, SmN3O9·6H2O, Sr(NO3)2, and other nitrates are measured in the proportions: n(La + A):n(Ni) = 1, n(La):n(A) = 3:1(A = Ce, Ca, Sm, and Sr) dissolved in distilled water, add the molar ratios of total metal cations:citric acid:ethylene glycol were 1:2:4. After the sample had completely dissolved, it was immersed in an equal volume on the carrier SiO2, stirred and evaporate to a green gel at 80 °C, and at room temperature, dried at 80 °C for 6 h and then heated up to 120 °C for 12 h. The resulting powder is calcined at 350 °C at a heating rate of 2 °C/min for 2 h, and then at 700 °C for 5 h at the same heating rate. The SiO2-supported perovskite catalyst is obtained, expressed as La0.75A0.25NiO3/SiO2 (A = Sr, Ce, Sm, and Ca) and LaNiO3/SiO2.
Catalytic performance evaluation
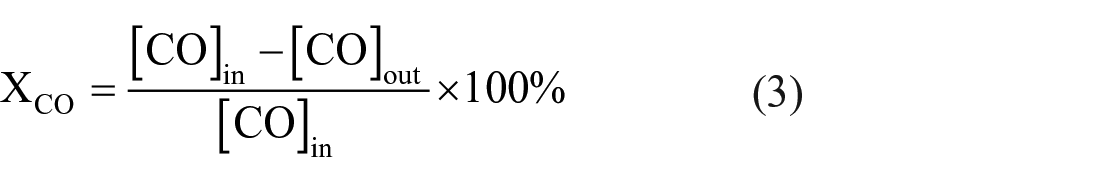
The performance tests were carried out using a WFSM-3060DL catalytic evaluation instrument (Tianjin Xianquan Co., Ltd, China). The powdered catalyst (200 mg) of 40–60 mesh particle size was mixed with quartz sand and then placed in a tubular quartz microreactor. First, the catalysts was purged with N2 for 1 h to remove the impurities on the surface, and then reduced at 400 °C for 50 min using hydrogen. Second, the reaction gases (H2:CO = 3, volume ratio) and Ar as a balance gas were switched into the microreactor after the catalyst had been cooled to 200 °C. The hourly space velocity was 10,000 h−1, and the temperature of catalytic evaluation was from 250 to 700 °C with a temperature interval of 50 °C at 0.10 MPa. The reactants and products were analyzed on line using on online SP-2100A gas chromatograph equipped with a thermal conductivity detector (TCD). The details of the catalytic performance were calculated based on formulas (3)–(5) as follows:
CO conversion (XCO, %)
CH4 selectivity (
CH4 yield (

Characterization of the catalysts
The XRD characterization was performed using a SmartLab 9 KW model X-ray diffractometer produced by Rigaku Corporation. It adopts the Cu target configuration (wavelength 0.154 nm), and is equipped with a high-sensitivity D/teX Ultra 250 detection system, tube voltage is 40 kV, and the tube current is 40 mA. The catalyst scanning range is over a wide angle 5°~80°, and the scanning rate is 30°/min.
The H2 temperature program reduction (H2-TPR) was tested using a PX200 catalyst characterization device produced by Tianjin Pengxiang Technology Co, Ltd. Test conditions: a sample of the catalyst (0.100 g) was first purged with high-purity N2 at 200 °C for 2 h to remove the adsorbed impurities on the surface, and then cooled to room temperature, using H2 (5 mL min−1) and then N2 (45 mL min−1). The temperature-programmed reduction operation is carried out under a mixed gas atmosphere. The temperature program is increased from 20 to 900 °C at a rate of 10 °C min−1, and the thermal conductivity cell (TCD) is used for detection. The reduction performance of the catalyst was analyzed according to the peak position and peak area.
XPS test adopts ESCLAB-250Xi X-ray photoelectron spectrometer produced by American Thermo-Fisher Company, monochromatic X-ray source (Al anode target: 1486.6 e V, beam spot diameter: 200–900 μm). The operating power is about 150 W, and the degree of vacuum is 2 × 10⁻⁷ Pa. The C1s peak of polluted carbon (Eb = 284.6 eV) is used for electron-binding energy correction.
CO pulse adsorption adopts He as the carrier gas of 30 mL min−1 to perform volumetric chemistry on Microbody Chemistry 2920II Auto Chemistry II. Before the measurement, the sample was reduced under a 10% H2/N2 flow (50 mL min−1) at 650 °C for 2 h, and then flushed with He carrier gas for 30 min at this temperature. After the sample was cooled to room temperature, a 10.22 vol% CO pulse (0.5173 mL) was injected into the sample until the CO adsorption was saturated.
The TG-DSC analysis is characterized by the STA409PC synchronous thermal analyzer produced by NETZSCH in Germany, and the amount of carbon deposited on the spent catalyst is analyzed from the TG curve obtained. During the TG test, the sample was heated from 40 to 1000 °C at a heating rate of 10 °C/min in an air atmosphere.
Footnotes
Declaration of conflicting interests
The author(s) declared no potential conflicts of interest with respect to the research, authorship, and/or publication of this article.
Funding
The author(s) disclosed receipt of the following financial support for the research, authorship, and/or publication of this article: This work was supported by the National Natural Science Foundation of China (no. 21962014) and the Inner Mongolia Autonomous Region Science and Technology plan project (2020GG066).