
Abstract
Fluorescence nanostructures have been widely applied in the biomedical field as therapeutic agents and as novel tools for labeling, imaging, and sensing. However, the protein corona will dramatically influence the predesigned properties of nanostructures in serum. Therefore, it is important to understand the mechanism of protein corona formation on nanostructures. Photoluminescent carbon dots have been widely applied in the biomedical field since their discovery. Due to the large overlap between the absorption spectra of proteins and the fluorescence spectra of photoluminescent carbon dots, herein we investigate the mechanism of human serum albumin corona formed on photoluminescent carbon dots using fluorescence resonance energy transfer. By employing spectroscopic methods, the binding constants and the number of binding sites between human serum albumin and photoluminescent carbon dots have been determined, and the corresponding thermodynamics are also discussed as well for the interaction between photoluminescent carbon dots and human serum albumin. In addition, we successfully demonstrate the photoluminescent carbon dots in labeling bean sprouts. We believe that the current research cannot shed light on the mechanism of protein corona formation on nanostructures, but also could benefit the design of hybrid nanomaterial which will be applied to serum environments.
Keywords
Introduction
Photoluminescent carbon dots (PCDs) were discovered accidently during the electrophoretic purification of carbon nanotubes 1 and since then PCDs have received more and more attention due to the following reasons: 2 (1) very low cytotoxicity and high biocompatibility, (2) easy to prepare and exhibit conjugation, (3) no photobleaching or blinking effects, and (4) very promising carbonaceous material for biomedical applications. In order to achieve high quantum yields and color adjustability, a number of precursors like alcohols, 3 glucose, 4 candle soot, 5 and methods such as laser ablation, 6 pyrolysis, 7 electrochemical etching,4,8 wet oxidation, 9 microwave-assisted synthesis, 10 and hydrothermal synthesis 11 have been employed. 12 To date, the highest quantum yield of PCDs has reached more than 50% of pure carbon, 13 and even up to 73% with nitrogen- and sulfur-doping. 14 In addition, the emission wavelengths can range from ultraviolet (UV) to near infrared (NIR). 15 Furthermore, PCDs have already been applied to biomedical field for labeling/imaging, sensing/detecting, and therapeutics. Interestingly, amphiphilic PCDs synthesized by a simple and green method at room temperature can be well dispersed in either aqueous or organic solutions, which has been further applied to sense iodine species in high saline water. 16
Interactions between biomolecules and nanomaterials have been the focus of research because it will always show up as nanomaterials being applied to biomedicine field. Many biomolecules and a large number of nanomaterials/nanostructures have been studied in terms of their interactions, of which human serum albumin (HSA) has become an essential part during the expansion of nanomaterial applications in biomedicine. For example, the protein corona formed on nanomaterials can completely change the originally designed surface chemistry and eventually decide the nanomaterial destination.17,18 Moreover, the bio-nano affinity also influences the bioconjugation rate and efficiency, as does nanopatterning19–24 and self-assembling of either nanomaterials or biomolecules (like enhancing protein fibrillization 24 ) or both directions.
The HSA, a very abundant serum protein with a molecular weight of ~65 kDa, consists of 585 amino acids (including a total of 17 disulphide bridge, one free thiol (Cys 34) and a single tryptophan (Trp 214)), is a heart-shaped molecule which comprises three homologous domains, and each domain is a product of two subdomains. The hydrophobic cavities in subdomains IIA and IIIA are principal regions for ligand binding. 25 The HSA has been favored as a general model protein in biomedical research due to the following two reasons: (1) the significant contribution to colloid osmotic blood pressure and aid in the transport, distribution and metabolism of many endogenous and exogenous ligands, which represent a spectrum of chemically diverse molecules such as fatty acids, amino acids (notably tryptophan and cysteine), steroids, metals (such as calcium, copper and zinc), and numerous pharmaceuticals (like paclitaxel), and (2) HSA has been found in tissues and bodily secretions throughout the body in addition to the blood circulation system (40 mg mL−1), 26 while the extravascular protein comprises 60% of the total albumin. 25
By choosing PCDs and HSA as two model materials, in this paper, we have investigated the interactions between HSA and our “home-made” PCDs prepared from citric acids. By employing both the fluorescence quenching method based on the fluorescence resonance energy transfer (FRET)27–32 and spectrum superimposition, the binding constants and the number of binding sites have been determined. In addition, the corresponding thermodynamics for the PCD–HSA interaction are discussed. Finally, the citric acid-derived PCDs have been demonstrated for biolabeling applications.
Results and discussion
Characterization of PCDs
The as-prepared PCDs can be readily dissolved in an aqueous solution, and we were first evaluated that of the size and potential by dynamic light scattering (DLS). The zeta-potential result of PCDs is 0.29 ± 0.2 mV (Figure 1(a)) and HSA is −19.3 ± 0.4 mV (Figure 1(c)). The zeta-potential measurement proved that the surface of PCDs is positively charged and HSA is negatively. The average hydrodynamics of PCDs and HSA are 5.17 ± 0.15 nm (Figure 1(b)) and 5.65 ± 0.34 nm (Figure 1(d)), respectively. The particle size of PCDs is small, so they can be used as a probe for detecting biological cells, and the damage to the organism is also minimal.

The hydrodynamic diameter (Dh) and zeta (ζ) potential of PCDs and HSA. The ζ-potentials of PCDs and HSA are (a) 0.29 ± 0.2 mV and (c) −19.3 ± 0.4 mV. The average Dh of PCDs and HSA are (b) 5.17 ± 0.15 nm and (d) 5.65 ± 0.34 nm, respectively.
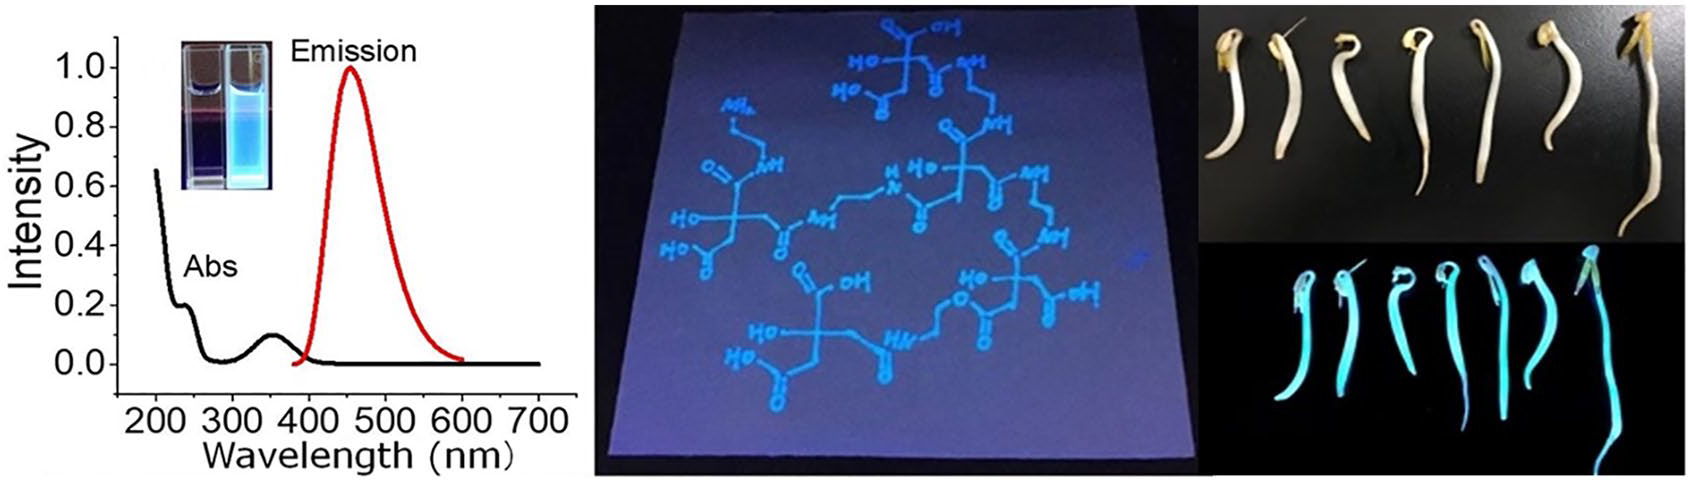
With using a UV-Vis spectrophotometer, the aqueous solution of PCDs shows a characteristic absorption spectrum with peaks at 230 and 360 nm, respectively. When PCDs are excited at a wavelength of 360 nm, there is a relatively narrow and symmetric emission spectrum at 455 nm (Figure 2(a)). The emission peak position of the PCDs is unchanged at different excitation wavelengths, and the fluorescence intensity changes with an increase of the excitation wavelength. But there is no red shift, indicating that the particle size of the nanoparticles is relatively uniform. Because of their bright blue appearance under UV illumination and lack of color in daylight, the as-prepared PCDs can act as a fluorescent ink as demonstrated in Figure 2(c) and (d). This feature can be used for anti-counterfeiting and information marking.
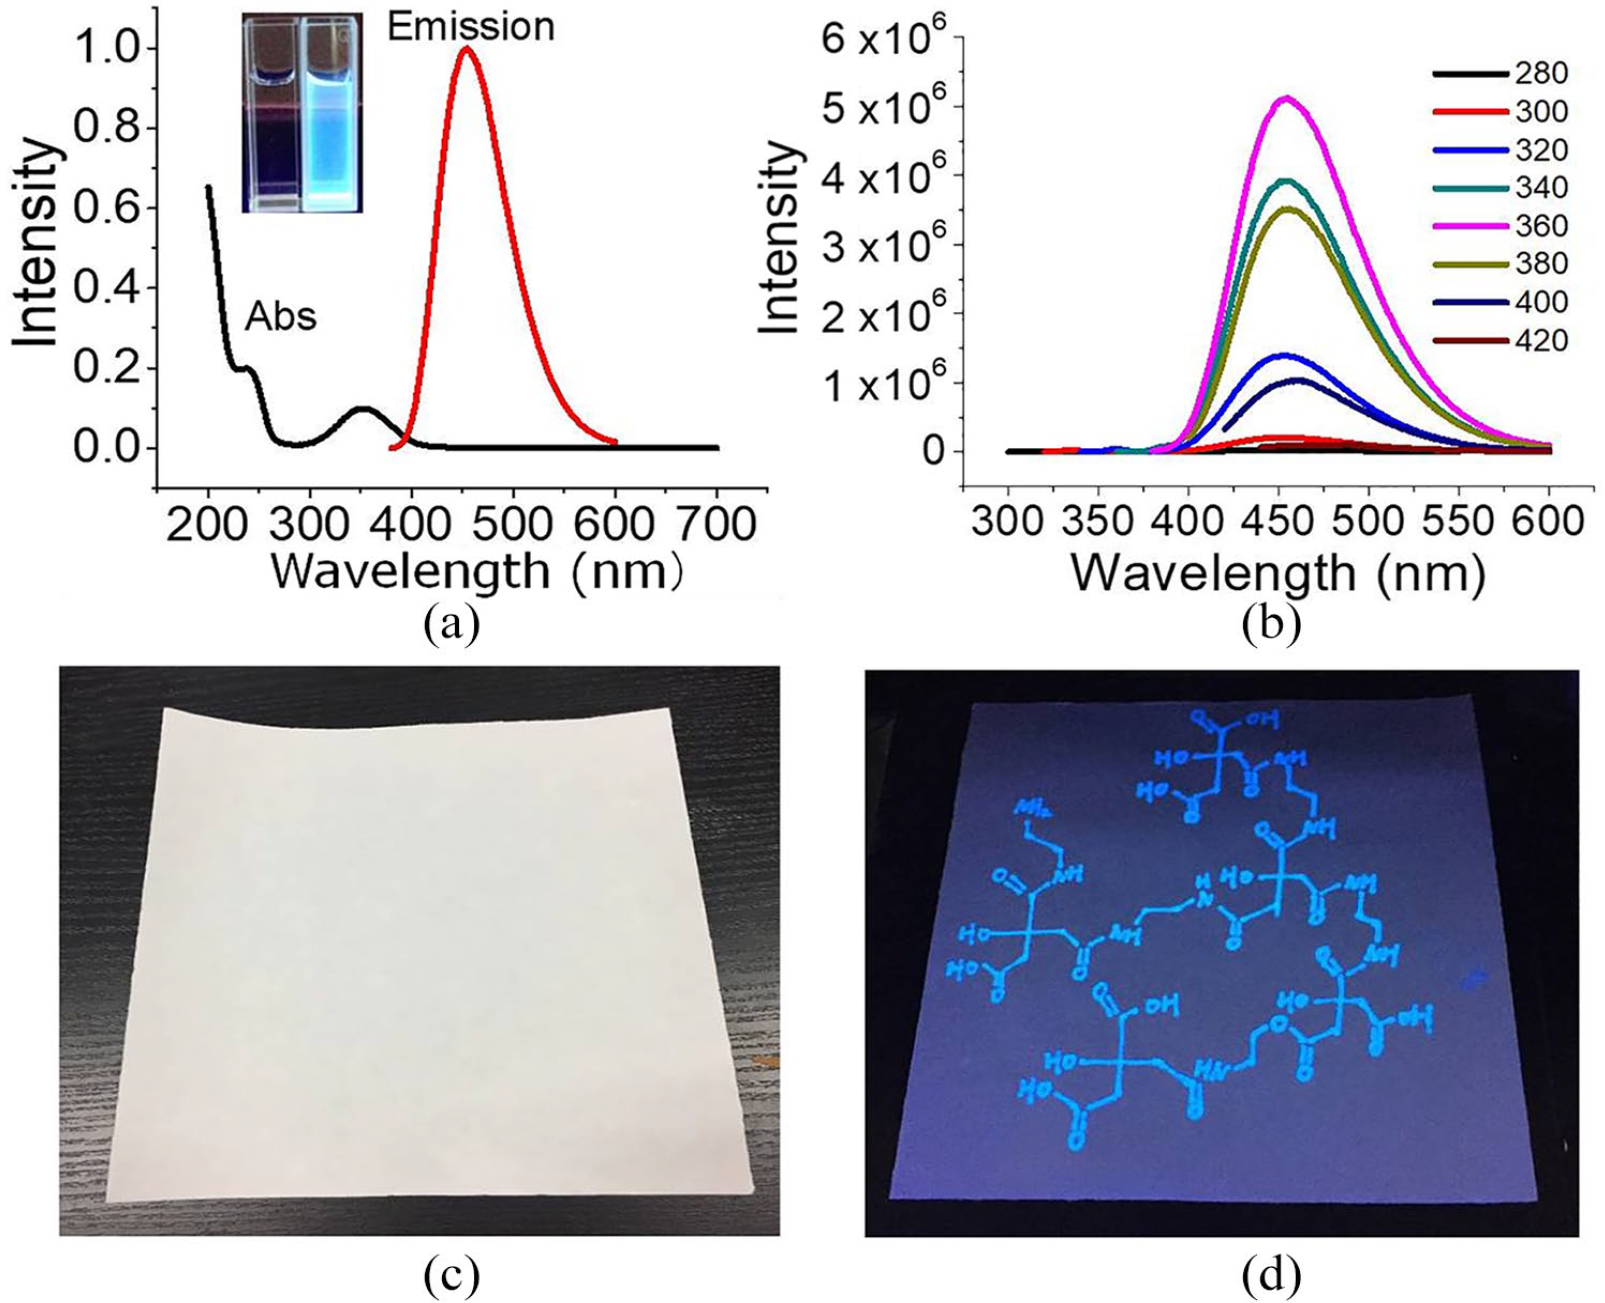
The optical characterization of PCDs. (a) There are two absorption peaks centered at 230 and 360 nm, respectively, and the emission peak is centered at 455 nm using an excitation wavelength of 360 nm. The inset photo shows the sample in daylight (left) and under ultraviolet irradiation (right). (b) The spectra for excitation dependent emissions. The excitation wavelengths change from 280 to 420 nm as shown by the colored lines. Photos of paper written with PCDs under (c) daylight and (d) ultraviolet illumination.
The thermodynamics and kinetics of HSA corona on PCDs
It clearly shows two photoluminescence (PL) bands from both the excitation–emission matrices (EEMs) of HSA (Figure 3(a)) and PCDs (Figure 3(b)). The strongest emission of HSA is centered at 342 nm upon 280 nm excitation, while the as-prepared PCDs show two fluorescent groups, the higher one is at 456 nm with an excitation at 360 nm, and the other emits at 458 nm with an excitation at 252 nm. When excited near 360 nm, the fluorescence intensity of the PCDs is strongest.

Excitation–emission matrices of (a) HSA and (b) PCDs. The highest PL intensity of HSA is distributed around 342 nm using an excitation at 280 nm. The PCDs show two fluorescent groups, the higher one is at 456 nm with an excitation at 359 nm, and the other emits at 458 nm with an excitation at 252 nm.
From the optical spectra of HSA and PCDs (Figure 4(a)), we can see that the PL intensity of HSA decreased along with an increasing concentration of PCDs, which indicated that HSA PL was quenched by transferring the fluorescence resonance energy to the PCD molecules. The fluorescence quenching method was employed to study both the kinetics and thermodynamics of the physical adsorption procedure. From Figure 4, it can be seen that the fluorescence of HSA was quenched more and more by increasing the addition of PCDs. The Stern–Volmer quenching constant (which is a measure of the quenching efficiency) was calculated as 1.02 × 10⁶ M−1. Therefore, a modified Stern–Volmer equation should be used to analyze the quenching data.

PCD quenching HSA PL assay at 298 K. (a) PL spectra of HSA (6.0 μM) on mixing with various amounts of PCDs and excitation at 280 nm. From top to bottom at a wavelength of 342 nm, the final concentrations of PCDs are 0, 10, 20, 30, 40, 50, 60, 70, 80, and 90 μg mL−1. (b) The Stern–Volmer plot (black dots) and the corresponding linear fit (red line) for the quenching data from (a). (c) The modified Stern–Volmer plot (black dots) and the corresponding linear fit (red line) for the quenching data from (a). (d) The Hill plot (black dots) and the corresponding linear fit (red line) for the quenching data from (a). The error bars were obtained from three replicates.
In this case, the as-prepared PCDs and HSA form a protein corona, and hence KSV can be considered as Ka. Therefore, we employed the modified Stern–Volmer equation to further analyze the quenching data at three different temperatures (298, 304, 310 K; see Supplemental Figures S1 and S2 in Supporting Information). The resulting adsorption data at three different temperatures are shown in Table 1, and it is clear that Ka correlates positively with temperature, which further confirms that the HSA–PCDs adsorption is initiated by an electrostatic interaction (dynamic quenching). In addition, the value of the thermodynamic parameters in the protein reaction can be used to identify primary forces that contribute to protein and ligand stability. The thermodynamic changes of the reaction system are generally judged according to ΔH0, ΔS0, and ΔG0. According to the van’t Hoff equation and the Gibbs–Helmholtz equation, the ΔG0 values at three temperatures (298, 304, and 310 K) are all negative. Negative values indicate that the incorporation between HSA and PCDs is spontaneous, while a negative value of ΔH0 and a positive value of ΔS0 also indicates that the reaction is spontaneous. When ΔH0 is less than zero, the physical adsorption process between HSA and PCDs will release heat to the surrounding environment. The reason why ΔS0 is greater than zero is that the entropy of the surrounding environment increases after the endothermic reaction, and the increase of environmental entropy exceeds the decrease of the entropy of the HSA–PCDs system. Therefore, the entropy of the system plus the entropy of the environment is still greater than zero, fully in line with the second law of thermodynamics.
Significant parameters obtained from the modified Stern–Volmer formula at different temperatures.

Demonstration of biolabelling applications
Due to the fluorescence properties and biocompatibility of PCDs, they can serve as be good substitutes for traditional quantum dots for bio-medical applications such as in labeling, imaging, sensing and even photothermal-based therapy. Here we selected bean sprouts as a typical and facile biological sample model in order to demonstrate the labeling and imaging feasibility of the as-prepared PCDs. It is clear from Figure 5 that bean sprouts show bright blue fluorescence under UV illumination, indicating the homogeneous labeling of PCDs. This demonstration set a successful application example for our lab-made PCDs, which hold great potential for other biomedical uses.
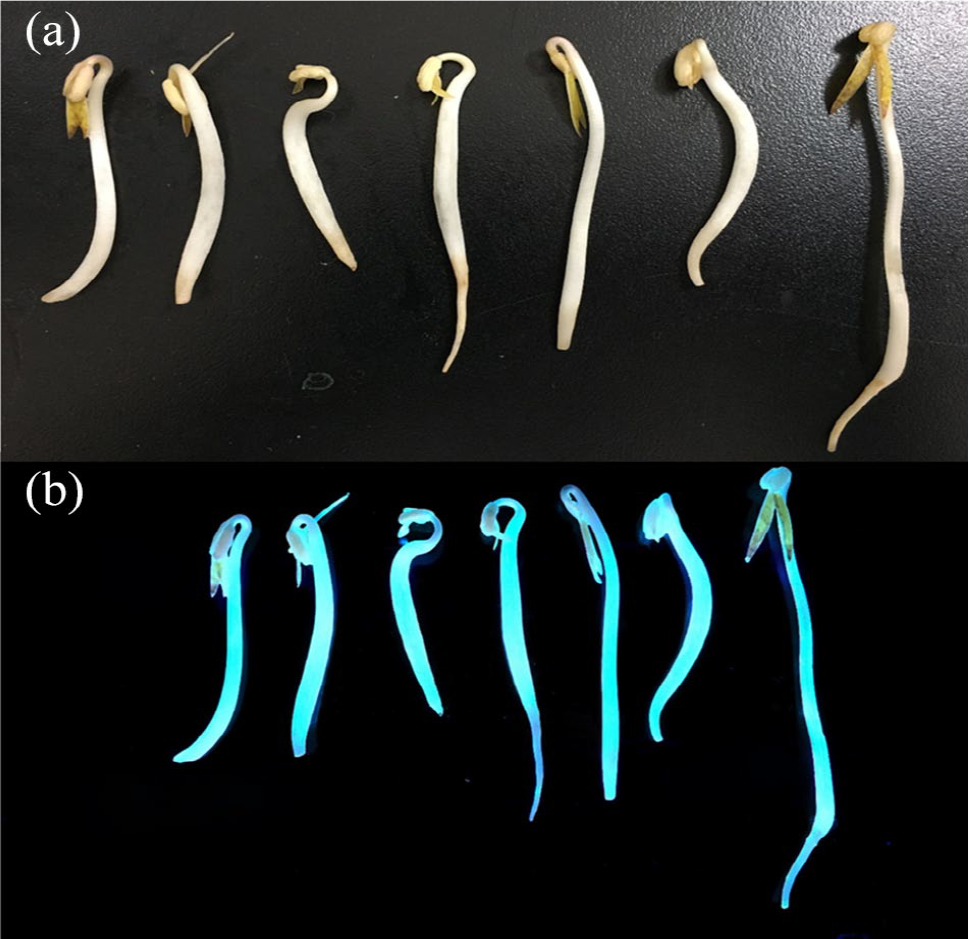
Demonstration of PCDs for labeling bean sprouts: (a) a photo of bean sprouts labeled with PCDs under daylight and (b) a photo of PCD-labeled bean sprouts taken under UV illumination.
Conclusion and outlook
In this work, we have reported a green, low-cost, and high-yielding method for preparation of PCDs with a quantum yield of 53.4% by a microwave-assisted one-step approach using citric acid and ethylenediamine as precursors. A comprehensive characterization of the as-prepared PCDs has been achieved by employing spectroscopy and DLS. We have thus obtained blue–fluorescent PCDs with an average hydrodynamic diameter of 5.17 ± 0.15 nm, which can be applied as a fluorescent ink due to the low cost and good biocompatibility. We have outlined the mechanism of HSA corona formation on PCDs using the FRET-based quenching method. The binding constants and binding sites have been successfully evaluated, and electrostatic interactions played a dominant role in the corona formation. In addition, PCDs have been successfully demonstrated for biolabelling, and we envision that the HSA–PCDs corona structure may serve as a type of drug carrier for potential delivery systems.
Experimental
Chemicals and materials
Citric acid, ethylenediamine, HSA, and quinine sulfate (purity 98%, suitable for fluorescence quantum yield measurements) were purchased from Sigma-Aldrich (New York, USA). Tris-HCl (analytical reagent grade) was purchased from Sinopharm Chemical Reagent Co. Ltd. (Shanghai, China). All chemicals and reagents were used directly without further purification. Bean sprouts were purchased from a local supermarket in city.
PCD synthesis
Citric acid (1.0 g) and ethylenediamine (384 μL) were added to Milli-Q water (10 mL) to prepare a colorless reaction solution, which was then heated in a microwave oven (750 W) for 4–5 min, during which time the solution changed from colorless to brown indicating the formation of PCDs. 33 The aqueous solution was subjected to dialysis against Milli-Q water with a cellulose ester membrane bag (molecular-weight cutoff: 1 kDa) to remove any unreacted chemicals and small molecules, and then the solution was subjected to centrifugation at 10,000 r min−1 for 10 min. The obtained pellet was dried under vacuum for 48 h and redispersed in Milli-Q water to a concentration of 0.1 mg mL−1.
To test the synthesis conditions, two laboratory microwave ovens (1. MCR-3, Tianjin Yuhua Instrument Co., Ltd., China; 2. MCR-3, Shanghai Ledun Instrument Co., Ltd., China) were compared with one domestic microwave oven (WD750ASL23, Guangdong, China). Using the same electric power (all set to 750 W) and heating for 4-5 min, no significant difference between the resulting solutions (from both spectrometer and DLS characterizations) between the laboratory and domestic microwave ovens was observed. However, both the power and heating time can produce huge differences for the synthesis of PCDs, and the power of 750 W and heating time of 4-5 min were the optimized conditions for the current synthesis.
Dynamic light scattering
The hydrodynamic diameter (Dh) and zeta potential of PCDs were measured using commercial DLS equipment (Malvern Zetasizer Nano-ZS90; Malvern Instruments Ltd., Worcestershire, UK) equipped with quartz or disposable cuvettes (DTS0012, minimum sample volume is 1.0 mL) and fitted with a 633-nm He-Ne laser beam. Measurements were carried out at 25°C and at a 90° scattering angle. The Dh and ζ-potential were obtained by cumulative analysis (Zetasizer software Nano-ZS90; Malvern Instruments Ltd.).
Spectroscopy
The absorbance and the PL spectra were recorded on a UV-Vis spectrometer (U-2900; Hitachi, Tokyo, Japan) and a fluorescence spectrometer (Fluorolog®-MAX 4; Horiba, Kyoto, Japan), respectively. Quartz cuvettes (light path is 1.0 cm) were used for all spectral measurements. For it fluorescence measurements, both the excitation and emission slits were set at up to 5 nm.
Quantum yield
The quantum yield

where
Fluorescence quenching
This method refers to previous publications with minor modifications.27–29,34–35 In brief, the excitation was fixed at 280 nm and the slits for both excitation and emission were set at 5.0 nm in all PL measurements. The temperature was controlled by a water bath and the samples were incubated for at least 30 min. For all the calculations, all the fluorescence intensities were corrected using the following equation (to remove the inner filter effect, equation (2))

Both the Stern–Volmer equation (equation (3)) and its modified formula (equation (4)) and the Hill model (equation (5)) were employed to calculate the binding constants and sites

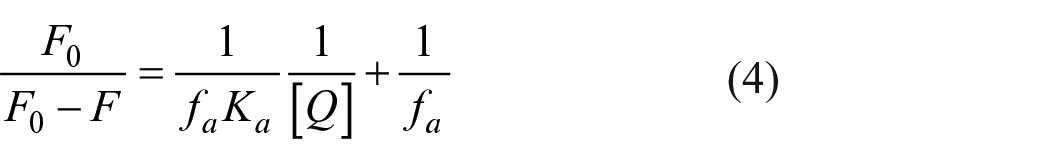
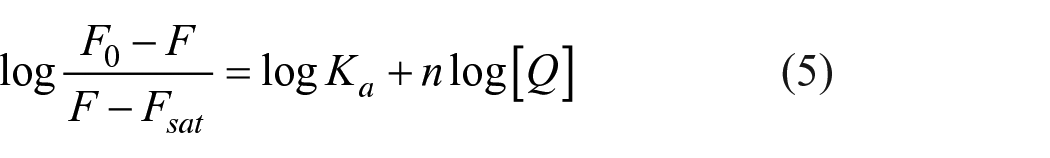
where Fc and Fm are the corrected and measured PL intensity, and F0, F, and Fsat are the PL intensities in the absence, presence, and saturated state of quencher (PCDs), respectively. Furthermore, Aex and Aem are the absorption values of the system at the excitation and emission wavelengths, kq is the quenching constant, τ0 is the lifetime of the fluorophore in the absence of quencher, and [Q] is the concentration of the quencher. fa is the fraction of accessible fluorophores, and Ka is the effective quenching constant for the accessible fluorophores. The binding sites can be obtained by n.
Supplemental Material
Supporting_information.docx – Supplemental material for A study on human serum albumin corona formed on photoluminescent carbon dots
Supplemental material, Supporting_information.docx for A study on human serum albumin corona formed on photoluminescent carbon dots by Peng Wang, Ming Yuan, Na Li and Feng Zhang in Journal of Chemical Research
Footnotes
Declaration of conflicting interests
The author(s) declared no potential conflicts of interest with respect to the research, authorship, and/or publication of this article.
Funding
The author(s) disclosed receipt of the following financial support for the research, authorship, and/or publication of this article: This work was supported by the following programs and foundations: the Natural Science Foundation of Inner Mongolia Autonomous Region (grant no. 2017MS(LH)0816), the University Scientific Research Project of Inner Mongolia Autonomous Region (grant no. NJZC17267), the Program Funded by University for Fostering Distinguished Young Scholars, the National Natural Science Foundation of China (grant nos 51763019, U1832125), the Grassland Talents Program of Inner Mongolia Autonomous Region, the Distinguished Young Scholars Foundation of Inner Mongolia Autonomous Region, and the Young Leading Talents of Science and Technology Program of Inner Mongolia Autonomous Region.
Supplemental material
Supplemental material for this article is available online.
References
Supplementary Material
Please find the following supplemental material available below.
For Open Access articles published under a Creative Commons License, all supplemental material carries the same license as the article it is associated with.
For non-Open Access articles published, all supplemental material carries a non-exclusive license, and permission requests for re-use of supplemental material or any part of supplemental material shall be sent directly to the copyright owner as specified in the copyright notice associated with the article.