
Abstract
Background:
Cerebral edema is a secondary complication of acute ischemic stroke, but its time course and imaging markers are not fully understood. Recently, net water uptake (NWU) has been proposed as a novel marker of edema.
Aims:
Studying the RHAPSODY trial cohort, we sought to characterize the time course of edema and test the hypothesis that NWU provides distinct information when added to traditional markers of cerebral edema after stroke by examining its association with other markers.
Methods:
A total of 65 patients had measurable supratentorial ischemic lesions. Patients underwent head computed tomography (CT), brain magnetic resonance imaging (MRI) scans, or both at the baseline visit and after 2, 7, 30, and 90 days following enrollment. CT and MRI scans were used to measure four imaging markers of edema: midline shift (MLS), hemisphere volume ratio (HVR), cerebrospinal fluid (CSF) volume, and NWU using semi-quantitative threshold analysis. Trajectories of the markers were summarized, as available. Correlations of the markers of edema were computed and the markers compared by clinical outcome. Regression models were used to examine the effect of 3K3A-activated protein C (APC) treatment.
Results:
Two measures of mass effect, MLS and HVR, could be measured on all imaging modalities, and had values available across all time points. Accordingly, mass effect reached a maximum level by day 7, normalized by day 30, and then reversed by day 90 for both measures. In the first 2 days after stroke, the change in CSF volume was associated with MLS (ρ = –0.57, p = 0.0001) and HVR (ρ = –0.66, p < 0.0001). In contrast, the change in NWU was not associated with the other imaging markers (all p ⩾ 0.49). While being directionally consistent, we did not observe a difference in the edema markers by clinical outcome. In addition, baseline stroke volume was associated with all markers (MLS (p < 0.001), HVR (p < 0.001), change in CSF volume (p = 0.003)) with the exception of NWU (p = 0.5). Exploratory analysis did not reveal a difference in cerebral edema markers by treatment arm.
Conclusions:
Existing cerebral edema imaging markers potentially describe two distinct processes, including lesional water concentration (i.e. NWU) and mass effect (MLS, HVR, and CSF volume). These two types of imaging markers may represent distinct aspects of cerebral edema, which could be useful for future trials targeting this process.
Introduction
Brain edema is a secondary complication of acute ischemic stroke that is associated with an increased risk of morbidity and mortality.1,2 Cerebral edema may worsen outcome by causing mass effect that impairs microvascular perfusion through mechanical compression. Mass effect is proportional to stroke volume and the degree of water accumulation within the stroke lesion. Consequently, several different imaging measures have been developed to measure mass effect more sensitively, or parse the contributing mechanisms that are independent of initial stroke volume.3–8 These distinctions are particularly relevant to proof-of-concept phase 2 clinical studies that target hemorrhagic transformation, brain edema, or both.
The most commonly utilized imaging marker of mass effect is midline shift (MLS), 9 which is easily measured and is associated with poor neurological recovery10,11 and early mortality. 12 However, MLS may be less sensitive to edema associated with smaller volume infarction 13 and results from any potential causes of mass effect. Selective intermediate imaging endpoints could therefore help inform the interpretation of the mechanism of action of investigational therapies. 5 Three of the more commonly employed techniques include cerebrospinal fluid (CSF) volumetric analysis, 4 hemisphere volume ratio (HVR) 13 , and net water uptake (NWU).6,7 Of these, NWU could provide insight into the accumulation of water in the stroke lesion, whereas HVR and CSF volumes reflect contributions to mass effect.
Aims
In this study, we sought to describe edema formation and resolution over time and test the hypothesis that NWU is associated with mass effect by utilizing serial neuroimaging obtained during a phase 2 clinical trial of acute ischemic stroke, the NeuroNEXT NN104 (RHAPSODY) trial (clinicaltrial.gov NCT02222714). The acquisition of serial, protocol-specified imaging facilitated the analysis of serial measurements of NWU, CSF volume, HVR, and MLS over time. Using this cohort, we describe the imaging markers over time, and evaluate the association of NWU with CSF volume, HVR, and MLS.
Methods
Patient cohort
This was a post hoc analysis of the RHAPSODY trial, a phase 2 trial investigating the safety and tolerability of four dose levels of a recombinant variant of human activated protein C (APC), 3K3A-APC, in moderate-to-severe acute ischemic stroke patients receiving tissue plasminogen activator (tPA), mechanical thrombectomy, or both. 14 Between January 2015 and April 2017, patients were enrolled from 22 participating sites. All enrolled patients or their surrogates provided informed consent following a centralized institutional review board and met previously published inclusion and exclusion criteria. 15 Randomization was completed as described in the original trial report. 14
Of the 110 participants originally enrolled in RHAPSODY, patients were excluded from this analysis if the stroke lesion could not be definitively located on the images (n = 23), the stroke volume was < 10 mL (n = 12), the stroke lesion was in the brainstem or was bilateral (n = 6), imaging was distorted with motion (n = 2), or the image showed evidence of parenchymal hematoma (PH; n = 2). The final study population (n = 65) included 37 participants who received study drug at any dose level and 28 who received placebo. Among the 65 participants, a total of 258 separate imaging studies were analyzed. During hospitalization, clinical and demographic data were collected, including admission National Institutes of Health Stroke Scale (NIHSS), admission modified Rankin Scale (mRS) score, and recanalization therapy. Information regarding the type of recanalization therapy received (IV tPA and/or mechanical thrombectomy) was collected when determining eligibility. Follow-up calls were conducted with patients or their surrogates and 90day mRS scores were determined.
Imaging analysis
Stroke lesion volumes3,16,17 MLS,5,13 NWU, 7 HVR, 13 and CSF volume 18 were calculated based on previously published methods. Detailed descriptions of these methods can be found in the Supplemental Methods. Case examples of these imaging measures are depicted in Figure 1(a) to (c) (NWU, HVR, CSF volume, respectively). All imaging analysis was conducted using AnalyzePro (AnalyzeDirect). For some analyses, MLS was dichotomized as a presence or absence of shift.
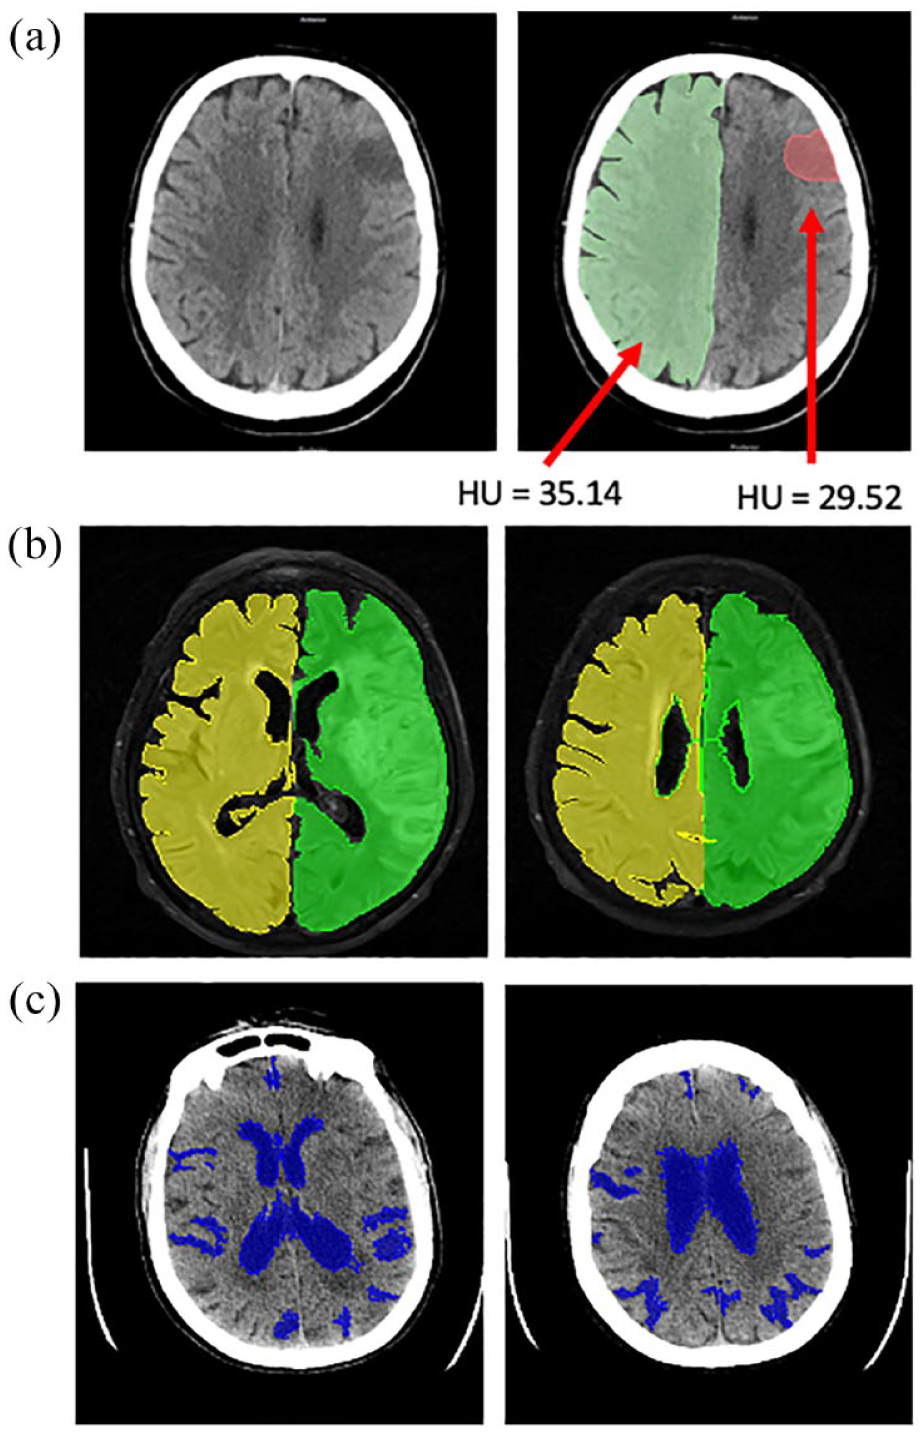
Case examples for the measurement of imaging markers of edema. (a) To measure NWU, lesional regions of interest (ROIs) were measured on the CT scans. The ratio of Hounsfield units relative to a mirrored ROI on the contralateral hemisphere was calculated according to a previously published approach. In this example,
Statistical analysis
Spearman correlations and multivariable regression models were used to investigate the relationship of the change in NWU between day 2 and baseline (ΔNWU) on day 2 measurements of the other imaging markers. Markers of edema were compared by poor clinical outcome, defined as the 90-day mRS ⩾ 2, using a Wilcoxon rank sum or Student’s t-test, as appropriate. The effect of 3K3A-APC on the change in CSF volume between day 2 and baseline (ΔCSF volume) and ΔNWU was assessed using linear regression, and on HVR and MLS over time using longitudinal modeling approaches. Analyses used a significance level of 0.05 unless noted otherwise. Due to the exploratory nature of this study, there were no adjustments for multiple comparisons. Analyses were conducted using SAS software (version 9.4, SAS Institute) or R (version 4.1.0 or newer). A detailed description of statistical analyses is found in the Supplemental Methods.
Results
Patient characteristics
Table 1 shows the baseline characteristics of the final study population (n = 65), which were similar between the placebo and study drug groups (p > 0.05 for all). The overall cohort had a mean age (± standard deviation, SD) of 66 ± 14 years and 57% (n = 37) were female. A total of 20 patients (30.8%) had a history of diabetes mellitus and 50 patients (76.9%) had a history of hypertension. Prior to enrollment, the study population had a median NIHSS of 14 (interquartile range (IQR): 9–19) and a median blood glucose level of 135.5 mg/dL (IQR: 111.8–177.5). Characteristics of patients included in the study were similar to those excluded, aside from baseline NIHSS (see Supplemental Table 1). This NIHSS difference reflects the exclusion of patients with no observable lesions from the study population.
Baseline patient characteristics.
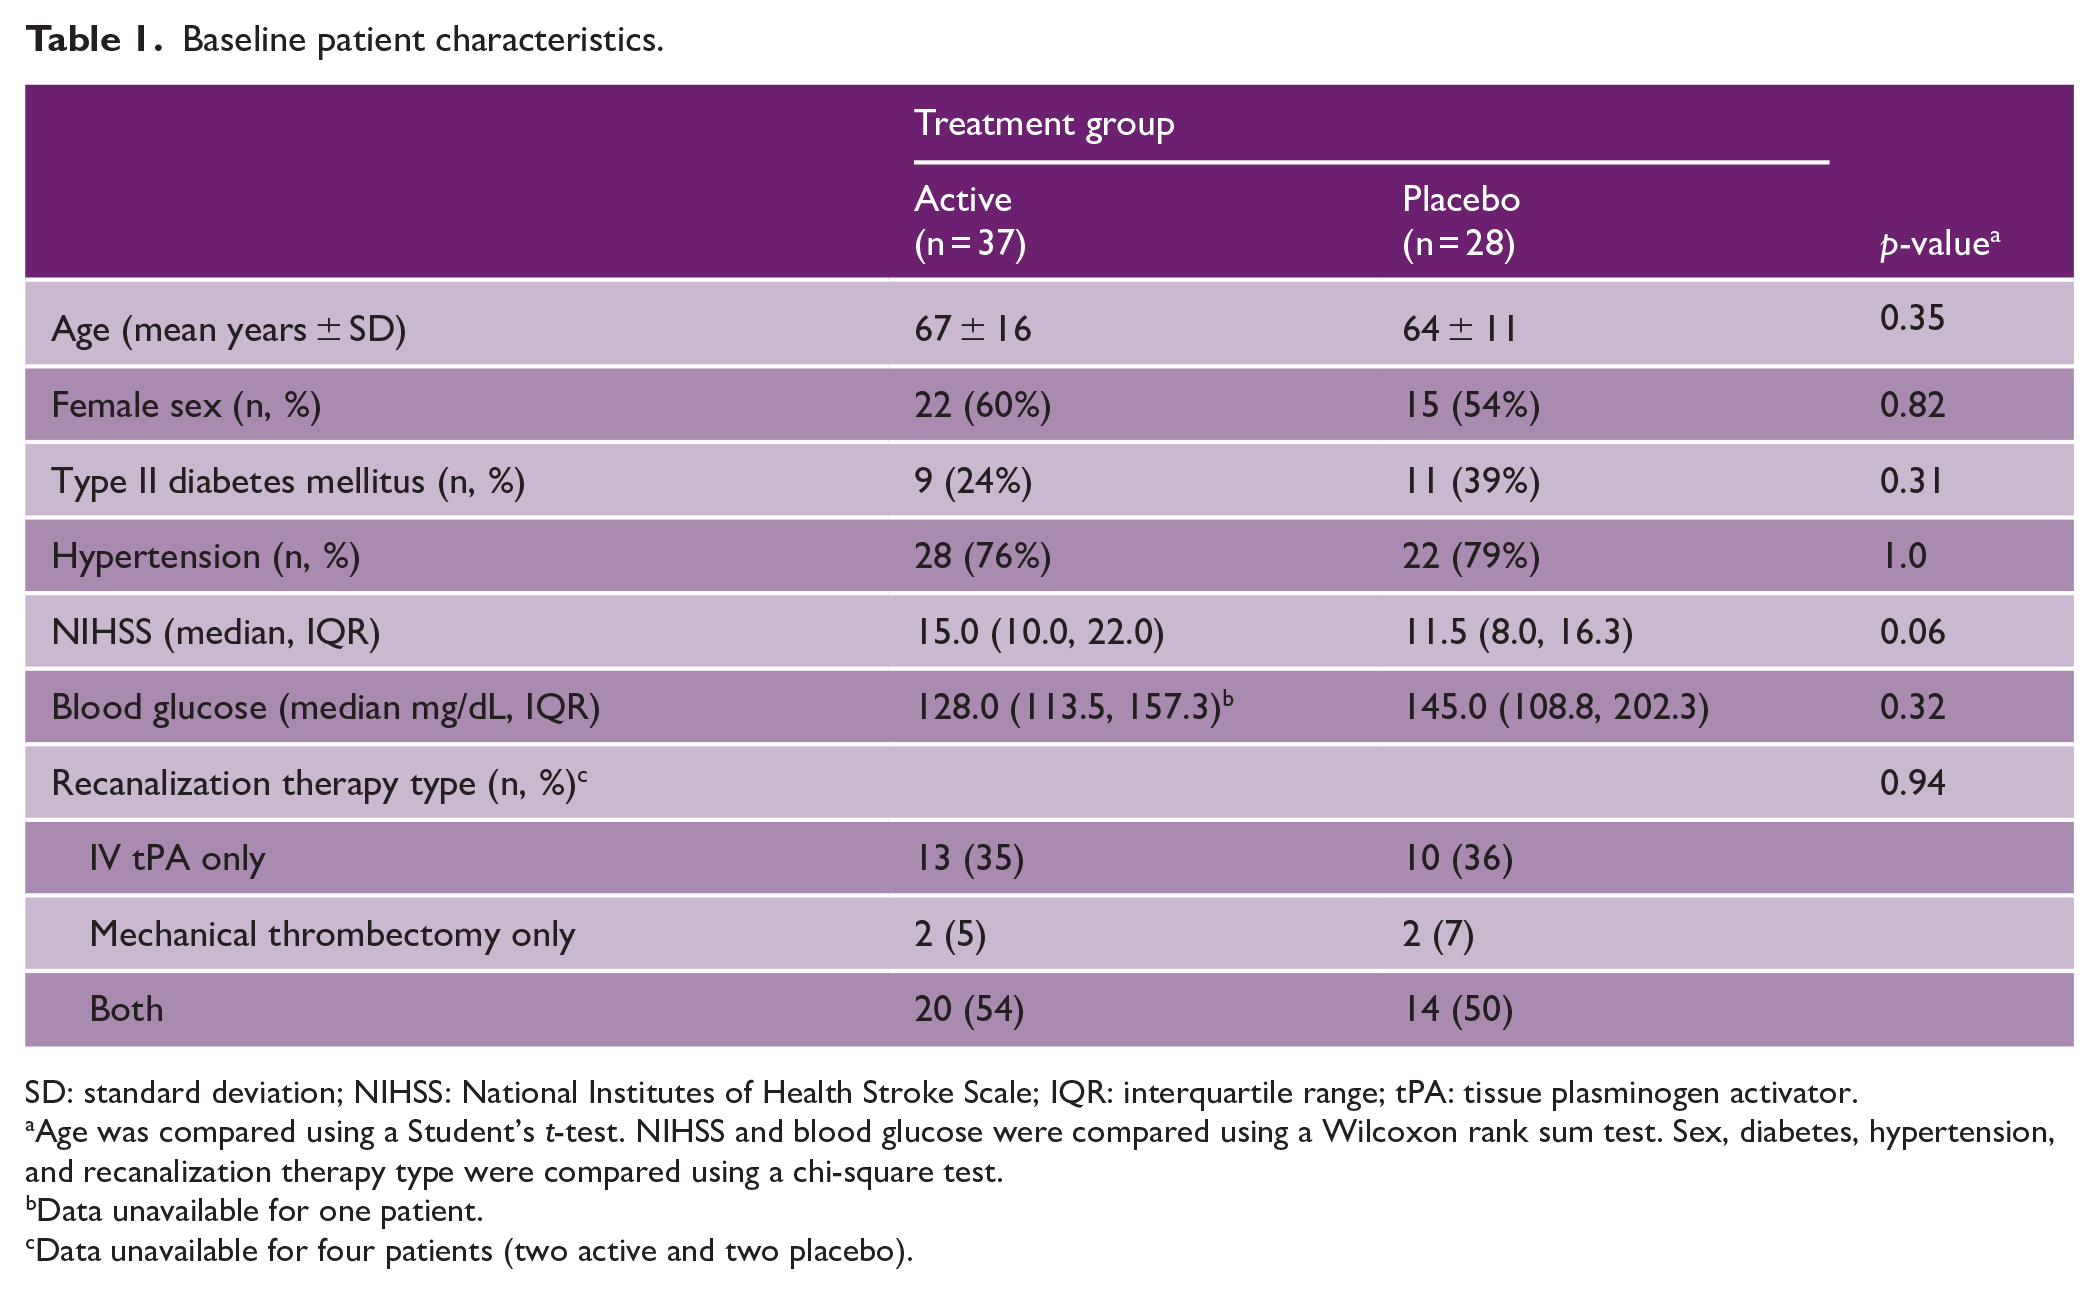
SD: standard deviation; NIHSS: National Institutes of Health Stroke Scale; IQR: interquartile range; tPA: tissue plasminogen activator.
Age was compared using a Student’s t-test. NIHSS and blood glucose were compared using a Wilcoxon rank sum test. Sex, diabetes, hypertension, and recanalization therapy type were compared using a chi-square test.
Data unavailable for one patient.
Data unavailable for four patients (two active and two placebo).
Edema formation and resolution over time
The time course of edema is visualized in Figure 2. We first examined the two imaging markers measured on CT scans in the first 2 days after stroke, NWU and CSF volume. Patients showed an increase in NWU from 9% ± 9% (mean ± SD) at the baseline visit to 25% ± 9% at the day 2 visit (see Figure 2(a)). CSF volume decreased from 95.6 ± 48.2 mL at the baseline visit to 69.7 ± 40.7 mL at the day 2 visit (see Figure 2(a)).
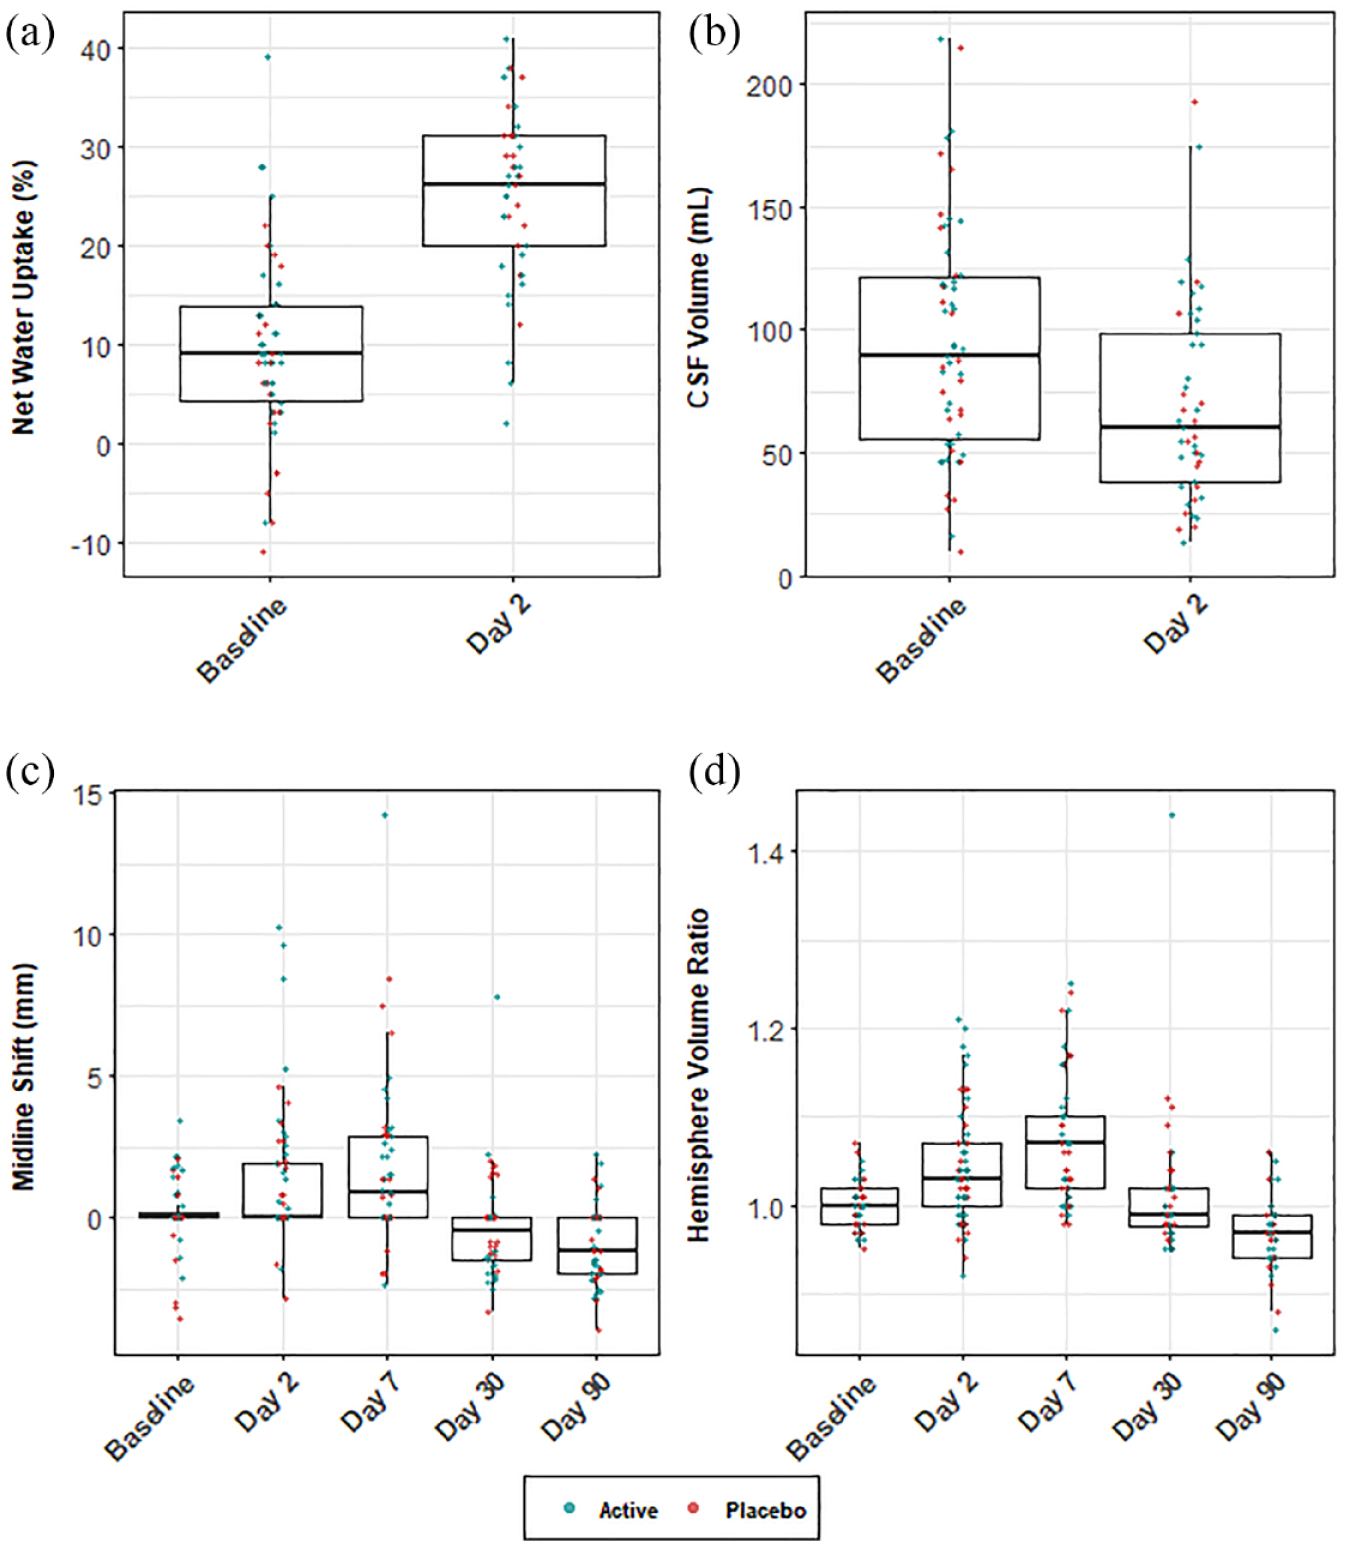
Edema formation and resolution over time by treatment group. (a) NWU increases from the baseline to day 2 scan, representing an increase in water content. (b) CSF volume decreases over the same two time points. (c) MLS increases over the first 7 days before decreasing by day 90. This pattern occurs as the ischemic hemisphere swells, followed by a period of atrophy and hemisphere shrinkage at later time points. (d) Hemisphere volume ratio (HVR) shows a similar pattern to MLS, with an initial increase over the first 7 days followed by a decrease through day 90.
MLS and HVR, imaging markers associated with mass effect, were described over the entire course of the study. MLS increased from 0.12 ± 1.2 mm (mean ± SD) at baseline to reach a mean ± SD of 1.6 ± 2.8 mm at day 7 scan. Subsequently, MLS began to decrease and by day 90, patients had a mean ± SD of −1.0 ± 1.4 mm (see Figure 2(c)). A similar pattern was seen when using HVR as a marker of mass effect. Beginning at a ratio of 1.00 ± 0.03 at the baseline visit, HVR increased to 1.07 ± 0.07 by day 7, and then decreased to 0.97 ± 0.04 at day 90 time point (Figure 2(d)). This pattern of edema formation and subsequent resolution likely reflects acute swelling of the injured hemisphere over the first week, followed by atrophy of damaged tissue and resulting hemisphere shrinkage by day 90.
NWU differs from markers of mass effect
Prior studies have shown that NWU is a direct measure of water content in the brain as opposed to other measures that reflect mass effect.5,6 We, therefore, assessed the Spearman correlation between ΔNWU and each of the other imaging markers of mass effect, MLS, HVR, and CSF volume at day 2. We found no evidence of a correlation between ΔNWU and MLS (ρ = –0.03, p = 0.86), HVR (ρ = 0.05, p = 0.74), or CSF volume (ρ = 0.12, p = 0.49). We also assessed Spearman correlations between the markers of mass effect. There was evidence of correlations between day 2 MLS and ΔCSF volume (ρ = –0.57, p = 0.0001), day 2 HVR and ΔCSF volume (ρ = –0.66, p < 0.0001), and day 2 MLS and HVR (ρ = 0.52, p < 0.0001). Corresponding results from multivariable regression models are included in the Supplemental Results. Prior studies have shown that thrombectomy treatment may alter ΔNWU. In agreement with the prior study, ΔNWU differed among those treated medically (mean ± SD ΔNWU = 20.5% ± 8.1%) compared to those treated with thrombectomy (mean ± SD ΔNWU = 9.6% ± 16.4%; p = 0.02).
Cerebral edema, clinical outcome, and 3K3A-APC
We explored the association of edema with poor clinical outcome (90-day mRS ⩾ 2). Differences in markers by clinical outcome at day 2 (MLS, HVR) or in the change between baseline and Day 2 (ΔNWU and ΔCSF Volume) were not statistically significant in this cohort (see Table 2). The trend of edema formation and resolution over time by clinical outcome is shown in Supplemental Figure 1. We found no evidence of an effect of treatment group on cerebral edema (see Tables 3 and 4; Supplemental Tables 2(a) and (b)). Detailed descriptions of these results are provided in Supplemental Results.
Edema markers by clinical outcome.
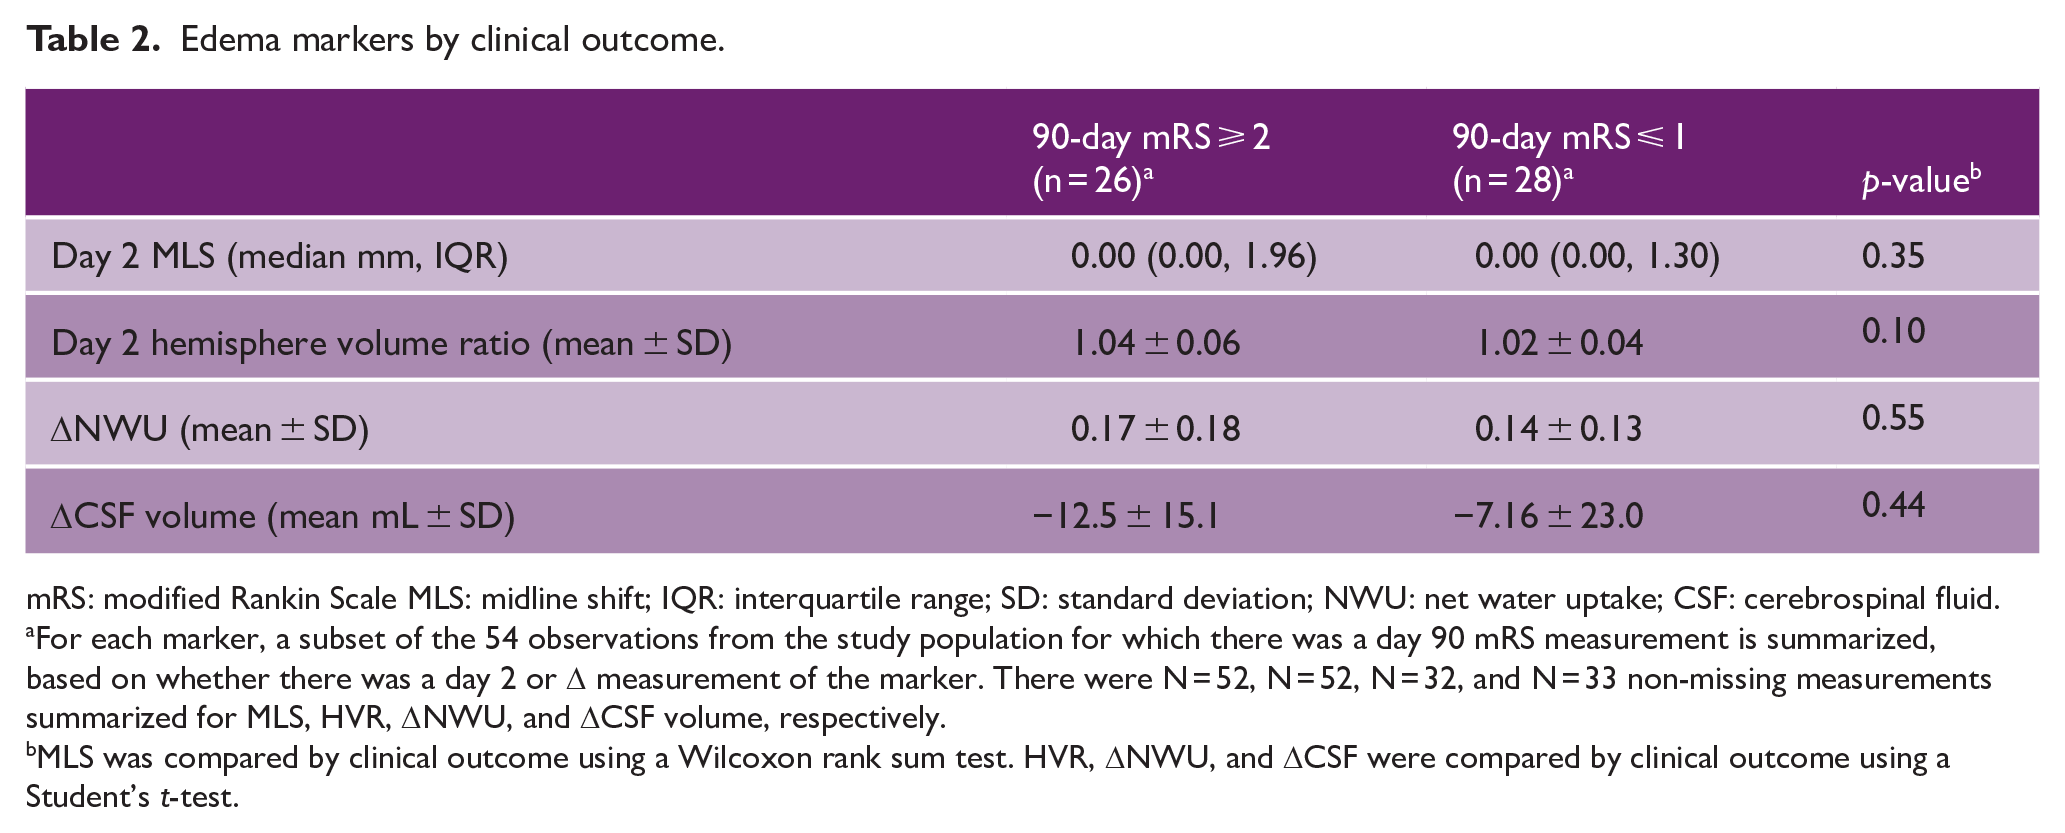
mRS: modified Rankin Scale MLS: midline shift; IQR: interquartile range; SD: standard deviation; NWU: net water uptake; CSF: cerebrospinal fluid.
For each marker, a subset of the 54 observations from the study population for which there was a day 90 mRS measurement is summarized, based on whether there was a day 2 or Δ measurement of the marker. There were N = 52, N = 52, N = 32, and N = 33 non-missing measurements summarized for MLS, HVR, ΔNWU, and ΔCSF volume, respectively.
MLS was compared by clinical outcome using a Wilcoxon rank sum test. HVR, ΔNWU, and ΔCSF were compared by clinical outcome using a Student’s t-test.
Multivariable associations with ΔNWU. a
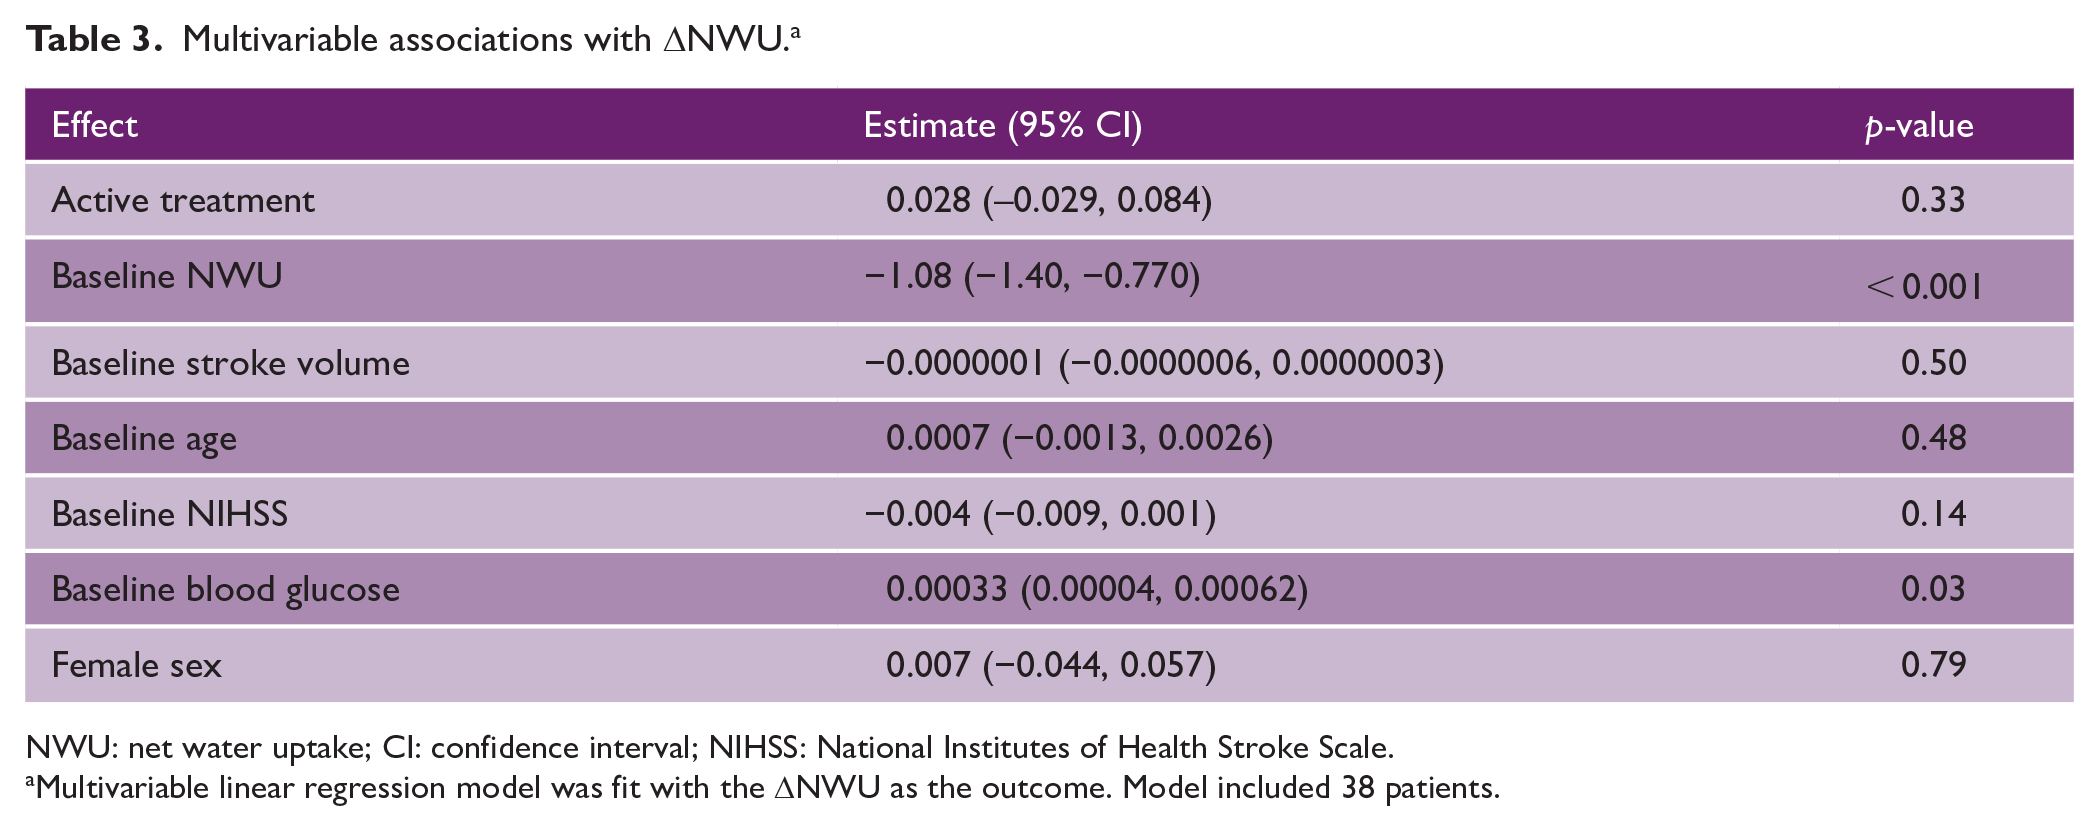
NWU: net water uptake; CI: confidence interval; NIHSS: National Institutes of Health Stroke Scale.
Multivariable linear regression model was fit with the ΔNWU as the outcome. Model included 38 patients.
Multivariable associations with MLS. a
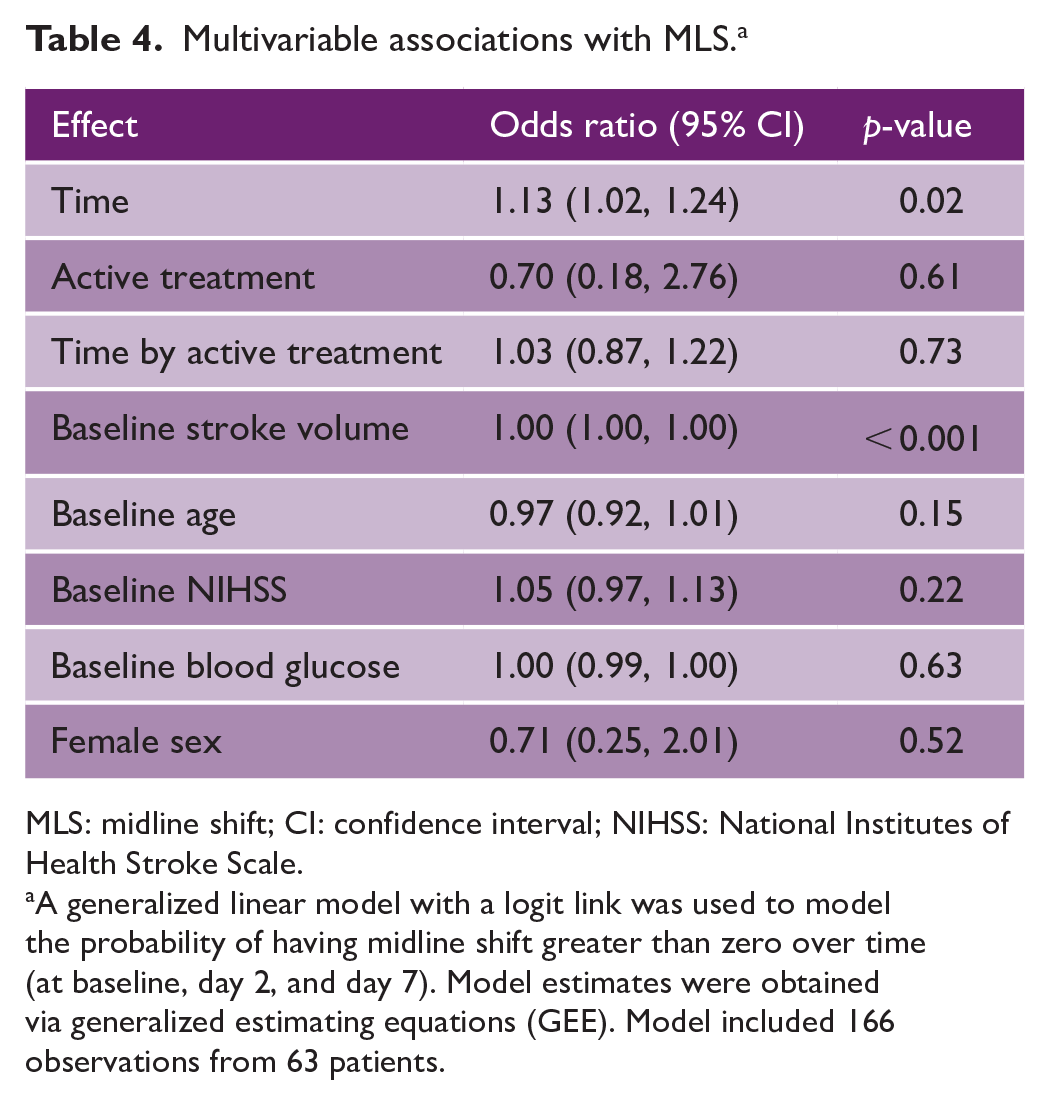
MLS: midline shift; CI: confidence interval; NIHSS: National Institutes of Health Stroke Scale.
A generalized linear model with a logit link was used to model the probability of having midline shift greater than zero over time (at baseline, day 2, and day 7). Model estimates were obtained via generalized estimating equations (GEE). Model included 166 observations from 63 patients.
Discussion
One of the principal findings of this study was the description of edema formation and resolution over time. While prior studies have investigated cerebral edema following ischemic stroke, these studies were limited to imaging acquired during the acute phase (i.e. 0–7 days).3,13,19,20 Serial, protocol-specified imaging obtained over 3 months as part of the RHAPSODY trial enabled this study to describe the time course of cerebral edema through sub-acute stroke recovery. Consistent with prior studies,3,5,13,19 we showed that edema in this study cohort increases in the acute phase and peaks near day 7. Acute edema formation impacted all four imaging markers. We further showed the sub-acute resolution of edema using MLS and HVR measurements through day 90. Following a peak near day 7, MLS and HVR demonstrated resolution by day 30 and a negative value by day 90, on average. If the acute formation of edema reflects swelling of the injured hemisphere, this resolution of edema on later scans probably represents atrophy of damaged tissue and the resulting shrinkage of the ischemic hemisphere.
In this study, we also evaluated the function of different imaging markers of cerebral edema and explored the possible utility of NWU as being distinct from measures of mass effect. In a cohort with a range of stroke volumes, there was no evidence of an association between ΔNWU and each of the other three imaging markers, which were in turn strongly associated with each other. The fact that ΔNWU was not correlated with MLS, HVR, and CSF volume could be due to two possible interpretations. First, ΔNWU may not be a reliable imaging marker of edema. For example, one limitation of ΔNWU is the confounding effect of thrombectomy on post-procedure measurement, which may be due to contrast extravasation altering the CT density in these patients. 21 In support of this conclusion, we found differences in ΔNWU values in those subjects treated with thrombectomy compared to medical management. Future studies are needed to determine whether these changes reflect patient selection, or are a direct effect of thrombectomy treatment and contrast extravasation. These findings suggest a nuanced role for NWU, or that confounding factors may prevent its use as a marker of edema.
An alternative interpretation is that NWU may reflect a distinct step in the formation of cerebral edema that is different from markers of mass effect. Following ischemic stroke, cerebral edema accumulates in a stepwise fashion: dysfunction of blood–brain barrier permeability first leads to excess water entering the brain, which then leads to mass effect.1,5 Consistent with our previously published findings, NWU may reflect the initial water accumulation, while the remaining three imaging markers (MLS, HVR, and ΔCSF) represent subsequent mass effect. This interpretation is supported by the finding that baseline stroke volume was associated with ΔCSF volume, MLS, and HVR, whereas it was not with ΔNWU. This would make ΔNWU a potentially useful ancillary imaging measure; specifically, ΔNWU could be important in clinical trial design to assess edema in heterogeneous stroke populations, or as an intermediate endpoint for therapeutics targeting edema.
We did not find any relationship between cerebral edema and treatment arm, or clinical outcome in this cohort, although the study was neither intended nor powered for this purpose. Given that our findings were directionally consistent with previously published correlations between edema and outcome, 3 we believe our analysis, though limited by a small sample size and lack of statistical power, provides a demonstration of the utility of these methods for use in larger trials. Another limitation of this study was the heterogeneity of stroke size in the cohort, which was challenging for those imaging markers dependent on baseline stroke volume. A final limitation is that our study population was higher in stroke severity than the original RHAPSODY cohort, as indicated by a statistically higher NIHSS among those included than excluded from the study. This is probably due to patients with more severe strokes being more likely to undergo the serial imaging that was included in this analysis.
In conclusion, we described the time course of cerebral edema during the first 90 days following ischemic stroke. We explored four imaging markers of edema, which highlighted that NWU may represent a distinct step in edema formation, but the interpretation of its use is nuanced. By deepening our understanding of cerebral edema and the various methods of measuring it, this study highlights the intermediate imaging endpoints that can be studied in trials that target secondary complications following acute ischemic stroke.
Supplemental Material
sj-docx-1-wso-10.1177_17474930231187268 – Supplemental material for Analysis of brain edema in RHAPSODY
Supplemental material, sj-docx-1-wso-10.1177_17474930231187268 for Analysis of brain edema in RHAPSODY by Riana L Schleicher, Pongpat Vorasayan, Megan E McCabe, Matthew B Bevers, Thomas P Davis, John H Griffin, Archana Hinduja, Ashutosh P Jadhav, Jin-Moo Lee, Robert N Sawyer Jr, Berislav V Zlokovic, Kevin N Sheth, Janel K Fedler, Patrick Lyden and W Taylor Kimberly in International Journal of Stroke
Footnotes
Author’s Note
Dr. Robert N Sawyer is also affiliated to Department of Neurology, University of Virginia School of Medicine, Charlottesville, VA, USA.
Declaration of conflicting interests
The author(s) declared the following potential conflicts of interest with respect to the research, authorship, and/or publication of this article: TPD and JHG are consultants to ZZ Biotech, LLC. BVZ is scientific founder of ZZ Biotech LLC and chairs its Scientific Advisory Board. WTK reports research grants from Biogen, consulting fees from NControl Therapeutics, and equity in Woolsey Pharmaceuticals. All other authors report no conflicts of interest.
Funding
The author(s) disclosed receipt of the following financial support for the research, authorship, and/or publication of this article: NeuroNEXT Infrastructure DCC Grant nos. 11246800; U01NS088312 (PL); R01HL142975 (JHG).
Data availability
Supplemental material
Supplemental material for this article is available online.
References
Supplementary Material
Please find the following supplemental material available below.
For Open Access articles published under a Creative Commons License, all supplemental material carries the same license as the article it is associated with.
For non-Open Access articles published, all supplemental material carries a non-exclusive license, and permission requests for re-use of supplemental material or any part of supplemental material shall be sent directly to the copyright owner as specified in the copyright notice associated with the article.