
Abstract
Background
Stroke patients are often inactive outside of structured therapy sessions – an enduring international challenge despite large scale organizational changes, national guidelines and performance targets. We examined whether experienced-based co-design (EBCD) – an improvement methodology – could address inactivity in stroke units.
Aims
To evaluate the feasibility and impact of patients, carers, and staff co-designing and implementing improvements to increase supervised and independent therapeutic patient activity in stroke units and to compare use of full and accelerated EBCD cycles.
Methods
Mixed-methods case comparison in four stroke units in England.
Results
Interviews were held with 156 patients, staff, and carers in total; ethnographic observations for 364 hours, behavioral mapping of 68 patients, and self-report surveys from 179 patients, pre- and post-implementation of EBCD improvement cycles.
Three priority areas emerged: (1) ‘Space’ (environment); (2) ‘Activity opportunities’ and (3) ‘Communication’. More than 40 improvements were co-designed and implemented to address these priorities across participating units. Post-implementation interview and ethnographic observational data confirmed use of new social spaces and increased activity opportunities. However, staff interactions remained largely task-driven with limited focus on enabling patient activity. Behavioral mapping indicated some increases in social, cognitive, and physical activity post-implementation, but was variable across sites. Survey responses rates were low at 12–38% and inconclusive.
Conclusion
It was feasible to implement EBCD in stroke units. This resulted in multiple improvements in stroke unit environments and increased activity opportunities but minimal change in recorded activity levels. There was no discernible difference in experience or outcome between full and accelerated EBCD; this methodology could be used across hospital stroke units to assist staff and other stakeholders to co-design and implement improvement plans.
Keywords
Introduction
Evidence that increasing the frequency and intensity of stroke rehabilitation can improve outcomes has driven numerous international guidelines and other major developments in hospital-based stroke care to achieve larger doses of therapy provided over seven days.1,2 However, outside of the scheduled therapy, inactivity is common and observational studies show stroke patients can be inactive and alone for more than 60% of waking hours, an issue largely unchanged for decades.3,4
There is now more understanding that rehabilitation intensity and outcomes cannot be improved by national targets alone – the stroke unit environment and how time is spent outside of scheduled face-to-face therapy are of critical consideration. Attempts to address inactivity have had mixed results. Dose-driven interventions including circuit class therapy and seven-day therapy have increased therapy provision but not patient activity outside of sessions. 5 Some progress has been made by applying environmental enrichment evidence from animal models. 6 Studies conducted in Australia have utilized controlled pre- and post-designs and evaluated the impact of more stimulating environments on inpatient activity.3,7 Behavior mapping showed an increase in activity levels across all domains and some changes were sustained at six months post intervention. However, the environmental enrichment was driven by the perspectives of researchers and professionals without patient and carer involvement and no specific quality improvement (QI) methodology. Improvement research is now recognized to be critical to ‘cumulate, synthesize and scale learning’ to expedite the translation of evidence into practice. 8 We believed that a robust QI methodology could address the intractable issue of patient inactivity.
Across healthcare internationally, there is increasing evidence of improvement methodologies which involve patients and staff working collaboratively to help co-design solutions and deliver healthcare services. 9 Experience-based co-design (EBCD) is an approach which enables staff and patients to co-design services in partnership. Experiences are gathered from patients and staff through in-depth interviewing, observations and group discussions, to identify key ‘touch points’ or emotionally positive or negative issues. An edited ‘trigger’ film is created from patient interviews to convey experiences of the service. Staff and patients are then brought together to explore the findings and to work in small groups to identify, co-design and implement activities that will improve the service or the care pathway.10,11 EBCD now has widespread use and led to improvements across multiple healthcare settings, including acute hospitals – but can lack detailed evaluation of feasibility and impact. 12 To date EBCD has not been used as an improvement method in stroke units to address inactivity.
Aims
The Collaborative Rehabilitation in Acute Stroke study (CREATE) aimed to (1) evaluate the feasibility of patients, carers and staff collaborating to develop and implement changes to increase supervised and independent therapeutic patient activity in acute stroke units; and (2) understand if improvements developed by two initial stroke units could be transferred to two further units and implemented within a shortened time frame using an accelerated form of EBCD (AEBCD).
Figure 1 provides an overview of the stages of EBCD and AEBCD, data collected, and cohorts included pre- and post-implementation of improvements. Full EBCD and AEBCD took nine and six months to complete, respectively.
Showing accelerated and full experienced-based co-design with pre- and post-implementation data collection.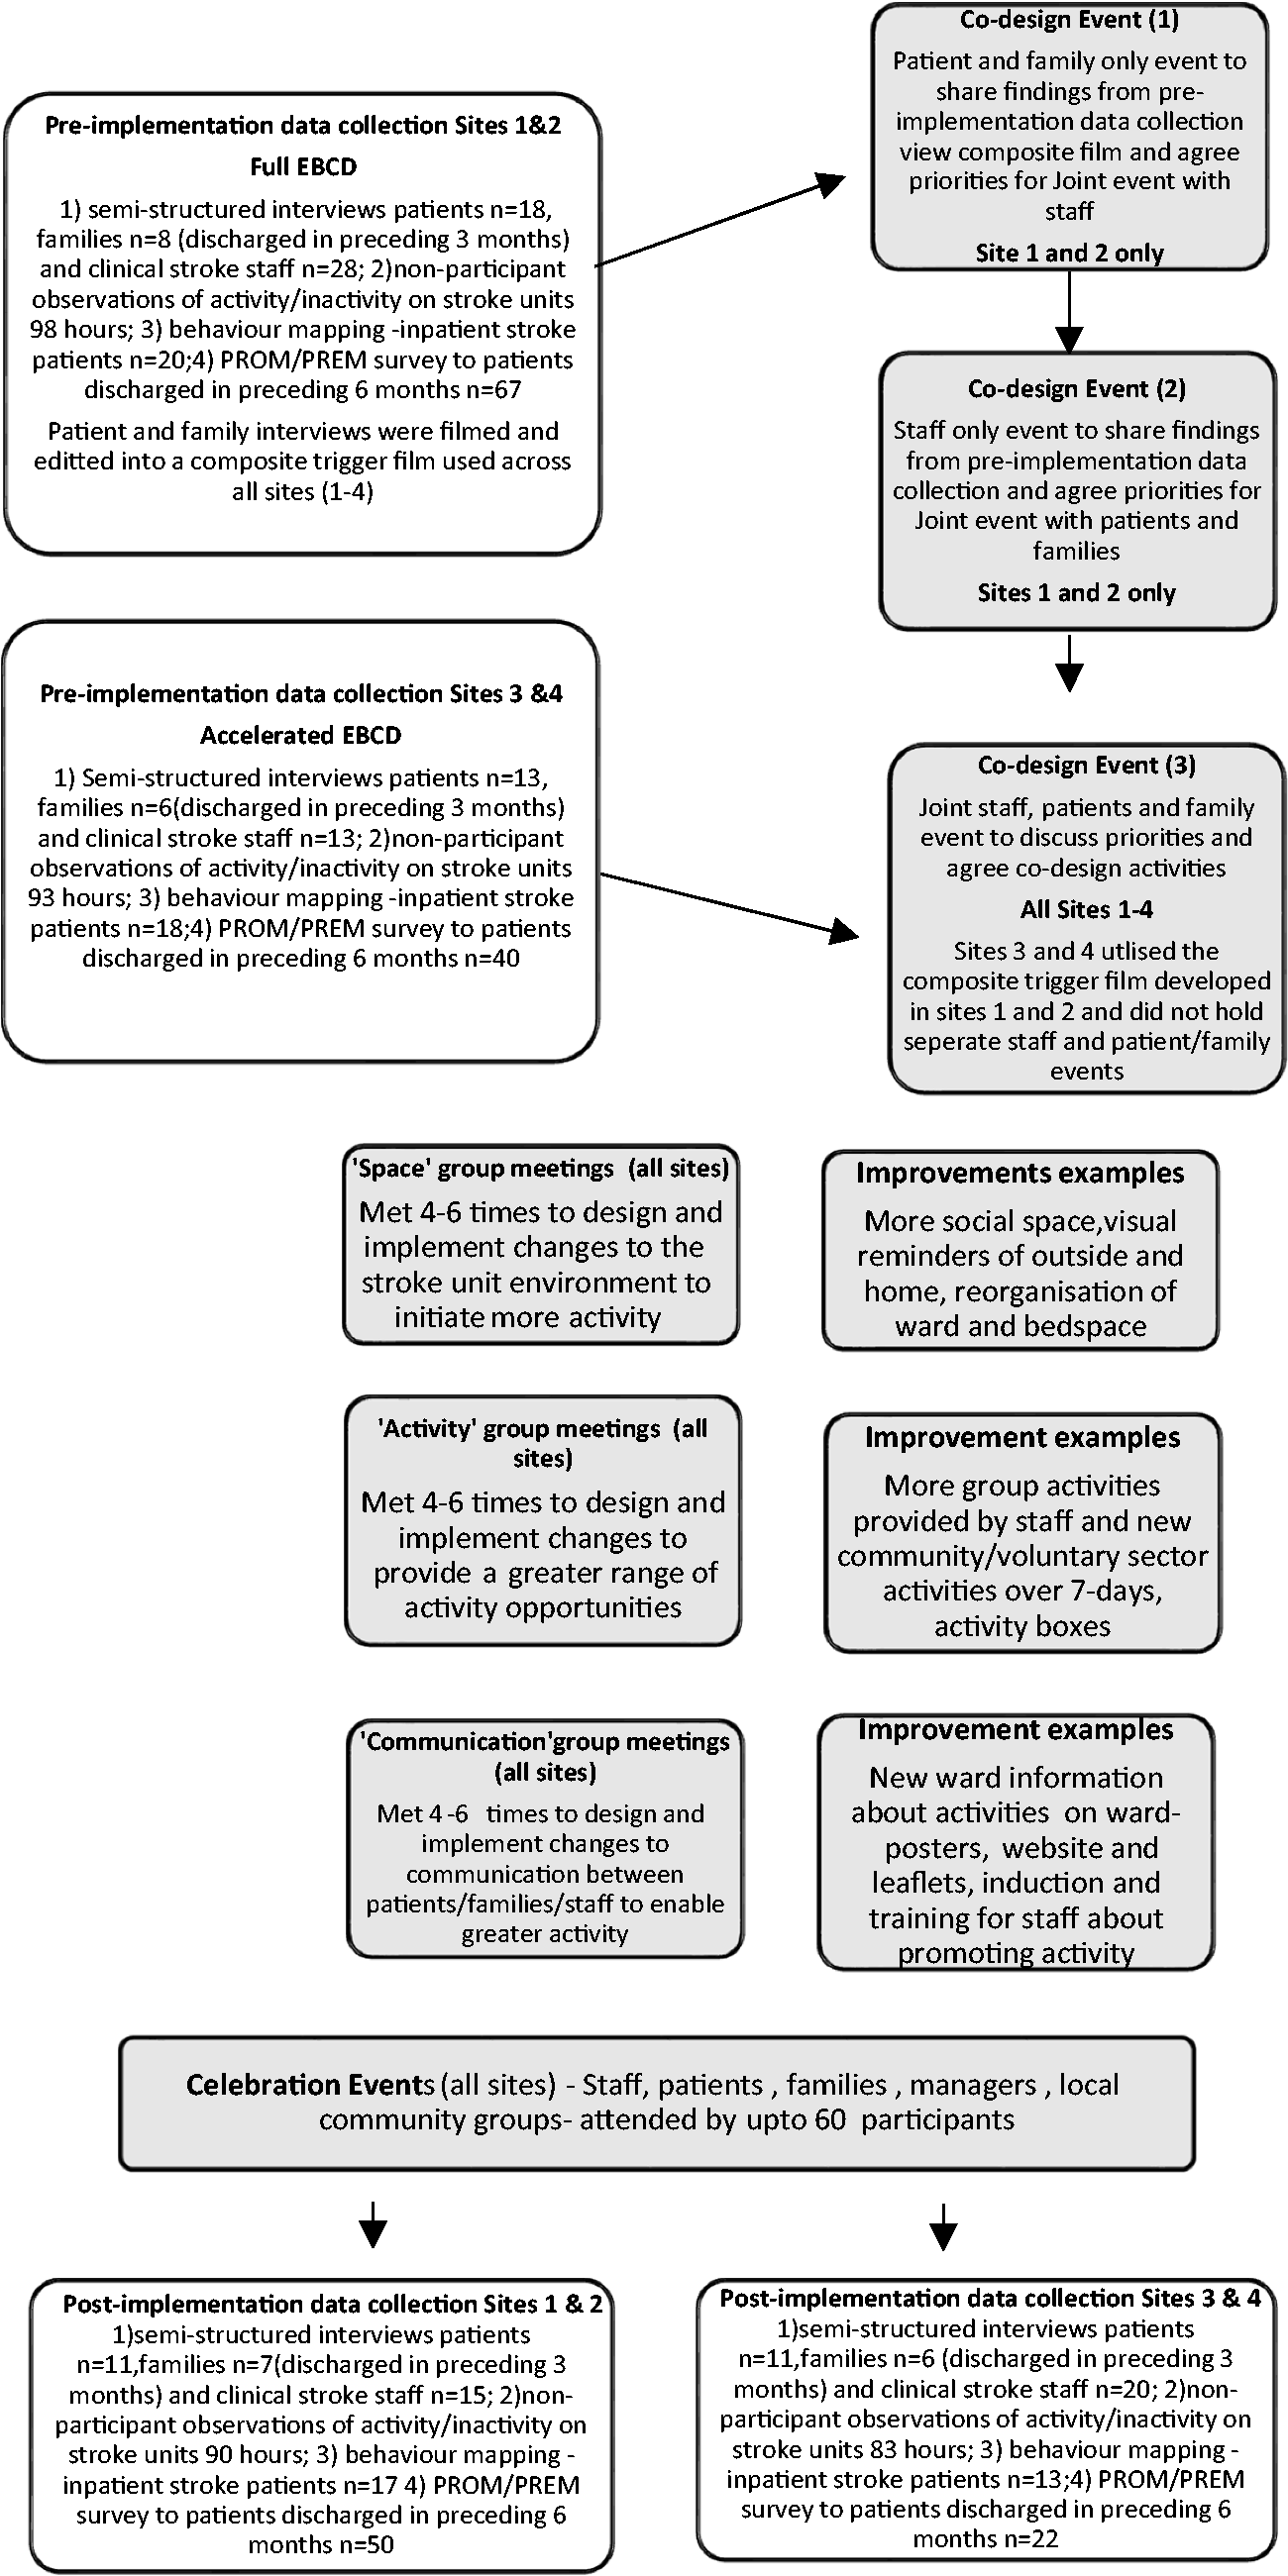
Methods
Design
A mixed-methods case study approach used to evaluate the feasibility and impact of patients, carers and staff co-designing and implement improvements to increase supervised and independent therapeutic patient activity in stroke units, and to compare use of full and accelerated EBCD cycles. A case study generates an in-depth, multi-faceted understanding of a complex issue in its real-life context. Comparisons pre- and post-implementation or between sites can be made but any inferences about causality are limited. 13
We carried out pre- and post-implementation interviews (staff, patients, and families), qualitative ethnographic observations, and behavioral mapping, and utilized patient-reported outcome and experience measures to explore each site as a separate ‘case’. Data were collected prior to and following each EBCD/AEBCD phase activity. An embedded process evaluation drawing on Normalization Process Theory (NPT) considered barriers and facilitators to the use of EBCD/AEBCD to develop and implement the improvements in the study settings, and is reported separately. 14
Improvement mechanism
EBCD or AEBCD was introduced into all four stroke units. Sites 1 and 2 (S1 and S2) employed all six stages of EBCD to co-design improvements to address stroke patients’ physical, social, and cognitive activity. In sites 3 and 4 (S3 and S4), they commenced with a joint staff, patient and family member event to immediately agree improvement priorities and initiate co-design work prompted by trigger films previously developed in S1 and S2. In all four sites, smaller co-design groups (n = 6–10) were attended by equal numbers of patients, families and stroke staff, jointly developing and implementing actions to address priority areas. Work to implement the agreed actions was shared based on existing skills, interest/opportunity and time available.
Setting
Four stroke units based in hospitals in London and Yorkshire. National (England) acute stroke organizational data, reported bi-annually, showed that all four units performed within the mid-range across key quality indicators and were subject to common staffing pressures and increasing caseload complexity.
Data Sources
Data analysis
Findings from the five data sources listed above informed the priority setting discussions by co-design groups in all four sites.
Interview data
All data, including filmed patient interviews, were transcribed verbatim. NVIVO 11 software was used to manage and organize, label, and build coding categories. Analytical themes were generated through several iterative stages and involved reading and re-reading codes generating illustrative quotes and building categories, reviewing and refining final themes. 21
Observational data
Field notes were recorded during each observation, written in full immediately afterwards and summary memos produced. Data were subject to the same thematic analysis used for interview data.
Behavioral mapping
All data were entered into an SPSS file and the frequency of occurrence of activity for each participant across each data collection period was summarized and used to generate descriptive statistics to quantify the proportion of physical, social and cognitive activity occurring for each patient during the period of observation. The objective was to record independent or supervised activity outside of therapy, so we took the decision to record scheduled therapy sessions as “unobserved”. “Unobserved” was also recorded when, for example, a patient was behind the bedside curtain or absent from the ward. “No activity” was only recorded when the patient was directly observed, their location was clear, and they were not engaged in activity.
Results
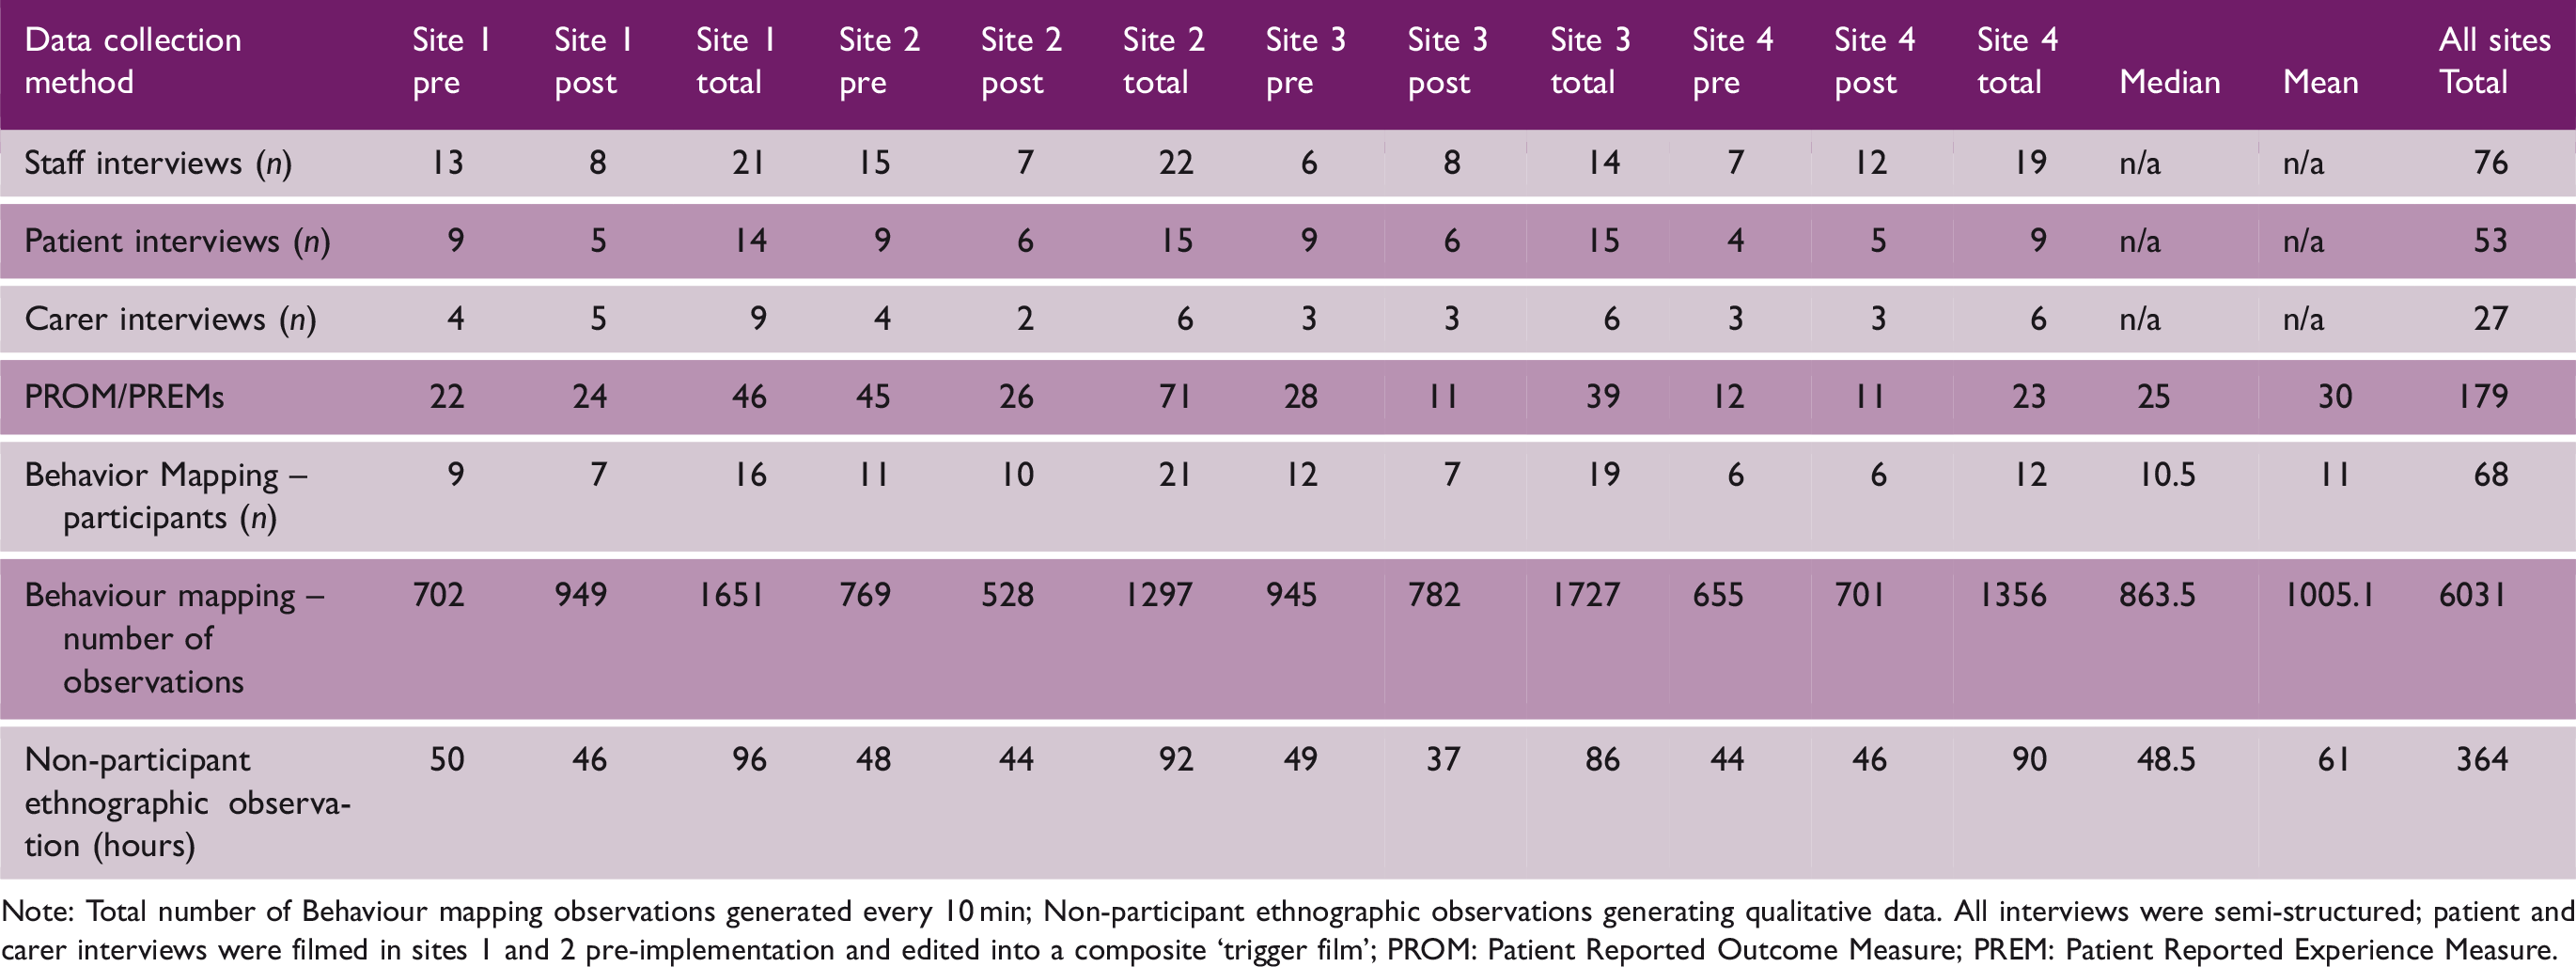
Note: Total number of Behaviour mapping observations generated every 10 min; Non-participant ethnographic observations generating qualitative data. All interviews were semi-structured; patient and carer interviews were filmed in sites 1 and 2 pre-implementation and edited into a composite ‘trigger film’; PROM: Patient Reported Outcome Measure; PREM: Patient Reported Experience Measure.
Demographic details of patient participants
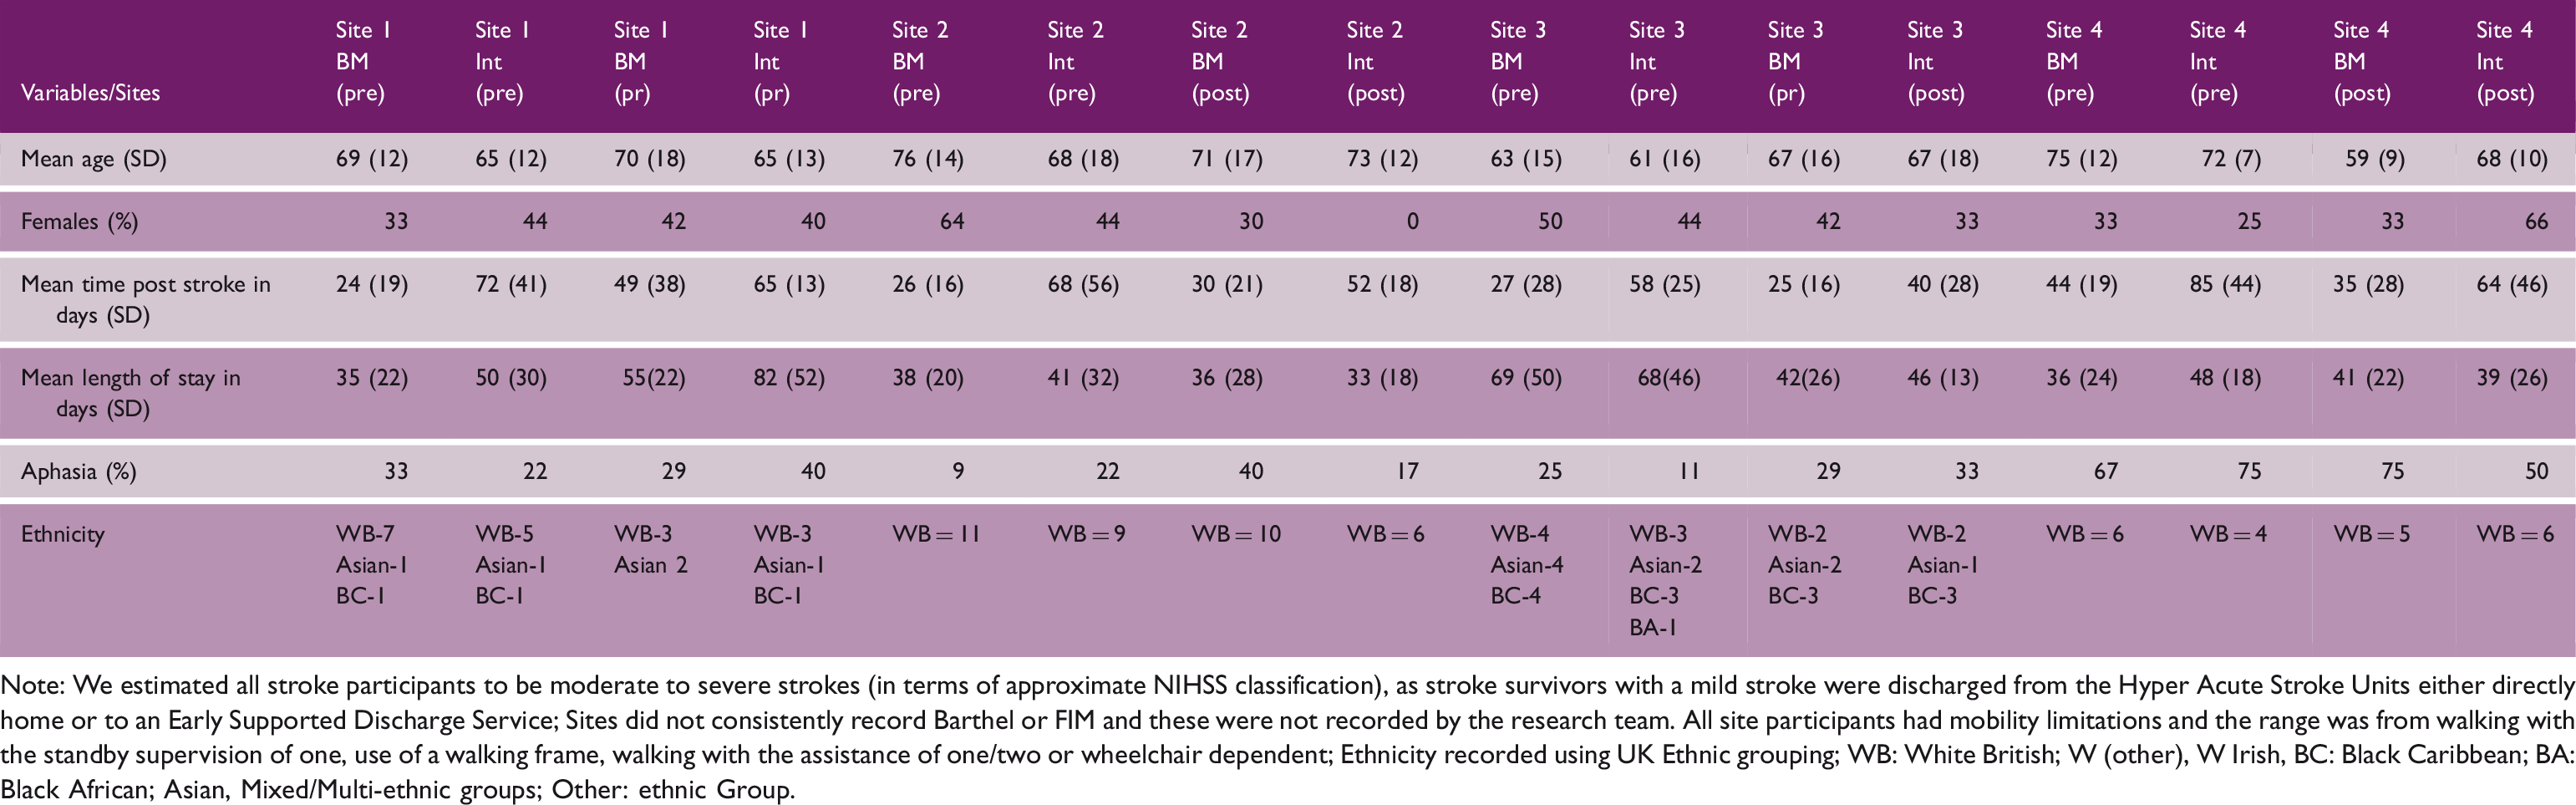
Note: We estimated all stroke participants to be moderate to severe strokes (in terms of approximate NIHSS classification), as stroke survivors with a mild stroke were discharged from the Hyper Acute Stroke Units either directly home or to an Early Supported Discharge Service; Sites did not consistently record Barthel or FIM and these were not recorded by the research team. All site participants had mobility limitations and the range was from walking with the standby supervision of one, use of a walking frame, walking with the assistance of one/two or wheelchair dependent; Ethnicity recorded using UK Ethnic grouping; WB: White British; W (other), W Irish, BC: Black Caribbean; BA: Black African; Asian, Mixed/Multi-ethnic groups; Other: ethnic Group.
Staff participants
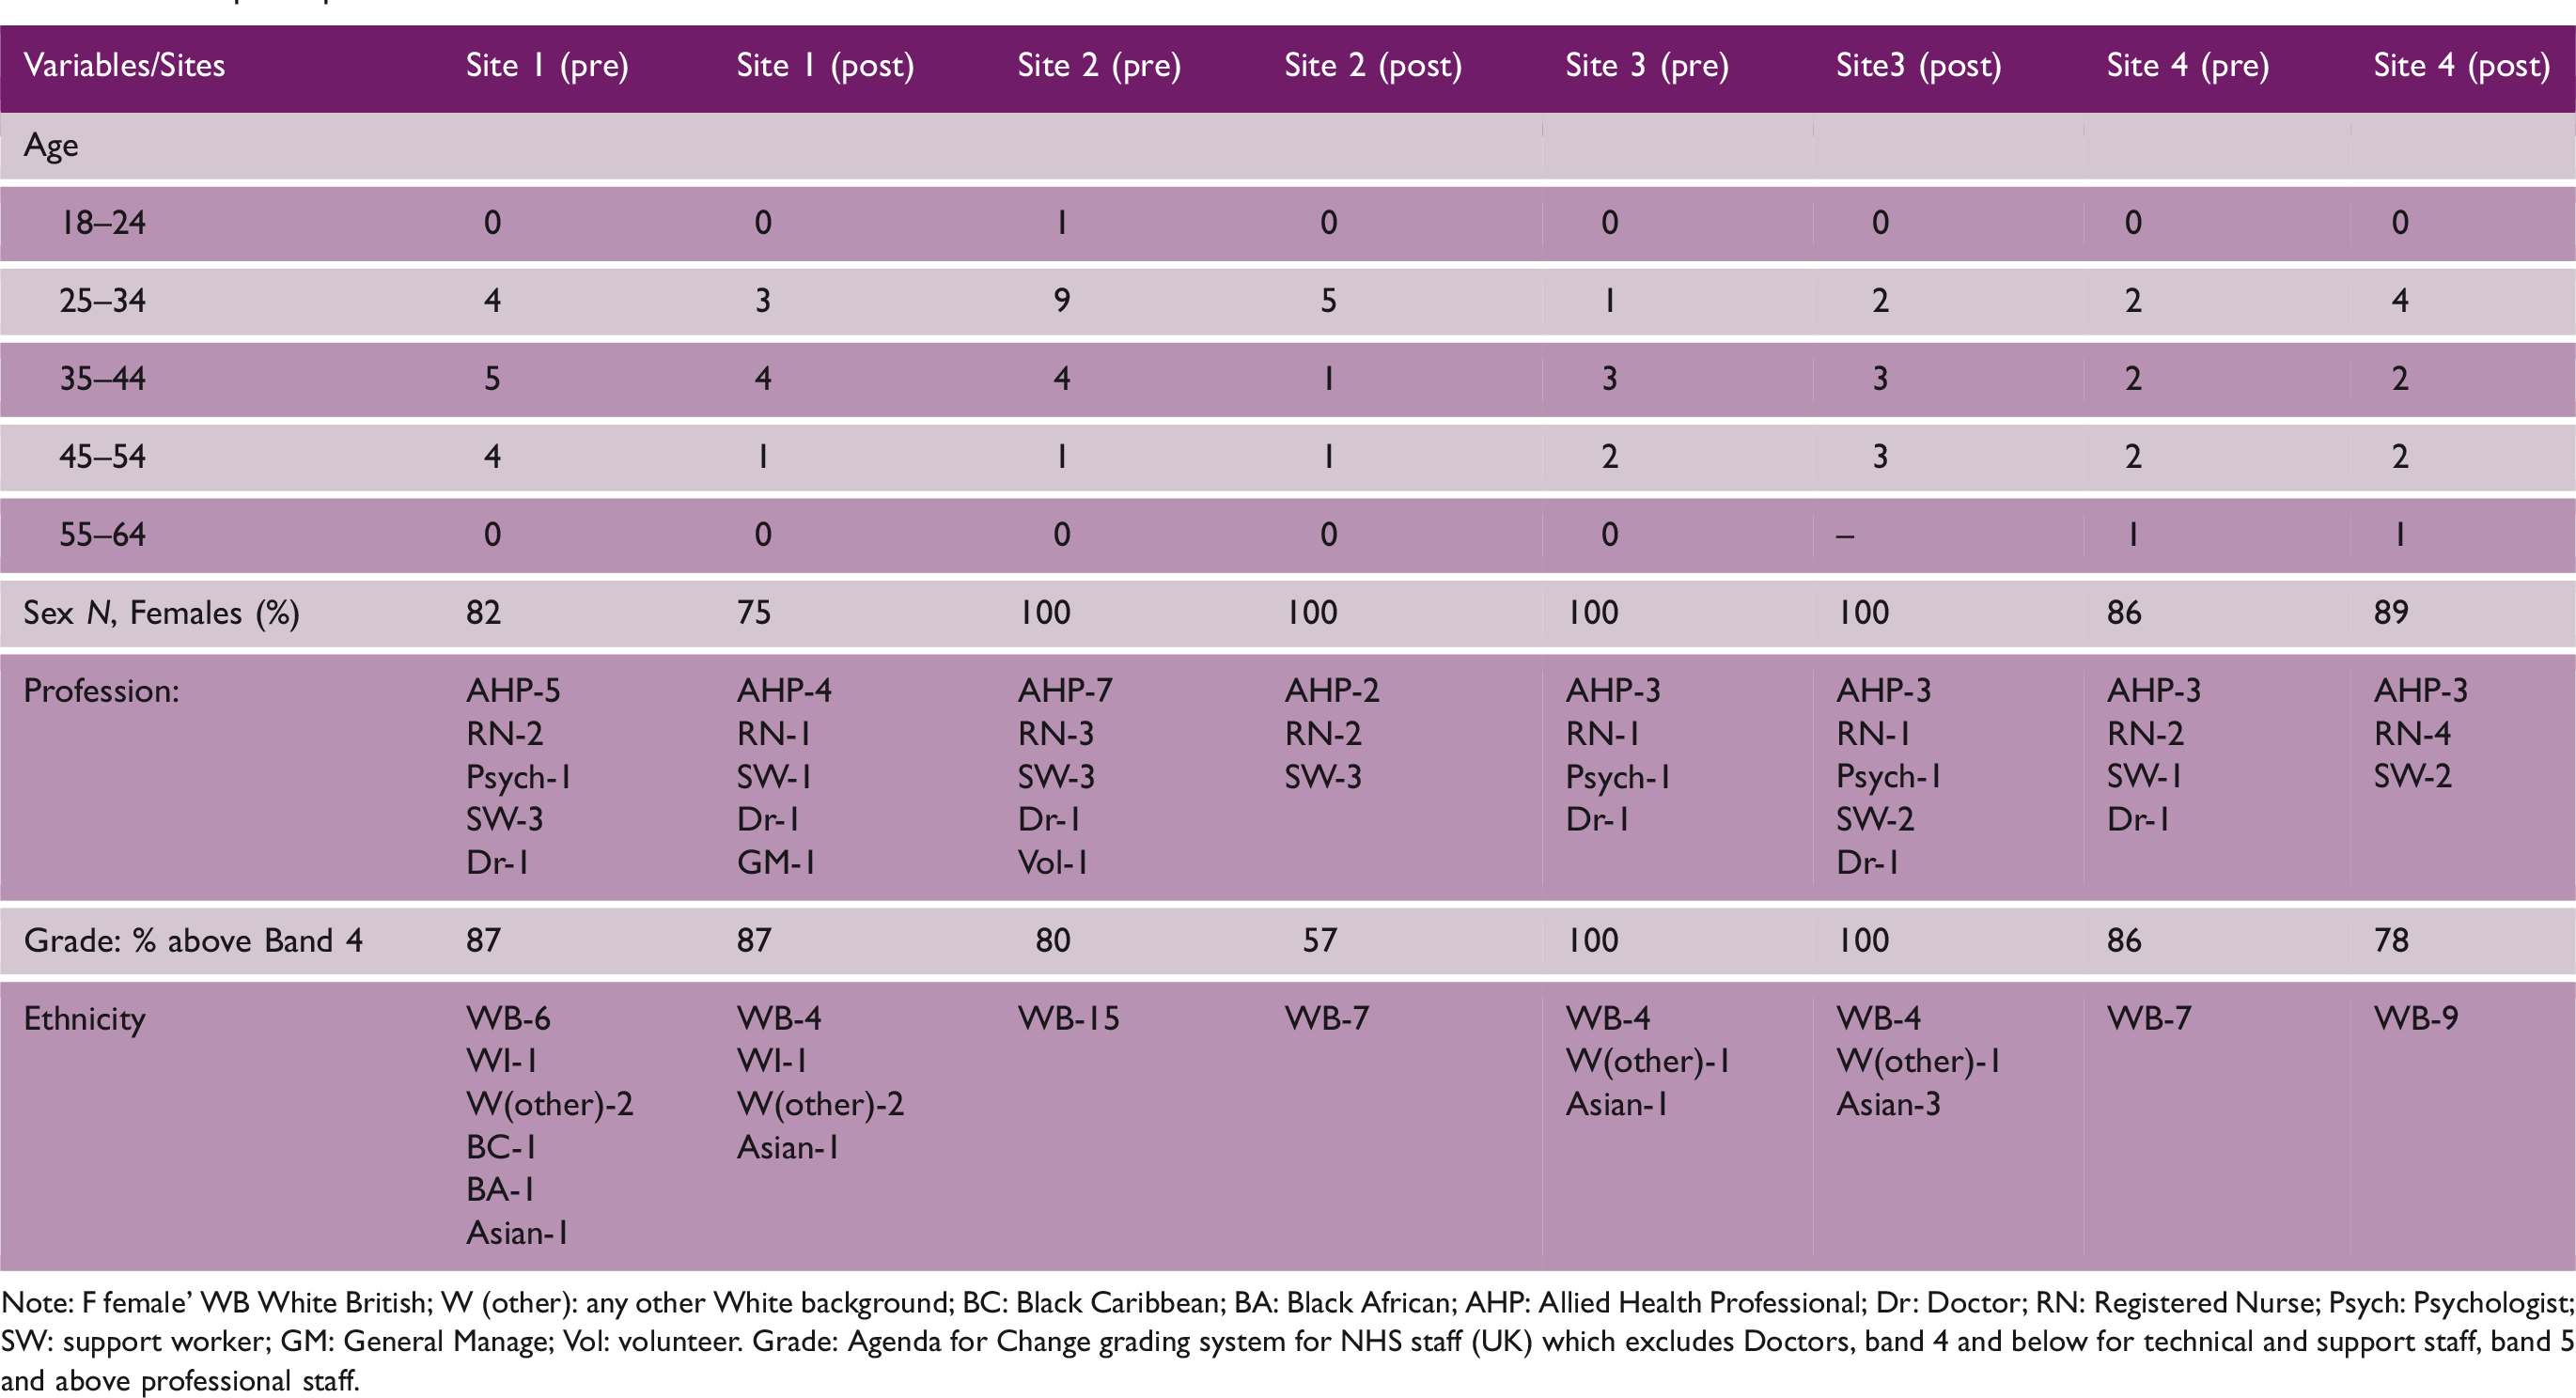
Note: F female’ WB White British; W (other): any other White background; BC: Black Caribbean; BA: Black African; AHP: Allied Health Professional; Dr: Doctor; RN: Registered Nurse; Psych: Psychologist; SW: support worker; GM: General Manage; Vol: volunteer. Grade: Agenda for Change grading system for NHS staff (UK) which excludes Doctors, band 4 and below for technical and support staff, band 5 and above professional staff.
Carer participants (semi-structured interviews)
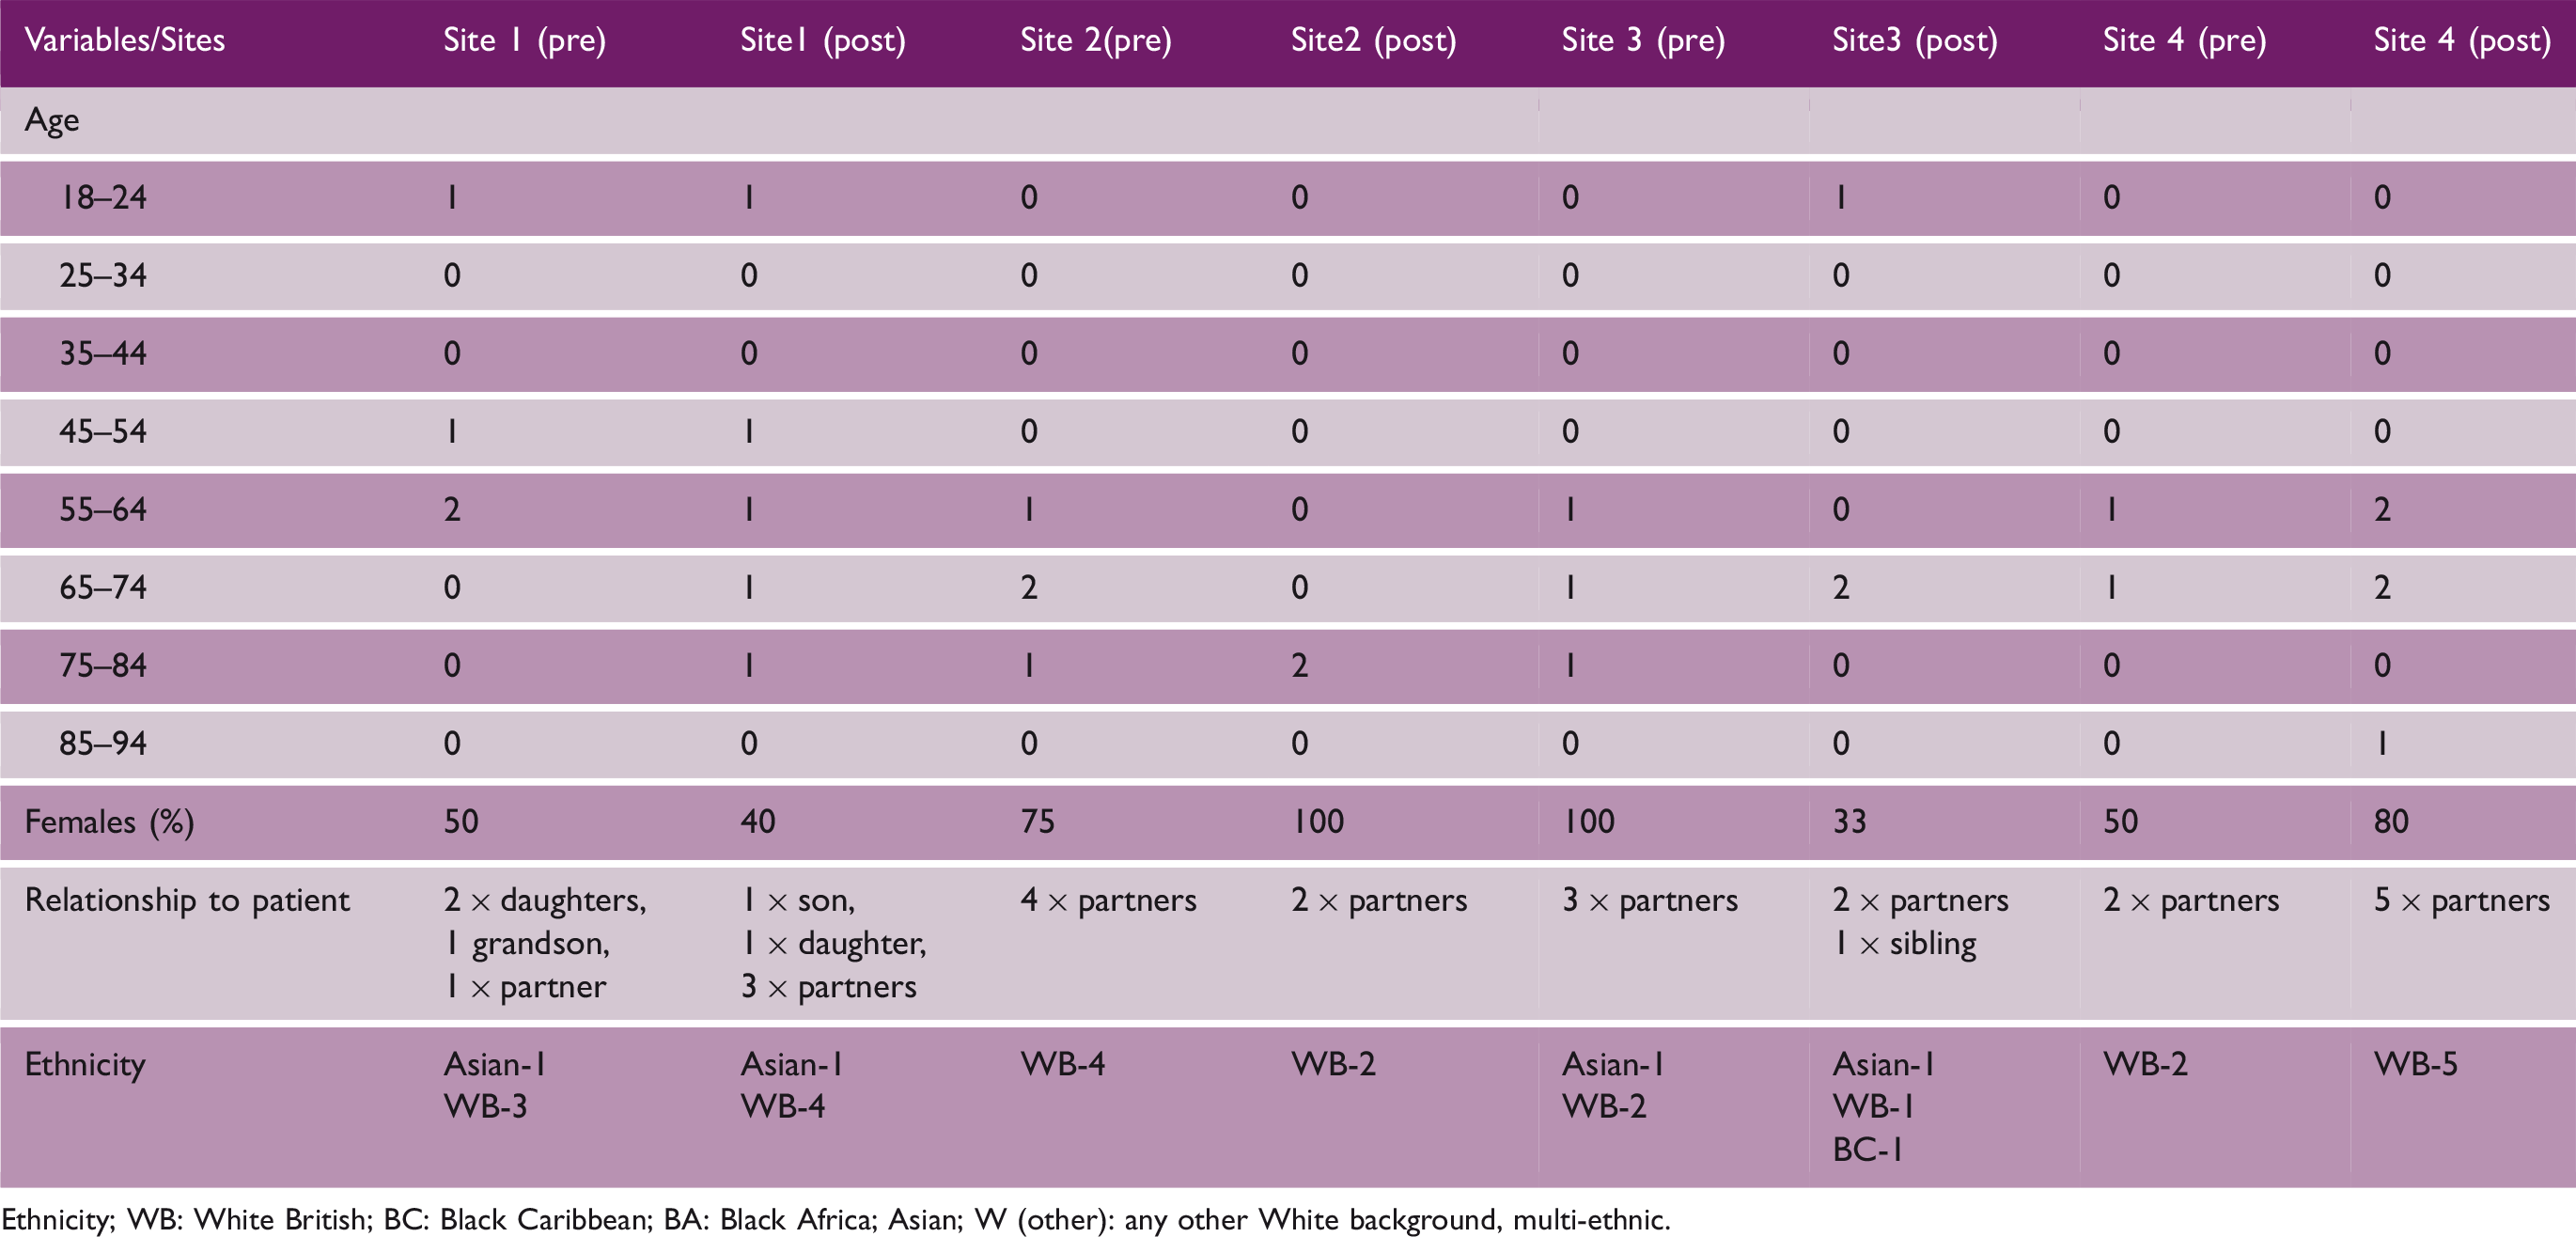
Ethnicity; WB: White British; BC: Black Caribbean; BA: Black Africa; Asian; W (other): any other White background, multi-ethnic.
Excerpts from analysis of field notes and interviews and how priorities were shaped
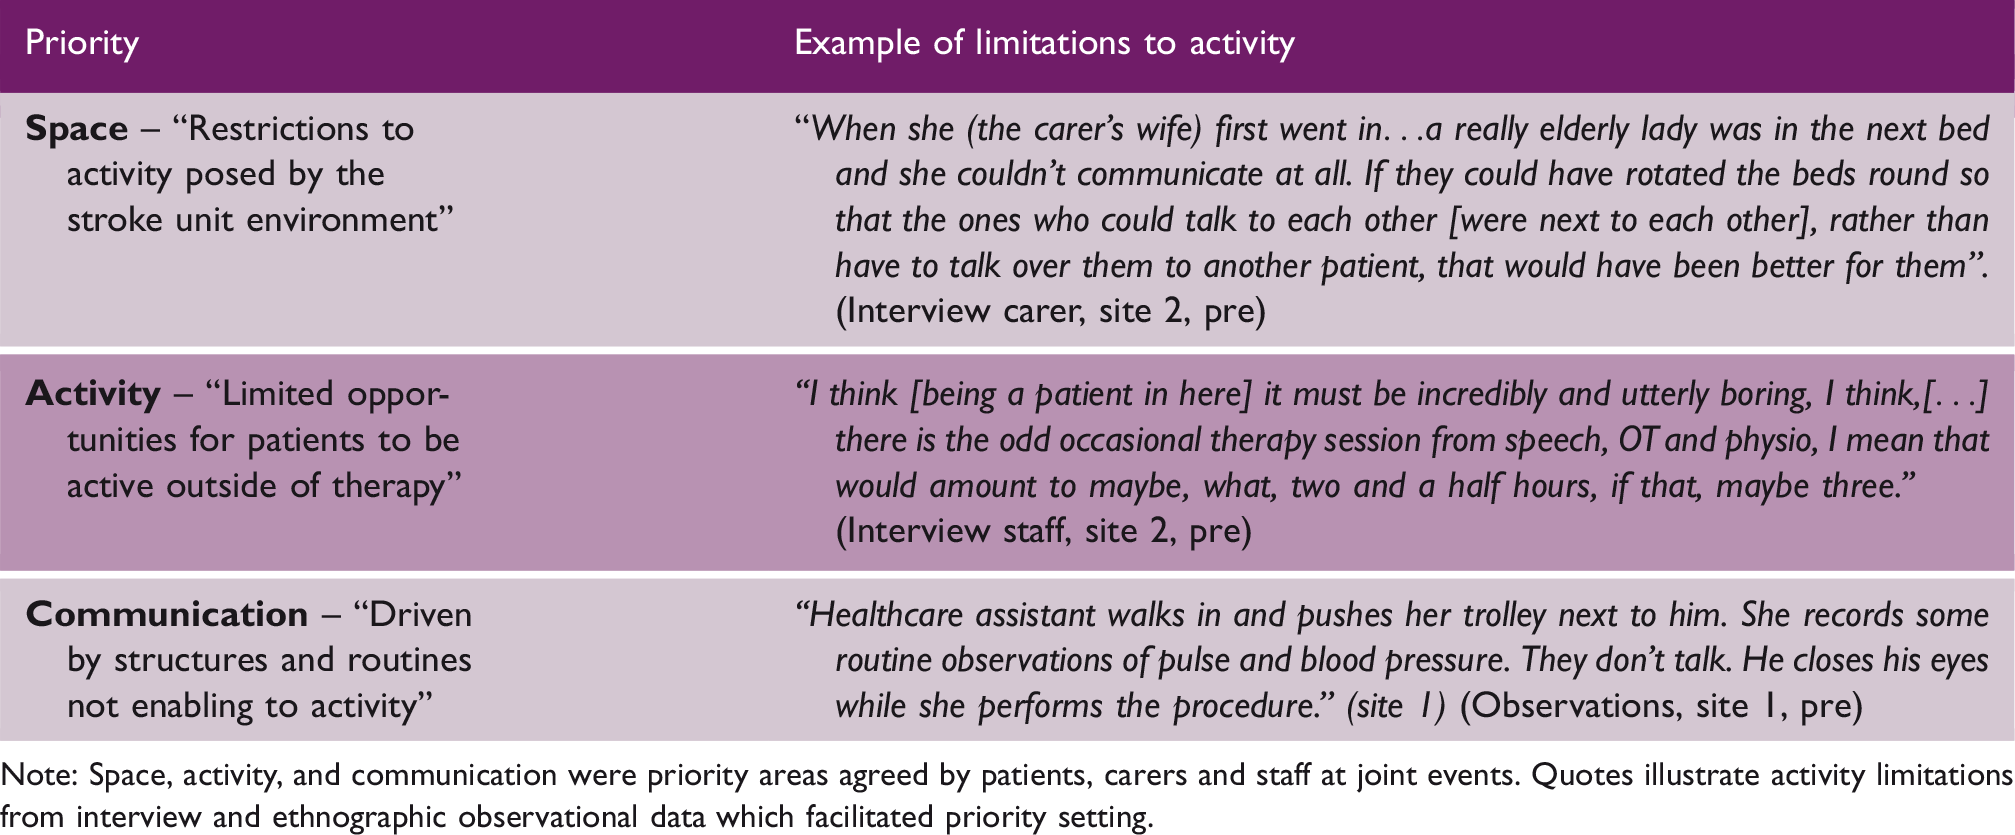
Note: Space, activity, and communication were priority areas agreed by patients, carers and staff at joint events. Quotes illustrate activity limitations from interview and ethnographic observational data which facilitated priority setting.
Co-design group characteristics
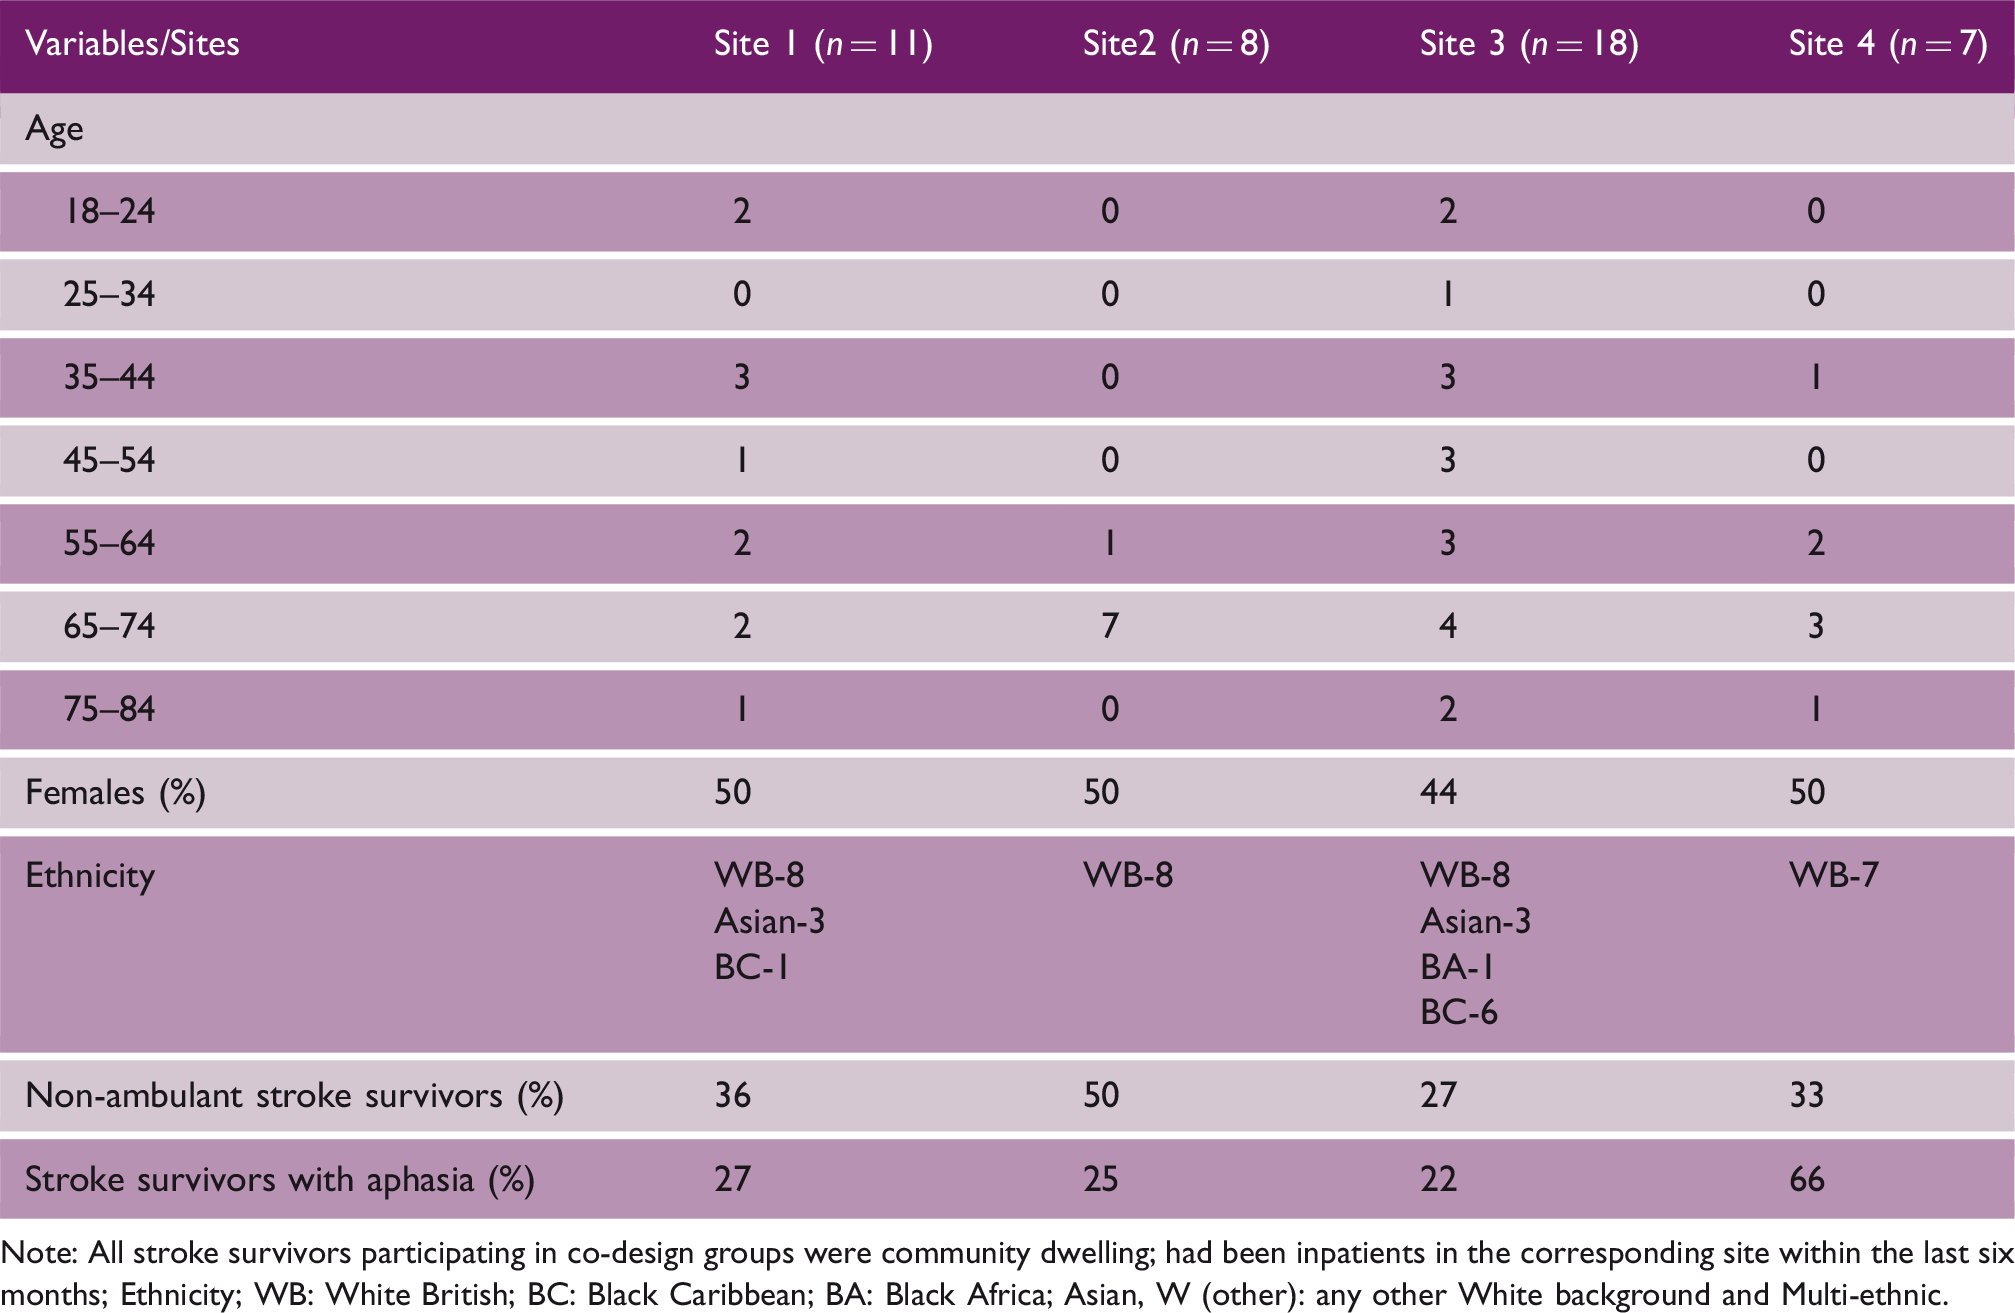
Note: All stroke survivors participating in co-design groups were community dwelling; had been inpatients in the corresponding site within the last six months; Ethnicity; WB: White British; BC: Black Caribbean; BA: Black Africa; Asian, W (other): any other White background and Multi-ethnic.
Co-design groups in each site
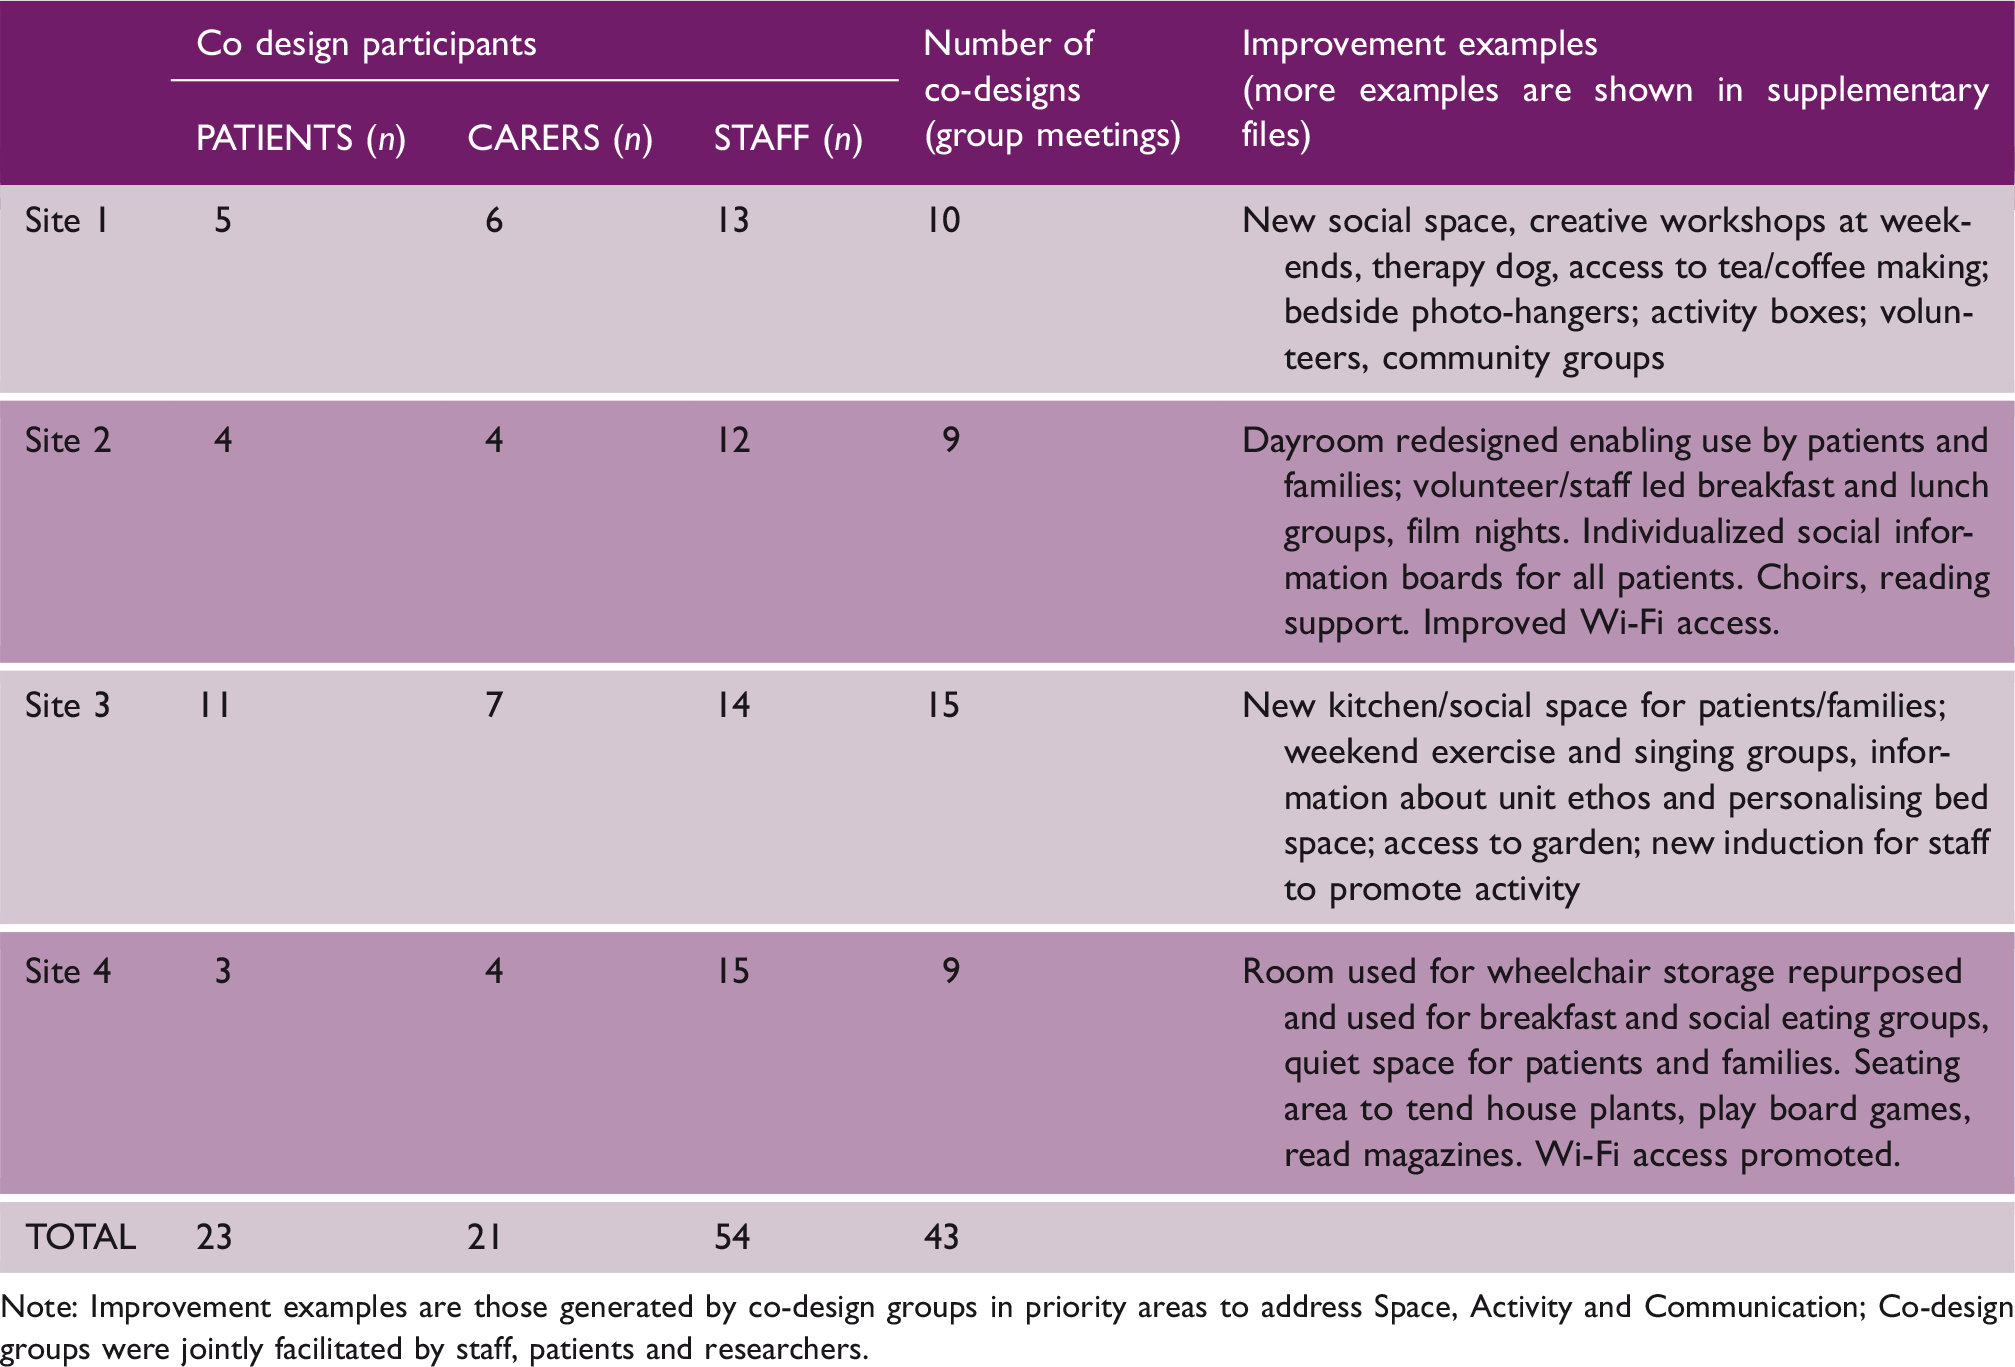
Note: Improvement examples are those generated by co-design groups in priority areas to address Space, Activity and Communication; Co-design groups were jointly facilitated by staff, patients and researchers.
Qualitative findings (interviews and observations)
Analysis of observational and interview data post-implementation of improvements confirmed discernible changes in the nature and use of communal ward spaces, more group activity, e.g. breakfast and art groups and increased activity opportunities at individual level. Patients and families had access to new social spaces to meet and interact, and organized groups and community volunteers. Stroke units communicated more consistently about activity opportunities through leaflets and posters, highlighting activities available outside of therapy and how patients and families could get involved. However, we found minimal change in the nature of face-to-face interactions between staff and patients outside of therapy, which remained task-focused with minimal interaction beyond that required for routine care tasks.
Impact of co-designed changes
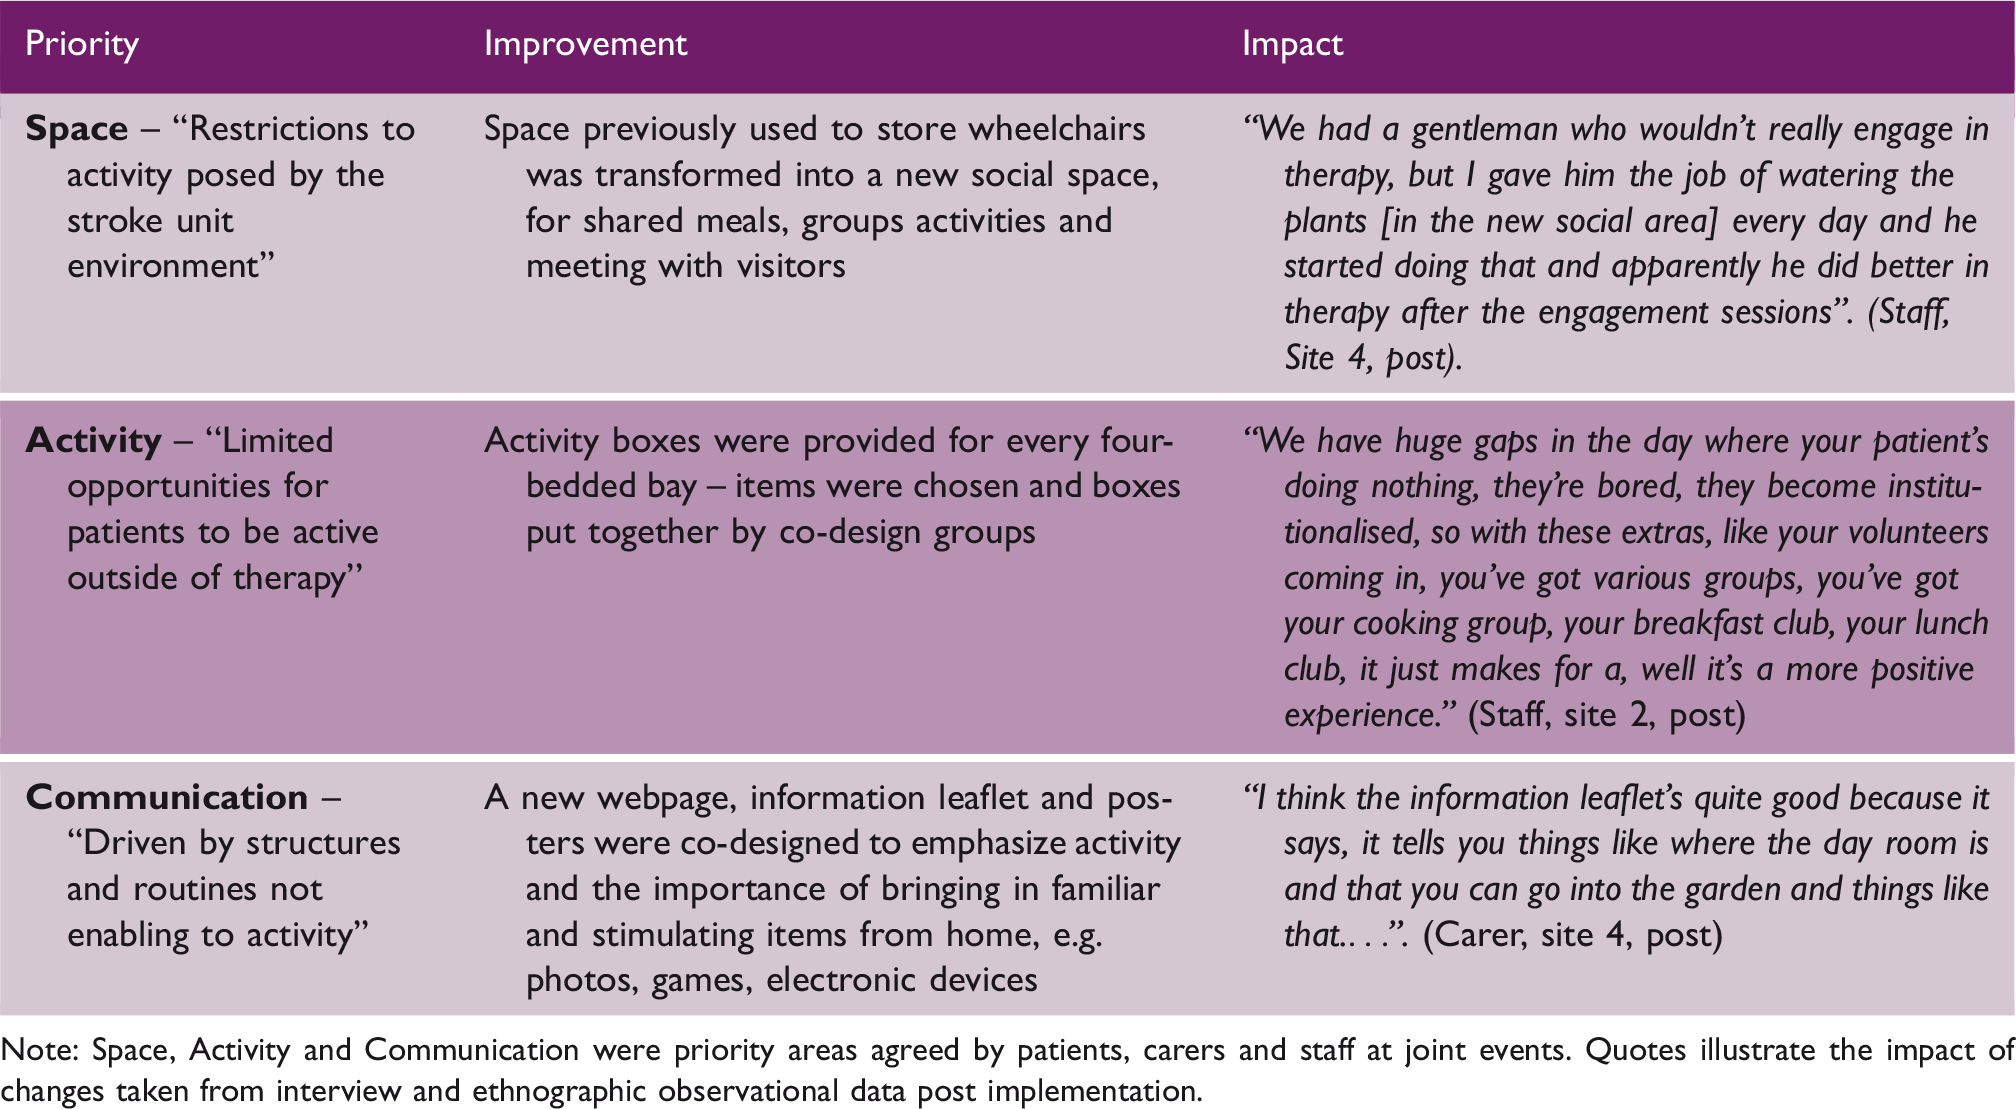
Note: Space, Activity and Communication were priority areas agreed by patients, carers and staff at joint events. Quotes illustrate the impact of changes taken from interview and ethnographic observational data post implementation.
Post implementation evaluation
Quantitative findings
Pre- and post-implementation behavioral mapping data
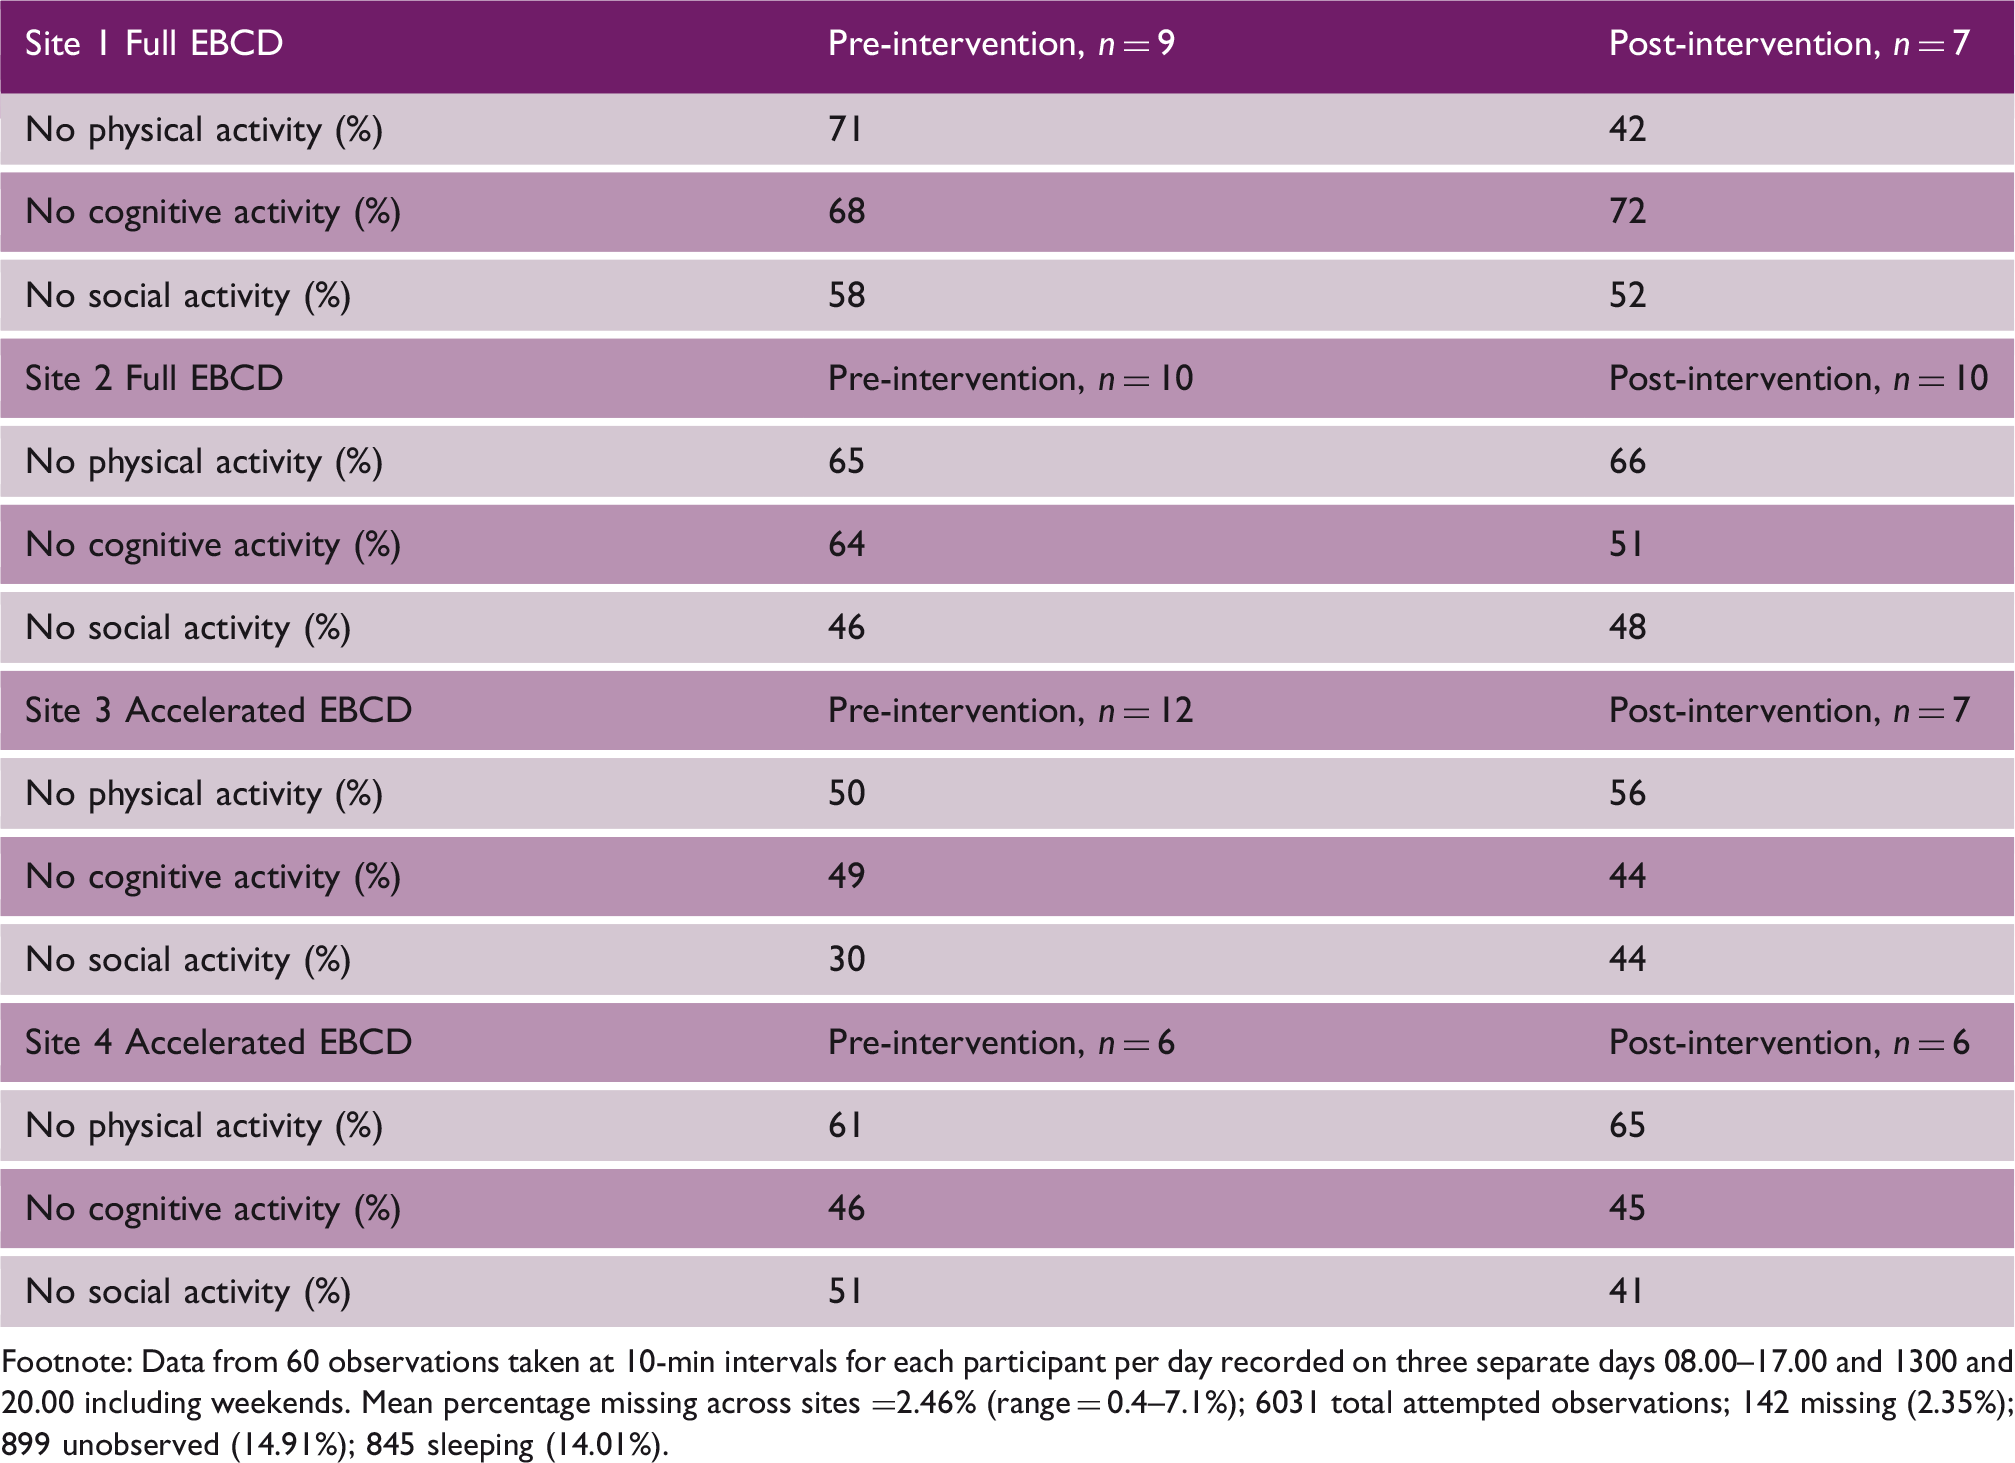
Footnote: Data from 60 observations taken at 10-min intervals for each participant per day recorded on three separate days 08.00–17.00 and 1300 and 20.00 including weekends. Mean percentage missing across sites =2.46% (range = 0.4–7.1%); 6031 total attempted observations; 142 missing (2.35%); 899 unobserved (14.91%); 845 sleeping (14.01%).
Response rates for PROM/PREMs were low varying from 12% to 38%. Cohorts who returned questionnaires were not atypical reporting levels of physical impairment, dependency, emotional and social limitations congruent with national and international stroke statistics. A full analysis from this data set is reported in our final report [https://njl-admin.nihr.ac.uk/document/download/2031395].
Discussion
Overall, these findings support that using EBCD as an improvement approach was feasible and facilitated patients, carers, and staff collaborating to develop and implement multiple improvements to address patient activity in four stroke units. We also confirmed that the use of trigger films of patients’ experiences developed in two initial stroke units could be transferred to two further units and implemented within a shortened time frame using an accelerated form of EBCD (AEBCD).
This is the first report of using EBCD to address inactivity in stroke units. Stroke patients and carers played a significant role in eliciting changes through sharing experiences with each other and staff, highlighting priorities for improvement and engaging in the work of co-design. However, there was no signal of benefit to activity within quantitative data such as behavior mapping. This is despite staff perceptions of a more enabling environment and evidence of greater use of shared social spaces and number of activity opportunities in qualitative data, i.e. non-participant observations and interviews. Changes in priority areas environment (Space) and increased activity opportunities (Activity) for patients across each of the four participating stroke units were observed. Patient/staff interactions (Communication) achieved some ward level changes but were more challenging to initiate and sustain. These findings match previous studies which report challenges in changing the “nature” of communication towards enabling and personalized language. 22
Despite an increase in the number of activity opportunities in all sites after EBCD cycles had completed, the impact on measured activity was equivocal. We believe this was due in part to the methodological constraints of case study research. We did not set out to compare individual patients before and after implementation of improvements because of the length of time taken to complete the (A)EBCD cycles, and we did not compare different cohorts within the same stroke units. Additionally, our findings could have been influenced by other factors. First, eligible patients for behavior mapping needed to provide consent the day before data collection, which meant we observed only a small number of patients and proportion of their activity behavior at any given time. Second, scheduled therapy sessions were recorded “unobserved” as were instances when a patient was not physically present but later found to have been at an outside café and thus active. Third, contextual issues such as staff shortages and the severity of disability of the inpatient caseload impacted on the activity opportunities we could record; we also recognize that not collecting detailed data on individual stroke severity was a limitation.
Overall, we believe that both EBCD and AEBCD are feasible and there were clear benefits of patients, carers, and staff identifying priorities and co-designing solutions. EBCD provided a facilitated, structured, participatory, and time limited process, fundamentally different to professionally-led – or externally driven – quality improvement initiatives in stroke. We believe the involvement of patients and carers increased the accountability of staff participants and the likelihood that planned changes would proceed. However, further research is warranted to fully understand how an increase in activity opportunities generated through CREATE can have the required impact on observed activity levels in patients on an inpatient stroke unit.
Supplemental Material
sj-pdf-1-wso-10.1177_1747493020969367 - Supplemental material for Addressing inactivity after stroke: The Collaborative Rehabilitation in Acute Stroke (CREATE) study
Supplemental material, sj-pdf-1-wso-10.1177_1747493020969367 for Addressing inactivity after stroke: The Collaborative Rehabilitation in Acute Stroke (CREATE) study by Fiona Jones, Karolina Gombert-, Stephanie Honey, Geoffrey Cloud, Ruth Harris, Alastair Macdonald, Christopher McKevitt, Glenn Robert and David Clarke in International Journal of Stroke
Footnotes
Acknowledgements
The authors acknowledge the support of Dr Heidi Janssen, Hunter Stroke Service, Hunter Medical Research Institute and University of Newcastle, Newcastle, NSW Australia and collaborators for use of their behavior mapping protocol. Dr Tino Kulnik and Louisa Burton assisted with data collection and analysis and interpretation of behavior mapping results. Dr Alessia Costa and Dr Parminder Dhiman assisted with data collection in site 1.
Declaration of conflicting interests
The author(s) declared no potential conflicts of interest with respect to the research, authorship, and/or publication of this article.
Funding
The author(s) disclosed receipt of the following financial support for the research, authorship and/or publication of this article: This study was funded by the National Institute for Health Research (NIHR) under its Health Services and Delivery Research (HS&DR) Programme [Grant no. 13-11/495]. The views expressed are those of the author(s) and not necessarily those of the NIHR or the Department of Health and Social Care.
Supplemental material
Supplemental material for this article is available online.
References
Supplementary Material
Please find the following supplemental material available below.
For Open Access articles published under a Creative Commons License, all supplemental material carries the same license as the article it is associated with.
For non-Open Access articles published, all supplemental material carries a non-exclusive license, and permission requests for re-use of supplemental material or any part of supplemental material shall be sent directly to the copyright owner as specified in the copyright notice associated with the article.