
Abstract
This study aims to provide a comprehensive picture of auditory emotion perception in cochlear implant (CI) users by (1) investigating emotion categorisation in both vocal (pseudo-speech) and musical domains and (2) how individual differences in residual acoustic hearing, sensitivity to voice cues (voice pitch, vocal tract length), and quality of life (QoL) might be associated with vocal emotion perception and, going a step further, also with musical emotion perception. In 28 adult CI users, with or without self-reported acoustic hearing, we showed that sensitivity (d’) scores for emotion categorisation varied largely across the participants, in line with previous research. However, within participants, the d’ scores for vocal and musical emotion categorisation were significantly correlated, indicating both similar processing of auditory emotional cues across the pseudo-speech and music domains as well as robustness of the tests. Only for musical emotion perception, emotion d’ scores were higher in implant users with residual acoustic hearing compared to no acoustic hearing. The voice pitch perception did not significantly correlate with emotion categorisation in either domain, while the vocal tract length significantly correlated in both domains. For QoL, only the sub-domain of Speech production ability, but not the overall QoL scores, correlated with vocal emotion categorisation, partially supporting previous findings. Taken together, results indicate that auditory emotion perception is challenging for some CI users, possibly a consequence of how available the emotion-related cues are via electric hearing. Improving these cues, either via rehabilitation or training, may also help auditory emotion perception in CI users.
Keywords
Introduction
Cochlear implants (CIs) are prosthetic devices that provide hearing to individuals with severe or profound deafness by directly stimulating the auditory nerve using electric current. However, due to the properties of electrode-nerve interface, spectrotemporal details are reduced in the transmitted information (for an overview, see the article by Başkent et al., 2016). In particular, the perception of vocal and musical emotion is consistently reported to be challenging for CI users (Ambert-Dahan et al., 2015; Chatterjee et al., 2015, 2024; Lin et al., 2022; Luo et al., 2007; Paquette et al., 2018; Volkova et al., 2013). The ability to perceive vocal emotions in CI users has been shown to be linked to voice cue discrimination thresholds for emotion-related acoustic features such as voice pitch cues (related to voice fundamental frequency, F0; Barrett et al., 2020; Deroche et al., 2016; Lin et al., 2022) and vocal tract length (VTL; related to formants, Chuenwattanapranithi et al., 2008; Nussbaum et al., 2022; von Eiff et al., 2022b), as well as to listeners’ ratings of quality of life (QoL; Luo et al., 2018). These links have not yet been established for musical emotion perception. Understanding whether the benefit from the CI is comparable for vocal and musical emotion could inform research on optimal processor settings for speech and music, as well as help improve audiological assessment and develop new training strategies. For example, training for the perception of generic auditory perceptual features might benefit emotion perception in speech or music (Fuller et al., 2018). The current study therefore investigated within-participant vocal and musical emotion perception in CI users, and whether vocal or musical emotion perception was associated with voice cue discrimination or QoL. Moreover, in recent years, CI users increasingly have usable residual (low-frequency) acoustic hearing available to them on the contralateral (non-implanted) ear, although the degree of it varies (e.g., Nyirjesy et al., 2024). This is likely due to a combination of factors including relaxing CI candidacy indications and earlier referrals to CI teams once hearing aids are no longer sufficiently functional. In this study, we also explored the extent to which self-reported acoustic hearing, when added to CI electric hearing, may affect vocal and music emotion perception. Thus, the current study aims to provide a comprehensive picture of auditory emotion perception by CI users, as assessed in two domains, vocal and musical, and in relation to potentially relevant acoustical factors, such as acoustic hearing and voice cue perception, as well as QoL.
Vocal and musical emotion perception
Perception of emotions not only relies on the analysis of the relevant acoustic cues but also the correct interpretation of the (important or life-saving) emotion so that an appropriate response can be given (e.g., fight, flight, or freeze). Neural processing of emotions is complex (e.g., Phillips et al., 2003), yet, historically, emotions and their perception have been considered as discrete categories (e.g., Hess, 2017; Hoemann et al., 2020). As a result, paradigms investigating emotion perception use categories to which a stimuli set belongs, and participants are required to assign an emotion category to each of the facial, vocal or musical stimuli (e.g., Banse & Scherer, 1996; Gelder et al., 2010; Pralus et al., 2020; Vieillard et al., 2008). Dimensional models of emotions suggest that emotion in general can be defined along arousal and valence dimensions and their combinations (Russell, 1980; Schlosberg, 1952). Arousal refers to the intensity of affective experience, whether the emotion is stimulating or relaxing, while valence refers to hedonic experience, whether the emotion is positive or negative (Feldman, 1995). Emotion categories in turn can be located in the two-dimensional arousal-valence emotion framework used (e.g., Figure 1, adapted from the work by Russell, 1980).
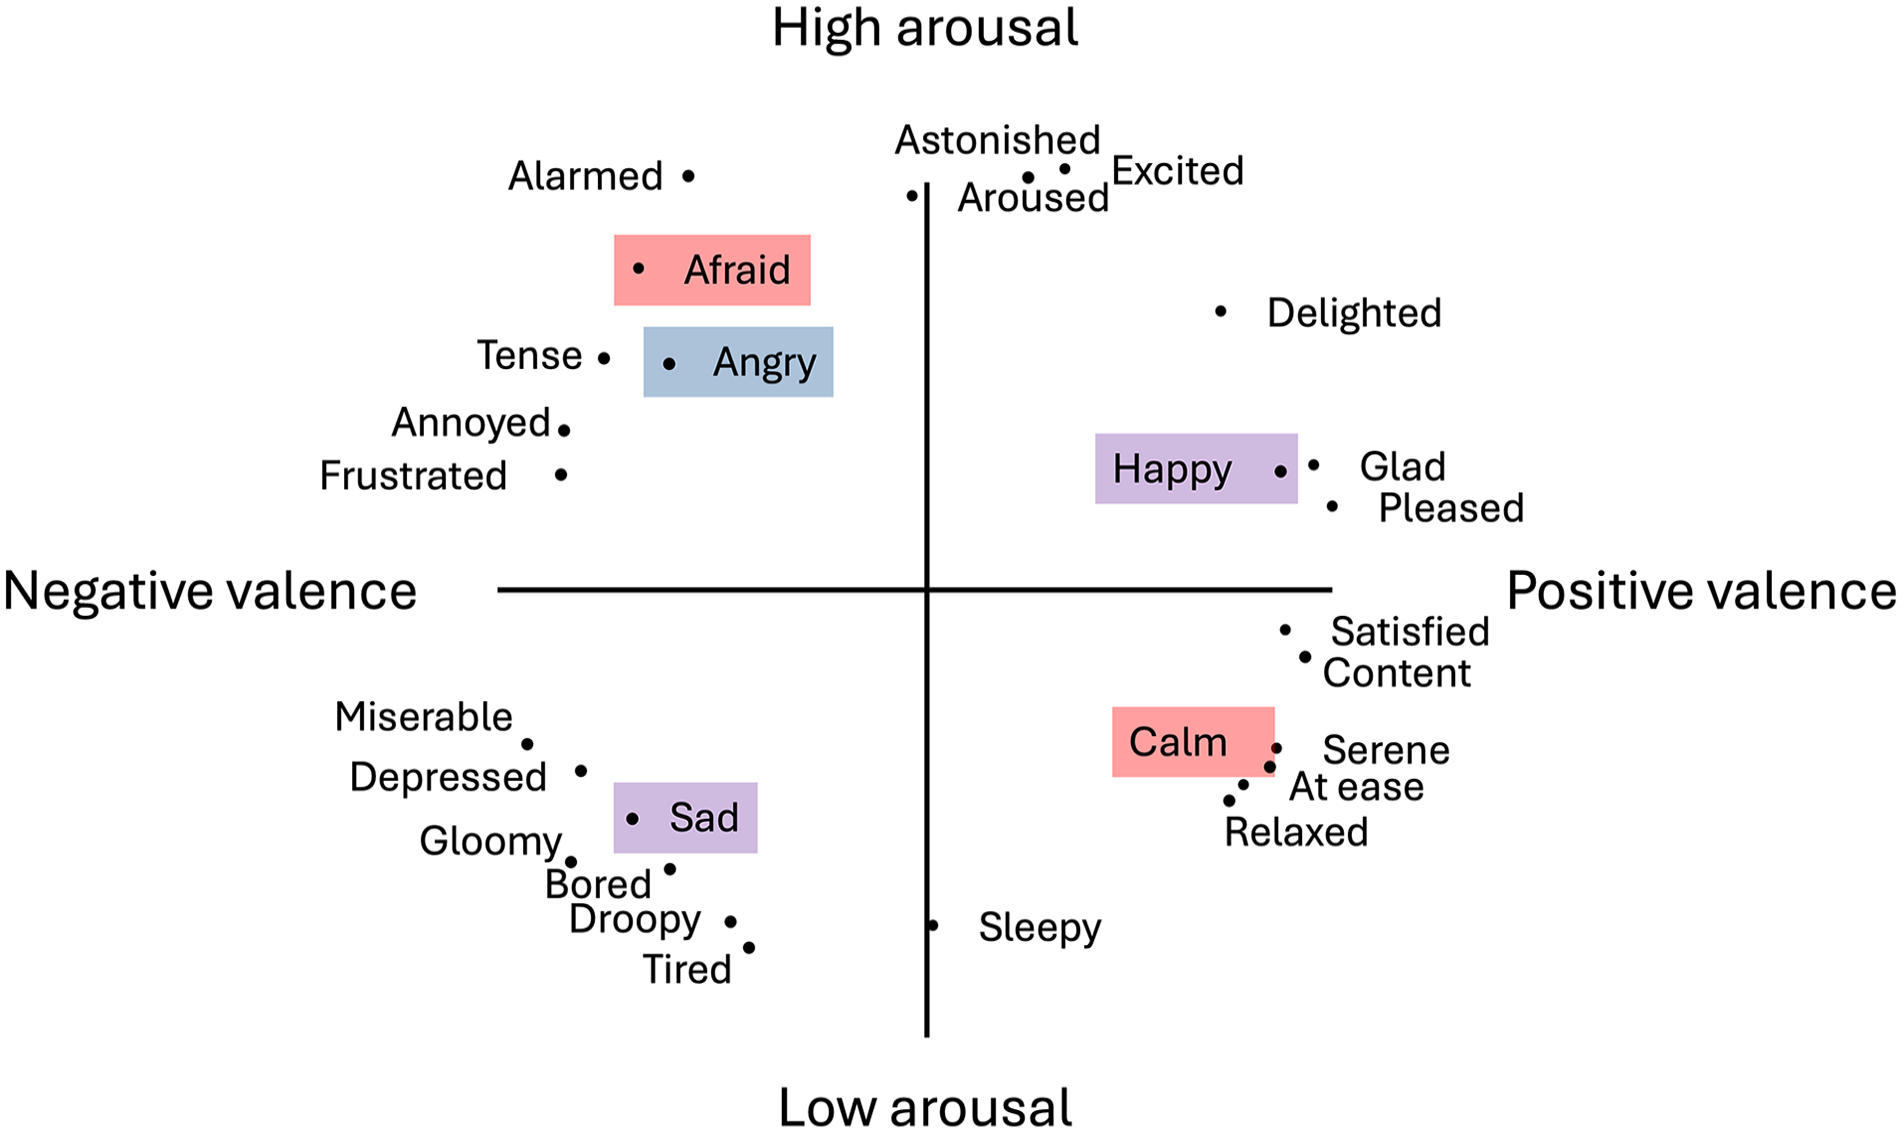
Multidimensional scaling of words describing emotions along arousal and valence dimensions, adapted from the study by Russell (1980). Emotion categories used in this study are highlighted for Experiment 1a (blue), Experiment 1b (red), or both experiments (purple).
Acoustic features of vocal emotion
For vocal emotions, arousal has been reported to be expressed by voice intensity, spectral energy content, voice F0 (or the frequency that the vocal folds vibrate), and pitch variability range. High-arousal emotions, such as fear, anger, and happiness, are characterised by high intensity and energy, high mean F0, and large F0 variability. In comparison, low-arousal emotions, such as sadness and depression, are characterised by lower energy and lower and less-variable F0 (e.g., Banse & Scherer, 1996; Belin et al., 2008). Regarding valence, mean F0 and F0 contour—whether F0 rises or falls across the utterance—could contribute to distinguishing valence in high-arousal emotions (e.g., happy and fearful), although the direction of mean and F0 contour changes differs between studies and individual speakers (e.g., Bachorowski & Owren, 1995; Belin et al., 2008).
Perception of vocal emotions with CIs
When tested for the perception of vocal emotions, CI users typically categorise emotions above chance level, but display categorisation accuracy significantly lower than that of normal-hearing (NH) control participants (Chatterjee et al., 2015, 2024; reviewed in the works of Jiam et al., 2017; Lin et al., 2022; Luo et al., 2007; Paquette et al., 2018; Volkova et al., 2013). Emotion categories are sometimes systematically confused with each other, especially when the categories are located on the same end or half-plane of the arousal dimension, e.g., happy with scared (e.g., Chatterjee et al., 2015; Lin et al., 2022). Confusions are also reported with a baseline-neutral condition. One study reported that neutral was responded most often regardless of the presented emotion (Luo et al., 2007), and another study reported neutral confusions to shift across individual speakers of stimuli, e.g., angry and neutral for a male speaker and sad and neutral for a female speaker (Chatterjee et al., 2015).
Acoustic features of musical emotions
For musical emotions, acoustic features have been linked to arousal and valence perception (e.g., Schubert, 2004), and a direct parallel with emotion perception in voice/speech has been proposed (Balkwill & Thompson, 1999). Arousal tends to be expressed by slow-varying temporal cues available in the acoustic envelope of the music, such as perceived loudness changes or how fast or slow the tempo of the beat is (e.g., faster tempi are more stimulating than slower tempi; e.g., Ilie & Thompson, 2006; Schubert, 2004). Valence, in contrast, is expressed by multifaceted cues conveying the harmonic complexity of the music, as well as the pitch intervals governing the mode (Gomez & Danuser, 2007). Within mainstream Western musical culture, 1 major mode and consonance are considered to have a more positive valence (“happy”), whereas minor mode and dissonance indicate more negative valence (“sad or nostalgic”; e.g., Bigand et al., 1996; Nieminen et al., 2012). Modes are defined according to the intervals between tones of the scale or the melodic contour at structurally important positions, e.g., “major” and “minor” are different in the harmonic ratio of one interval (the third) changing between 4:5 (major) and 5:6 (minor). Music is considered increasingly dissonant as the ratio between simultaneous and consecutive pitches becomes more complex (e.g., Berg & Stork, 2004), e.g., a single note sounding in perfect unison creates a ratio of 1:1, whereas black and white neighbouring keys on the piano played together can create a 15:16 ratio (Müller, 2021).
Perception of musical emotions with CIs
While music enjoyment has been shown to enhance QoL in CI users (Fuller et al., 2021; Lassaletta et al., 2008), challenges in hearing and fully appreciating music continue to be an issue within this group, in part due to the limited transmission of spectrotemporal information (Caldwell et al., 2017; Giannantonio et al., 2015; Lassaletta et al., 2008; Limb, 2006). Behavioural studies have indicated that perception of cues related to pitch, timbre, harmony, and spectral resolution are limited in CI hearing (e.g., Friesen et al., 2001; McDermott, 2004; Shannon, 1983; Zimmer et al., 2019), while the perception of slow-varying temporal information and rhythm seems to be relatively preserved in comparison, although not always unimpaired (e.g., Hidalgo et al., 2021). Studies investigating emotion categorisation in music have reported that CI users rely more strongly on temporal cues than on pitch cues. A series of studies systematically varied the tempo and mode of melodies with chordal accompaniment and asked CI users to categorise stimuli as happy or sad (Caldwell et al., 2015; Giannantonio et al., 2015; Hopyan et al., 2016). Across the studies, emotion categorisation made only with CI hearing (with no additional acoustic hearing) or its simulations (NH children or adults tested with vocoded stimuli as an acoustic simulation of CIs) were based on tempo.
Two previous studies assessed how CI users rated arousal and valence dimensions and found that CI user ratings more closely resembled NH ratings in the valence dimension compared to the arousal dimension (Ambert-Dahan et al., 2015; Paquette et al., 2018). In one study presenting short bursts of notes played on the violin or clarinet to express the emotion categories happy, fear, sad, and neutral (Paquette et al., 2018), NH listeners appeared 2 to rate the presence of arousal and valence for items in each emotion category according to their position in the arousal-valence quadrants. CI users diverged from NH participants in arousal ratings (happy and sad were judged as exhibiting higher arousal than fear and neutral), whereas their valence ratings more closely resembled those of NH participants (happy had more positive valence than fear, but not sad, and fear was marginally more negative than sad). An explanation for improved valence perception compared to arousal perception that was observed in this study could be that the rating of single-instrument note bursts might diverge from polyphonic excerpts used in most other studies or that cues in longer, more complex stimuli include tempo and dynamic changes, both used to encode emotional arousal (Schubert, 2004).
In the other study, musical emotion categorisation of classical music excerpts was tested in NH participants and CI users using the emotion categories happiness, fear, sadness, and peacefulness (Ambert-Dahan et al., 2015). Participants rated the degree of arousal and valence for each emotion category. The arousal ratings were significantly higher in the NH group than those in the CI group, whereas there was no significant difference in valence ratings. While it remains unclear why arousal perception was more different from NH categorisation, this study raises an important point about CI user participants: 11 out of 13 CI users had some usable low-frequency acoustic hearing (enhanced with a contralateral hearing aid) in addition to the electric hearing via their CI; thus, some acoustic hearing and acoustic cues were still available. The presence of acoustic hearing in addition to the electric hearing can improve music perception (Fata et al., 2009; Gfeller et al., 2006). This could be due to the rich pitch and harmonic cues available via the low-frequency acoustic hearing.
Individual differences in acoustic hearing, voice cue perception, and QoL
Acoustic hearing
In recent years, more and more CI users have usable acoustic hearing available to them, although the degree of it varies (e.g., Nyirjesy et al., 2024). This is due to several interacting factors: CI candidacy indications have been evolving; the treatment decision of which ear to implant has shifted to the ear with the worse (as opposed to the better) hearing, leaving more acoustic hearing in the contralateral ear; CI surgeons are trained to use soft surgery skills in all patients with the goal of minimising cochlear trauma and preserving as much residual hearing as possible; CI manufacturing companies are continuing to develop leaner and increasingly atraumatic electrodes (see also the article by Snel-Bongers et al., 2018). A shift towards more residual acoustic hearing in the CI population may have consequences for their perception of speech and music. Regarding voice perception, vocoder simulations with additional acoustic hearing limited to 150 or 300 Hz were shown to improve voice pitch perception, indicating that even very limited bandwidth may still provide significant benefits (e.g., Başkent et al., 2016). In contrast, some other studies with CI users did not observe an improvement in within- and between-gender voice discrimination, where not only voice pitch but other voice characteristics would also differ (Dorman et al., 2008).
Music appreciation is also influenced by whether the CI users have usable low-frequency acoustic hearing in the implanted (Gfeller et al., 2006) or non-implanted ear (Fata et al., 2009). Studies have shown that bimodal CI users were able to use pitch-related musical cues to categorise musical emotion more strongly than CI users with no acoustic hearing (D’Onofrio et al., 2020; Giannantonio et al., 2015).
Voice cue perception
As mentioned earlier, voice cues are a source of expression of vocal emotion. F0 is directly related to the glottal pulse rate of the speaker. VTL is strongly associated with speaker’s height (Fitch & Giedd, 1999), with constraints on speech formant frequencies, and is connected to the notion of timbre (Patterson et al., 2010). In addition, VTL discrimination was previously interpreted as a proxy measure for spectral resolution in CI users (e.g., as it seems to relate to other measures, as seen in adult CI users, El Boghdady et al., 2019, or child CI users with single-sided deafness, (Arras et al., 2024).
CI users’ difficulty perceiving voice cues F0 and VTL (e.g., Deroche et al., 2014; Gaudrain & Başkent, 2018) may be a source of difficulty in perceiving vocal emotion. For example, vocal emotion perception was previously observed to correlate with F0 sensitivity in CI children (Barrett et al., 2020; Deroche et al., 2016; Lin et al., 2022), and with VTL (Chuenwattanapranithi et al., 2008) and spectral envelopes (Nussbaum et al., 2022; von Eiff et al., 2022b) in CI adults.
Perceiving F0 and VTL may be an indication of sound transmission fidelity in CIs overall, which in turn could affect the perception of musical emotion. CI users have shown deficit compared to NH listeners in perceiving modal (Caldwell et al., 2015; D’Onofrio et al., 2020) and consonance cues (in melodies, Caldwell et al., 2016; in chords, Knobloch et al., 2018), both strong indicators of music emotion (Cazden, 1945; Schubert, 2004). This deficit is likely to find at least some of its origin in the same sensory limitations as the ones that are captured by F0 and VTL discrimination thresholds.
Quality of life
Among CI users, the degree of self-reported QoL was previously reported to be positively associated with vocal emotion perception scores (Luo et al., 2018; Schorr et al., 2009; von Eiff et al., 2022a). One questionnaire specifically developed for CI users is the Nijmegen Cochlear Implant Questionnaire (NCIQ; Hinderink et al., 2000), which assesses hearing-related QoL in the general domains of Physical, Psychological, and Social functioning. NCIQ scores in all domains significantly correlated with average categorisation scores on a 5-alternative-forced-choice, vocal emotion perception paradigm (Luo et al., 2018), and NCIQ scores from Physical and Social (but not Psychological) functioning domains were positively correlated with average categorisation scores on a 2-alternative-forced-choice paradigm (von Eiff et al., 2022a). To our knowledge, QoL has not been investigated directly for potential correlation with musical emotion perception. However, music appreciation has been significantly associated with NCIQ QoL scores (e.g., Fuller et al., 2021), which is in turn strongly linked to perceiving musical emotion (Garrido & Schubert, 2011; Grewe et al., 2005).
The current study
The current study aimed to provide a comprehensive account of auditory emotion perception in CI users. First, we aimed to investigate whether the same CI user participants categorise vocal and musical emotions similarly and exhibit similar patterns of arousal and valence dimension perception across the two domains. Second, we aimed to explore potential associations between vocal and musical emotion categorisation and individual differences in acoustic hearing, voice cue perception, as well as QoL. For vocal emotion categorisation, we used the EmoHI test, previously used with CI children (Nagels et al., 2020), with three emotion categories of happy, angry, and sad (Experiment 1a). For musical emotion categorisation, we used a paradigm previously tested on NH participants with CI simulated classical music excerpts, with four emotion categories of joy, fear, serenity, and sadness (Filipic et al., 2010; Harding et al., 2023; Lévêque et al., 2018) (Experiment 1b). The influence of acoustic hearing was explored by comparing outcomes between unilaterally implanted CI users who reported to have acoustic hearing (bimodal group) or no acoustic hearing (unilateral group) in addition to electric hearing with the CI (Experiment 2a). For voice cue perception, we measured voice discrimination in just-noticeable differences (JNDs) for F0 and VTL (Gaudrain & Başkent, 2015, 2018) (Experiment 2b), and for QoL assessment, we used the NCIQ (Hinderink et al., 2000) (Experiment 2c). We hypothesised that (1) if emotion perception mechanisms are similar across materials, vocal and musical emotion categorisation outcomes would be correlated, and arousal and valence dimensions would display similar patterns; (2) acoustic hearing would yield higher vocal and musical emotion categorisation scores; (3) voice cue discrimination thresholds and QoL scores would correlate with vocal emotion categorisation in line with previous findings (e.g., Chatterjee et al., 2023; von Eiff et al., 2022a), and following reports that vocal and musical emotion perceptions are similar in CI users (Paquette et al., 2018; Volkova et al., 2013), these individual differences would also be reflected in musical emotion categorisation.
General methods
Participants
Twenty-eight CI users participated in Experiments 1 and 2. Participants’ ages and other demographic information are summarised in Table 1. Originally, 30 CI users had signed up for the study, but two participants dropped out before participating in any of the tests. Two CI users’ data in Experiment 2a could not be included in all analyses due to a lack of convergence in the adaptive test. All participants were residing in the Netherlands or Flemish Belgium. Implants from Cochlear (n = 20), Advanced Bionics (n = 3), and MED-EL (n = 5) were represented among participants.
Summary of participant demographic information (N = 28).
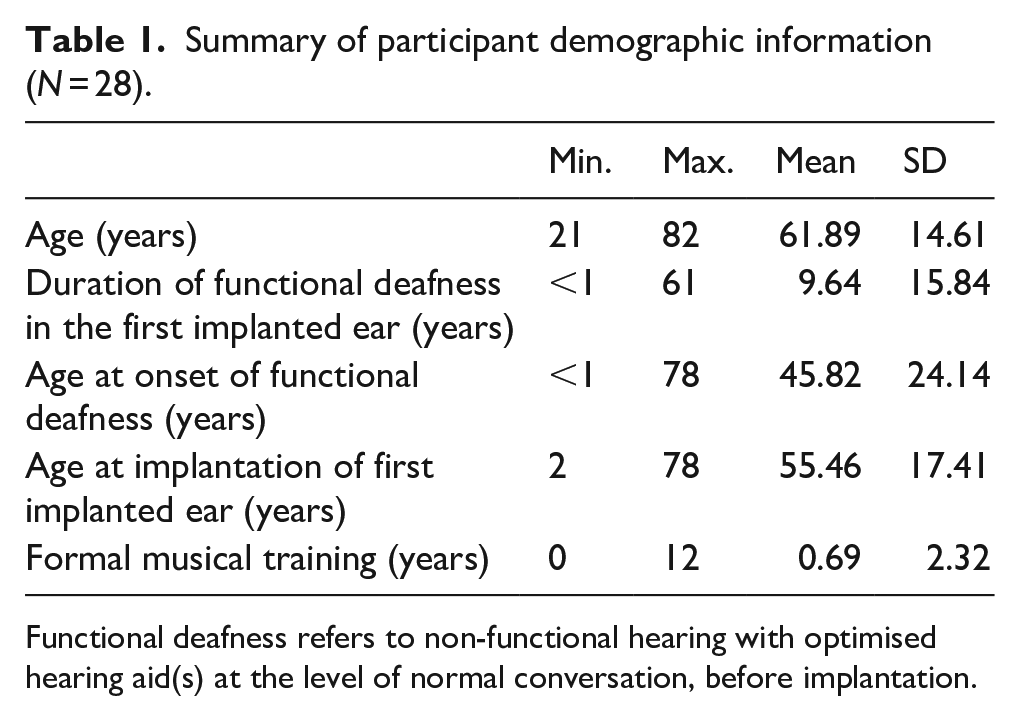
Functional deafness refers to non-functional hearing with optimised hearing aid(s) at the level of normal conversation, before implantation.
Participants were recruited as part of a larger music training study (CIMUGAME) by letter, advertisement on social media, or word-of-mouth. Participants were older than 18 years, spoke native-level Dutch, did not have any language disorders or dyslexia, had (corrected) normal visual acuity, and had been using at least one implant for at least 1 year. Further inclusion criteria were that the participants did not have more than 3 years of piano lessons and did not participate in any regular music-making activities within the last 3 years of enrollment in the study, did not regularly engage in serious gaming, were healthy enough to participate in weekly piano or video game lessons for 6 months.
Twenty-two participants had no formal musical training, with the remaining six as follows: (1) 12 years of flute lessons from the age of 10, (2) 2.5 years of piano lessons from the age of 9, (3) 2 years of organ lessons from the age of 12, (4) 1 year of piano lessons at the age of 12, (5) 1 year of piano lessons at the age of 47, (6) 3 months of voice lessons in adulthood (participant could not recall the exact year). The first 4 participants with instrument lessons had ended their formal musical training 44–45 years prior to enrollment in the study, the fifth participant ended lessons 20 years prior to enrollment, and none had been musically active in the interim years. The participant with voice lessons fulfilled the criteria of training being completed more than 3 years before the current study and was not involved in active music making before or since the voice lessons. This information is also summarised in Table 1.
There was no inclusion/exclusion based on age of implantation or whether deafness onset was pre- or post-lingual. We opted to include CI users with or without acoustic hearing, with single or bilateral implants, to reflect the real-world variability of auditory perception in the general CI population. As a result of this non-restricted inclusion, we ended up with a relatively heterogeneous group in both demographic factors (Table 1) and in unilateral, bimodal, and bilateral CI use. Sixteen participants who were unilaterally implanted reported no acoustic hearing (unilateral group). Ten participants who were unilaterally implanted reported to have some functional acoustic hearing or use of hearing aids (bimodal group). Two participants had bilateral CIs. Details of unilateral and bimodal groups are presented in Experiment 2a.
All participants were informed about the study and provided written consent. The study protocol was approved by the Medical Ethics Committee of the University Medical Centre Groningen (CIMUGAME, NL66549.042.20). Participants were reimbursed for travel costs to the testing location. As part of the larger study protocol, actual testing time was not reimbursed in monetary compensation but was in exchange for receiving free piano or video game lessons.
General procedures
As the present study was part of a larger musical training project (CIMUGAME), data were collected from the same population of CI adults in multiple experiments. All tests were conducted with the experimenter accompanying the participants and via an online-implementation using jspsych 6.1 software (de Leeuw, 2015), and data were automatically stored on a secure server. Data collection took place in a quiet setting, either in the lab or in a quiet room at the participant’s home or at a living facility. For Experiments 1a and 1b, participants conducted the vocal and musical emotion categorisation and voice cue discrimination tests on a Microsoft surface tablet using Logitech loudspeakers, placed approximately 10 cm to either side of the tablet. Participants were instructed to use their normal daily settings of the CI and, where applicable, also of the hearing aid. We did not plug the non- or second-implanted ear, nor turn off any devices, as part of the experiment. Before each test, participants adjusted the volume of their device(s) to a comfortable level during a loudness-adjustment prompt and were instructed not to adjust the volume for the entirety of each respective test. However, given the large test battery of the CIMUGAME project, as an exception, in the few occasions where participants reported stimuli to be too quiet for them to hear, we did allow an occasional volume adjustment. Screen backgrounds were dark grey or black with white text, where applicable. Response buttons were light grey buttons with dark grey or black labelling text. A progress bar showed how far along participants were during each test. For Experiments 2a–c, acoustic hearing was established by self-report from the participant, and medical files later corroborated acoustic hearing thresholds. For Experiment 2c, QoL ratings were extracted from the NCIQ questionnaires.
General analysis
All analyses were performed in R (R Core Team). Where applicable (across all experiments), multiple comparisons (post-hocs and sequential t-tests, as well as correlations) were corrected using the false-discovery-rate method (FDR; Benjamini & Hochberg, 1995). All t-tests are the Welch variant for unequal variance, and effect-sizes are reported using Cohen’s d. When analyses of variance (ANOVAs; type III) were conducted, they were performed using the “ez” package (Lawrence, 2016). The exact factors included in each ANOVA are described in the Results sections of each experiment. For each ANOVA, normality or sphericity was first tested to assess conformity with the assumptions required by the model. Effect sizes are reported as generalised eta-squared (Bakeman, 2005).
Experiment 1: vocal and musical emotion categorisation
Experiment 1a: vocal emotion
The aim of Experiment 1a was to assess vocal emotion perception in CI users. For vocal emotion, we used the EmoHI test, previously implemented with child CI users and NH adults with vocoders (Nagels et al., 2020) and with children with hearing aids (Rachman et al., in press). The EmoHI test uses basic emotion categories that fall in distinct arousal-valence quadrants to ensure task simplicity. Emotion categories are angry, happy, and sad, occupying three of the four arousal-valence quadrants (Figure 1; Table 2). A fourth stimuli category of neutral is also available as part of the EmoHI test; however, we did not include it here as neutrality by definition is towards the centre of the valence and arousal continua and would not contribute to assessing valence and arousal dimensions. Moreover, neutral seems to receive a disproportionate number of answers (37% of answers where 20% is chance, out of five categories including angry, happy, anxious, sad, and neutral) (Luo et al., 2007), indicating that it may be seen as a “default” categorisation response that would not help our investigation.
Vocal emotion categories for Experiment 1a.
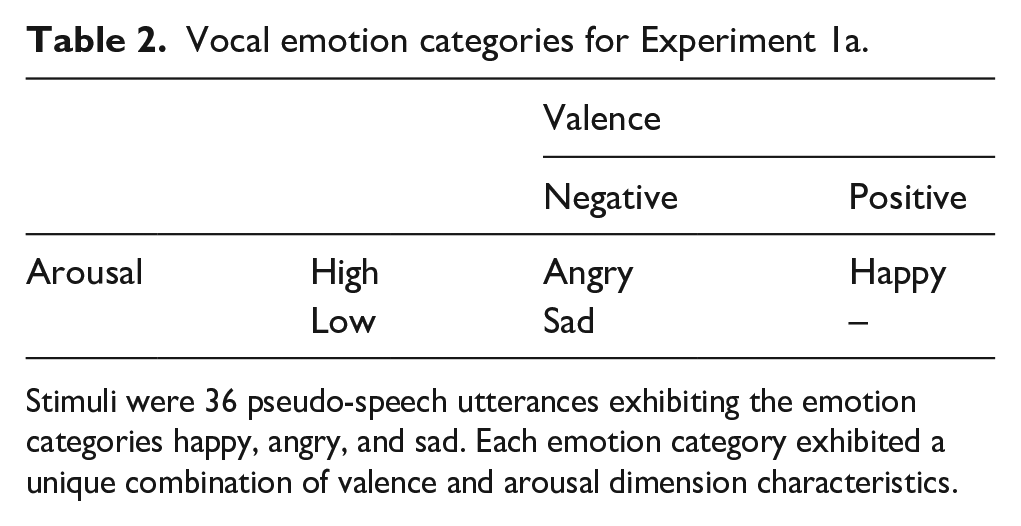
Stimuli were 36 pseudo-speech utterances exhibiting the emotion categories happy, angry, and sad. Each emotion category exhibited a unique combination of valence and arousal dimension characteristics.
CI adults previously confused emotion categories happy and scared, both high-arousal but with opposing valence (Chatterjee et al., 2015; Lin et al., 2022). In line with this, visual inspection of EmoHI data from children with hearing aids has indicated that sensitivity to happy and angry was similar (Rachman et al., in press). In that same study, sensitivity to sadness was comparatively increased, potentially due to being the only low-arousal emotion category.
Therefore, for Experiment 1a, we hypothesised that vocal emotions happy and angry would be confused because they are both high-arousal emotions (e.g., Lin et al., 2022), while we expect that sadness would have increased performance in line with performance of this task with other hearing-loss populations (Rachman et al., in press).
Materials and methods
The stimuli consisted of pseudo-speech sentences “Koun se mina lod belam” and “Nekal ibam soud molen” that are not meaningful in any Indo-European languages and based on the Geneva Multimodal Emotion Portrayal (GEMEP) Corpus materials by Bänziger et al. (2012). Materials were taken from the EmoHI vocal emotion perception test, described by Nagels et al. (2020). Stimuli were spoken by four native Dutch speakers (two male, two female) who were native monolingual speakers of Dutch without any discernible regional accent. Speakers were instructed to produce the sentences in a happy, sad, angry, or neutral (not used in this study) manner using emotional scripts that were also used for the GEMEP corpus stimuli (Bänziger & Scherer, 2010). The three emotions happy, angry, and sad were selected for the widest applicability across age ranges (Widen & Russell, 2004) and for maximum comparability of the EmoHI test across populations of differing hearing profiles (Nagels et al., 2020). Each speaker contributed three pseudo-speech sentences (two of one sentence, one of the other) for each emotion category. Stimuli were recorded in an anechoic room at a sampling rate of 44.1 kHz and equalised in root mean square. Speakers provided written informed consent for the distribution and sharing of the recorded materials.
For practice, three additional stimuli (one per emotion, one production per speaker) were used for the training session, but not included in the experimental phase. For the experiment, 36 vocal emotion stimuli were used, comprising the categories happy, sad, and angry, with 12 items in each category (4 speakers × 3 utterances). Each emotion category comprised both arousal and valence dimensions: either high or low arousal, or positive or negative valence (Table 2).
Procedure
Procedures were as reported in the work of Nagels et al. (2020), with the difference that the current interface did not have a child-directed game-like environment. Participants were instructed to listen to the pseudo-sentences and determine whether the voice of the speaker sounded happy, sad, or angry, by clicking on one of three corresponding buttons on the screen labelled “blij”/happy, “verdrietig”/sad, “boos”/angry. Practice items, but not experimental items, were presented with feedback. Experiment items were presented in randomised order in one block of approximately 6–8 minutes.
Statistical analyses
The analysis techniques described in the “General analysis” section above were applied to categorisation sensitivity, d,’ derived from raw categorisation performance following the signal detection theory (Green & Swets, 1988; Macmillan & Creelman, 2004) for each emotion category. For a given emotion category, the d’ was calculated by considering the correct categorisation responses as hits (for a given row of the confusion matrix, the entry terms on the diagonal) and incorrect categorisation responses, where the considered emotion was responded while not being presented, as false-alarms (the terms off the diagonal on the same row). The d’ was calculated as the difference between the z-transformed hit rate and false-alarm rate, divided by
To further understand the type of error in categorisation that participants made, the raw data of emotion categorisation were compiled as confusion matrices. In a confusion matrix, a “perfect score” would be represented as a diagonal line with points only on the same emotion category for both “presented” (x-axis) and “responded” (y-axis). Errors are represented by data points off the diagonal, or “confusions,” where a different category was responded from what was presented.
Results
In Figure 2, Panel a shows the d’ scores for vocal emotion categorisation. On average, across all participants, while all emotions yielded categorisation significantly better than chance (t[27] > 4.14, pFDR < .001), the category “sad” was best recognised (average d’ = 0.82), followed by “happy” (d’ = 0.33), and “angry” (d’ = 0.31).
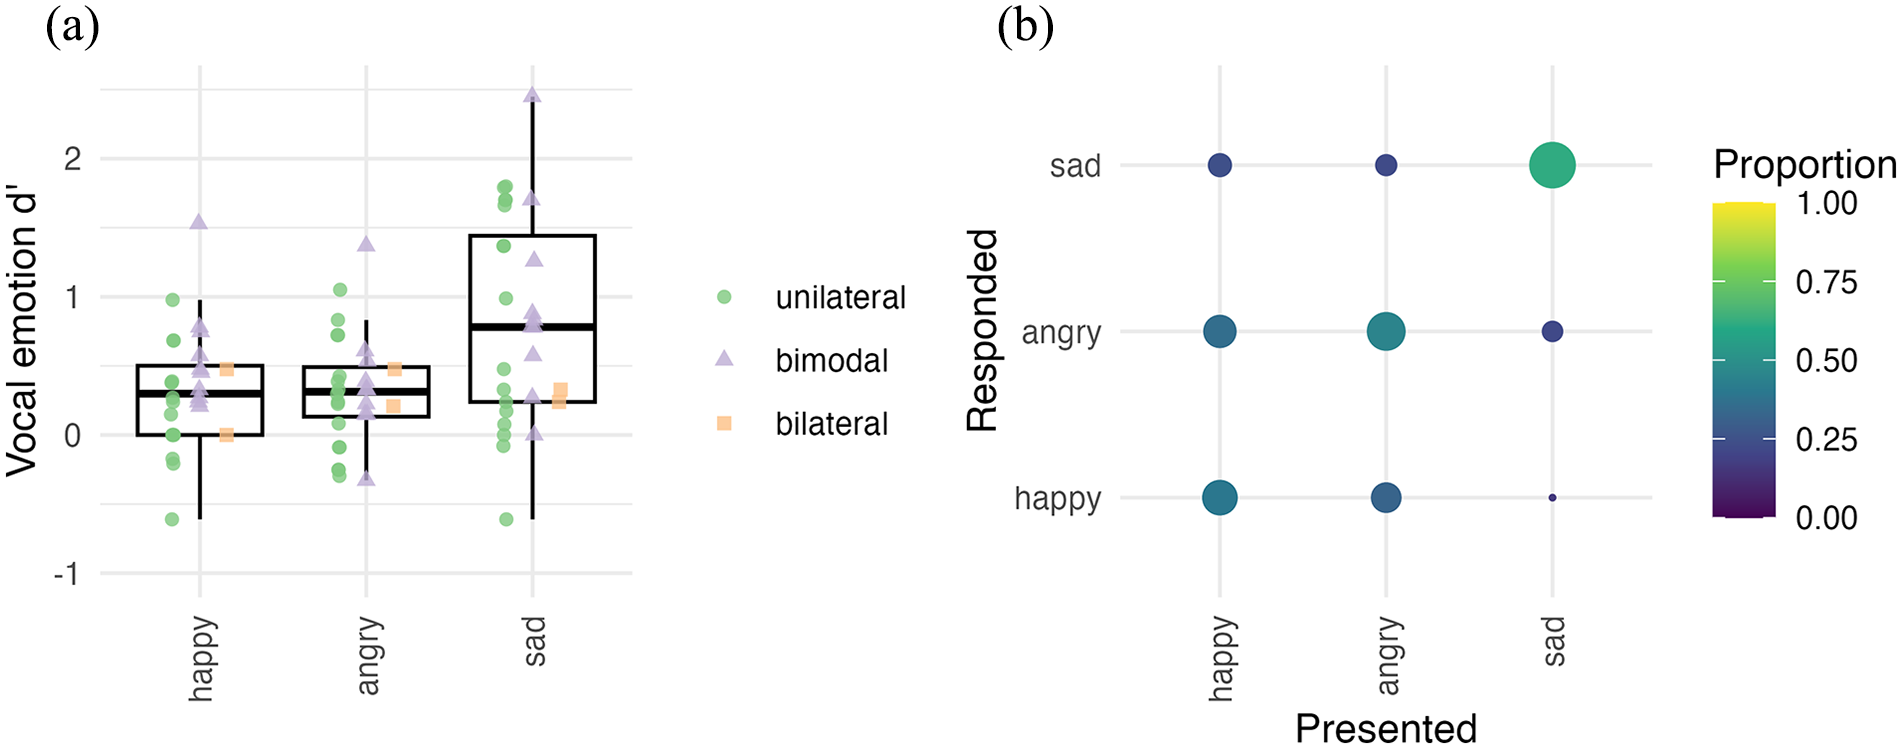
Vocal emotion categorisation. (a) Sensitivity (d’) for vocal emotion perception across all participants (N = 28). The horizontal line in the boxplot shows the median d’ across participants. The box extends from the 25th to the 75th percentile, and the whiskers extend to the value most remote from the median within 1.5 times the interquartile range. Individual data points are overlaid on top of the boxplots with unique shape and colour for unilateral (green), bimodal (lilac), and bilateral (orange) implant users, respectively. d’ = 0 denotes the chance level. (b) Confusion matrix shown for vocal emotion categorisation for all participants (N = 28). The size and colour of each matrix entry is proportional to the number of relevant responses. The presented and responded emotion categories are listed on the x-axis and y-axis, respectively.
The d’ values were analysed with a repeated-measure ANOVA, with the factor Emotion category (“happy,” “angry,” “sad”) as a repeated factor within participants. The ANOVA confirmed a significant main effect of emotion: sensitivity was different across presented emotion categories (F(2,54) = 16.2, p < .001,
In Figure 2, Panel b shows the confusion matrix with raw data for vocal emotion categorisation, averaged across all participants (n = 28). Visual inspection of data indicates that confusion of emotion categories was more along the arousal dimension than the valence dimension. Emotion categories that shared an arousal class (happy and angry are both high arousal) were systematically confused, whereas the emotion category with a unique arousal class (sadness is low arousal) was seldom confused with other categories. This specific pattern of confusion is in line with the observation that “sad,” the only low-arousal emotion category presented, yielded significantly higher categorisation sensitivity than the other two emotion categories, which are both high arousal.
Discussion
Experiment 1a assessed vocal emotion perception in adult CI users. All emotion categories, on average, were categorised above chance level. However, when individual scores were inspected, there were some at chance level for some participants, and overall, there was a large variation in categorisation scores across individual participants. Upon visual inspection, the d’ range in current adult CI user results was similar to that of CI children aged 4–16 years (Nagels et al., 2020), a range that also overlapped with NH children but was below NH adults. This fits previous reports of vocal emotion perception in populations with hearing loss and hearing device users, namely that there is a wide individual variation in vocal emotion categorisation but generally with lower overall scores than NH peers (reviewed in the study by Jiam et al., 2017). Sad was significantly better categorised than happy or angry. In a previous study using the EmoHI test with children with hearing aids, visual inspection of the emotion category values (assessed according to age) appeared to show the same pattern (Rachman et al., in press). These results are in line with previous results showing that CI users confused high-arousal happy and scared emotion categories (Chatterjee et al., 2015; Lin et al., 2022).
Experiment 1b: musical emotion categorisation
The aim of Experiment 1b was to assess musical emotion perception in adult CI users. We used the same musical excerpts and interface from our previous study with NH participants (Harding et al., 2023). These excerpts were taken from classical music pieces representing four emotion categories, joy, fear, serenity, and sadness, which occupy all four quadrants in the valence and arousal dimensional space (Figure 1; Table 2; Bigand et al., 2005).
When NH participants categorised musical emotion in the study by Harding et al. (2023), a main effect of emotion showed that for both full acoustic stimuli and stimuli vocoded to approximate CI hearing, joy and fear had higher sensitivity than serenity and sadness. When tested with full-acoustic excerpts, arousal and valence dimensions both were accurately perceived, arousal being perceived slightly better than valence. In contrast, when tested with vocoded excerpts, perception of arousal decreased slightly while perception of valence was at floor.
Therefore in the current study, we hypothesised that for musical emotion categorisation with CI users, joy and fear would have higher sensitivity than serenity and sadness, and arousal would be significantly better perceived than valence, if valence could be perceived at all.
Materials and methods
Stimuli were 40 classical musical excerpts expressing the four emotion categories: joy, fear, serenity, and sadness (10 items per category). Each category was of either high or low arousal, or positive or negative valence (Table 3). The original excerpts were all selected from recordings of orchestral arrangements containing multiple instruments and no vocals. The original stimuli were used by Bigand et al. (2005), Lévêque et al. (2018), Liégeois-Chauvel et al. (2014), Pralus et al. (2020), and Harding et al. (2023). 3 The stimuli we used in this study were a subset of the stimuli reported by Harding et al. (2023). Harding et al. (2023) indicated that the first and second halves of 20-second stimuli were similarly categorised in the emotions they expressed. Thus, only 10-second excerpts, randomly chosen from the first or second half of the original 20-second excerpt, were used to maintain shorter testing times in anticipation of testing with CI users. Especially as the test was part of a larger study and test battery, we wanted to prevent potential fatigue from long test durations.
Musical emotion categories for Experiment 1b.
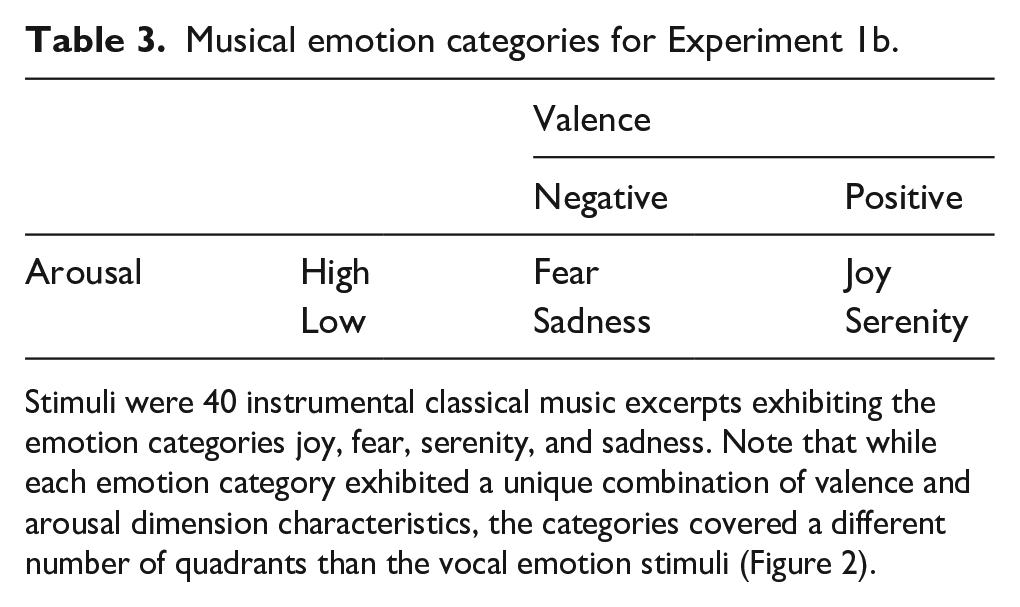
Stimuli were 40 instrumental classical music excerpts exhibiting the emotion categories joy, fear, serenity, and sadness. Note that while each emotion category exhibited a unique combination of valence and arousal dimension characteristics, the categories covered a different number of quadrants than the vocal emotion stimuli (Figure 2).
Training items were eight other items, not used in the experimental phase, which were comprised of two excerpts each of four works with iconic emotion status: Joy (Vivaldi’s Four Seasons: Spring), Serenity (Monoman’s Meditation), Fear (Mussorgsky’s Night on Bald Mountain), Sadness (Beethoven’s Moonlight Sonata).
As described by Harding et al. (2023, Supplementary Material S4), loudness of the excerpts was adjusted, as the original recordings were obtained from different recordings, and hence had different loudness values that were not aligned with the intended loudness of the original piece. In NH, this is not an issue for testing because they can perceive acoustic details in the excerpts that inform them on intended loudness, i.e., how loud the musicians are playing as opposed to the physical intensity level of the recording. However, in CIs, these acoustic details are most likely to be lost, which could lead listeners to rely solely on physical loudness rather than intended loudness. Since intended loudness is a cue that is relevant for the expressed emotion of the musical piece, a mismatch between intended loudness and physical loudness can be a misleading cue for CI users. To account for this, a loudness adjustment was applied to re-align the physical loudness with the putative intended loudness estimated by listeners with musical expertise. Eleven musicians with different levels of musical expertise rated the softest and loudest parts of each piece by clicking buttons ranging from very soft (pianissimo) to very loud (fortissimo). These ratings were correlated with physical loudness computed with the Cambridge loudness model (Glasberg & Moore, 2002).
Procedure
Musical emotion categorisation was tested with the same game-like interface and methods described by Harding et al. (2023), where participants were asked to “help” aliens understand earth music. Participants were instructed to listen to a musical excerpt and to categorise which emotion was evoked by the music, by pressing one of four response buttons corresponding with the emotions “vreugde”/joy, “droefheid”/sadness, “angst”/fear, “kalmte 4 ”/serenity. Training items were presented with feedback, but during the test, there was no feedback on correctness of categorisation. Each emotion category was tested with 10 excerpts, resulting in a total of 40 trials per participant. Stimuli items were presented in random order per participant in two blocks of 20 items each, separated by a self-paced break.
After each categorisation trial, a confidence in the categorisation decision was assessed for maximum comparability with the paradigm of Harding et al. (2023). After each categorisation response, participants were presented with an horizontal analogue confidence scale—the leftmost position of the scale labelled 1 “Heel weinig vertrouwen”/(Very little confidence), and the rightmost position labelled 7 “Heel veel vertrouwen”/(A great deal of confidence). Tick marks were at integers from 1 to 7. Participants were asked “Met hoeveel vertrouwen heeft u deze categorisering gemaakt?”/(With how much confidence did you make this categorisation?). A blue bar always started at 4, the midpoint, and participants had to drag the bar to the correct location for their answer. Any location on the scale was possible, i.e., not only at displayed numbers 1–7. Ratings were rescaled from 0 to 100 for analysis. Confidence ratings are reported in Supplementary Material S1.
On average, the test lasted approximately 13 minutes, including the self-paced break. Participants took approximately 3 minutes for the break.
Statistical analyses
Like for the vocal emotion task in Experiment 1a, the raw responses were converted to d.’ Given the number of repetitions per emotion, the maximum theoretical d’ value is here 2.33. The other statistical methods are identical to those of Experiment 1a.
Results
In Figure 3, Panel a shows the d’ scores for musical emotion categorisation. Mean sensitivity (d’) was significantly above zero, i.e., the scores were better than chance, in each emotion category (joy, fear, serenity, sadness) (t’s[28] > 7.95, pFDR’s < .0001), indicating that participants could carry out the task.
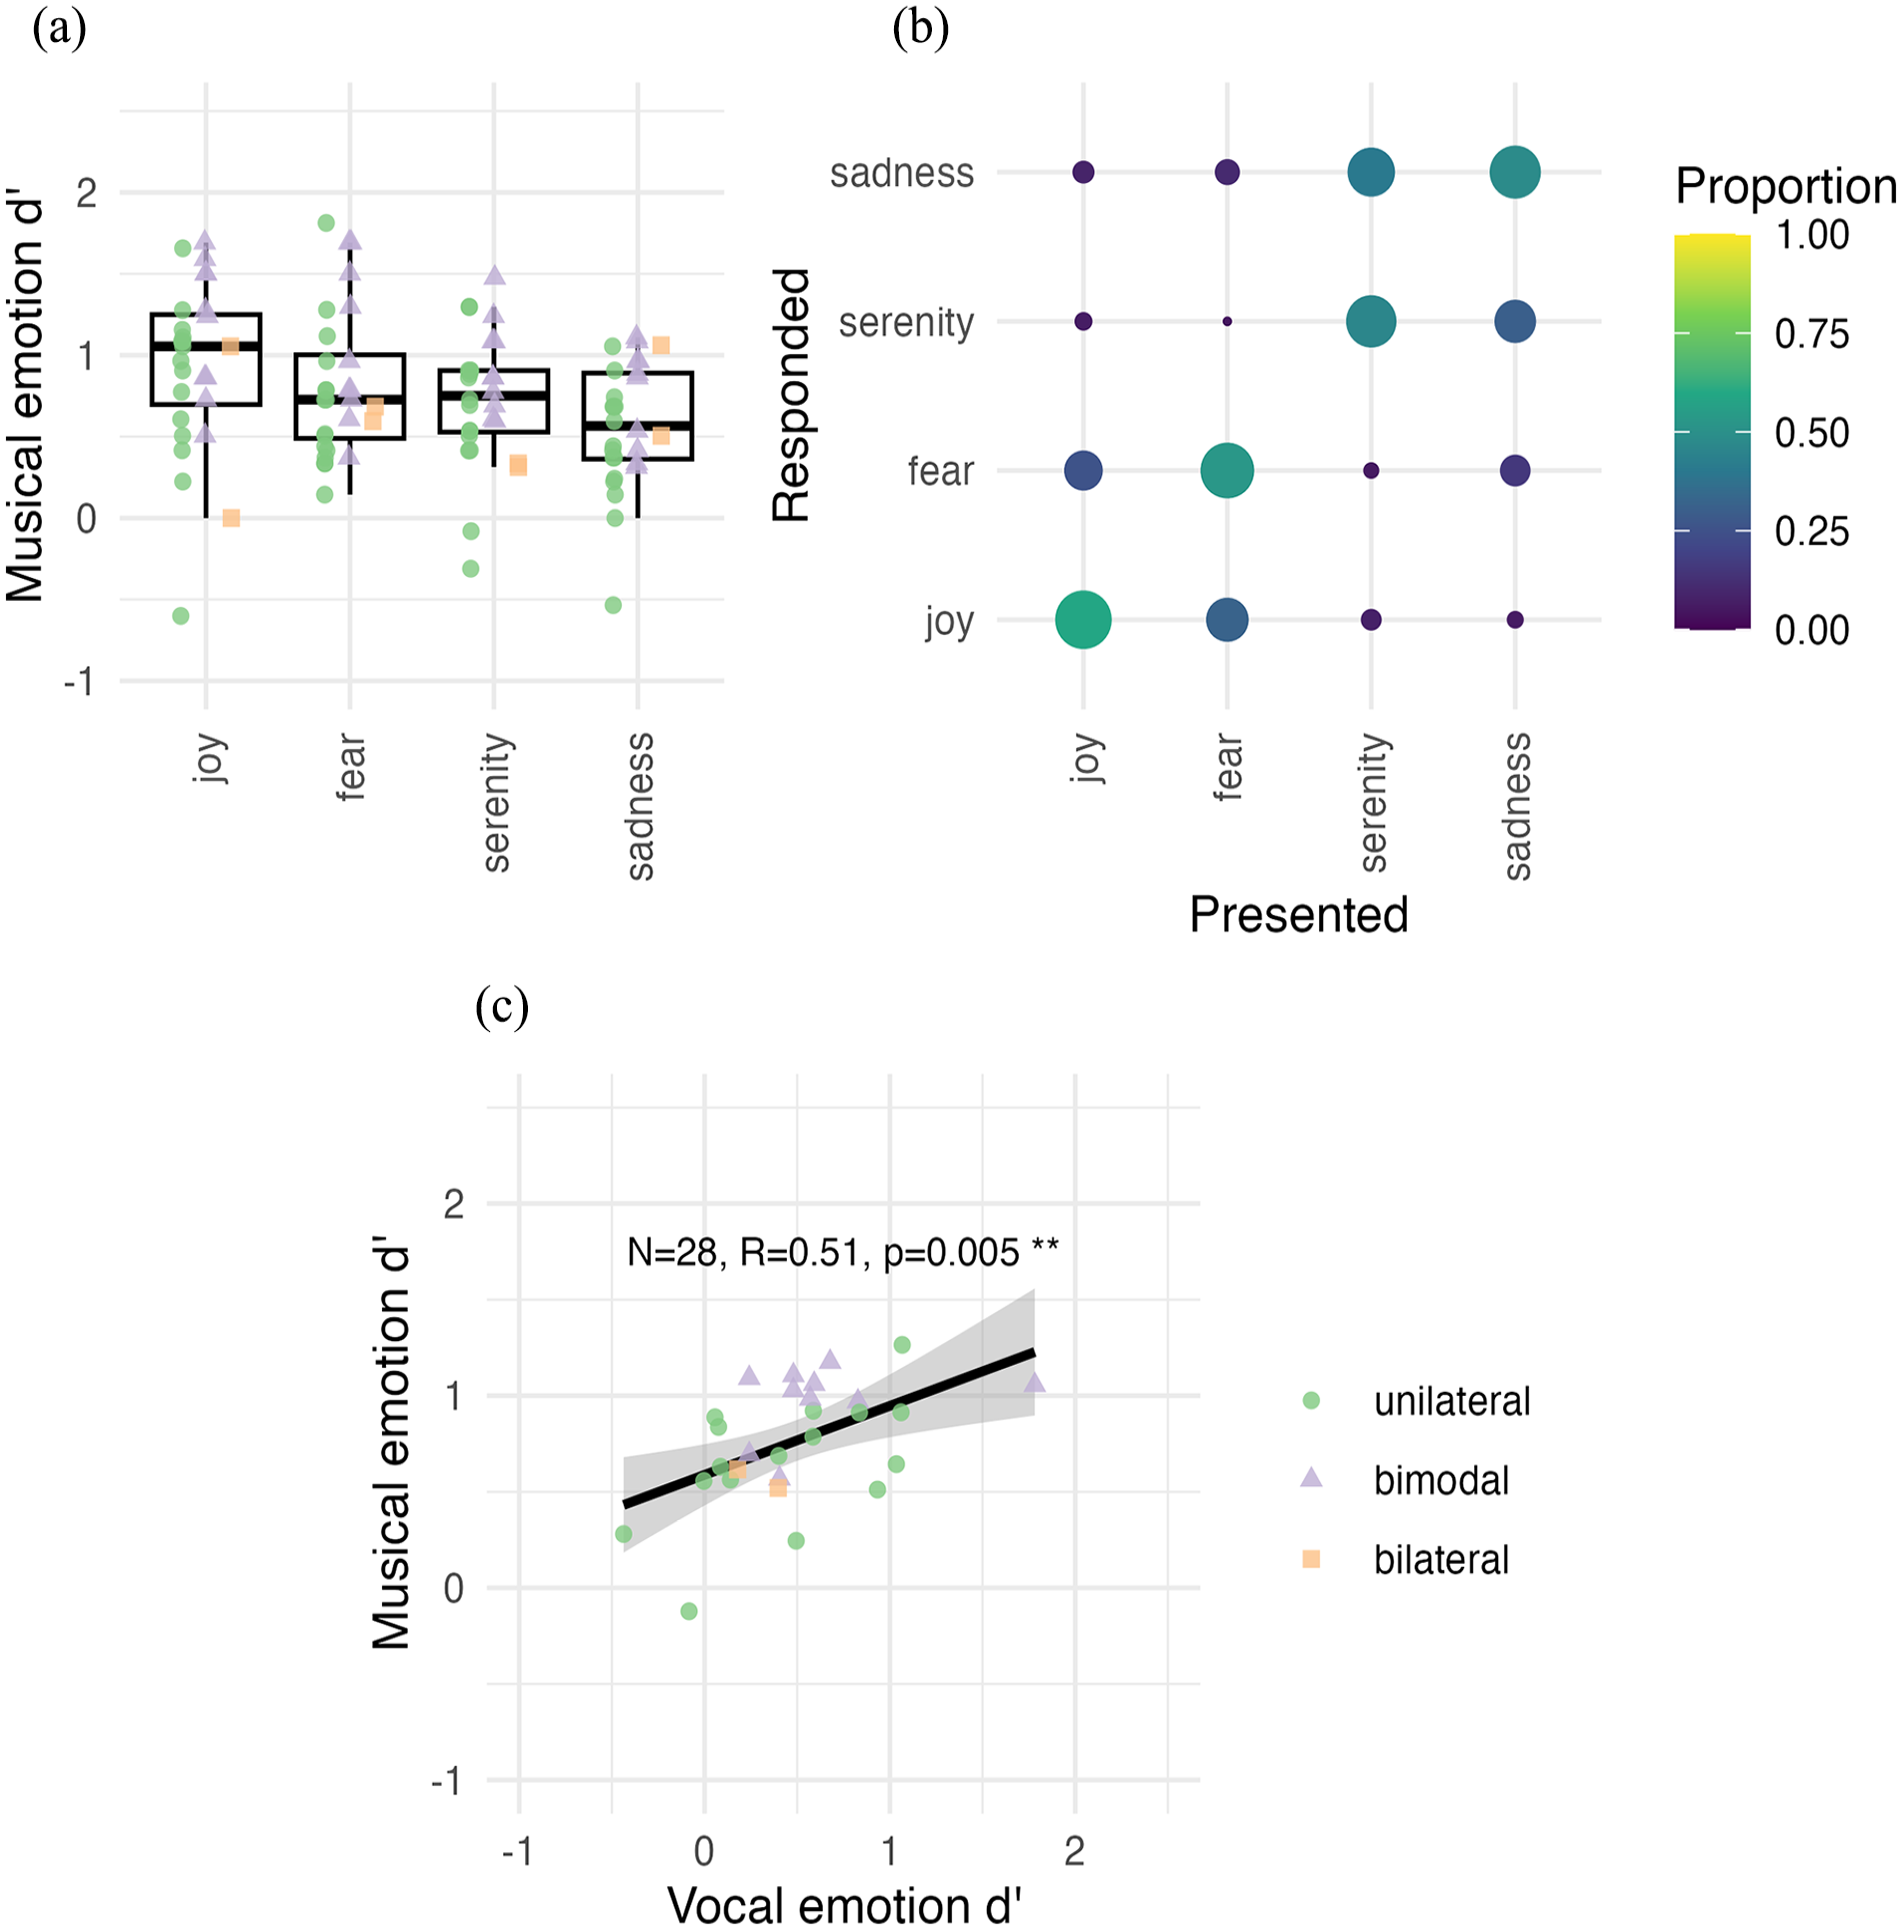
Musical emotion categorisation. (a) Sensitivity (d’) for vocal emotion categories across all participants (N = 28). The horizontal line in the boxplot shows the median d’ across participants. The box extends from the 25th to the 75th percentile, and the whiskers extend to the value most remote from the median within 1.5 times the interquartile range. Individual data points are overlaid on top of the boxplots with a unique shape and colour for unilateral (green), bimodal (lilac), and bilateral (orange) implant users, respectively. d’ = 0 denotes the chance level. (b) The confusion matrix is shown for musical emotion categorisation for all participants (N = 28). The size and colour of each matrix entry is proportional to the number of relevant responses. The presented and responded emotion categories are listed on the x-axis and y-axis, respectively. (c) Correlation of average d’ across emotion categories for vocal and musical emotion categorisation, shown across all participants (N = 28). The black line shows the regression along with the 95% confidence interval.
A repeated-measure ANOVA on individual d’ values with the Emotion category as the repeated factor within participants showed that some emotions were better categorised than others (F(3,81) = 5.05, p = .003,
In Figure 3, Panel b shows the confusion matrices with raw data for musical emotion categorisation, averaged across all participants (N = 28). A visual inspection indicates that confusion of emotion categories occurred primarily within the arousal dimension (joy was confused with fear and vice versa, and serenity was confused with sadness and vice versa).
To assess within-participant perceptual similarities between vocal and musical emotion perception, musical emotion d’ was further entered into a Pearson’s product-moment correlation with vocal emotion d’ scores. d’ Scores were moderately correlated across vocal and musical emotion categorisation tasks (R = 0.51, p = .005; Figure 3, Panel c). Bilateral CI users were included in this correlation (N = 28).
Discussion
Experiment 1b assessed musical emotion perception in adult CI users. All musical emotion categories, on average, were categorised above chance level; however, there was a large variability of d’ scores across individual participants, and for some emotion categories, some participants did show chance-level scores. The d’ range of current adult CI users resembled the d’ range of vocoded excerpts reported by Harding et al. (2023), demonstrating the viability of vocoder paradigms as a proxy of adult CI user musical emotion categorisation. Joy was categorised with the most sensitivity, and sadness with the least. This finding generally aligns with visual inspection of accuracy scores in the study by Ambert-Dahan et al. (2015) (d’ and mean scores not reported), where CI users categorised musical emotion in classical excerpts with four emotions: happiness, fear, sadness, and peacefulness. The result is also in line with that of Paquette et al. (2018), who reported joy to be the only emotion category identified above chance by CI users in short note bursts containing four emotion categories: joy, fear, neutral, and sad. As indicated by the confusion matrix, the perception of musical excerpts as high (joy, fear) or low arousal (serenity, sadness) was easier than perceiving musical excerpts as positive (happy, serenity) or negative (fear, sadness) valence. These findings are also in agreement with previously reported CI users’ categorisation of happy/sad music emotions in piano melodies with chordal accompaniment, where their categorisation relied on tempo cues but not on modal cues (Caldwell et al., 2015; D’Onofrio et al., 2020; Giannantonio et al., 2015; Hopyan et al., 2016). Thus, we can link findings from these previous studies beyond lab conditions to a four-emotion category paradigm with natural orchestral pieces exhibiting each emotion.
Experiment 2: individual differences with respect to acoustic hearing, voice cue discrimination, and QoL
Experiment 2a: acoustic hearing
As explained in the general introduction, in CI users, the presence of even very limited low-frequency acoustic hearing can contribute to increased perception of voice cues (Başkent et al., 2018), which is potentially relevant for vocal emotion perception. The presence of acoustic hearing has previously been shown to improve CI users’ musical emotion categorisation (D’Onofrio et al., 2020; Giannantonio et al., 2015) and music appreciation (Fata et al., 2009; Gfeller et al., 2006) as well. We therefore explored in Experiment 2a whether vocal and musical emotion perception scores might be higher in the bimodal CI user group than in the unilateral CI group.
Materials and methods
Participants
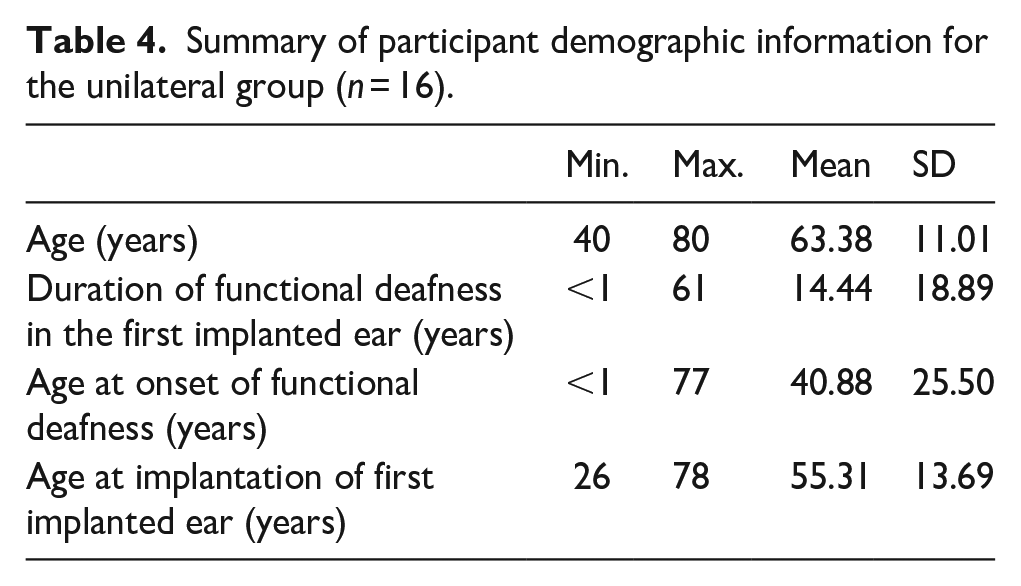
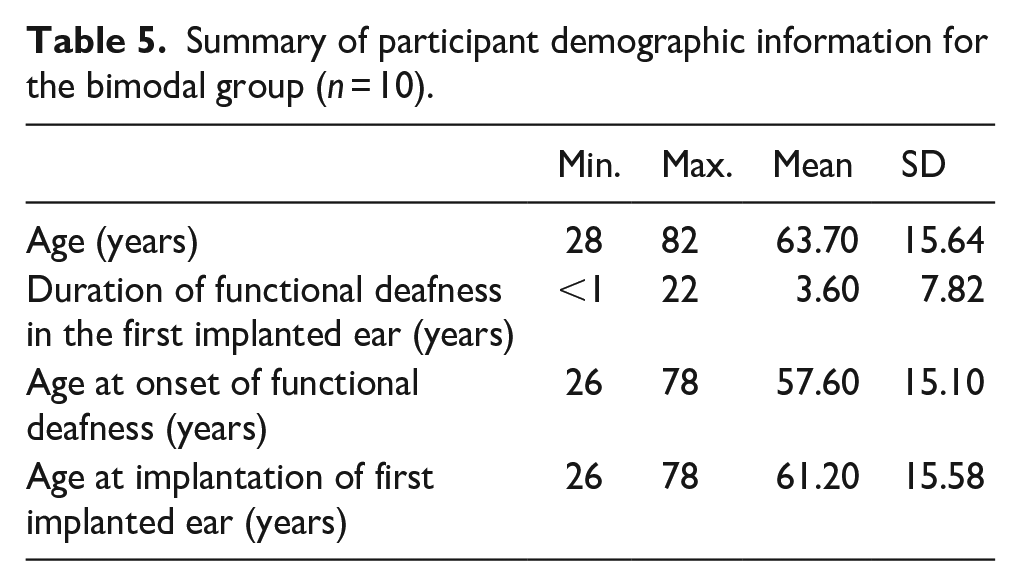
Sixteen participants were unilaterally implanted and reported to have no acoustic hearing (unilateral group). Ten participants were bimodal implant users, i.e., they were also unilaterally implanted, but reported having some functional acoustic hearing or the use of hearing aids (bimodal group). The two bilateral CI users’ data were excluded as they did not fall in either category of unilateral or bimodal CI user. Tables 4 and 5 present the demographic information for unilateral and bimodal groups separately. We did not include formal musical training in these tables since the range was already small, as was reported in Table 1.
Summary of participant demographic information for the unilateral group (n = 16).
Summary of participant demographic information for the bimodal group (n = 10).
Materials were the vocal (Experiment 1a) and musical (Experiment 1b) emotion tests.
Results
Figure 4 shows the vocal and musical emotion categorisation scores (Panels a and b, respectively) for unilateral (n = 16) and bimodal (n = 10) CI users. The two bilateral CI users’ data were excluded as they did not fall in either category of unilateral or bimodal CI user.
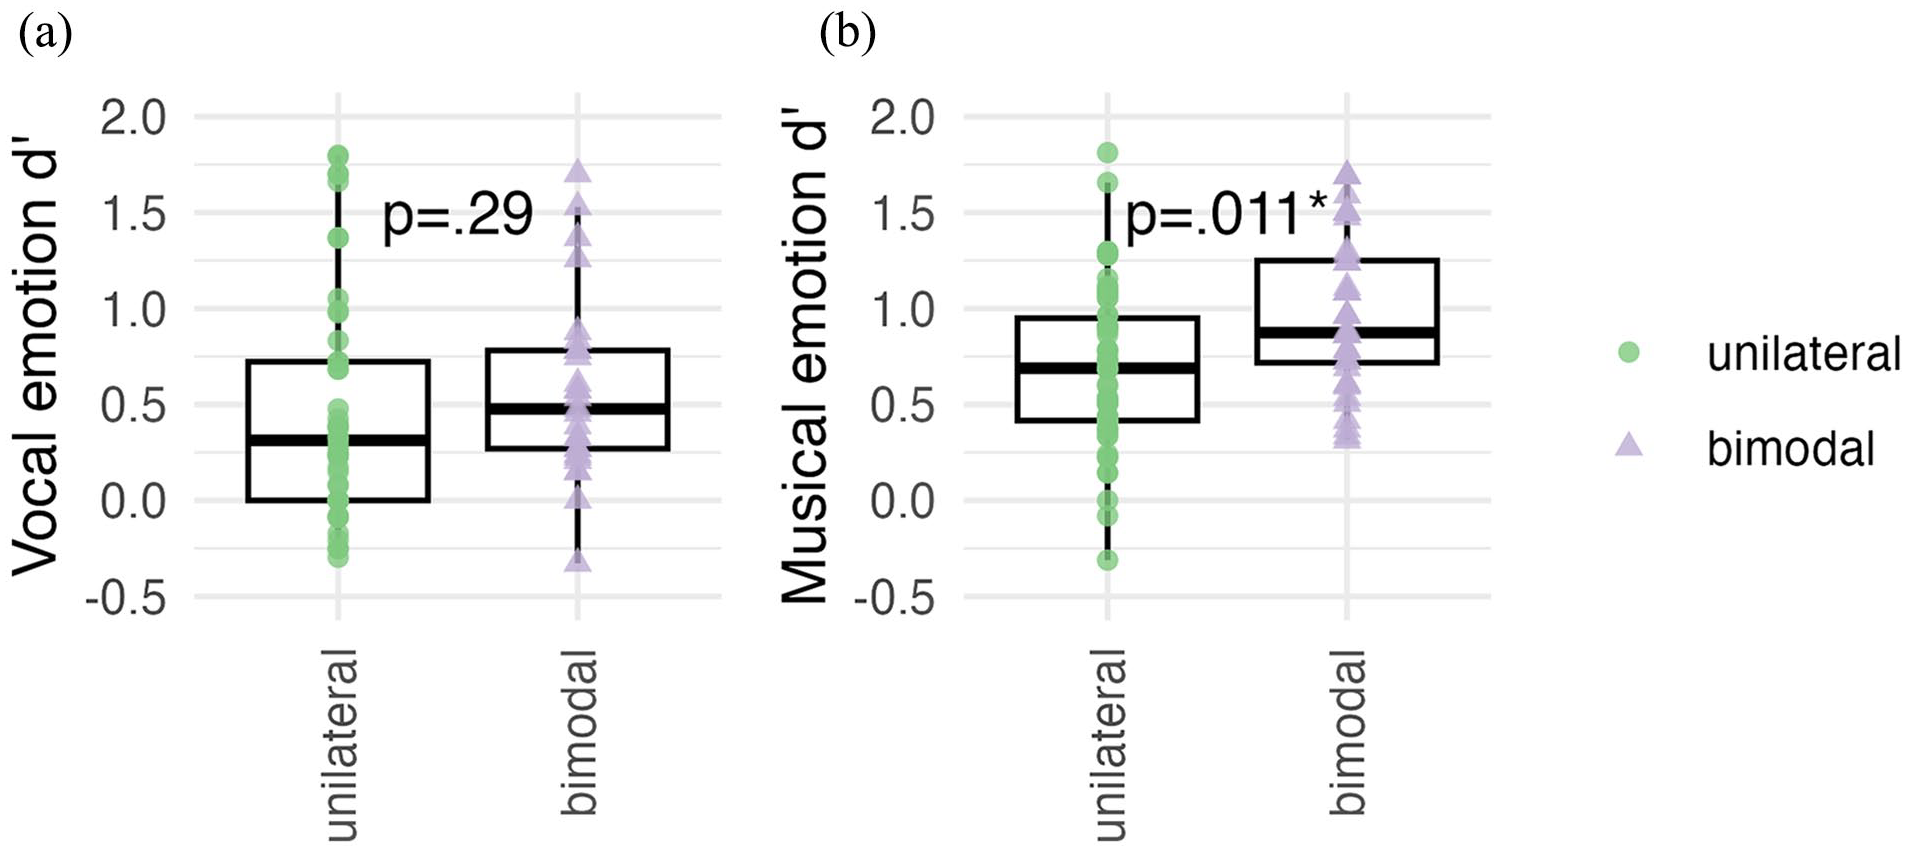
Emotion categorisation d’ scores shown separately for the unilateral (green; n = 16) and bimodal (lilac; n = 10) participant groups for (a) vocal and (b) musical emotion perception. d’ Scores from the bilateral (n = 2) implant user group are not included.
For vocal emotion categorisation, a one-way ANOVA with the factor Acoustic Hearing (unilateral, bimodal) compared overall vocal categorisation sensitivity (d’) in unilateral and bimodal participants. The average d’ of the bimodal group was 0.63, against 0.43 for the unilateral group; however, this difference was not significant, F(1,24), p = .290,
For musical emotion categorisation, a one-way ANOVA with the factor Acoustic Hearing (unilateral, bimodal) compared overall musical categorisation sensitivity (d’) in the two groups. The average d’ of the bimodal group was 0.97, against 0.66 for the unilateral group, and this difference was significant, F(1,24) = 7.50, p = .011,
Discussion
Contrary to our expectation, we did not observe a significant difference in vocal emotion perception between unilateral and bimodal CI users. This is at odds with previous findings indicating that the addition of low-frequency acoustic hearing improves the perception of voice pitch (Başkent et al., 2018). This is assuming that voice cue discrimination would be improved in bimodal CI users, and that such improvement would be functionally relevant for the perception of emotion categories; however, this may indeed not be the case, a possibility that is followed up in Experiment 2b.
In line with our expectation, overall musical categorisation d’ was higher with the bimodal CI group than that with the unilateral CI group. This is in line with previous reports suggesting that the presence of acoustic hearing improves music perception in CI users (e.g., Fata et al., 2009).
Experiment 2b: voice pitch and VTL
As outlined in the general introduction, CI user’s capacity to perceive specific voice cues could be a predictor of vocal and musical emotion perception in as much as they reflect the ability to perceive acoustic details. Therefore, Experiment 2b reports JNDs for voice cues of F0 and VTL and their correlations with vocal and musical emotion categorisation d’. We also hypothesised that the presence of acoustic hearing would result in bimodal users having lower (better) voice cue discrimination thresholds, and we therefore report JNDs of unilateral and bimodal CI users separately.
Materials and methods
Materials
Stimuli used during the voice discrimination task consisted of three-syllable consonant-vowels (CVCVCV). Individual CVs were spliced from the items in the Nederlandse Vereniging voor Audiologie (NVA) corpus, which consists of meaningful CVC Dutch words (Bosmana & Smoorenburg, 1995) as reported by Gaudrain and Başkent (2015, 2018). One of the 61 extracted syllables used in the original study (Gaudrain & Başkent, 2015) was excluded because the sound quality was judged insufficient, resulting in a total of 60 CVs reasonably covering the Dutch phonological inventory. Average F0 and VTL were manipulated via analysis-resynthesis as implemented in the WORLD vocoder (Morise et al., 2016). The duration of the individual CV syllables originally varied between 142 and 200 ms, but they were all normalised to 200 ms during the WORLD re-synthesis. To produce the CVCVCV triplet, for each trial, three individual CV syllables were randomly selected and concatenated with a separation of 50 ms of silence.
Procedure
The voice discrimination test was adapted from the work of Gaudrain and Başkent (2015, 2018) and was identical to that used by Nagels et al. (2020), except for the child-friendly game-like graphical interface that was used with children and for the fact that no extra F0 contour was added on the triplet of syllables. JND measurements were acquired through an adaptive 3I-3AFC (three-interval, three-alternative forced choice) paradigm with a two-down, one-up rule (aiming at the 70.7% threshold).
In each trial, participants heard three CVCVCV triplets, one of which (the odd-one-out) differed from the other two (the reference voice) in average F0 or VTL. The triplets were separated by a 500-ms silence. In total, the duration of the three triplets was approximately 3,100 ms. Triplets presented during one trial were the same for all three intervals. Participants were presented with response buttons labelled “1,” “2,” or “3” while the three triplets played. The response button lit up during the playback of the corresponding triplet, with the target voice randomly placed among the first, second, or third triplet choice. The participants were instructed to click on the button that corresponded to the stimulus that was different from the two others. Once the participant made a choice, visual feedback was provided by the response button, turning green and bouncing vertically for correct responses, or red and shaking horizontally for incorrect ones.
The voice differences between the odd-one-out and the reference voice were produced by adjusting the F0 and VTL voice cue parameters using the WORLD vocoder as described earlier. The initial voice difference in each adaptive run was large, 12 semitones (st), in the direction of a male voice (the reference voice with a step size of 2 st). Step-size adjustments occurred after every 15 trials or when the voice difference became smaller than twice the step size, dividing the step size by √2 to prevent negative differences. The maximum measurable difference was 25 semitones for both F0 and VTL dimensions. The adaptive run was repeated in a second block.
Each adaptive run ended after eight reversals, with JNDs calculated from the last six reversals by taking their geometric average. If the number of trials exceeded the maximum number of trials of 150, or the voice difference became too large due to consecutive incorrect responses, the test was terminated, and its value was treated as missing data.
To acquaint participants with the task, four training trials (not part of the main task) were administered with large differences in F0 and VTL. The experiment comprised two 5-minute blocks of stimuli separated by a self-paced break and lasted about 10 minutes.
Statistical analyses
For two participants, the adaptive runs did not converge, leading to missing data values. This resulted in 26 participants (14 unilateral, 10 bimodal, 2 bilateral) with F0 values and 27 participants (15 unilateral, 10 bimodal, 2 bilateral) with VTL values. JNDs were log-transformed to create a normal distribution for statistics, but VTL JNDs still did not pass a Shapiro-Wilk test of normality; therefore, non-parametric tests were used for statistical analyses. When assessing the effect of acoustic hearing, the two bilateral participants were excluded. Wilcoxon tests were used to compare JNDs across unilateral and bimodal groups, and Spearman correlations were used to assess associations between JNDs and vocal and musical emotion d’ from Experiments 1a and 1b.
Results
In Figure 5, Panels a and d show the voice cue JNDs (st) for F0 and VTL. F0 JNDs were not significantly different between unilateral (n = 14) and bimodal (n = 10) groups (W = 76, p = .97). Similarly, VTL JNDs were not significantly different between unilateral (n = 15) and bimodal (n = 10) groups (W = 79, p = .63).
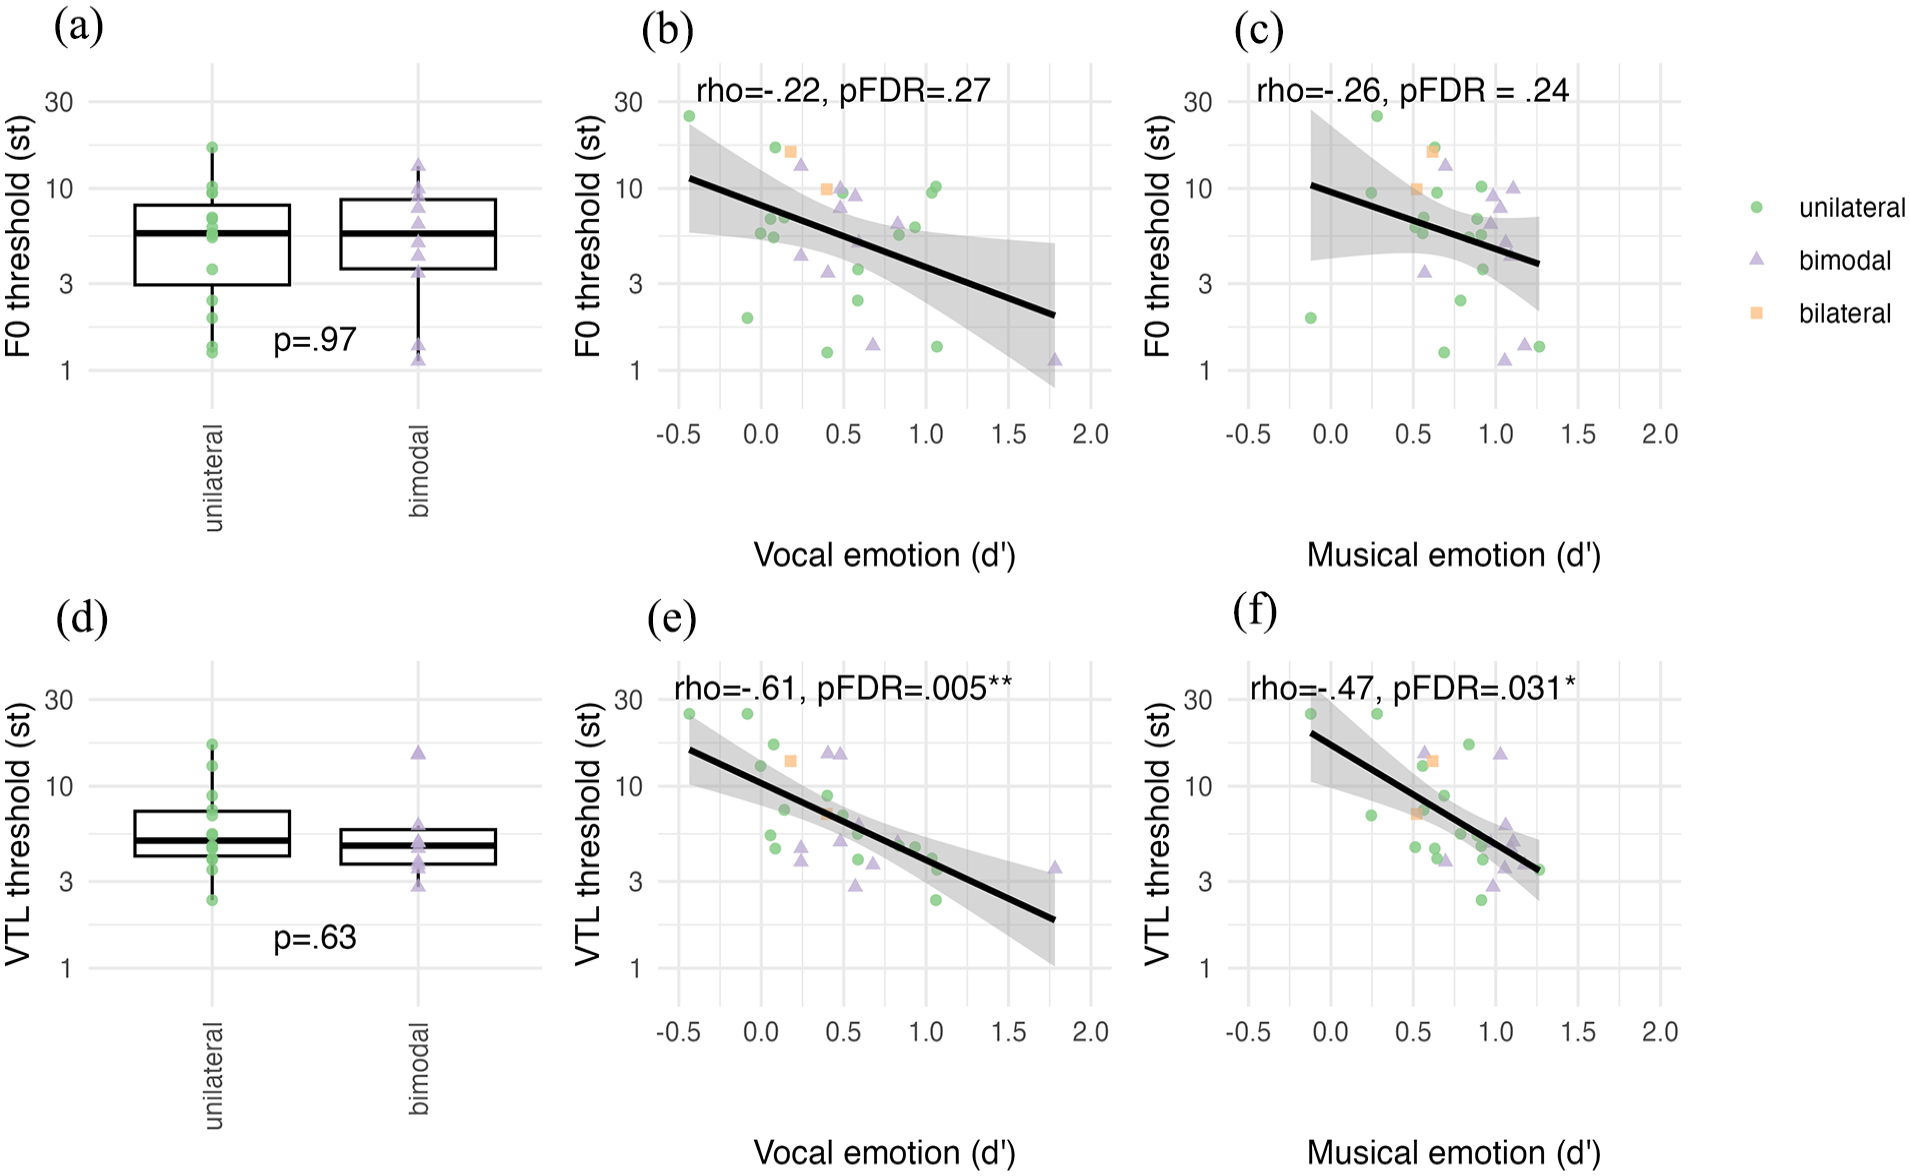
Voice cue discrimination JND thresholds for F0 and VTL shown separately for unilateral (green; n = 14 for F0, and n = 15 for VTL) and bimodal (lilac; n = 10 for both F0 and VTL) participant groups for (a) vocal and (d) musical emotion perception. JND data from n = 2 bilateral users were excluded for A and D only. Correlations of JND scores with d’ scores shown for (b) F0 and vocal, (c) F0 and musical, (e) VTL and vocal, and (f) VTL and musical emotion categorisation, shown across all participants (N = 26 for F0, N = 27 for VTL) whose JNDs converged. The black line shows the regression along with the 95% confidence interval.
In Figure 5, Panels b, c, e, and f show the correlations of the F0 and VTL JNDs with vocal and musical emotion categorisation d’ scores. F0 JNDs (n = 26) did not significantly correlate with vocal (rho = −.22, p = .27) or musical emotion (rho = −.26, p = .24) d’ scores. VTL JNDs (n = 27) significantly correlated with both vocal (rho = −.61, p = .005) and musical emotion (rho = −.47, p = .032) d’ scores.
Discussion
The observed threshold ranges for F0 and VTL JNDs in adult CI users were comparable to ranges in vocoded thresholds with NH participants (e.g., Başkent et al., 2018; Biçer et al., 2023; Gaudrain & Başkent, 2015) and thresholds for adult CI users (e.g., Gaudrain & Başkent, 2018). F0 thresholds did not correlate with vocal emotion categorisation, or musical emotion categorisation. This is in contrast to previous reports with CI users (Barrett et al., 2020; Deroche et al., 2016; Lin et al., 2022; c.f. Paquette et al., 2022). Perhaps our CI users were more heterogeneously spread because we allowed bimodal users to use daily listening settings of their hearing aids as opposed to plugging their ear. However, Deroche et al. (2016) showed that children and adult CI users and NH participants all contributed to the correlation, obviously covering a large range of acoustic hearing in the NH population. Perhaps the large age range of our study and the concentration of age in the older adult (60+) range may be causing more variance that prevents a significant correlation. However, we did not find any correlation with age and JNDs in a Supplementary Analysis S3, in line with the study by Paquette et al. (2022), who found no correlation between pitch JND and age in CI users. While systematic investigation of age effects is outside the scope of this study, it may be informative for future research that could systematically investigate F0 threshold and vocal emotion in younger vs. older CI adults.
VTL thresholds correlated with both vocal and musical emotion categorisation. These results for vocal emotion categorisation are in line with previous findings showing that combined periodicity, formant frequencies, and spectrum level are strongly weighted when categorising vocal emotion (von Eiff et al., 2022b) in CI users who also weighted F0 as a cue to categorise emotions, as well as in CI users who did not weight F0 cues at all in their categorisation choices. Interestingly, von Eiff et al. (2022b) used different vocal emotion categories from our study, namely anger and fear. These emotion categories are both on the high-arousal, negative valence side of the emotion quadrant (Figure 1), suggesting that the ability to perceive valence in vocal emotion may be linked to the ability to perceive these combined formant-related cues. Regarding musical emotion categorisation, the observed correlation is in line with previous findings showing the use of spectral cues in the rating of arousal features in short musical bursts of notes (Paquette et al., 2018). Moreover, the VTL perception measure was previously speculated to be a general reflection of implant functioning (Arras et al., 2024; El Boghdady et al., 2019; Gaudrain & Başkent, 2018). Our findings thus suggest that spectral cues that are also linked to VTL perception are salient to both vocal and musical emotion perception and may also be a reflection of generally improved implant performance.
Experiment 2c: QoL
The NCIQ is a hearing-related QoL metric developed specifically for CI users (Hinderink et al., 2000). NCIQ assesses the subjective QoL in three general domains, with a total of six sub-domains: Physical functioning (Sound perception basic, Sound perception advanced, Speech production), Psychological functioning (Self-esteem), and Social functioning (Activity, Social interaction). The NCIQ was previously positively associated with vocal emotion categorisation in all sub-domains, both with individual and total scores (Luo et al., 2018), and in all sub-domains except for Self-esteem (von Eiff et al., 2022a).
Previous findings have shown a positive correlation between the total NCIQ score and a sub-domain of a music appreciation questionnaire that assessed self-perceived quality in perceiving basic elements of music relating to pitch, rhythm, melody, and timbre (Fuller et al., 2021). While there is thus not a direct report of NCIQ and musical emotion correlation, perceiving musical emotion depends on a combination of these basic elements of music and is also one component of music appreciation (Garrido & Schubert, 2011; Grewe et al., 2005). Thus an association between QoL and musical emotion categorisation is plausible, in particular considering the link between QoL and vocal emotion from previous literature (Luo et al., 2018; von Eiff et al., 2022a) and the moderate correlation between vocal and musical emotion categorisation shown in Experiment 1b.
Acoustic hearing may also influence QoL. For example, if low-frequency noises are perceptible with residual hearing, then one might better hear a bus or train rumbling by, or other basic sound perception features. Acoustic hearing also involves a reported improvement in music appreciation (Fata et al., 2009; Gfeller et al., 2006); thus, it might also influence how one perceives advanced complex sounds like music, or whether one chooses to engage in more activities like attending concerts.
Therefore, in Experiment 2c, we assessed whether (1) the NCIQ ratings for QoL were associated with vocal or musical emotion categorisation, by analysing correlations with d’ for each sub-domain, and (2) whether the presence of acoustic hearing influenced responses, by comparing the NCIQ QoL ratings between the unilateral and bimodal groups per sub-domain.
Materials and methods
Materials
The NCIQ (Hinderink et al., 2000) was originally developed to assess the subjective perception of QoL in CI users in six sub-domains. (1) Sound perception basic items asked questions about how well participants perceived their ability to discern sounds such as cars approaching, people moving around them, and environmental noise identification and spatial localisation. (2) Sound perception advanced items asked similarly phrased questions to basic sound perception about perceiving sound quality and localisation, but regarding more complex signals like speech and music. (3) Speech production items asked participants to assess how well they felt that they were able to express themselves in different aspects of speech communication. (4) Self-esteem items asked participants to rate how confident or justified they felt in different situations where they might have to ask others to make adjustments to accommodate their hearing limitations. (5) Activity items asked participants about situations that they might avoid because of the hearing demands or inherent acoustic properties, such as grocery shopping. (6) Social interaction items asked participants to rate how their hearing affected daily conversations or social events.
Each item consisted of a question and a Likert-type rating scale to grade the response. Response options for Items 1–55 were “Never, Sometimes, Regularly, Usually, Always, and Not applicable.” The scale was reversed in approximately half of the items, i.e., the question was formulated such that a positive response was “Never” as in “I never feel excluded” or that a positive response was “Always” as in “I always can make contact with others.” For Items 56–60, response options were “No, Poor, Fair, Good, Quite well, and Not applicable,” referring mainly to production ability, where “No” was always negative, and “Quite well” was always positive, e.g., in answering “I can hold a telephone conversation quite well.” An English translation of all items of the NCIQ can be found in the appendix of Hinderink et al. (2000).
Procedure
Participants received a paper questionnaire from the examiner and were given an explanation and the opportunity to ask questions about the content or instructions. Some participants chose to fill out the questionnaire in the lab, and some others, alternatively, chose to fill out the questionnaire at home and then mailed it back to the clinic with a postage-paid return envelope. Filling in the questionnaire took approximately 10–15 minutes.
Statistical analysis
Likert-type scale scores were rescaled such that the most positive answer for each item was 100, and the most negative answer was 0, and averaged per sub-domain, such that each participant received an average score per sub-domain between 0 and 100 (Hinderink et al., 2000). Items left blank or answered “Not applicable” were omitted from analysis and, thus, did not contribute to sub-domain average scores. Normal distribution of the scores for each sub-domain was verified with a Shapiro-Wilk test.
Results
Figure 6a shows the NCIQ QoL sub-domain ratings. To compare ratings across sub-domains and between CI users with and without acoustic hearing, rating averages were entered into a mixed ANOVA with sub-domain (Sound perception basic, Sound perception advanced, Speech production, Self-esteem, Activity, and Social interaction) as the repeated factor within a participant, and Acoustic Hearing (unilateral, bimodal) as a factor between participants. Data from one unilateral participant were removed because their QoL rating was missing in one sub-domain. The two bilateral participants were also removed, bringing the number of participants to N = 25. Ratings were significantly different across sub-domains, F(5,120) = 20.03, p < .0001,
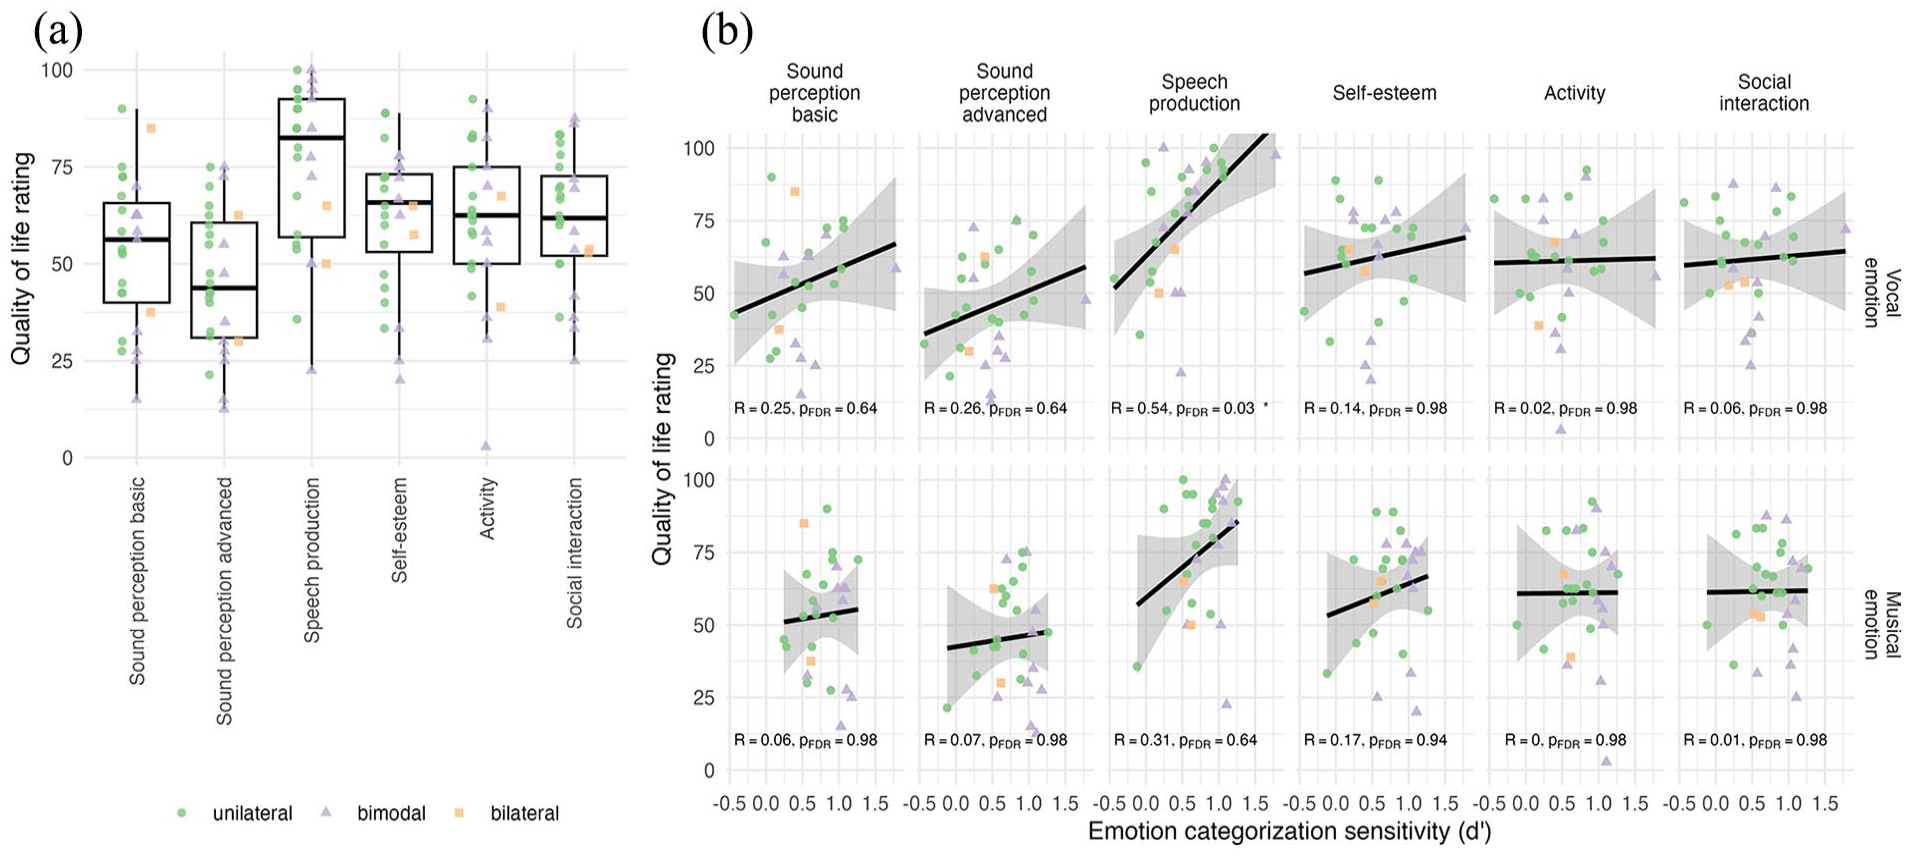
(a) Nijmegen Cochlear Implant Questionnaire subjective QoL ratings shown for the six sub-domains and for all participants (N = 25). (b) Correlations between the vocal (top) and musical (bottom) emotion categorisation sensitivity (d’) and the QoL rating shown for each sub-domain. The black line shows the regression along with the 95% confidence interval.
NCIQ sub-domains were additionally entered into correlations with vocal and musical emotion sensitivity, with FDR adjusted for 12 correlations (Figure 6b). Speech production scores correlated significantly with vocal emotion d’ (R = .54, p = .03), with no other significant correlation.
Discussion
QoL findings were comparable to previously published ranges for NCIQ QoL scores for CI adult users (Luo et al., 2018). The relatively high Speech production ratings reported by our participants may reflect the fact that a majority of our CI users (21 out of 28, based on the self-reported hearing history) were post-lingually deafened. It might also reflect a self-selection bias due to all participants being enrolled in a larger training study, i.e., participants who can communicate better with spoken language may be more willing to take on a long training challenge based on music. This same bias may also be at play regarding the relatively higher Self-esteem, Activity, and Social interaction categories than Sound perception advanced; these participants are highly motivated CI users who lead active lives (including signing up for long training studies) despite their potential perceptual limitations, especially in advanced sound perception. We also did not find an effect of acoustic hearing. The NCIQ questions are specifically related to CI hearing; thus, bimodal users with available acoustic hearing may have rated CI-related hearing lower than what they have available from the contralateral ear, cancelling out (for the puposes of the NCIQ) any benefit to QoL that they may experience from acoustic hearing. Indeed upon visual inspection of our data, bimodal users may have given slightly lower ratings, although not significantly different. The correlation between Speech production and vocal emotion will be discussed in the following section.
General discussion
Across two experiments with adult CI users, the current study comprehensively investigated auditory emotion perception in both vocal and musical emotion perception, and whether individual differences in available acoustic hearing, voice cue discrimination, and QoL were associated with emotion perception in either domain. We hypothesised that (1) if CI users’ emotion perception is similar across domains, categorisations in both domains would be correlated with each other and display similar confusion patterns along arousal and valence dimensions, and (2) individual differences in acoustic hearing, voice cue discrimination, and QoL would be associated with vocal and musical emotion categorisation. Supporting our hypothesis, we showed similarities between overall vocal and musical emotion perception scores and confusions for the emotion categories that fell in the same half-pane of the arousal dimension, indicating that the current categorisation results are highly robust across CI users regardless of the test materials and designs. Partially supporting our hypothesis, we showed that cross-domain emotion perception taps into mechanisms linked to VTL perception, while domain differences emerge with respect to acoustic hearing and QoL ratings.
Vocal and musical emotion categorisation with CIs
Supporting our hypothesis, we found that vocal and musical emotion categorisation displayed similar arousal and valence confusion patterns (depending on the specific design). This similarity occurred despite differences in the respective emotion tests. In the vocal emotion perception test, there were only three emotion categories, thus confusion only occurred for positive and negative valence and high-arousal emotions (happy, angry), and with high categorisation accuracy for the single low-arousal emotion of sadness, since there was no confusion possibility with another emotion category. In the musical emotion perception test, confusion occurred between positive and negative valence for both high- (joy, fear) and low-arousal (sadness, serenity) emotions. These confusions are in line with previous findings, both for CI users and NH participants tested with vocoded stimuli (e.g., Chatterjee et al., 2015; Harding et al., 2023; Luo et al., 2007).
While similar valence confusion occurred for happy-angry in vocal emotion categorisation and both joy-fear and sadness-serenity in musical emotion categorisation, one large difference did emerge: Sadness was not confused with other categories in the vocal emotion test (in line with previous results with the same test; Rachman et al., in press), whereas it was confused with another category, “serenity,” in the musical emotion test. This supports the interpretation that the arousal dimension is better perceived than the valence dimension in electric hearing with CIs and underscores the observation that in categorisation paradigms, sensitivity for any one category may depend on the other categories present. The argument that similarly located categories on the arousal-dimension space reduce overall categorisation accuracy previously motivated a choice to offer fewer emotion categories that cluster together to increase accuracy scores for CI users (Volkova et al., 2013). This line of thinking would suggest that categorisation of sadness was simply improved for vocal emotion because no other low-arousal category was offered, in contrast to low-arousal serenity being available as a choice next to sadness for musical emotion. Moreover, a previous study found that sadness was confused with both happiness and neutral categories in CI users (Deroche et al., 2019). While direct comparison is not possible, as stimuli were short vocal or instrumental bursts, and emotion conditions averaged across vocal and musical, it supports the interpretation that confusions can be a consequence of experimental paradigm.
Despite sadness presenting less confusion for vocal emotion than musical emotion categorisation, we found a moderate correlation of overall categorisation d’ scores across the two domains. Previously, cross-domain similarities were found with complex stimuli in child CI users (semantically neutral sentences, and piano melodies with accompaniment; Volkova et al., 2013), and simple stimuli in adult CI users (short non-word exclamations and short note bursts; Paquette et al., 2018, 2022). Thus, we show for the first time that complex stimuli in vocal and musical emotion perception paradigms are categorised similarly within adult CI users. Paquette and colleagues (2018) argued that by using short simple stimuli, they could assess basic auditory emotion processing. Our present findings extend the similarity of vocal and musical emotion in primitive expressions to more natural listening contexts, notably of longer pseudo-speech utterances and instrumental music in adult CI users. We did not show an effect of age on either vocal or musical emotion categorisation (Supplementary Analysis S3) as previously reported in CI users (Paquette et al., 2022), which could be due to an overall high median age despite a broad age range in the current study.
The correlation of scores across the two domains occurred despite domain differences in emotion categories and the number of category choices (as opposed to one-to-one matching of emotions in the studies by Volkova et al., 2013, and Paquette et al., 2018). This suggests the finding to be rather robust, as the differences in paradigms were “working against” the similarity in findings. We would like, however, to stress that we cannot claim a common vocal-musical emotion-processing mechanism that might generalise beyond hearing with CIs. Since the sounds delivered in electric hearing are lacking in spectrotemporal details, it could be that the speech and music auditory emotional cues resemble each other closely in electric hearing. In other words, emotional cues may have become similar across speech and music due to drastic cue reductions, where the only surviving cues are common across the domains.
We also note that results indicate CI users to be able to perceive how exciting or relaxing, but not necessarily how positive or negative, classical music is. This is a promising direction for CI users to explore their own general music-listening pleasure, and encourages participation in music cultural activities, and to seek out composers and works with frequent changes between exciting and relaxing passages.
Individual differences and vocal and musical emotion perception
Results partially supported our hypothesis. We found that VTL discrimination, but not F0 discrimination, significantly correlated with both vocal and musical emotion categorisation and that the QoL sub-domain of Speech production significantly correlated with vocal emotion categorisation, but not with musical emotion categorisation.
F0 discrimination did not correlate with vocal emotion perception. This was contrary to our hypothesis and previous literature (Barrett et al., 2020; Deroche et al., 2016; Lin et al., 2022). We suggested in the Experiment 2b discussion that perhaps some of our participants being of relatively older age in our CI population might play a role. Indeed compared to younger adults, older adults were reported to have lower accuracy in discrimination of F0 contour in both full-acoustic (Zaltz & Kishon-Rabin, 2022) and simulated electric hearing degradations (Souza et al., 2011). Considering that older NH and CI adults have also reported lower accuracy in vocal emotion perception (e.g., Cannon & Chatterjee, 2022), perhaps the age-related perceptual changes for both metrics contributed to the association observed in younger NH and CI adults to become weaker.
We also explored whether F0 discrimination would correlate with musical emotion perception, considering that pitch interval perception is relevant to processing valence in music (Gomez & Danuser, 2007) and that valence in vocal and musical emotion was similarly rated in CI user adults (Paquette et al., 2018). However, F0 discrimination showed no statistically significant relationship with musical emotion perception. While age-related perception might still play a role as suggested above for vocal emotion, there is another intuitive explanation. Extracting the mean pitch from instrumental music with multiple instruments, such as in the current musical emotion stimuli, may require extra processing steps to extract from multiple sources that the single-voice JND stimuli did not capture. Tools such as musical scene analysis (e.g., Hake et al., 2024) may be more appropriate for the investigation of potential correlations with musical emotion categorisation. A domain-specific metric for musical pitch intervals may be more relevant to musical emotion processing than voice F0, despite the cross-domain similarity of vocal and musical emotion sensitivity.
In contrast to F0, VTL discrimination correlated with both vocal and musical emotion perception. For vocal emotion, this supports previous results showing that both younger and older adults benefit from voice formant cues added to F0 cues when discriminating voice JNDs (Souza et al., 2011). However, it is, to the best of our knowledge, a novel finding that VTL JNDs correlate with musical emotion perception. On the one hand, this may be evidence that vocal and musical emotion perception mechanisms are similar across speech and music domains, if spectral information related to VTL is beneficial. On the other hand, this may be evidence that a VTL metric reflects a more general CI performance (Arras et al., 2024; El Boghdady et al., 2019). We cannot distinguish between these two explanations. Moreover, this finding was slightly underpowered (see Supplementary Analysis S3) and should be interpreted with caution. In the future, a battery of perceptual tests, in speech and music domains, as well as controlled environmental sounds, might be able to answer whether the VTL benefit is general to all auditory processing methods with the implant.
We note further that our selection of tasks took advantage of an available test battery from a larger training study. A more focused selection of vocal and musical emotion tests and auditory cue discrimination tasks specific to the music-domain could provide more insight into the broader perceptual mechanisms that CI users may or may not be using during vocal and musical emotion feature perception.
We found that from all QoL ratings, only the sub-domain of Speech production significantly correlated with vocal emotion categorisation. This intuitively suggests that in speech communication, the better one can perceive the emotions of a speaking partner, and the better one can match expressed emotions to meet the register of the speaking partner. This is in line with findings linking vocal emotion production with perception in early-implanted child CI users (Velde et al., 2019), as well as findings that pre-lingually deafened children do not demonstrate as much acoustic variation in F0 production across emotion categories compared to their NH peers (Chatterjee et al., 2019). Using this argument for adult CI users does not align with reports that post-lingually deafened adult CI users with no reported residual acoustic hearing, who heard vocal emotions before functional deafness and implantation, do not differ in the production of their acoustic features across vocal emotions (Chatterjee et al., 2019). However, our adult population includes both pre-lingually and post-lingually deafened CI users with and without acoustic hearing, who as a group may not resemble previous reports due to large heterogeneity.
Differences from previous adult CI user QoL correlations with vocal emotion—which included most or all sub-domains from the NCIQ (Luo et al., 2018; von Eiff et al., 2022b)—may be due to our participant sample reflecting a more contemporary and changing CI population. The first generation of pre-lingually deafened, early-implanted children is growing up, and more adults and older adults are receiving implants with more relaxed criteria, e.g., allowing more acoustic hearing in the contralateral ear and admitting increasingly older candidates, as well as a swifter transition in the audiology treatment plan from the stage where a hearing aid loses its function to afford speech comprehension in normal conversation (functional deafness) to implantation (Snel-Bongers et al., 2018). This reflects the heterogeneity previously reported in CI findings (Nyirjesy et al., 2024) and is thus a good representation of current CI users. In our case, this heterogeneity may have been advantageous in that a broad range in scores allowed us to capture individual differences in VTL and F0, as well as the correlation between the vocal and musical categorisation.
Acoustic hearing
Approximately one-third of the participants self-reported (residual) acoustic hearing in their non-implanted ear that either was or was not amplified with a hearing aid. In Experiment 2a, there was no difference in the vocal emotion categorisation between unilateral and bimodal CI users while there was a significant effect of acoustic hearing for musical emotion categorisation. Moreover, in Experiment 2b, neither JNDs nor QoL for basic and advanced sound perception significantly differed between the unilateral and bimodal groups. One possible explanation might be that residual hearing was very limited, to the extent that it did not help discriminate pitch (in contrast to previous results with a CI simulation; Başkent et al., 2018). This is in line with recent results that showed no group differences between unilateral and bimodal CI users on a listening effort test battery (Nyirjesy et al., 2024), but that acoustic hearing still assisted in the detection of loudness changes. CIs reduce the dynamic range of transduced signals (Macherey & Carlyon, 2014); therefore, bimodal users may have benefitted more from the dynamic range of acoustic hearing. In musical excerpts, loudness changes were intentionally added to better distinguish emotion categories (Harding et al., 2023) while no loudness adjustment was made to the vocal emotion materials.
For the significant difference in musical emotion categorisation, we inspected Tables 3–5 for the demographics factors, to rule out that some of these factors may have played a role. The average age and age range, as well as age at implantation of the unilateral and bimodal groups, were almost identical. The onset of functional deafness was at a younger age in the unilateral group than that in the bimodal group, which also resulted in longer duration of deafness in the unilateral group than in the bilateral group. This difference possibly came from the fact that CI candidates with acoustic hearing did not really have a strong onset of deafness that they could identify since they always had some hearing. Duration of deafness was shown to be a factor that can negatively affect CI outcomes in some studies (Blamey et al., 2012; Plant et al., 2016); however, other studies cautioned that there would be more factors that would have a collective effect (e.g., Holden et al., 2013; van Dijk et al., 1999). Having said that, the acoustic hearing effect was only observed for musical emotion categorisation, and not for vocal emotion categorisation, which would be expected to be similarly affected by the same demographic factors. Alternatively, differences in the categorisation paradigms may explain the domain difference found in bimodal users. Bimodal users might have some improved ability to detect arousal differences that are more overt in the musical emotion paradigm (four emotion categories), whereas they lose the advantage in the vocal emotion paradigm (three emotion categories). However, as this study was not initially designed to account for group differences in CI configuration, the group sizes are underpowered (see Supplementary Analysis S2), and the group differences, or lack thereof, should be interpreted with caution. Hence, this point remains inconclusive from the current data. In future research, acoustic hearing thresholds and dynamic range per participant could be better characterised, if possible, controlled for as an experimental variable, and incorporated into a balanced design for a more definitive answer.
Conclusion
We showed that vocal and musical emotion categorisation varied across the CI user participants, but the overall scores were moderately correlated across the two tests within the participants, despite the stimulus and design differences. Perhaps this is a consequence of the test population that was relatively heterogeneous, varying in age, pre-lingual vs. post-lingual deafness and implantation, and acoustic hearing contribution. Despite this heterogeneity, for both vocal and musical emotion categorisation, CI users’ relative perception of the arousal dimension seemed better than the valence dimension. Future research is needed to explore the relative contributions of sensory and neurocognitive mechanisms to explain these patterns. While age-related changes may have obscured some statistical associations with F0 discrimination, the emergence of VTL discrimination as correlating with both vocal and musical emotion perception lends weight to the hypothesis that VTL may be a proxy for general implantation outcome, warranting further investigation. Finally, considering that the vocal emotion test correlated with the musical emotion test, VTL discrimination, and QoL in terms of capability to communicate in Speech production, adding a vocal emotion test to a clinical assessment battery may aid clinicians to estimate a broader reaching impact of CI performance.
Supplemental Material
sj-pdf-1-qjp-10.1177_17470218251316499 – Supplemental material for Vocal and musical emotion perception, voice cue discrimination, and quality of life in cochlear implant users with and without acoustic hearing
Supplemental material, sj-pdf-1-qjp-10.1177_17470218251316499 for Vocal and musical emotion perception, voice cue discrimination, and quality of life in cochlear implant users with and without acoustic hearing by Eleanor E Harding, Etienne Gaudrain, Barbara Tillmann, Bert Maat, Robert L Harris, Rolien H Free and Deniz Başkent in Quarterly Journal of Experimental Psychology
Footnotes
Acknowledgements
The authors would like to thank Dr. Christina Fuller for support in conceptual planning of the study and proofreading the manuscript; Lisa Hoogeveen, Mirthe Ronde, Malva Ibrahim, and Isa Poortman for help with data collection; and Henk Mellema, Wijnna Beuving, Helma Boering, Gesina Posthumus-Ottema, Esther Steenbergen-Bethlehem, Ria Kort, Martine Meelker, and Rieta Steeman-Poelman for administrative support. Thanks also to the assisted living facility s’ Heeren Loo De Noorderbrug for providing a participant testing location.
Declaration of conflicting interests
The author(s) declared no potential conflicts of interest with respect to the research, authorship, and/or publication of this article.
Funding
The author(s) disclosed receipt of the following financial support for the research, authorship, and/or publication of this article: This study was funded by the Dorhout Mees Foundation, the Gratama Foundation, Heinsus Houbolt Funds, and the VICI Grant No. 918-17-603 from the Netherlands Organisation for Scientific Research (NWO) and the Netherlands Organisation for Health Research and Development (ZonMw). The team Auditory Cognition and Psychoacoustics of the Lyon Neuroscience Research Centre is part of the LabEx CeLyA (Centre Lyonnais d’Acoustique, ANR-10-LABX-60). The data that support the findings of this study will be openly available in the DataverseNL repository via (link forthcoming).
Notes
References
Supplementary Material
Please find the following supplemental material available below.
For Open Access articles published under a Creative Commons License, all supplemental material carries the same license as the article it is associated with.
For non-Open Access articles published, all supplemental material carries a non-exclusive license, and permission requests for re-use of supplemental material or any part of supplemental material shall be sent directly to the copyright owner as specified in the copyright notice associated with the article.