
Abstract
Deciding whether two face photographs depict the same person or not can be a challenging task, and there are substantial individual differences in face matching ability. Far less is known about differences in metacognitive ability; that is, how well people can estimate the quality of their own face matching judgements. The purpose of this Registered Report was to determine the relationship between first-order performance in a face matching task, and three metacognitive measures: metacognitive sensitivity (the information exploited by metacognition), metacognitive efficiency (the quality of metacognitive processing itself), and metacognitive bias (the overall tendency towards high or low confidence). Participants completed a 200-trial unfamiliar face matching task, providing a second-order (metacognitive) confidence rating after each first-order (cognitive) response. Cognitive performance and metacognitive sensitivity showed a substantial positive association (rs = .60), suggesting that they were based on overlapping information, with poorer performers having lower quality information available. Once these differences in the information available to metacognition were accounted for, the quality of metacognitive processing itself (metacognitive efficiency) did not vary systematically with cognitive performance (rs = .00). Moreover, poor performers were not less or more confident overall than good performers, as cognitive performance and metacognitive bias did not correlate significantly (rs = .11). These findings allow us to move beyond consideration of group-level insight and inform regarding individual differences in cognitive and metacognitive abilities.
Identity verification often involves the comparison of two face photographs, or of a real person with a picture they provide. Determining whether both sources show the same person can be challenging if the person is unfamiliar (e.g., Bruce et al., 1999, 2001; Burton et al., 2010; Kemp et al., 1997). In such situations, we must rely solely on the visual information contained within the images (Hancock et al., 2000) because we have no prior knowledge of the idiosyncratic variability associated with that person’s face (Burton et al., 2016). The task of unfamiliar face matching is prone to errors (e.g., Kramer et al., 2018, 2019) and does not seem to improve with experience (White et al., 2014).
Although face matching (of unfamiliar faces using a visual comparison) should be considered distinct from face recognition (of a previously seen face with reliance on memory), evidence has shown an overlap in abilities across these tasks. People who are exceptionally good at face recognition (“super-recognisers”) also tend to do very well on tests of face matching (e.g., Bobak, Hancock, & Bate, 2016), and people who are exceptionally poor at face recognition (prosopagnosics) tend to be very poor at matching (White et al., 2017). In between, there is wide variation in both face recognition and matching abilities (e.g., Burton et al., 2010; Duchaine & Nakayama, 2006). However, in both cases, there has been little research on whether people show similar variation in metacognitive ability with respect to the task, and whether metacognitive ability varies systematically with face processing ability. Here, we focussed on face matching across the broad range of naturally occurring abilities while acknowledging that this relationship may be altered by external factors (e.g., receiving professional training—Hahn et al., 2022; Towler et al., 2023).
Metacognition refers to the assessment of the quality of one’s own performance. For face matching and recognition, how well people think they are performing may be more or less closely related to their true level of ability. This distinction can have real-world consequences, for instance, with regard to face recognition, an eyewitness’s expression of high confidence could promote an over-reliance on their testimony by others (for a review see Berkowitz et al., 2022). For face matching, misplaced confidence by a passport issuing officer might have serious implications in terms of the travel possibilities of felons. As such, the practical importance of investigating metacognition is potentially far reaching. Our progress in trying to understand the association between insight and ability has been mixed (for further discussion see Kramer & Tree, 2023) and so the present study attempted to make some advances by investigating measures previously unconsidered in this field.
There is currently no questionnaire-based scale of self-reported face matching ability, although several such scales have been developed for face recognition ability (e.g., 20-item prosopagnosia index, PI20—Shah, Gaule, et al., 2015; Stirling Face Recognition Scale—Bobak et al., 2019). These self-report scales seem to be reliable; for example, the test–retest reliability of the PI20 has been estimated at .89 (Stantić et al., 2021). These scales also show medium levels of association with performance on face matching tests (.28—Bobak et al., 2019; .32—Kramer, 2023; .49—Shah, Sowden, et al., 2015). In addition, Bate and Dudfield (2019) developed a “super-recogniser questionnaire” to more effectively target the upper end of face recognition ability, with this instrument showing only small correlations with face matching measures. If the correlation between subjective scales (although targeted at recognition rather than matching) and objective measures is interpreted as a group-level measure of metacognitive insight then these associations suggest that insight into face matching ability is moderate.
Importantly, any conclusions about metacognitive insight from correlating these subjective and objective measures are highly approximate, and limited to the group level, providing no clear information about any individual’s metacognitive ability, because such scales cannot distinguish between two crucially different aspects of metacognition: metacognitive sensitivity, which reflects a person’s ability to identify when they are performing well or poorly; and metacognitive bias, which reflects any overall tendency to express high or low confidence in their abilities (Fleming & Lau, 2014).
A potentially more insightful way to evaluate metacognitive abilities is not through the use of global scales but via a running commentary of confidence, for example, trial-by-trial confidence ratings during a face matching task. If face matching responses made with higher confidence are more often correct than those made with lower confidence, this implies some metacognitive sensitivity (see Fleming & Lau, 2014). When confidence ratings have been collected for face matching judgements, higher levels of confidence have been observed for trials answered correctly than for trials with incorrect responses (Bruce et al., 1999; Hopkins & Lyle, 2020; Stephens et al., 2017). Similarly, confidence ratings are broadly aligned with response accuracy across other tasks of face perception, including face recognition (Grabman & Dodson, 2020), searching for faces in crowds (Davis et al., 2018; Kramer et al., 2020), and recognising which faces were present in previously shown arrays (Ji & Hayward, 2020). Interestingly, super-recognisers have been shown to generally place high levels of confidence in their responses, whether correct or incorrect (Towler et al., 2023), although this may be the result of their prior knowledge of their superior performance. Taken together, these observations all indicate that people have some metacognitive sensitivity for their face perception judgements at the individual level.
Of course, the degree of metacognitive sensitivity is likely to vary between people, and there are reasons to expect that this variation may be systematically related to the quality of face perception per se. The notorious Dunning–Kruger effect describes how the least skilled performers on a given task tend to overestimate their abilities the most, which has been interpreted as evidence that the poorest performers have the least insight into their own abilities (Kruger & Dunning, 1999). According to Kruger and Dunning, this arises because the skills needed to evaluate one’s own performance on a task will often be the same as the skills needed to perform well in that domain. Therefore, if the poorest performers have the least skill for the task, they will also have the least metacognitive insight (and vice versa for the best performers). The Dunning–Kruger effect has been subject to considerable scepticism, mostly because the typical method of analysis suffers from numerical artefacts such as regression to the mean (e.g., Burson et al., 2006; Krueger & Mueller, 2002; Nuhfer et al., 2016, 2017). Nonetheless, it may still be true that the least skilled participants do typically have lower metacognitive sensitivity for their own performance (e.g., McIntosh et al., 2019, 2022). In face perception tasks, better task performance has been associated with a more pronounced divergence of confidence ratings for correct and incorrect responses, strongly suggestive of higher metacognitive sensitivity among more able individuals, for both face matching (Kramer, 2023; Kramer et al., 2022) and recognition (Grabman & Dodson, 2024). Figure 1 illustrates this pattern, where the highest scorers on a test of face matching were much more confident when giving correct than incorrect responses, while the lowest scorers were equally (un)confident in either case.
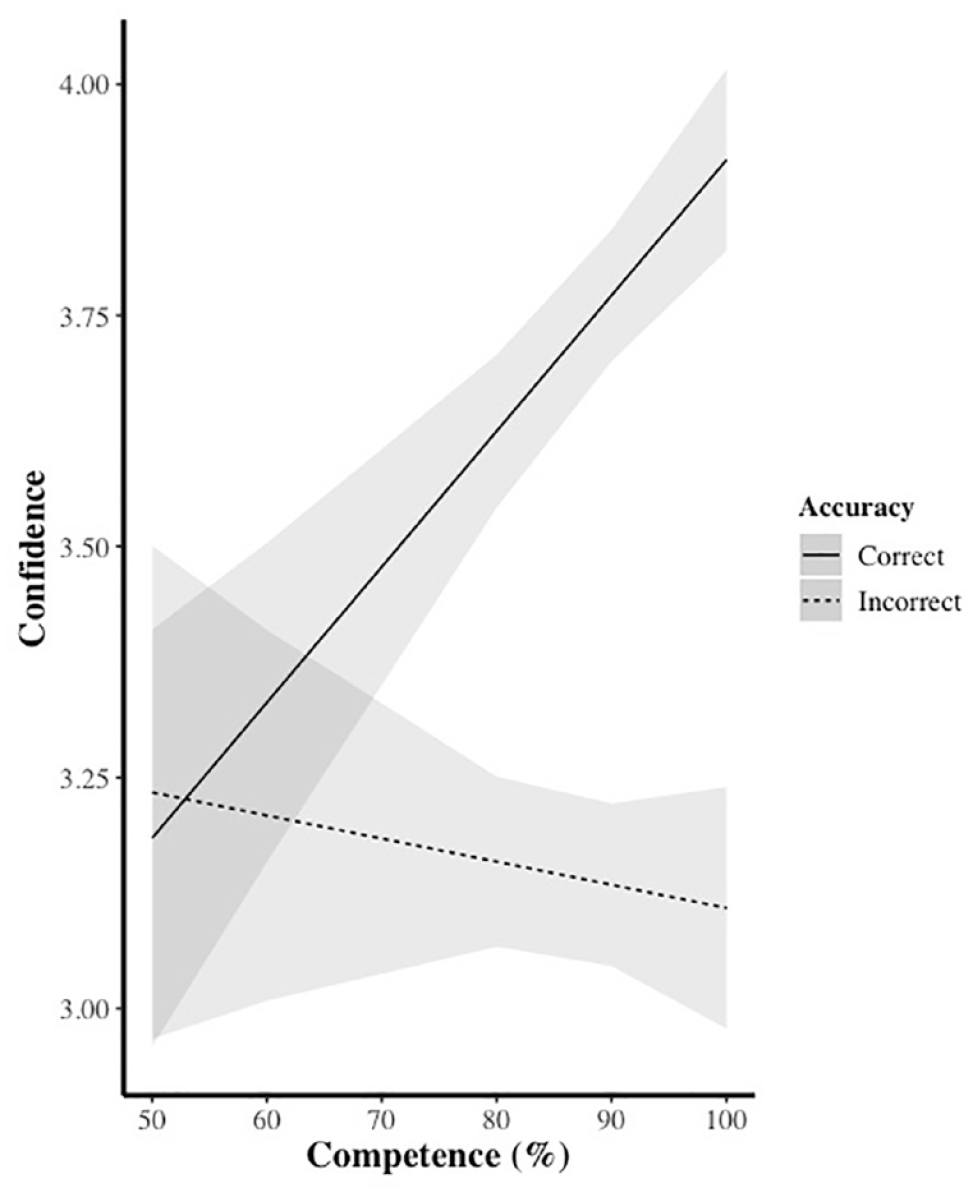
During an unfamiliar face matching test, the most skilled participants (with higher competence, i.e., overall test score) give higher ratings of confidence for correct versus incorrect responses, indicative of metacognitive sensitivity to variations in their performance. In contrast, the least skilled performers give similar confidence ratings for these two types of responses.
While the pattern shown in Figure 1 is strongly suggestive, any analysis of metacognitive sensitivity based on a simple contrast or subtraction between average confidence ratings for correct and incorrect responses will be very approximate at best. The chief reason for this is that simple subtraction measures are prone to contamination by biases in the use of the confidence scale, such as a willingness or reluctance to use the full range of the scale, or an overall bias towards high or low confidence (e.g., note that the average values in Figure 1 suggest a general bias of confidence ratings towards the top of the 0–5 scale). To more precisely map out this relationship, we need to characterise metacognitive sensitivity separately from bias.
In the past decade, approaches to metacognition have been developed that allow for the bias-free estimation of metacognitive sensitivity, using an extension of signal detection theory (Green & Swets, 1966) applied to (second-order) confidence ratings about (first-order) cognitive responses. The (first-order) cognitive sensitivity to make a perceptual discrimination is captured by the d′ measure of traditional signal detection theory, and the (second-order) metacognitive sensitivity to use confidence ratings to discriminate between correct and incorrect first-order responses is known as meta-d′. Whereas d′ quantifies the signal-to-noise ratio of the participant’s internal representation for the perceptual discrimination (e.g., between matching versus non-matching pairs of faces), meta-d′ measures the signal-to-noise ratio of the representations guiding the second-order confidence rating (Maniscalco & Lau, 2012). If both cognitive and metacognitive responses arise from the same information (i.e., an individual has perfect insight into the information on which their cognitive responses are based) then d′ and meta-d′ will be equal. In this case, we could say that metacognitive sensitivity (meta-d′) is optimal, because it exploits all of the information that is available for the original cognitive judgement (d′). Typically, metacognitive sensitivity will be suboptimal because some information is lost between cognitive and metacognitive judgements, so meta-d′ will be lower than d′ (Fleming & Lau, 2014). 1
One very useful property of the meta-d′ measure of metacognitive sensitivity, over and above its independence from any general bias to high or low confidence, is that it is expressed in the same units as first-order cognitive performance. This means that the numerical relationship between meta-d′ and d′ can be used to describe the efficiency of metacognitive processing in a metric that corrects for variations in the quality of the first-order performance. Typically, the ratio meta-d′/d′ is used as a measure of metacognitive efficiency. While we might expect metacognitive sensitivity to increase with first-order face perception ability, because both first-order and second-order judgements may access overlapping information, it is an open question whether metacognitive efficiency will vary across the range of face-processing ability. If metacognitive efficiency (meta-d′/d′) were to be higher among people with better face processing ability then this would indicate not only that the quality of information available to metacognition was higher for such people, but also that their metacognitive skills were actually better, in the sense of more fully exploiting the available first-order information. Finally, we can also derive a simple measure of metacognitive bias to index a person’s overall tendency to give high or low confidence ratings independent of their first-order performance. Metacognitive bias can be calculated as the mean of the average confidence ratings for correct and for incorrect responses (Fleming & Lau, 2014).
Our aim in the current experiment was to determine the relationship between task performance and metacognitive insight in the domain of unfamiliar face matching. Our methods broadly followed the strategy taken previously for a logical reasoning task (McIntosh et al., 2022). We used a two-alternative forced-choice discrimination of pairs of unfamiliar faces (same person/different people), which allowed us to estimate performance in terms of cognitive sensitivity (i.e., d′ of the type 1 response). Each type 1 response was followed by a (type 2) confidence rating, allowing us to extract dependent measures for three different aspects of metacognitive performance: metacognitive sensitivity (meta-d′), metacognitive efficiency (meta-d′/d′), and metacognitive bias. Given that increases in the quality of sensory evidence available for the type 1 discrimination should make correspondingly better evidence available for metacognition, we expected cognitive sensitivity (d′) and metacognitive sensitivity (meta-d′) to be positively correlated. This relationship was suggested strongly by the findings of Kramer et al. (2022), illustrated in Figure 1, and would also follow the pattern found for a logical reasoning task (McIntosh et al., 2022). More uncertain was whether people with higher cognitive sensitivity for face matching would also have superior metacognitive processing skills, over and above the higher quality type 1 information. This would be indicated by a positive correlation of cognitive sensitivity (d′) with metacognitive efficiency (meta-d′/d′), though no such relationship was found in the domain of logical reasoning (McIntosh et al., 2022). Finally, examining metacognitive bias allowed us to test the popular idea (following the Dunning–Kruger effect) that poor performers are relatively overconfident in their responses. This would be confirmed by a negative correlation between cognitive sensitivity and metacognitive bias, although prior data from face matching (see Figure 1) and from logical reasoning led us to expect that a positive relationship would be found, such that poor performers tended towards relatively lower confidence than good performers.
Method
The in-principle accepted Stage 1 study protocol is available at https://osf.io/n7yqa/. Any minor deviations from the Stage 1 approved plan are highlighted below. No data were collected before acceptance of the Stage 1 manuscript.
Participants
Participants were recruited via Prolific (prolific.co) in exchange for monetary compensation. Recruitment was restricted to participants living in the United Kingdom who have a Prolific approval rate of 95% or higher. In addition, a “balanced sample” (an option in Prolific) was collected with the aim of recruiting approximately equal numbers of men and women. There was no explicit selection by ethnicity; however, given that data collection was restricted to the United Kingdom, we expected to obtain a majority White sample, which would be broadly consistent with the demographics of the samples from which the trial-level difficulties were estimated for stimulus selection. Data collection continued until at least 138 valid datasets had been collected (see participant and data exclusion criteria) and up to a recruitment limit of 170 participants, imposed by available resources. In total, due to the unexpectedly high rate of exclusions, 281 individuals completed the study, resulting in a final sample of 149 valid participants (79 women, 69 men, 1 nonbinary; age M = 40.0 years, SD = 12.5 years, range = 18–70 years; 79.2% self-reported ethnicity as White) who were included in statistical analyses (see participant and data exclusion criteria). Each participant provided digital consent before taking part and saw a debriefing screen upon completion. Ethical approval was granted by the University of Lincoln’s Ethics Committee (ID 13980).
The target sample size of 138 was determined by a power analysis using G*Power 3.1 (Faul et al., 2007), aiming for 95% power to detect a correlation of rs = .30, with a two-tailed alpha of .05. (The achieved a priori power was marginally higher at 96%.) This moderate level of correlation was chosen as an achievable lower bound effect size of interest given the resources available. Any relationship weaker than this was unlikely to be of practical importance and would offer very little predictive information at the individual level. Consider that we might want to be able to state that someone who scores high on one measure is also likely to be high on another; given a correlation of .30, only 46% of participants performing in the bottom or top tertile on one variable would be expected to score within the same tertile for the other, compared with a random chance correspondence of 33% (see Mõttus, 2022).
Stimuli
A typical unfamiliar face matching task shows two photographs side by side, depicting either the same person (but photographed under different conditions) or different but similar-looking people, and the participant is required to discriminate whether they are the same (match) or different (mismatch). For this task to be suitable for the application of analytic methods derived from signal detection theory, the assumption should be made that variation in the signal strength across trials is substantially due to factors internal to participants rather than to external differences in the stimuli presented (Fleming & Lau, 2014). In practical terms, this means that task difficulty should be held roughly constant across trials.
Our face matching test therefore comprised trials that we preselected to be of relatively homogeneous difficulty. We based our item selection on item-level performance data associated with six published face matching tests (listed in Table 1) that all followed the standard task format. The item-level data had either been made publicly available with the original test or were obtained through correspondence with the creators or other users of the test. Where performance data were available for subgroups (e.g., super-recognisers or Egyptian participants), these were excluded in favour of participant data provided by individuals mirroring the current sample (i.e., majority White British). We used these item-level data to determine the narrowest range of item difficulty that would provide us with at least 100 match and 100 mismatch trials across the six tests combined. To define a suitable stimulus set, we began with the full set of 888 trials and found the narrowest range of difficulty that retained at least 100 trials of each type (since 100 trials should allow stable estimation of metacognitive variables; Fleming, 2017). We then excluded from this set excess trials from tests with the largest imbalance of match to mismatch trials, starting from the most difficult trials and progressing towards the easiest. Table 1 summarises the 200 trials in the final selected stimulus set, which ranged by 9 percentage points in estimated difficulty, from 75% to 84% (M = 79.6%, SD = 2.7%).
A summary of the trials included in the current face matching test.
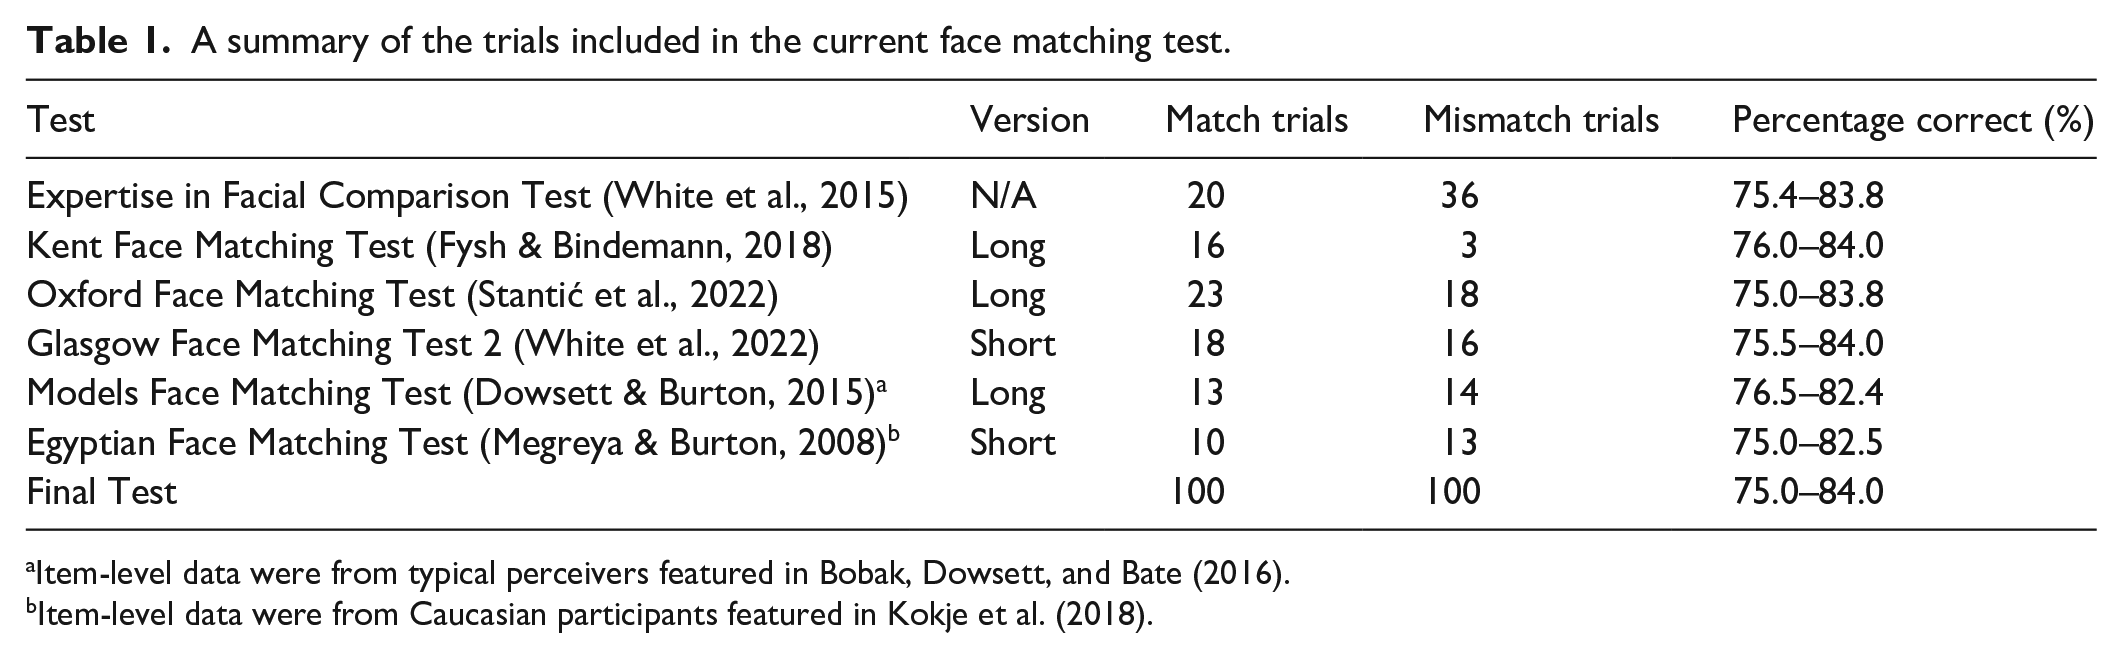
Item-level data were from typical perceivers featured in Bobak, Dowsett, and Bate (2016).
Item-level data were from Caucasian participants featured in Kokje et al. (2018).
To be clear, our face matching test incorporated trials from six different previous tests and, as such, presented image pairs whose properties varied considerably (e.g., colour vs. greyscale, how closely cropped they were, the lighting used, the models’ ethnicities). The important characteristic, held approximately constant across these image pairs, was their difficulty, as indicated by percentage correct data (see Table 1). We included trials depicting non-White faces (e.g., taken from the Egyptian Face Matching Test and Expertise in Facial Comparison Test) with the proviso that the original trial difficulties were calculated from a majority White participant sample, approximately mirroring the sample characteristics we recruited in the current study. We did not expect participants of any ethnicity to be disadvantaged in matching “other-race” faces (i.e., who differed in ethnicity from themselves) because exposure to diverse ethnicities is common in the United Kingdom (for a discussion and recent evidence, see Ritchie et al., 2023).
Procedure
The experiment was carried out using the Gorilla online testing platform (Anwyl-Irvine et al., 2020). Participants were prevented from responding on mobile phones or tablets (via settings available in Gorilla) to ensure that images were viewed at an acceptable size onscreen.
Participants provided information about their age, gender, and ethnicity, and then completed the face matching test. On each trial, a fixation cross appeared onscreen for 500 ms. This was then replaced by a pair of faces, appearing side-by-side. The height of these images was approximately one-third of the screen’s height, with aspect ratios unaltered from their individual sources/tests. Where the original trials comprised two images of different sizes (i.e., the Kent Face Matching Test), this relative disparity was also maintained here. After 1,600 ms (to encourage a considered response; Stantić et al., 2022), participants were asked “are these photos of the same person or two different people?,” with two response buttons (labelled “same person” and “different people”) appearing below the images. After providing a response, the faces disappeared from the screen and the participants were then asked “how confident are you in the response you just gave?” and responded using a left-to-right scale, from 1 (very uncertain) to 4 (very certain). An instruction screen before the test explained this two-step process to participants, and instructed them to “please be willing to use the full range of the confidence scale.”
In addition to the 200 experimental trials, four attention check image pairs were included because attentiveness is a common concern when collecting data online (Hauser & Schwarz, 2016). Two of these were trivially easy matches showing two identical images of a celebrity (e.g., Ryan Reynolds) and two were trivially easy mismatches showing two celebrities of differing gender and ethnicity (e.g., Will Smith and Scarlett Johansson). For the confidence ratings accompanying these four attention check pairs, participants were provided with additional instructions onscreen asking them to select a specific response option. For example, “Attention check—please select the ‘3’ option for this question.” We excluded from analysis any participant who responded incorrectly to any of the four attention check pairs or their associated confidence ratings. However, in line with Prolific’s payment policies, only participants who failed at least two of the confidence ratings checks were rejected without payment.
The order of the 204 trials was randomised for each participant. Responses during the face matching test were self-paced, without time limits, and no feedback was given. A progress bar at the top of the screen allowed participants to see how far through the task they were at all times, and a screen was shown after each quarter of the test to inform participants of their progress and provide them with the opportunity to take a break.
Data analysis plan
Participant and data exclusion criteria
Participants were excluded from analyses if they did not complete the face matching test (n = 11) or if they responded incorrectly to any of the four attention check image pairs (n = 3) or their associated confidence ratings (n = 126). 2 This resulted in 62 participants being excluded without payment. In addition, any participant who answered all 200 experimental trials correctly or got fewer than 101 of these trials correct (i.e., scores at or below chance level) were excluded to avoid ceiling and floor effects (n = 0). (We could not investigate metacognitive measures for individuals who provided no incorrect responses.) Finally, participants who did not use at least three of the four possible confidence ratings during the experimental trials were also excluded (n = 3). Overall, from a total of 292 participants who attempted the task, 143 were excluded, leaving a final valid sample of 149 participants.
In line with previous work (McIntosh et al., 2022), we excluded extreme values of metacognitive efficiency from analyses involving this variable because it was based on a ratio measure (meta-d′/d′). As such, there was the possibility of misleading values, especially when d′ was low. We used a relatively conservative exclusion criterion, removing only values that were more than two interquartile ranges below the first quartile or above the third quartile (n = 4). Therefore, analyses involving metacognitive efficiency were based on a slightly smaller sample of 145 participants.
Extraction of measures
Cognitive sensitivity was calculated as d′ following signal detection theory (using the MATLAB code provided by Maniscalco & Lau, 2014). Metacognitive sensitivity was calculated as meta-d.’ Given that our task required participants to provide a “same person” or “different people” response on each trial (similar to responding “yes” vs. “no” in a simple detection task), we might expect asymmetries in metacognitive sensitivity for these two response options (in general, people may be more sensitive to their ability to make a positive detection/match; e.g., Fleming & Dolan, 2010). We accounted for this possible asymmetry by using response-conditional meta-d′ estimation, i.e., fitting models to estimate meta-d′ for each type of response separately (again, using the code provided by Maniscalco & Lau, 2014). These two estimates were averaged to provide an overall estimate of metacognitive sensitivity (meta-d′) for each participant. 3 Metacognitive efficiency was calculated as the ratio meta-d′/d′. Metacognitive bias was calculated as the (unweighted) mean confidence rating for correct and incorrect responses. That is, mean confidence was calculated for correct responses, and separately for incorrect responses, and then metacognitive bias was given by the mean of these two values.
Statistical analyses
Before the Stage 1 submission of this Registered Report, we outlined our planned analyses, which focussed on the associations between the above four measures of interest: cognitive sensitivity and the three metacognitive measures. If we found a significant positive association between cognitive sensitivity and metacognitive sensitivity, in line with previous work (McIntosh et al., 2022), then this would support the notion that cognitive and metacognitive processes were based on overlapping information. Furthermore, a lack of significant association between cognitive sensitivity and metacognitive efficiency (as was the case in McIntosh et al., 2022) would suggest that the quality of metacognitive processing was not meaningfully different for the best and worst performers, once differences in the quality of information available to metacognition were accounted for. Finally, if we found a significant negative association between cognitive sensitivity and metacognitive bias (in line with Kramer et al., 2022) then this would suggest that poorer performers were less confident in their performance.
Following McIntosh and colleagues (2022), bivariate correlations were performed on ranked data (Spearman correlations). This approach allowed us to make minimal assumptions regarding distributions, and to take a liberal approach to the retention of outliers (see participant and data exclusion criteria). For each of the three critical correlations examined, the significance of the correlation was tested with a two-tailed alpha level of .05.
Results
Both participant-level and trial-level data are publicly available on the Open Science Framework (OSF) at https://osf.io/n7yqa/.
Overall task performance
Participants’ accuracies (percentage correct) on our face matching task (M = 80.0%, SD = 7.7%, range = 60%–97.5%) closely matched the level expected from the estimated difficulties of the 200 trials, based on previously collected performance data (M = 79.6%, SD = 2.7%; see Table 1). We also calculated participants’ accuracies for each trial type: match (M = 80.0%, SD = 12.7%) and mismatch (M = 80.0%, SD = 15.3%). As expected, cognitive sensitivity (M = 1.92, SD = 0.60, range = 0.50–3.78) strongly correlated with overall task accuracy, r(147) = .88, p < .001.
Regarding confidence ratings, the mean response across all participants and trials was 3.01 (SD = 0.93). For trials in which correct responses were given, this was 3.13 (SD = 0.89), whereas for trials in which incorrect responses were given, this was 2.56 (SD = 0.94).
Relationships between cognitive and metacognitive measures
Using Spearman correlations, we investigated the associations between cognitive sensitivity and our three metacognitive measures (see Figure 2). First, as Figure 2a illustrates, cognitive sensitivity was substantially associated with metacognitive sensitivity, rs(147) = .60, p < .001. Poorer performers, who have lower cognitive sensitivity by definition, also had lower metacognitive sensitivity to differentiate between correct and incorrect responses, suggesting that they had lower quality information to inform these judgements. As an additional (non-preregistered) descriptive step, we fitted a linear regression to the data in Figure 2a. The best-fitting line fell close to the line of unity (dotted line on Figure 2a), suggesting that cognitive and metacognitive judgements had access to overlapping information.
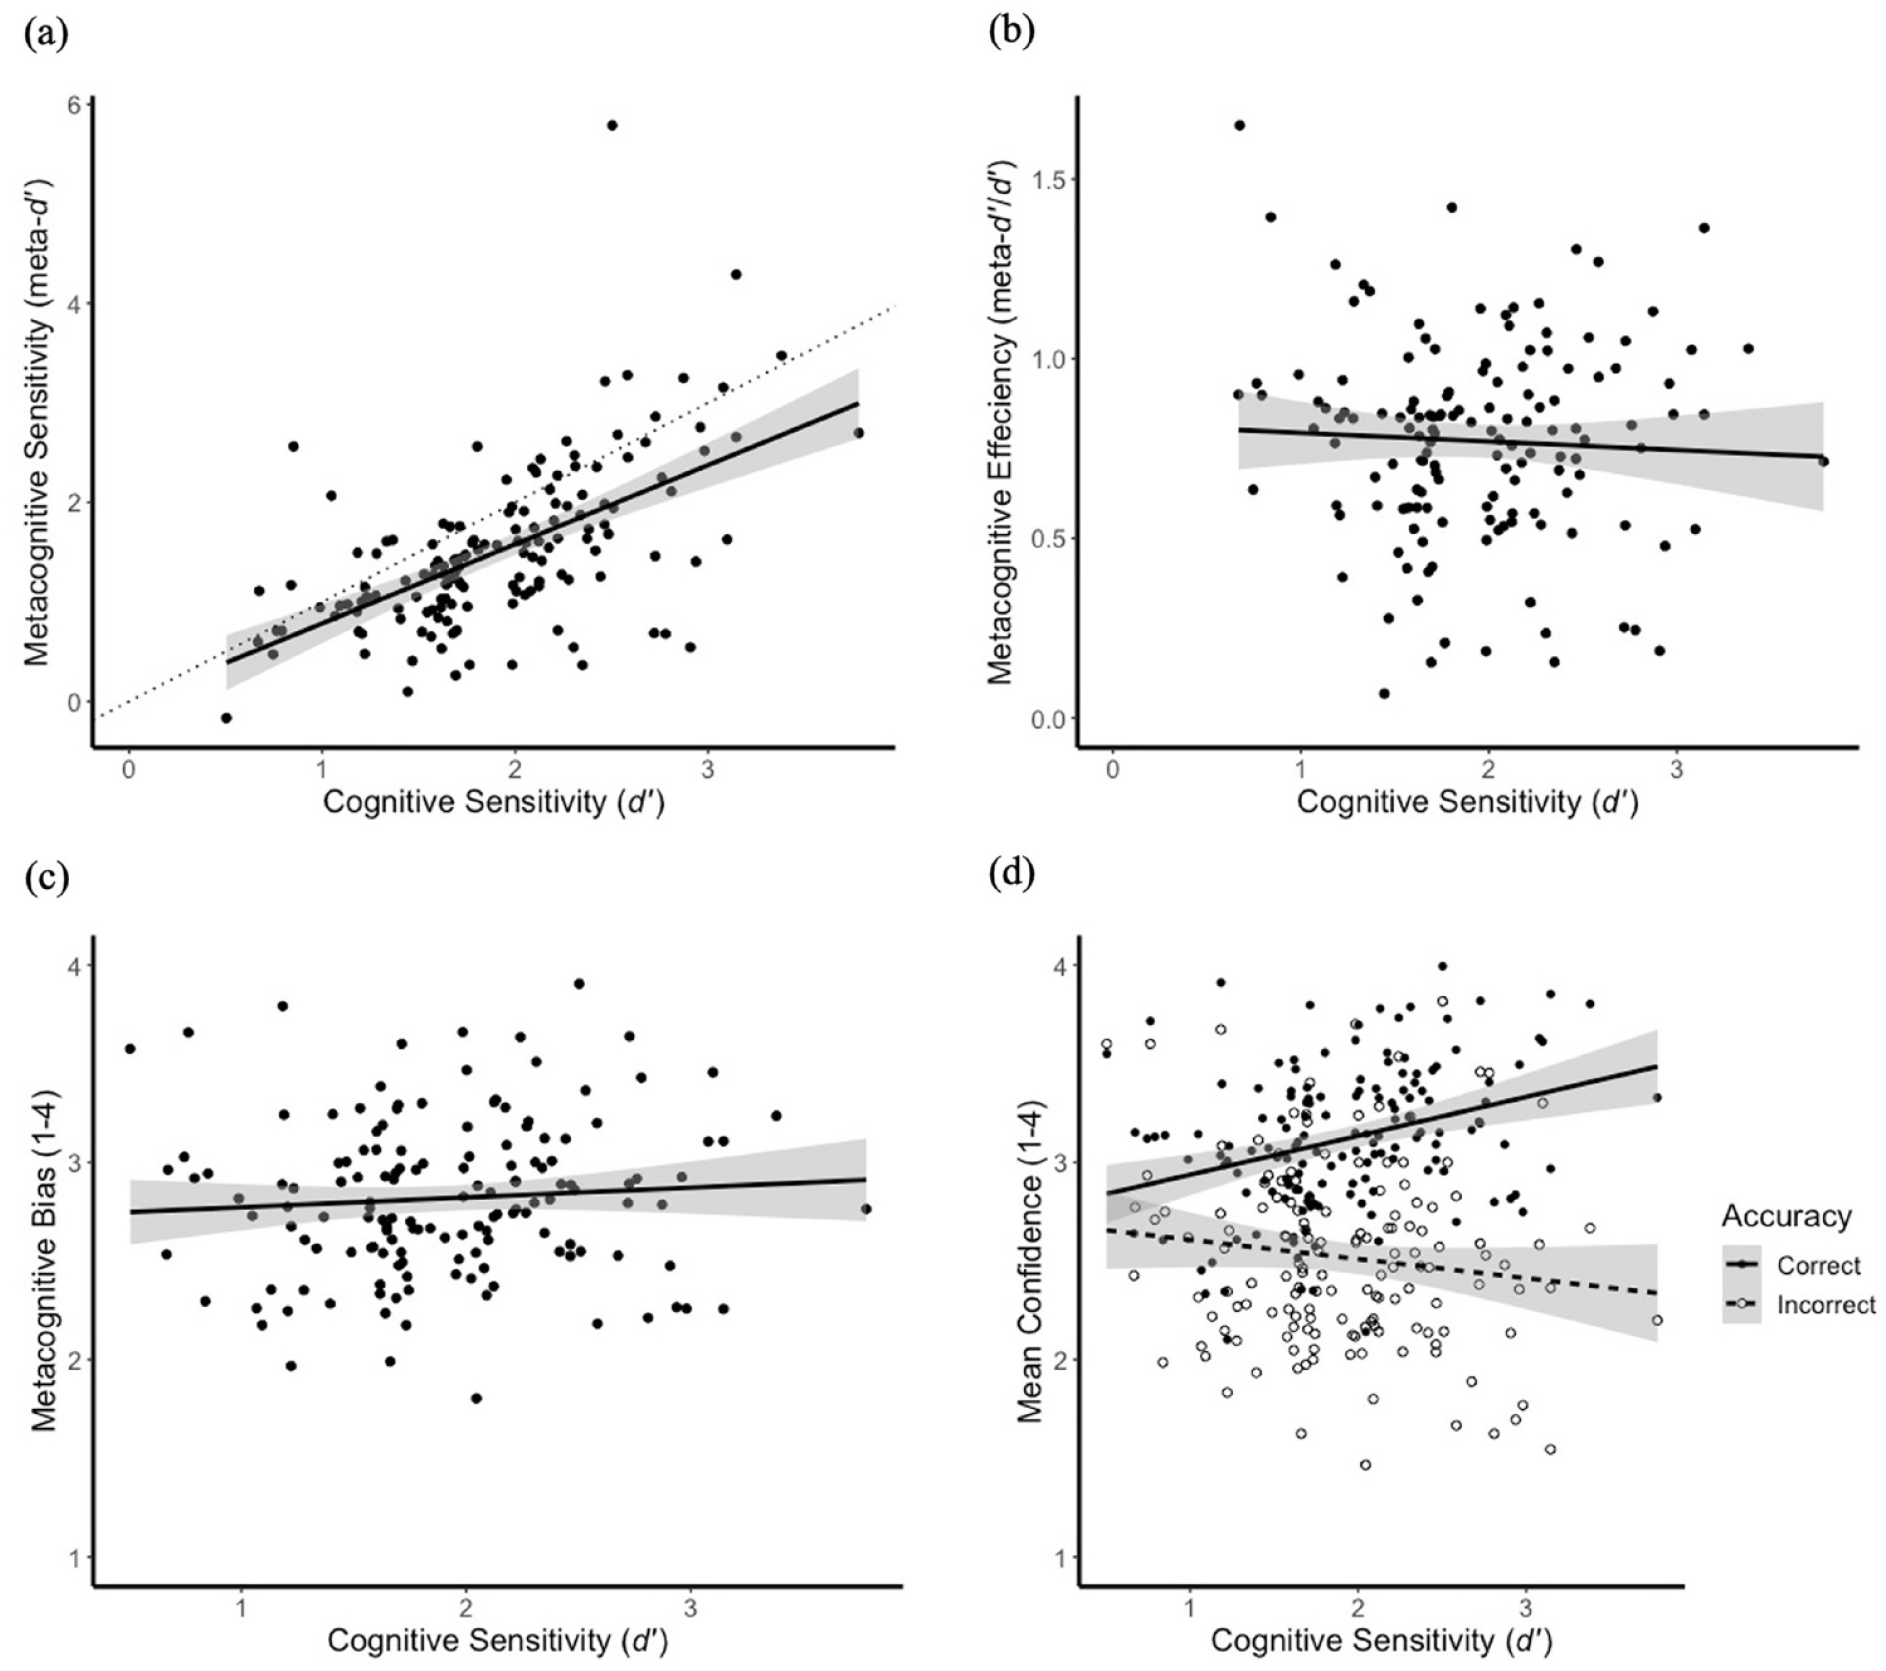
Scattergrams and lines of best fit for the relationships between cognitive sensitivity and (a) metacognitive sensitivity, (b) metacognitive efficiency, and (c) metacognitive bias. (d) The relationship between cognitive sensitivity and mean confidence, separately for correct and incorrect responses. Error bands represent 95% confidence intervals.
Second, as Figure 2b shows, there was no significant association between cognitive sensitivity and metacognitive efficiency, rs(143) = .00, p = .996. That is, the quality of metacognitive processing was not found to be worse for poorer performers after taking into account the differences in the quality of information available to metacognition.
Third, as Figure 2c illustrates, there is no significant association between cognitive sensitivity and metacognitive bias, rs(147) = .11, p = .203. In other words, we found no evidence that poorer performers differed in overall confidence level relative to higher performers, once differences in the number of correct and incorrect trials were accounted for by the metacognitive bias measure.
As a further descriptive observation, it is worth emphasising that a salient divergence in the confidence profiles of good and poor performers was evident when separately considering confidence ratings for correct and incorrect first-order responses (Figure 2d). Higher performers were more confident in their correct than in their incorrect responses, consistent with their higher metacognitive sensitivity, and this discrimination was progressively reduced in poorer performers. The lines of best fit in Figure 2d imply that, for an extremely poor participant (i.e., performing at chance on the task with a cognitive sensitivity of zero), the mean confidence for correct and incorrect responses would converge at around 2.75 on the rating scale.
It could perhaps be argued that a confidence level of 2.75 would be inappropriately high for such a poor performer, for whom the lowest rating option (a “1”) might seem more apt. If so, this pattern might be taken to support the idea, associated with the Dunning–Kruger effect, that poor performers were overconfident relative to their actual ability. However, we would argue against this interpretation of the confidence data. Rather, we suggest that participants tended to use values around the middle of the scale (“2” and “3”) to express uncertainty in their answer (see also McIntosh et al., 2022). Even the best performers, who had the metacognitive insight to be uncertain when responding incorrectly, responded around the middle of the confidence scale on those trials. Therefore, not only did poor performers not differ from good performers in overall metacognitive bias (Figure 2c), but they also showed no clear evidence of relative overconfidence (Figure 2d).
Exploratory analyses
Given the lack of an association between metacognitive bias and performance (Figure 2c), it is possible that good and poor performers may use the confidence rating scale in a similar way across all trials, with the difference that the confidence ratings of better performers are more diagnostic of whether the first-order response was correct or not (Figure 2d). To investigate this further, for each participant, we calculated the percentage of all trials that received each confidence rating (1–4). The relationships between these percentages and task performance were considered for each confidence value separately (Figure 3). It is clear that good and poor performers differed in their use of the confidence scale—the former used many more fours, while the latter used more middle values (twos and threes). As argued above, the middle confidence levels seemed to be used to express uncertain responding. At least for our face matching task, then, the poorest performers generally avoided high levels of confidence, which again does not support the idea, associated with the Dunning–Kruger effect, that they were relatively overconfident.
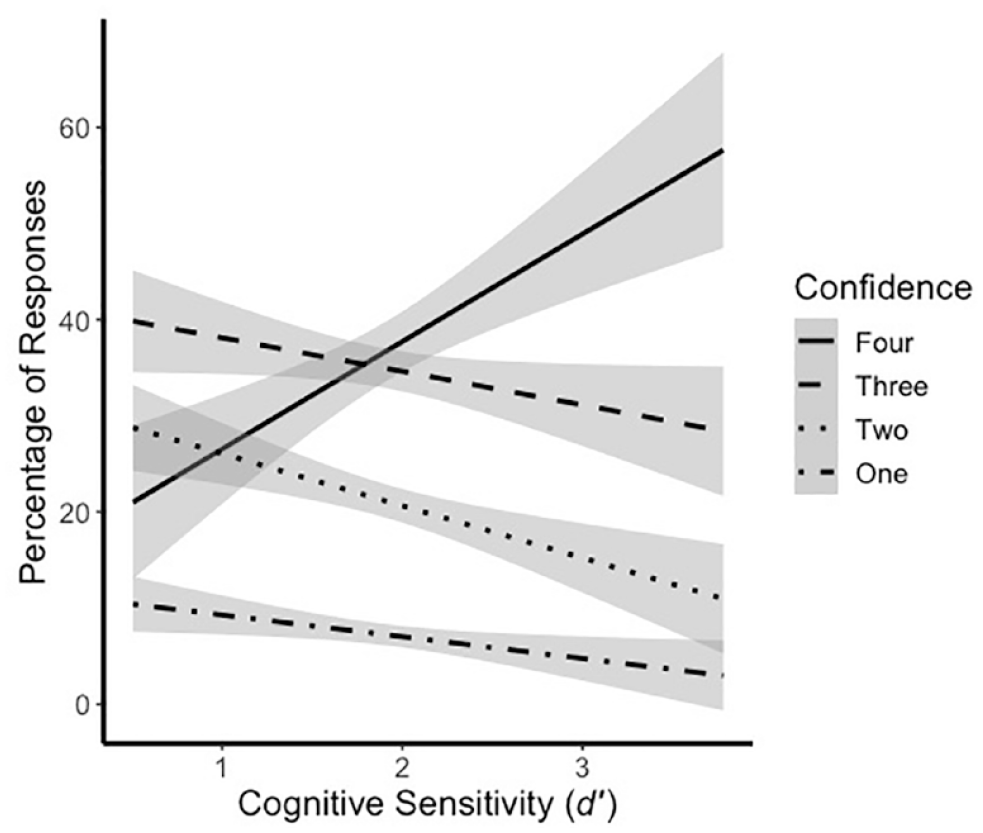
The association between the percentage of responses receiving each confidence rating and performance on the task. Lines represent linear regressions, with error bands representing 95% confidence intervals.
Given the demographic spread in our sample, we also considered two additional factors that might explain some of the variation in our measures (as suggested by our anonymous reviewers). First, previous studies have shown that women outperformed men on tasks of face recognition (see Herlitz & Rehnman, 2008) and matching (Megreya et al., 2011; Stantić et al., 2021). As such, we compared men and women in terms of our four measures of interest. However, we found no significant differences on our task in all cases: cognitive sensitivity—t(146) = 1.78, p = .078, Cohen’s d = 0.29; metacognitive sensitivity—t(146) = 1.17, p = .243, Cohen’s d = 0.19; metacognitive efficiency, t(142) = 0.26, p = .796, Cohen’s d = 0.04; metacognitive bias, t(146) = −0.65, p = .514, Cohen’s d = 0.11.
Second, research has identified an age-related decline in face matching performance during adulthood (Megreya & Bindemann, 2015; Stantić et al., 2021). In addition, previous work using a low-level visual perception task has demonstrated a decrease in metacognitive efficiency with increasing age (Palmer et al., 2014). Here, we found no association between age and our four measures of interest: cognitive sensitivity—r(147) = −.07, p = .347; metacognitive sensitivity—r(147) = −.12, p = .135; metacognitive efficiency—r(143) = −.12, p = .150; metacognitive bias—r(147) = −.07, p = .422.
Discussion
The aim of this Registered Report was to determine the relationship between task performance and metacognitive insight in the domain of unfamiliar face matching. In line with our predictions, and with previous research in the domain of logical reasoning (e.g., McIntosh et al., 2022), poorer performers showed lower metacognitive sensitivity in discriminating their successes from their failures. This was expected because decreases in the quality of sensory evidence available for the type 1 discrimination should make correspondingly worse evidence available for metacognition. Indeed, this finding is relatively uninteresting psychologically because the information available to, and hence that could be exploited by, second-order judgements will be heavily constrained by the information available for first-order decision-making. Recent work investigating the detection of artificial intelligence (AI)-generated synthetic faces has also demonstrated this expected, strong association (Miller et al., 2023).
Perhaps more interesting, we found no association between cognitive sensitivity and metacognitive efficiency. Metacognitive efficiency is a measure of metacognitive sensitivity that is scaled by first-order performance (we used the ratio meta-d′/d′), and thus takes account of differences in the quality of first-order information. When this was taken account of, we found no evidence that poorer performers showed worse metacognitive processing. These results extend recent findings in the domain of logical reasoning (McIntosh et al., 2022) to a face matching task and suggest that cognitive and metacognitive responses do not have overlapping mechanisms, contrary to claims often made on the basis of the Dunning–Kruger effect (Kruger & Dunning, 1999). Instead, metacognition may depend on distinct, second-order processes (e.g., Fleming & Daw, 2017).
Our results also demonstrated that cognitive sensitivity was not associated with overall differences in the tendency towards high or low confidence. Metacognitive bias (calculated as the unweighted mean confidence across correct and incorrect responses) showed individual variation, reflecting individual tendencies towards lower or greater confidence (or use of the scale), but did not vary systematically across the performance spectrum. The current findings provide no support, in the face matching domain, for an assertion that has often been made in relation to the Dunning–Kruger effect, that poorer performers are relatively overconfident in their responses. Indeed, our exploratory analyses demonstrated that poorer performers used more twos and threes when rating their confidence, while good performers used many more fours (Figure 3), again speaking against the general idea of overconfidence in the poorest performers.
We can gain further insights into the use of the confidence scale by inspecting participants’ confidence ratings separately for correct and incorrect first-order judgements (Figure 2d). Here, our results replicated a general pattern found in previous studies (Kramer, 2023; Kramer et al., 2022; McIntosh et al., 2022), that higher performers were far better able to discriminate between their correct and incorrect responses. Their confidence ratings were thus accurate in the sense of being diagnostic of their actual performance. This kind of sensitivity to true variations in one’s own performance is the essence of metacognitive sensitivity, so this pattern of confidence judgements is consistent with, and even required by, a positive association between cognitive and metacognitive sensitivity. An obvious implication of this general pattern, in real-world contexts, is that we should pay attention to the confidence with which known experts express their opinions but be less swayed by expressions of high confidence from people without these credentials.
Although higher performers demonstrated greater metacognitive sensitivity, we found no evidence that they were more metacognitively efficient than poorer performers. Instead, across the range of ability, people were (on average) equally able to make use of the information available to them to form metacognitive judgements. Nonetheless, there were considerable individual differences in metacognitive efficiency, as can be seen from the vertical spread of values in Figure 2b. Some of this variation may be due to random noise in our estimation of metacognitive measures. The analytic methods underlying the calculation of these measures are developed in task contexts (e.g., perceptual discrimination) in which stimuli can be precisely controlled, and task difficulty held constant, so that variations in performance can be attributed to factors internal to participants (Fleming & Lau, 2014). Our task of face matching is more complex and multivariate. Although we took steps to standardise the difficulty of the discrimination across stimuli, this was somewhat approximate (based on prior performance averages), and it is inevitable that some face pairs will have been easier or harder for different individuals. Nonetheless, beyond these uncontrolled factors, there could be individual differences more systematically modulating metacognitive efficiency.
For low-level visual perception, researchers have found evidence of an age-related decline in metacognitive efficiency (Palmer et al., 2014). Our exploratory analyses provided no evidence to support an association between age and our four measures of interest, but further research may be needed to investigate this question in a more targeted manner. In addition, performance on our task was no higher for women than men (in contrast with previous studies; Megreya et al., 2011; Stantić et al., 2021), and we found no evidence of gender differences in any of our metacognitive measures. As such, the sources of individual differences in metacognitive efficiency for face processing are at present unclear. With the goal of real-world applications, it will also be important to ask whether specific types of training might produce improvements in metacognitive efficiency, especially given the demonstrated potential to alter insight more generally through training (e.g., Hahn et al., 2022; Towler et al., 2023).
Numerous studies have attempted to determine whether individuals have insight into their face processing abilities (for a discussion of this topic, see Kramer & Tree, 2023). These have typically involved correlations between global scores on subjective (self-report questionnaires) and objective (face-based tasks) measures. However, such associations are highly approximate and limited to the group level, giving ambiguous information about any individual’s metacognitive ability. By focussing instead on a running commentary of confidence (i.e., trial-by-trial confidence ratings), we have demonstrated that metacognitive insight, as operationalised by metacognitive sensitivity, is substantially associated with performance. Such methods enable us to move beyond aggregate statements, such as labelling groups of people as moderately insightful (e.g., Bobak et al., 2019), to begin to map out individual differences in cognitive and metacognitive abilities and discover the relationships between these levels of performance.
Footnotes
Acknowledgements
The authors thank Stephen Fleming for his advice regarding the analytical approach.
Declaration of conflicting interests
The author(s) declared no potential conflicts of interest with respect to the research, authorship, and/or publication of this article.
Funding
The author(s) received no financial support for the research, authorship, and/or publication of this article.