
Abstract
Objectives:
Female sexual dysfunction is an underestimated problem that negatively affects women’s quality of life. Although the overall prevalence of sexual dysfunction in women is high, only a few studies have focused on this problem. In Japan, an index of female sexual function has not been clearly defined. Hence, this study aimed to investigate the sexual function of normal Japanese women and the temporal changes they experienced using the Female Sexual Function Index administered online in 2012 and 2019.
Methods:
The subjects were Japanese women aged 20–79 years registered in an Internet research company. We collected data of 1034 and 2031 women in 2012 and 2019, respectively, based on Japan’s population distribution according to age. Subsequently, we analyzed the collected data using a Japanese version of the Female Sexual Function Index. We investigated the temporal changes in the Female Sexual Function Index total score, the ratio of women who did not engage in sexual activities and women having “no sexual activity” with their partners, and the total Female Sexual Function Index scores according to age.
Results:
The average Female Sexual Function Index total score decreased from 14.6 in 2012 to 12.5 in 2019 (p < 0.001). No significant difference was observed in the average Female Sexual Function Index score of the group with sexual activity between 2012 (22.2) and 2019 (22.4). The ratio of women not engaging in sexual activities increased from 42.2% in 2012 to 54.0% in 2019. The ratio of women having “no sexual activity” with their partners increased by 10%.
Conclusion:
Comparison of data between 2012 and 2019 indicated that Japanese women have become less sexually active. The average Female Sexual Function Index total score of 22 may be useful as a reference value for diagnosing female sexual dysfunction in Japan.
Introduction
Globally, the prevalence of female sexual dysfunction is approximately 40%–50%. 1
Multiple studies have reported that anxiety and dissatisfaction concerning women’s sexual relationship with their partners affect them mentally and physically. Therefore, sexual wellbeing is important for women’s mental and physical health.2–5
In recent years, pharmacotherapy, physical therapy, and surgical treatment have been used to treat female sexual dysfunction.6–8 Due to an increase in the number of treatment options, our society has entered a new phase of female sexual dysfunction, and the necessity of evaluating the female sexual function has increased. In 1998, the American Urological Association published the definition of female sexual dysfunction based on the Diagnostic and Statistical Manual of Mental Disorder, Fourth Edition and the International Statistical Classification of Diseases and Related Health Problems, Tenth Edition and classified female sexual dysfunction into four categories: desire, arousal, orgasm, and sexual pain. 9
In 2000, Rosen et al. 10 proposed the Female Sexual Function Index (FSFI) as a multidimensional and objective evaluation tool for female sexual function. The FSFI has been used internationally to diagnose various medical conditions and evaluate treatment results due to its excellent psychometric characteristics.
In Japan, only a few studies and surveys focus on female sexual function. The temporal changes in female sexual function at an interval of more than 5 years have occasionally been investigated in Japan and some foreign countries. Araki et al. 11 used a mailing method, comparing data between 2000 and 2012, and indicated that Japanese have become less sexually active.
We hypothesized that the sexual function of normal Japanese women might worsen with time. This study investigated the temporal changes in the sexual function of normal Japanese women by conducting an online survey using the FSFI in 2012 and 2019.
The survey was administered for 2 days in both 2012 and 2019 and was scheduled to be conducted every 10 years, specifically in 2012 and 2022. However, because the “World Meeting on Sexual medicine” was to be held in Japan in 2020, the survey was conducted in 2019, instead of 2022, to present the results in the conference.
Because the FSFI enables us to make objective evaluations, this study used the FSFI to understand the current situation of the sexual function of normal Japanese women. Presently, there are no clear standards on the evaluation of female sexual dysfunction in clinical practice in Japan. Therefore, proposing indices for the FSFI is considered useful for the treatment of female sexual dysfunction in Japan in the future.
Methods
The inclusion criteria for this study were women aged between 20 and 79 years, who were registered in an Internet research firm, and had agreed to participate in the survey related to the female sexual function and completed all sections of the questionnaire.
The number of women who consented to participate in the survey and began answering the survey questions was 1160 in 2012 and 1183 in 2019. Out of these, 126 in 2012 and 152 in 2019 did not complete the questions and were consequently excluded from the study. Therefore, the total number of women who were analyzed in this study was 1034 in 2012 and 1031 in 2019.
FSFI
The FSFI proposed by Rosen et al. (2000) consists of 19 questions concerning the female sexual function, asking women about their sexual function in the last 4 weeks and constituting six domains. These are desire (Questions 1 and 2), arousal (Questions 3, 4, 5, and 6), lubrication (Questions 7, 8, 9, and 10), orgasm (Questions 11, 12, and 13), satisfaction (Questions 14, 15, and 16), and pain (Questions 17, 18, and 19). The total score is calculated using the following formula

A higher score indicates better sexual function, with the perfect score being 36. 10 The FSFI has been used worldwide as a scale that measures female sexual function. 12
This study was conducted using a Japanese version of FSFI, hereby referred to as FSFI-J, developed by Takahashi et al. in 2011. 13 We have included the survey files used in the study as Supplementary File 1 and Supplementary File 2. The FSFI-J asks women about their sexual activity over the past 3 months and defines sexual activity not only as vaginal intercourse but also extending it to include caressing, foreplay, and masturbation. At the beginning of the questionnaire, the following instruction was added: “The following questions are in a form that can be answered without a partner or engaging in sexual activities.” For Questions 15 and 16, which ask women about sexual satisfaction, another instruction was added: “Includes cases without sexual activity.” For Questions 14 and 15, an option of “no partner” was added. Therefore, unlike the FSFI developed by Rosen et al., the FSFI-J cannot be used for cross-national studies regarding female sexual function. In this survey, an original question, “How about your relationship with your partner in your daily life?” was equally asked.
Statistical analysis
Pearson’s chi-square tests for independence (categorical variables) or t-tests for independent samples (continuous variable) were used to examine differences in demographic characteristics between the 2012 group and the 2019 group. The significance level was set at p < 0.05, and data were analyzed using EZR (Easy R) statistical software.
Ethical considerations
We explained to the subjects that this survey was to investigate sexual function. All the subjects voluntarily participated in this survey, and the data obtained were analyzed such that the identity of the participants was not revealed, and informed consent was obtained from everyone. The 2012 study was approved by the Narita Memorial Hospital Ethics Committee (approval no. 25-01-02), and the 2019 study was approved by the Ethics Committee of Tosei General Hospital (ethics no. 771-1). We followed all items, as applicable, of the consensus checklist for retrospective cohort studies contained in version 4 of the Strengthening the Reporting of Observational Studies in Epidemiology (STROBE) statement. 14
Results
Collected data based on Japan’s population distribution
Based on Japan’s population distribution, we collected data from 141 women (13.6%) in their 20s, 188 (18.2%) in their 30s, 176 (17.0%) in their 40s, 175 (16.9%) in their 50s, 201 in their 60s (19.4%), and 153 in their 70s (14.8%), for a total of 1034 women in 2012. In 2019, we collected data from a total of 1031 women: 132 (12.8%) in their 20s, 167 (16.2%) in their 30s, 198 (19.2%) in their 40s, 168 (16.3%) in their 50s, 201 (19.5%) in their 60s, and 165 (16.0%) in their 70s. Table 1 shows the data collected based on Japan’s population distribution by age.
Collected data based on Japan’s population distribution.

This table presents the number of people (%).
This study excluded women who had chosen “no partner” or “no sexual activity” in Question 14. Consequently, the survey classified 567 and 434 survey participants in 2012 and 2019, respectively, as women who engaged in sexual activity, and these women were subsequently categorized.
Background
Table 2 shows the background of the subjects. The number of respondents who were housewives significantly decreased from 468 (45.3%) in 2012 to 386 (37.4%) in 2019 (p < 0.001), and the number of women engaged in part-time jobs significantly increased from 192 (18.6%) in 2012 to 239 in 2019 (23.2%) (p = 0.010).
Background of participants.

SD: standard deviation.
The number of respondents who were housewives significantly decreased from 468 (45.3%) in 2012 to 386 (37.4%) in 2019 (p < 0.001), and the number of women engaged in part-time jobs significantly increased from 192 (18.6%) in 2012 to 239 in 2019 (23.2%) (p = 0.010).
There were many married women and the ratio of housewives to the total number of subjects was high.
There were many married women, and the ratio of housewives to the total number of subjects was high.15–17
FSFI
Total FSFI score
In 2012, the average FSFI-J score of all the subjects (n = 1034) was 14.6, and that of women in their 20s (n = 141) was 21.0, in their 30s (n = 188) was 17.4, in their 40s (n = 176) was 16.4, in their 50s (n = 175) was 13.1, in their 60s (n = 201) was 10.9, and in their 70s (n = 153) was 9.8. In 2019, the average FSFI score of all the subjects (n = 1031) was 12.6, and that of women in their 20s (n = 132) was 19.4, in their 30s (n = 167) was 16.3, in their 40s (n = 198) was 13.4, in their 50s (n = 168) was 12.3, in their 60s (n = 201) was 8.6, and in their 70s (n = 165) was 7.5. Thus, the average FSFI scores of the subjects in their 40s, 60s, and 70s were significantly lower in 2019 than in 2012 (Figure 1).
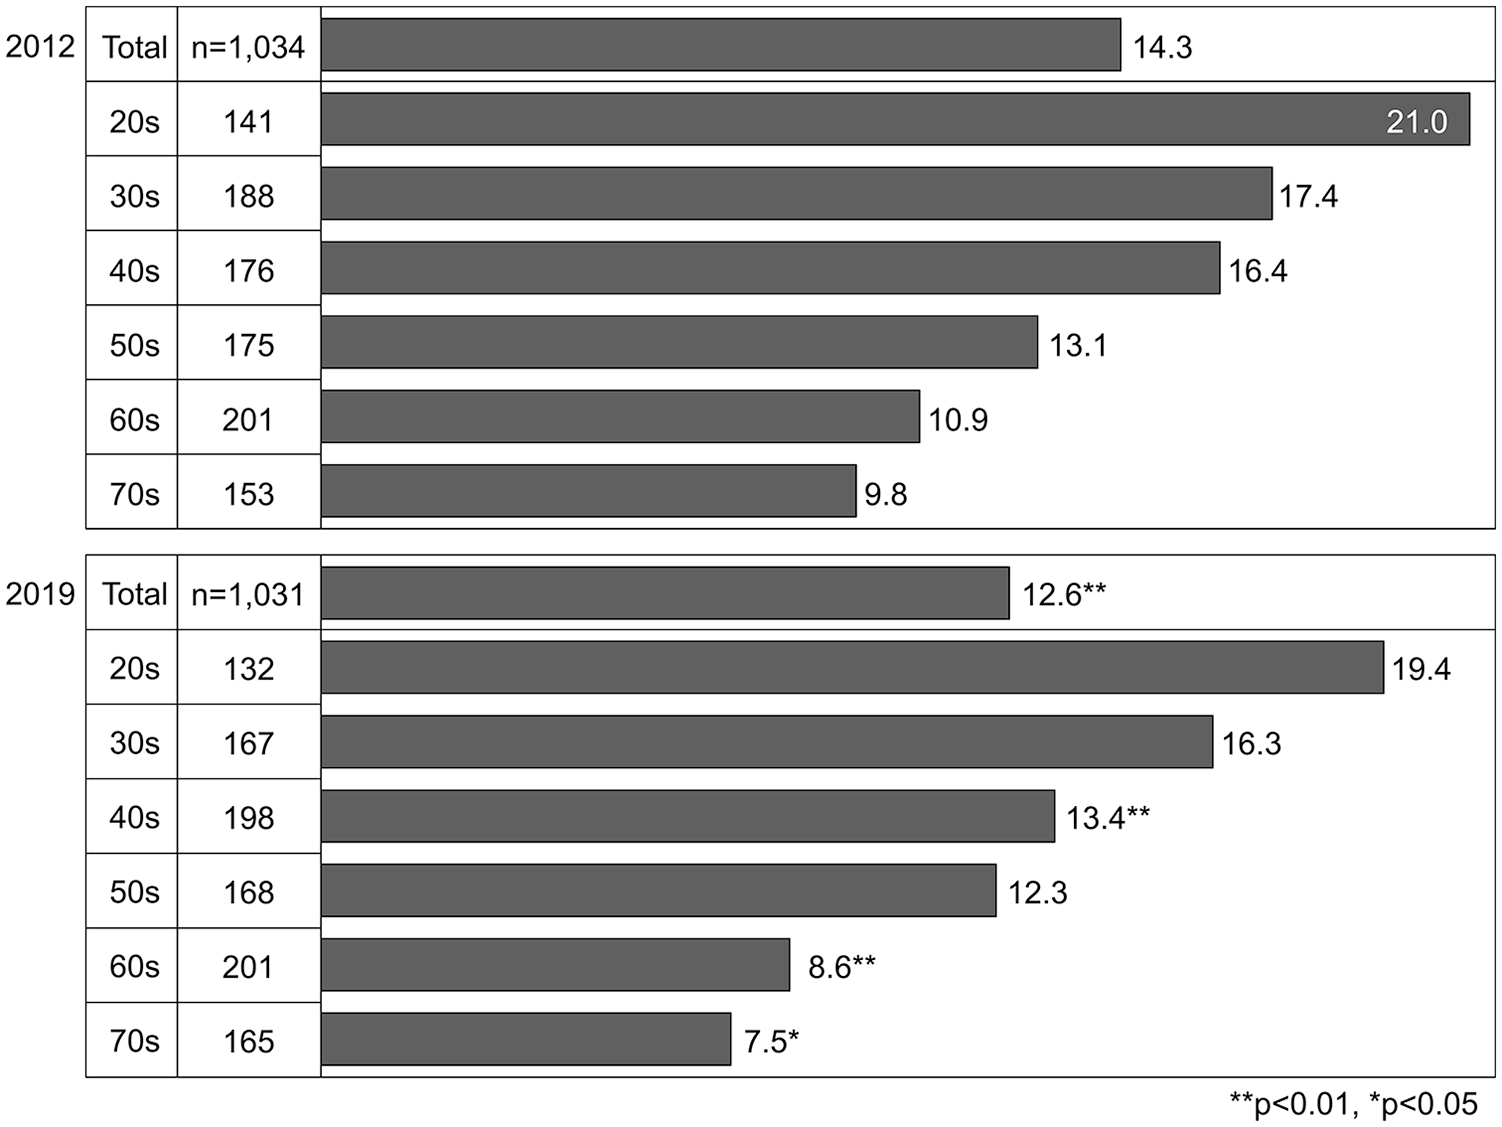
FSFI total scores according to age in 2012 and 2019.
The ratio of women without sexual activity to the total number of subjects
Twelve questions, 3–14, contained a question item of “No sexual activity.” In 2012, the percentages of women who selected “No sexual activity” to the above-mentioned item compared to the total number of subjects were 40.3% in Question 3, 40.0% in Question 4, 40.8% in Question 5, 42.9% in Question 6, 43.3% in Question 7, 43.5% in Question 8, 43.9% in Question 9, 43.8% in Question 10, 40.6% in Question 11, 40.9% in Question 12, 41.2% in Question 13, and 45.4% in Question 14 (included no partner). The average ratio was 42.2%.
In 2019, the ratios of women who answered “No sexual activity” to the above-mentioned item compared to the total number of subjects were 52.8% in Question 3, 51.7% in Question 4, 52.5% in Question 5, 54.5% in Question 6, 54.0% in Question 7, 54.4% in Question 8, 55.3% in Question 9, 55.2% in Question 10, 52.7% in Question 11, 53.2% in Question 12, 53.5% in Question 13, and 57.9% in Question 14. The average ratio was 54.0%; thus, the ratio of women without sexual activity increased by more than 10% 7 years from the first survey.
According to age, the percentages of those who answered “No sexual activity” to the above-mentioned item in relation to the total number of subjects in Question 3 were 13.5% in their 20s, 27.7% in their 30s, 30.1% in their 40s, 47.4% in their 50s, 54.2% in their 60s, and 66.0% in their 70s in 2012. In 2019, the ratio of women who answered “No sexual activity” to the above-mentioned item compared to the total number of subjects in Question 3 was 24.2% in their 20s, 34.1% in their 30s, 48.0% in their 40s, 52.4% in their 50s, 71.6% in their 60s, and 77.6% in their 70s. Thus, the ratio signifies an increase of approximately 10% in 7 years regardless of age (Table 3).
The number and ratio of people who answered “no sexual activity” over the past 3 months in Question 3.

The ratio signifies an increase of approximately 10% in 7 years regardless of age.
In 2012, regarding Question 14, which contained two question options, “no partner” and “no sexual activity,” the ratios of women who selected “no partner” and “no sexual activity” compared to the total number of subjects were 16.3% and 28.8%, respectively. In 2019, the ratios of women who selected “no partner” and “no sexual activity” in relation to the total number of subjects were 17.2% and 40.7%, respectively. Thus, the ratio of women who had partners but no sexual activity significantly increased by approximately 10% in 7 years (p < 0.001) (Figure 2).

Question 14: over the past 3 months, how satisfied have you been with the amount of emotional closeness during sexual activity between you and your partner?
Sexual function domains
Regarding the domains of desire, arousal, lubrication, orgasm, and pain, the average FSFI-J score of all the subjects was statistically significantly higher in 2012 than in 2019 (p < 0.05). However, for desire, the average FSFI-J score of women with sexual activity was statistically higher in 2019 than in 2012 (p = 0.019). However, no significant differences were observed in other domains between 2012 and 2019 (Table 4).
Sexual function domains in the FSFI.

SD: standard deviation.
Regarding the domains of desire, arousal, lubrication, orgasm, and pain, the average FSFI-J score of all the subjects was statistically significantly higher in 2012 than in 2019 (p < 0.05). However, for desire, the average FSFI-J score of women with sexual activity was statistically higher in 2019 than in 2012 (p = 0.019). However, no significant differences were observed in other domains between 2012 and 2019.
Relationship between women and their partners and their total FSFI-J scores
The relationship between the question “How about your relationship with your partner in your daily life?” and the FSFI-J scores were investigated. Results showed that the average FSFI score of women with partners (n = 855) was 14.04 ± 10.03. Regarding each question item, the average FSFI-J score of women who answered “very good” (overall (n = 313), women with sexual activity (n = 188), and women without sexual activity (n = 125)) was 16.81. The score of women who answered “good” (overall (n = 242), women with sexual activity (n = 141), and women without sexual activity (n = 101)) was 14.89, and those who answered “normal” (overall (n = 248), women with sexual activity (n = 97), and women without sexual activity (n = 151)) obtained a score of 11.15. Finally, the score of women who answered “bad” (overall (n = 30), women with sexual activity (n = 7), and women without sexual activity (n = 23)) was 7.63, and those who answered “very bad” (overall (n = 22), women with sexual activity (n = 1), and women without sexual activity (n = 21)) obtained a score of 6.63 (Figure 3).

Relationship between women and their partners and their total FSFI-J scores.
Relationship between the total FSFI-J score and age
As shown in Figure 1, the average FSFI-J total score decreased with age in both 2012 and 2019.
In 2012, the average FSFI-J score of all the subjects with sexual activity was 22.2; the average FSFI-J scores were 24.4 in their 20s, 23.0 in their 30s, 22.4 in their 40s, 20.8 in their 50s, 19.7 in their 60s, and 22.3 in their 70s. Thus, the average FSFI-J score of women in their 70s was the highest among the subjects. In 2019, the average FSFI-J score of all the subjects with sexual activity was 22.4; the average FSFI-J scores were 24.7 in their 20s, 22.7 in their 30s, 23.0 in their 40s, 22.4 in their 50s, 18.8 in their 60s, and 19.9 in their 70s. Thus, no significant differences were observed between 2012 and 2019.
Discussion
In recent years, the necessity of evaluating female sexual function and dysfunction has been recognized. 18 Presently, self-report questionnaires play a central role in assessing the sexual function of both men and women in medical examinations.19–21 When Takahashi et al. developed FSFI-J, they examined factorial, judgmental, and reference-related validities and confirmed that the FSFI-J was appropriately validated. 13 For this reason, we used FSFI-J in this study.
The FSFI-J total scores, including the results of all the sexual function domains, were higher in 2012 than in 2019 (Table 4). Similar to the decrease in the ratio of housewives in the recent census, this ratio was lower in 2019 than in 2012. 17 Therefore, the changes in social conditions were considered to be reflected in the study results.
The decrease in the average FSFI-J total score from 2012 to 2019 may be due to the 10% increase in women with no sexual activity despite having partners. Araki et al. compared data between 2000 and 2012 and indicated that Japanese have become less sexually active. 11 Moreover, this tendency was presumed to be further accelerated in 2019. According to the data obtained by Araki et al. 11 (2012), the sexual function of people in their 70s was excellent, and people in their 70s are supposedly in the “golden age.” People in their 70s progressed to the 80s age group in 2019, who were not included in this study. Moreover, people in their 60s aged to the 70s group in 2019. Therefore, people in their 70s who engaged in sexual activities in 2012 were no longer active in 2019.
Although the average FSFI-J total score of all the subjects decreased from 2012 to 2019, no significant difference was observed in the average FSFI-J score of women regarding the domain of sexual satisfaction between 2012 and 2019. As this domain included no sexual activity, Japanese women were considered to have maintained a good relationship with their partners even without sexual activity.
In 2019, a significant difference was observed in the domain of “desire” among sexually active women. However, significant changes were observed in the other five domains between the years 2012 and 2019.
Since women’s average FSFI-J score tended to increase as their relationship with their partner improved, it could be said that women with good partners had a good sexual function. However, among the 555 women who considered their relationship with their partners being “good” or “very good,” 226 (40.7%) did not have any sexual activity with their partners. Therefore, factors other than having sexual activity affected a good relationship with their partner.
In the group with sexual activity, the average FSFI-J score was between 22 and 23 in both 2012 and 2019, respectively. In 2000, the total scores of FSFI developed by Rosen et al. 10 were 30.5 ± 5.29 and 19.2 ± 6.63 in the control group and sexual dysfunction group, respectively. The cutoff value proposed by Wiegel et al. 22 was 26.55. In the results of the 2005 Global Sex Survey that examined sexual attitudes and behavior of 317,000 people from 41 countries, the frequency of sexual intercourse for Japanese people was the lowest globally. 23
This is probably due to the principle of five desires in Buddhism, the predominant religion in Japan, and the shame culture in Japan. In Buddhism, there is an idea of five desires (desires for food, fortune, love affair, fame, and sleep) and a desire for love affair, that is, libido, all of which are deemed unfavorable. 24
Similarly, Japan has a prominent shame culture, wherein people dislike disgracing themselves. 25 Because Japanese women do not want to embarrass themselves in public, they have considered a modest attitude a virtue for a long time. Therefore, very few women sexually approach men in Japan.
There is a certain relationship between sexual activity and childbirth; therefore, a definite relationship is considered to exist between sexual inactivity and declining birthrate. Presently, Japan has become an aging society with a low birth rate; the ratio of older people to the total population has increased, and the population of young people has decreased.
In Japan, although the number of people aged >65 years will not change significantly, the number of people aged 20–64 years will decrease drastically from 2020 to 2065. Simply, the ratio of older people to the total population will increase by approximately 10% in this period. Consequently, the number of people aged >65 years will account for 38% of the total population in 2065. 26
Because sexlessness is progressing in Japan, investigating the reasons for sexlessness and its countermeasures is supposedly necessary to maintain a stable society in the future. Because sexual activity is lower in Japan than in other countries, the FSFI developed by Rosen et al. 10 and the cutoff value proposed by Wiegel et al. 22 were difficult to apply to Japanese people.
Among the studies on Asians, Ma et al. 27 reported that the cutoff value of urban Chinese women was 23.45 and that urban Chinese women were more open and had more liberal attitudes toward sexual issues than women in other countries. Thus, the rates of sexually transmitted diseases were lower in urban Chinese women than in women in other countries.
Using the FSFI data of healthy people in Japan obtained through existing literature, Takahashi’s total score was 22.03 ± 8.22, 13 Imamura and Kayashima’s 28 total score was 21.77 ± 5.83, and Iwata et al.’s total score was 23.1 ± 8.2, wherein the subjects were 21.0 ± 2.6 years old. 29 Therefore, it was thought that the average FSFI-J total score of 22 in 2012 and 2019 obtained in this study could be used as the reference value of FSFI-J for Japanese women with sexual activity (Table 5).
FSFI cutoff scores in foreign women and total scores in Japanese women.

Limitations
As this survey was conducted through the Internet, there were limitations, including subject bias, as many subjects were housewives, and this factor may have influenced the reliability of the results obtained. Besides, because elderly people are not familiar with operating a computer, their participation in the survey may have been curtailed, further contributing to the bias. Okumura conducted an Internet survey and reported that 62.5% of the participants did not resist responding to the questions in the FSFI. 30 Therefore, the advantage of an Internet survey was that the participants found it relatively easy to respond to the questions because of anonymity.
Conclusion
In 2012 and 2019, we surveyed more than 2000 women through the Internet and investigated the temporal changes in the sexual function of Japanese women. Results showed that Japanese women engaged in less sex compared to previous years. For Japanese women with sexual activity, a total FSFI-J score of 22 could be used as a reference value. This reference value may be useful for diagnosing sexual dysfunction in Japanese women.
Supplemental Material
sj-doc-1-whe-10.1177_17455065211009103 – Supplemental material for Evaluation of temporal changes in the sexual function among Japanese women using the female sexual function index: An Internet survey
Supplemental material, sj-doc-1-whe-10.1177_17455065211009103 for Evaluation of temporal changes in the sexual function among Japanese women using the female sexual function index: An Internet survey by Keiko Okumura, Hirokazu Takeda and Toshikazu Otani in Women’s Health
Supplemental Material
sj-pdf-2-whe-10.1177_17455065211009103 – Supplemental material for Evaluation of temporal changes in the sexual function among Japanese women using the female sexual function index: An Internet survey
Supplemental material, sj-pdf-2-whe-10.1177_17455065211009103 for Evaluation of temporal changes in the sexual function among Japanese women using the female sexual function index: An Internet survey by Keiko Okumura, Hirokazu Takeda and Toshikazu Otani in Women’s Health
Supplemental Material
sj-pdf-3-whe-10.1177_17455065211009103 – Supplemental material for Evaluation of temporal changes in the sexual function among Japanese women using the female sexual function index: An Internet survey
Supplemental material, sj-pdf-3-whe-10.1177_17455065211009103 for Evaluation of temporal changes in the sexual function among Japanese women using the female sexual function index: An Internet survey by Keiko Okumura, Hirokazu Takeda and Toshikazu Otani in Women’s Health
Footnotes
Author contributions
K.O. designed the study, contributed to data collection and interpretation, and wrote the initial draft of the manuscript. H.T. assisted in the preparation of the manuscript. Under the supervision of T.O., this manuscript is completed. All authors approved the final version of the manuscript, and agree to be accountable for all aspects of the work in ensuring that questions related to the accuracy or integrity of any part of the work are appropriately investigated and resolved.
Declaration of conflicting interests
The author(s) declared no potential conflicts of interest with respect to the research, authorship, and/or publication of this article.
Funding
The author(s) received no financial support for the research, authorship, and/or publication of this article.
Unblinded ethical statement
The 2012 study was approved by the Narita Memorial Hospital Ethics Committee (approval no. 25-01-02), and the 2019 study was approved by the Ethics Committee of Tosei General Hospital (ethics no. 771-1).
Supplemental material
Supplemental material for this article is available online.
References
Supplementary Material
Please find the following supplemental material available below.
For Open Access articles published under a Creative Commons License, all supplemental material carries the same license as the article it is associated with.
For non-Open Access articles published, all supplemental material carries a non-exclusive license, and permission requests for re-use of supplemental material or any part of supplemental material shall be sent directly to the copyright owner as specified in the copyright notice associated with the article.