
Abstract
Background:
Period product insecurity (PPI), a material hardship characterized by the repeated inability to afford menstrual products, is rarely integrated into mainstream poverty research in part because we lack measures to capture its incidence.
Objectives:
This article introduces and validates a new measurement instrument, the Van Ness Period Product Insecurity Scale (VNPPIS), which measures PPI. Design: The VNPPIS includes a 7-item gold standard scale for rigorous research applications and a 4-item short form tailored for time- or resource-constrained settings. The 7-item and 4-item scales capture four key domains of PPI: access and affordability, worry, coping, and consequences.
Methods:
Scale development included cognitive interviews (N = 18), 3 rounds of pilot testing (N = 100 each), and psychometric evaluation in a nationally fielded survey (N = 1503).
Results:
Results from the national survey showed that roughly 40% of the U.S. adult population is eligible to be screened for PPI. After fielding the VNPPIS in a national sample, results show that approximately 20% of those screened were found to experience PPI, meaning 8% of the U.S. adult population are likely to experience PPI. Results demonstrate both VNPPIS versions’ strong internal consistency and evidence of face, construct, and predictive validity. PPI is moderately correlated with food insecurity and other known financial strains but emerges as a distinct material hardship. Notably, PPI is a predictor of elevated risk for anxiety and depression, outperforming food insecurity.
Conclusion:
These findings affirm the VNPPIS as a reliable and valid tool that can inform research, policy design, and interventions.
Plain language summary
Many people in the United States cannot afford the menstrual products they need each month—a challenge known as period product insecurity (PPI). Until now, there hasn’t been a tested way to measure how common this issue is or how it affects people’s lives. This study introduces a new tool called the Van Ness Period Product Insecurity Scale (VNPPIS). It helps researchers, practitioners, and policymakers understand who is affected by PPI and how it connects to other hardships like food insecurity and poor mental health. The scale comes in two versions: a 7-question version for in-depth research and a shorter 4-question version for quick use in busy settings like clinics or surveys. The scale was developed with input from people who experience PPI and tested in multiple rounds with over 1500 people across the U.S. Results show that about 8% of U.S. adults are currently facing period product insecurity. People who experience PPI are more likely to also struggle with anxiety, depression, and affording other basic needs, even more so than those facing food insecurity. This new scale gives researchers, advocates, and policymakers a reliable way to track and respond to this overlooked issue—and to push for policies that make menstrual products affordable and accessible for everyone.
Introduction
Despite the essential nature of menstrual products, many individuals in the United States still struggle to afford them regularly. This type of material hardship, known as period product insecurity (PPI) or period poverty, refers to the ongoing inability to afford menstrual products due to insufficient income. PPI is a multidimensional experience encompassing worries about access, coping strategies to stretch or substitute supplies, negative consequences from inadequate product use, and underlying affordability constraints that limit consistent access to necessary items. Policymakers and public health experts have begun to take notice of people’s experiences of PPI, with the rapid growth of legislation introduced in recent years to address the issue. Yet, even as momentum to address PPI through policy and/or public health interventions builds, the field lacks a standardized measure capable of capturing the multidimensional nature of PPI across diverse populations. Existing frameworks often depend on unvalidated market research or fragmented survey items that fail to represent the lived experiences of those affected by PPI adequately. While the existing literature has focused on demonstrating that PPI is a meaningful public health issue, no studies to date have developed reliable and validated measurement tools, a critical step for tracking prevalence, comparing groups, evaluating policy impacts, and guiding resource allocation. Recent international work demonstrates important progress toward measurement 1 but a comparable validated tool has not yet been developed domestically. As a result, policymakers are left to debate solutions without sufficient evidence of the underlying problem. This article seeks to address that gap by developing and validating a robust, multidimensional measure of PPI to support future research and inform more effective policy responses.
Material hardship
Multidimensional poverty indicators have substantially expanded our understanding of economic insecurity by capturing forms of material hardship that income thresholds alone often miss. Material hardship refers to the experience of going without basic necessities due to constrained financial resources, encompassing domains such as food, housing, healthcare, and hygiene. Research has shown that material hardships are constructs and experiences distinct from income poverty. Traditional income-based poverty indicators often fail to identify many households experiencing hardship, and early material hardship indices have been critiqued for lacking dimensional specificity and psychometric rigor.1,2 Scholars have called for multifaceted indicators capable of identifying specific forms of hardship, such as housing instability, 3 energy insecurity,4,5 transportation insecurity, 6 and diaper need.7,8
Many dimensions of material hardship disproportionately affect women and children, reflecting gendered caregiving roles and the specific needs of families managing limited resources. Research consistently shows that children face material hardship at rates two to four times higher than older adults, underscoring their heightened vulnerability. 9 Notably, many of these children live in households above the federal poverty line, with nearly one-third in families earning more than 200% of the poverty threshold. 9 Research consistently shows that material hardship is not only a marker of economic strain but also a predictor of adverse developmental outcomes in children. For example, unmet needs such as food insecurity, basic expense hardship, and even a single instance of unmet medical care are linked to elevated behavioral problems in children. 10 Material hardship also predicts children’s internalizing and externalizing behaviors. 11 In related research, material hardship, particularly food insecurity, is a stronger predictor of anxiety and depression than income itself among low-income pregnant women. 12 Similar findings highlight how material hardships are associated with worsened well-being among caregivers. 13 These findings underscore the pervasive and long-term consequences of material hardship for individuals and families, and they highlight the importance of having accurate measures of multiple dimensions of material hardship.
Material hardships also disproportionately impact racial minorities.11,13–15 Research has demonstrated that substantial racial and ethnic disparities persist in the experience of material hardship among families, with Black and Hispanic households having significantly higher hardship, on average, than white households. 15 Findings indicate that racial and ethnic minority families, as well as those with lower incomes, faced greater levels of material hardship and instability during the pandemic compared to White and higher-income households. 13
PPI as a measure of material hardship
While much of the material hardship literature has focused on domains like food, housing, energy, and healthcare, similar patterns of unmet need and adverse outcomes are increasingly recognized in PPI. Menstrual hygiene is a basic necessity, and the inability to afford or access period products can lead to physical discomfort and distress, 16 missed work or school,17,18 and psychological distress, 19 making PPI a vital yet underrecognized indicator of material hardship. As a gendered and often overlooked form of material hardship, PPI reflects many of the same dynamics of other forms of material hardship: resource scarcity, trade-offs, and stigma. Yet it remains underdeveloped—both substantively and methodologically—in poverty research and policy discourse. In the absence of validated indicators of PPI, emerging research has worked to establish that it is nonetheless a serious and consequential form of material hardship by documenting its prevalence, links to poor mental health, and the trade-offs individuals make to manage menstruation without adequate resources.
PPI has been consistently linked to a range of adverse social, psychological, and educational outcomes, highlighting its broader impact on well-being and daily functioning. Existing research indicates that PPI is associated with increased absenteeism in educational and professional settings,18,20–22 heightened psychological stress and feelings of shame,16,17,19 and pervasive social stigma.16,23–25
Existing research has also documented the multifaceted nature of PPI, showing that it cannot be reduced to a single dimension. Individuals frequently express worry about running out of products or being unable to afford them, which can lead to anxiety and anticipatory stress. In response, many engage in coping behaviors, such as rationing, using makeshift alternatives, or relying on informal networks. 17 These coping strategies often lead to tangible consequences, including missed work or school, reduced participation in daily life, and emotional distress. Underpinning all this are persistent affordability challenges, with individuals forced to prioritize period products over other essentials or forgo them altogether. 17 Therefore, a valid measure of PPI must reflect these four interrelated domains: worry, coping strategies, consequences, and affordability. However, existing work has several limitations that stem from inconsistent and invalidated measures of PPI, as discussed below.
The first limitation in current measurement approaches is that several existing indicators of PPI do not clearly differentiate between lack of access driven by financial hardship and other barriers, such as social stigma, embarrassment, or momentary unavailability. This conflation can obscure who is materially deprived and hinder accurate identification of those experiencing true economic constraint. For example, one widely cited article asks, “In the past 12 months, have you struggled to afford menstrual products (such as sanitary pads or tampons)?” 19 While this question captures an important aspect of the low-income experience, it risks being misconstrued in two ways. First, respondents may conflate “struggling to afford” with the general discomfort of purchasing menstrual products due to stigma or social taboos, rather than actual financial hardship. Second, the wording may lead respondents to think of isolated or one-time incidents rather than PPI’s recurring and cumulative nature. These limitations can obscure the broader context of material hardship and individuals’ coping strategies to manage menstruation without adequate resources
Second, much of the existing research draws on individual-level assessment.20,26 While the individual-level assessment is crucial for documenting first-hand experience and understanding PPI, this individual-level focus leads us to miss key family dimensions in PPI, which is often nested in household-level financial decision-making. 17 For example, we know individuals likely experiencing PPI have to make difficult decisions at the household level, like choosing between period products and other basic needs like car payments, food, medicine, rent, utilities, and other hygiene items. 17 Importantly, those who purchase period products are not always the individuals who use them, further underscoring the need to consider household-level decision-making and intra-household resource allocation. As such, PPI should be conceptualized and measured at the household level.
Third, another limitation, which one of the primary market-based estimates employs, relies on an indefinite recall window. 27 While this captures lifetime prevalence, it is often misused in cross-sectional surveys to suggest how need has grown over time. This approach is methodologically flawed: it conflates historical and recent experiences, cannot account for changing population dynamics, and introduces substantial recall bias. As a result, it offers a distorted—and likely inaccurate—picture of current needs, which is essential not only for scholarly assessments of material hardship but for policymaking efforts as well. Furthermore, it fails to provide reliable estimates of trends or growth in PPI over time.
Fourth, existing measurement approaches often suffer from limited generalizability due to the narrow populations in which they are tested. For example, one existing measure was tested exclusively at not-for-profit community organizations serving low-income women. 20 While this provides valuable insights into a high-risk population, it also falls into the same trap as other previously published measures: by focusing only on individuals likely to struggle financially, it becomes difficult to distinguish true material hardship from more general discomfort or stigma associated with menstruation when moving toward a population-level estimate. Much of the current research also focuses on other important but narrowly defined specific subpopulations, such as girls in K-12 schools,18,21 unhoused populations, 16 incarcerated populations 28 or, in at least one prominent study, college-aged women, 19 limiting the generalizability of findings to the broader population. As a result, existing studies fail to identify the full population at risk. It is critical to move beyond convenience-based approaches and develop methods that define and reach the entire population, including those who may experience PPI but are not currently accessing targeted resources or assistance.
Finally, PPI measurement lacks standardization, making it difficult to compare findings across studies or build a cumulative body of knowledge that accurately gauges the scope, severity, and consequences of PPI. Existing studies use different questions to assess PPI among different populations, leading to highly variable estimates that cannot be meaningfully compared. For example, one study reports that 33% of college-aged women experience PPI, 19 one reports that 42% of “respondents” experience difficulty affording period products, 27 while others report that 64% of low-income women experience PPI. 20 These inconsistencies stem from variation in both measurement and population definition, limitations that must be addressed to understand the true scope and distribution of PPI.
Moreover, none of these measures appear to have been systematically validated; without testing and validating measures among a broader segment of the population, including higher-income groups, there is a risk that questions will produce false positives, capturing social taboos or situational inconveniences rather than genuine PPI. The variability in measurement and sampling strategies highlighted above underscores a more fundamental issue: we still lack a comprehensive understanding of who is experiencing PPI in the United States. To advance a systematic understanding of PPI, the field needs a standardized, validated measure that can be applied across diverse populations.
Current study
The current study fills these gaps in the literature by developing and validating the VNPPIS. This scale establishes a foundational metric for scientific inquiry into PPI. It was developed through cognitive interviewing to ensure questions make sense to high- and low-income populations and reflect PPI, pilot testing to further reform question wording and ensure survey programming, and by thoughtfully defining the population of interest. This article summarizes the scale’s development process, validation strategy, and critical implications for future research and policy interventions by addressing the following objectives:
Defining and identifying the population of individuals who experience PPI in the United States
Creating and validating A robust measure of PPI capturing worry, coping strategies, material, social, and economic consequences, and affordability challenges
Describing households experiencing PPI
Linking PPI and mental health outcomes
Methods
Study design
The Van Ness Period Product Insecurity Scale (VNPPIS; This measure is named the VNPPIS in honor of Susan Van Ness, a pioneering advocate who dedicated her career to addressing material hardships. Susan’s leadership and vision were instrumental in bringing national attention to PPI long before it was widely recognized in policy and academic spaces. Naming this scale after her acknowledges her foundational contributions to this field and ensures that her legacy continues to shape research and practice aimed at addressing unmet basic needs) was developed through an iterative, multi-stage process focused on item generation and refinement. This observational study was approved by Duke University’s IRB protocol: 2024-0467. All participants provided written consent. This consent process was approved via Duke University’s IRB protocol: 2024-0467. The full written consent can be viewed in the Supplemental Appendices. This study also followed the Strengthening the Reporting of Observational Studies in Epidemiology checklist. 29 All analyses were conducted using Stata 18. This study is a observational survey study focused on the development and psychometric validation of the VNPPIS. It involved one-time participation in qualitative cognitive interviews (30–60 min) or one-time online survey completion during pilot testing and national validation. Data collection occurred from August 2024 to February 2025, with no follow-up or longitudinal participation required. Table 1 provides a comprehensive overview of the multi-stage data collection process to develop and validate the VNPPIS. The table outlines five distinct phases, each serving a role in item refinement and validation, from qualitative exploration to large-n survey testing. For each phase, Table 1 details the timeline, eligibility screener questions used, the number of scale items tested, and sample size, illustrating how the final version of the scale was developed over time. All sample sizes were determined using literature from survey methods research30–33 and prior similar studies related to material hardship in the field.6,8,10,34
Overview of data collection.

Answers to screener questions determine eligibility for each phase.
Statistical analyses
Statistical analyses focused on scale reliability, structure, and validity using the pilot and validation samples. Reliability and item performance were assessed using internal consistency statistics (Cronbach’s alpha, McDonald’s omega, item–rest correlations, and inter-item covariances), and the scale’s measurement structure was evaluated using item response theory via a graded response model (IRT/GRM) and confirmatory factor analysis (CFA). Construct validity was examined using Pearson correlations with United States Department of Agriculture 6-item food insecurity and inability to cover a $400 expense, prevalence was estimated using the additive 7-item and 4-item scoring thresholds, and predictive validity was assessed with multivariable logistic regression models predicting GAD-2 and PHQ-2 risk while adjusting for key demographic and household covariates.
The development process began with cognitive interviews (August to September 2024, N = 18), a method used in survey design to assess how participants interpret and respond to draft items35,36 where participants provided in-depth feedback on item clarity, relevance, and interpretability. Interviews ranged from 30 min to 60 min. Participants provided in-depth feedback on item clarity, relevance, and interpretability, helping to identify and resolve potential sources of confusion or misinterpretation. All cognitive interviewees answered 20 items, which were adapted from the U.S. Household Food Security Survey Module. 37 Items were modified to reflect the specific context of PPI, preserving the core structure and logic of food insecurity questions while shifting the focus to menstrual product access, affordability, and coping strategies. For example, the item “I/we couldn’t afford to eat balanced meals” was adapted to “I/we couldn’t afford the type of period products I/we preferred.” This approach allowed for systematic adaptation of a validated scale to a new domain, ensuring content validity while attending to the unique features of PPI. A detailed explanation of all modified items can be found in Supplemental Appendix A.
The author tested these 20 preliminary items during the cognitive interview phase and experimented with multiple screener variations. The full 20-item scale used in the cognitive interview phase can be found in Supplemental Appendix A. During the cognitive interviews, participants were screened based on whether they had personally experienced a menstrual period in the past year. Yet many individuals who do not menstruate or are not currently menstruating are responsible for securing period products for others in their household. During interviews, several low-income caregivers shared that they had not menstruated recently due to reasons such as childbirth, breastfeeding, or use of hormonal contraception.
Yet, they could still answer survey items as they were responsible for period product provision in their households. Under the original screener—and most existing measures—these individuals, who navigate PPI within their households, would have been excluded from the study. The screener was revised to ask whether participants had purchased menstrual products for themselves or anyone in their household, rather than if they alone had experienced a menstrual period. This change better captures the relational and caregiving aspects of period product access, especially within households that include multiple menstruators, including children. In the nationally fielded sample, 36% of respondents would have been excluded by the original screener question—“Have you had a menstrual period at least once in the past year?”—highlighting how this approach may under-identify households experiencing PPI.
After completing cognitive interviews, the author conducted three pilot studies. Each with approximately 100 participants recruited through the Forthright online survey platform to refine the scale and evaluate its performance in more demographically diverse samples. Survey data were collected using the online research platform Forthright, which connects users with paid survey opportunities and partners with organizations to support high-quality data collection. Additional details about Forthright’s methods and protocols are provided in Supplemental Appendix B. Pilot 1 (September 2024, N = 105) tested 18 items using a revised household-level screener: “Do you provide menstrual products (pads, sanitary napkins, tampons, etc.) for yourself or anyone in your household?” This shift aimed to capture non-menstruating caregivers while maintaining focus on individuals responsible for product access. In Pilot 2 (October 2024, N = 101), the screener was revised to “Have you purchased menstrual products (pads, sanitary napkins, tampons, etc.) for yourself or anyone in your household?”—a purchase-based frame that better aligned with material hardship measurement by offering a tangible behavioral indicator of responsibility. This round also reduced the item pool to 17, eliminating redundancies and improving clarity. Pilot 3 (January 2025, N = 100) retained the purchase-based screener and further refined the scale to 13 items, focusing on variability, dimensional coverage (worry, coping, affordability, consequences), and optimization of item performance. Across pilots, preliminary analyses not only indicated strong internal consistency (Cronbach’s alpha > 0.90) but also suggested redundancy. In response, the author removed or consolidated overlapping items to reduce respondent burden while preserving the conceptual scope of the scale. Second, the pilot phase created an opportunity to oversample individuals who do not menstruate, allowing me to examine whether individuals who do not menstruate could accurately report on household-level PPI. This was especially important for ensuring that the final scale captured the experiences of caregivers and household members responsible for managing menstrual product needs on behalf of others.
The pilot data also revealed key response patterns differentiating individuals with material hardship from those whose responses reflected developmental or emotional experiences unrelated to economic insecurity. For example, items referencing shame or embarrassment were occasionally affirmed by higher-income respondents who did not experience financial barriers to period product access but expressed general discomfort discussing menstruation. In contrast, respondents with lower incomes more consistently endorsed coping behaviors such as rationing products or using substitutes, indicating a clearer association with material hardship. These patterns underscore the necessity of testing items across income levels to ensure the scale captures true economic constraints rather than conflating them with normative developmental experiences or broader emotional stressors. This interpretive insight guided refinements in item wording and response options, reducing ambiguity and enhancing the measure’s construct validity. Based on cross-item response patterns, the pilot data were essential for understanding who was likely secure versus insecure in terms of PPI.34,38
The validation phase (February 2025, N = 1503) employed the same refined screener and the final 7-item scale for national administration. Table 2 introduces the final seven items retained in the scale. In addition to conceptual and statistical considerations, the scale was intentionally designed to sustain respondent engagement and minimize satisficing behaviors. Rather than relying solely on binary yes/no questions, the survey includes a variety of response formats.30,31,39–42 This variation not only reflects the complexity of lived experiences with PPI but also serves to keep respondents cognitively engaged throughout the survey. Moreover, several items incorporate flipped or reverse-coded phrasing, prompting respondents to read carefully and consider each item on its terms rather than responding reflexively.31,38 The recall window was informed by established survey methodology research, which provides empirical guidance on optimal time frames for accurately capturing experiences of material hardship.30,31,38,39,43 These design features were implemented to improve response quality and enhance measurement precision.
Final 7-item scale: Response options, scoring, and endorsement.

Denotes inclusion in 4-item scale for practitioner use.
Endorse equals “often true” or “sometimes true.”
Different versions of each VNPPIS question were created to ensure that respondents saw questions that reflected the needs of their households. To do so, respondents first answered a single item that asked, “Who do you purchase menstrual products (pads, sanitary napkins, tampons, etc.) for in your household? Check all that apply.” Response choices were: myself, other adults, children (under age 18), I do not purchase menstrual products for anyone in my household. Responses to this item determined which version of the survey questions each participant received, with unique wording for 11 possible combinations. For instance, a respondent who only checked “myself” was shown the following version of question one: “I was able to afford the type (e.g., pads, tampons, underwear liners, etc.) of period products I preferred.” In contrast, a respondent who selected “other adults” in addition to “myself” was shown the following version: “We were able to afford the type (e.g., pads, tampons, underwear liners, etc.) of period products we preferred. Was that often true, sometimes true, or never true for you in the last 12 months?” Additionally, only those who indicated that they purchased menstrual products for children were asked question 7b, which asked about children having to miss school due to lack of money for period products. All versions of the VNPPIS questions and to whom they were asked are provided in Supplemental Appendix C.
To generate additive summary scores for the 7-item and 4-item versions of the VNPPIS, the author summed the recoded item responses, where each item was coded to reflect the increasing severity of PPI. The resulting additive variables for the 7-item and the 4-item reflect the cumulative burden of insecurity experienced by each respondent, with higher scores indicating greater frequency or severity across multiple dimensions of PPI. Total scores could range from 0 to 10 on the 7-item scale and 0 to 6 on the 4-item scale.
The complete scoring matrix for the VNPPIS can be found in Table 3. The additive scoring matrix was designed with user ease and mind and model the scoring of the Household Food Insecurity Scale. 37 Scores of 0–3 on the 7-item scale and 0–2 on the 4-item scale were categorized as “No Insecurity” based on the principle that PPI, by definition, reflects a repeated or sustained inability to afford menstrual products. A single affirmative response, particularly if mild or infrequent, may reflect an isolated or interpretively ambiguous experience rather than a pattern of insecurity. These thresholds help ensure that individuals classified as experiencing insecurity show evidence of consistent and multidimensional hardship.
VNPPIS scoring matrix.

VNPPIS: Van Ness Period Product Insecurity Scale.
denotes insecurity.
Insecurity is further stratified into moderate and high levels to reflect the severity and breadth of hardship across multiple domains. Moderate Insecurity captures individuals with multiple affirmations indicating periodic or situational challenges accessing period products, such as occasional substitution or stretching of product use. High Insecurity reflects more pervasive and severe hardship, characterized by cumulative experiences. This tiered classification enables a nuanced understanding of PPI severity, providing valuable insights for research and policy interventions.
For the validation sample, Forthright ensured that the pool of individuals initially invited to view the survey was representative of the U.S. population across key demographic characteristics, including gender, age, race, and geography. After establishing this representative sampling frame, no additional quotas were imposed at the point of survey completion. This approach allowed the final sample to form organically based on participants’ eligibility to complete the survey. As a result, while the initial opportunity to participate demographically reflects the U.S. population, the final sample reflects the demographics of those for whom PPI may be present (those who purchase period products for themselves or others).
Table 4 presents the demographic characteristics of the full validation study sample across key domains, including gender, age, region, race, and Hispanic ethnicity. Three thousand eight hundred and four individuals initially consented to participate in the study; it was a written consent form. The distribution of respondents who consented closely mirrors national patterns, reflecting the sampling strategy of ensuring demographic representativeness at the recruitment stage. Those individuals were asked the following household-level screener to determine eligibility for the VNPPIS: “Have you purchased menstrual products (pads, sanitary napkins, tampons, etc.) for yourself or anyone in your household in the last year?” Notably, approximately 40% of the U.S. population had purchased menstrual products for themselves or someone in their household in the past year, making them eligible to complete the survey (analytical sample in Table 4).
Sample characteristics and eligibility for VNPPIS (%).

VNPPIS: Van Ness Period Product Insecurity Scale; ACS: American Community Survey.
ACS 5-year estimates 2023 Data.
The final column labeled “Analytic Sample” represents the 1503 individuals who both passed this screener and provided valid responses to all scale items, making them eligible for inclusion in the primary analyses. This group serves as the basis for answering research question 1. Their demographic breakdown reveals important insights into which subpopulations are most likely to experience or manage PPI in their households. For example, compared to the full consented sample, the analytic sample includes a higher share of women, younger adults, and individuals identifying as Hispanic, Black, or Asian. These patterns suggest that PPI is concentrated in specific demographic groups, and targeted efforts may be necessary to address disparities in access and affordability. A more detailed discussion of how the final analytic sample was constructed is provided in Supplemental Appendix B.
Results
Table 5 presents the psychometric properties of the final 7-item and 4-item VNPPIS, including item coefficients from a GRM using IRT, CFA factor loadings, and item-rest correlations (Cronbach’s alpha). The seven-item version yielded a Cronbach’s alpha of 0.84 (McDonald’s omega = 0.85), with item-rest correlations ranging from 0.42 to 0.68 with an average inter-item covariance of 0.09, indicating strong internal consistency. The 4-item version also demonstrated good reliability (α = 0.78; ω = 0.79), with item-rest correlations ranging from 0.48 to 0.66 and an average inter-item covariance of 0.10.
Seven-item scale with factor loadings for IRT, a Cronbach’s alpha, McDonald’s omega and CFA.

IRT: Item response theory; CFA: Confirmatory factor analysis.
p value < 0.05.
Additional information, including IRT plots, is provided in Supplemental Appendix D.
IRT coefficients indicate each item’s ability to discriminate between respondents with differing levels of PPI severity, while CFA factor loadings assess the contribution of each item to the latent construct of PPI. All items demonstrated strong performance, with particularly high discrimination for items measuring coping strategies and negative consequences (e.g., using alternatives, delaying changes, and missing activities). These results support the scale’s unidimensional structure and robust internal reliability.
Estimating the prevalence of PPI
Table 6 summarizes the distribution of PPI based on the ordinal and binary scoring of the VNPPIS. Using the 7-item scale, approximately 82% of respondents are not experiencing insecurity, 14% are experiencing moderate insecurity, and just over 4% are experiencing high insecurity. The 4-item version produced a similar overall distribution, although it classified a larger proportion of respondents as experiencing high insecurity. Binary classifications, which collapsed moderate and high insecurity scores into a single “insecure” category, indicate that between 18% and 20% of the sample experienced some level of PPI.
Classification of period Product insecurity by scale version and severity level.
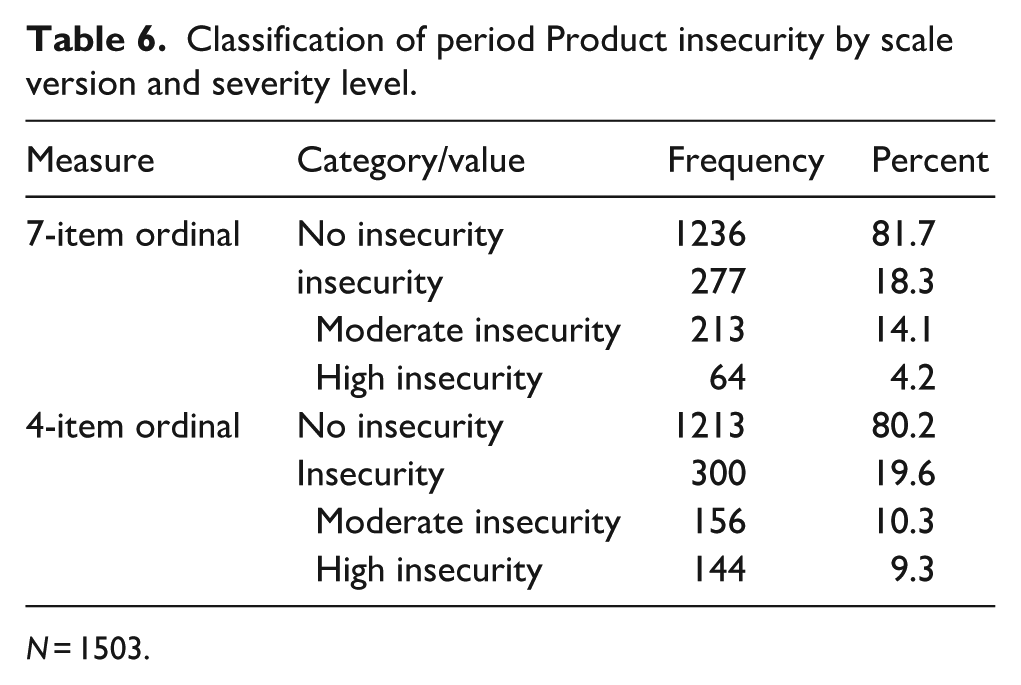
N = 1503.
Construct validity
To assess construct validity, I examined the relationships between the VNPPIS and two established indicators of economic hardship: food security status as measured by the United States Department of Agriculture’s 6-item short form food security survey module 37 and the ability to afford an unexpected $400 expense (binary). I calculated Pearson correlation coefficients for the 7-item and 4-item versions of the VNPPIS with both of those indicators. All variables show positive correlations, indicating that respondents who experience PPI, whether measured via the 7-item or 4-item binary indicator, are also more likely to report food insecurity and an inability to handle an unexpected expense. Notably, the correlation between the binary PPI measures and food security status is strongest (r = 0.42 for the 7-item and r = 0.43 for the 4-item), supporting the conceptual overlap between material hardship domains (Table 7).
Correlation matrix of PPI, food insecurity, and financial vulnerability measure.
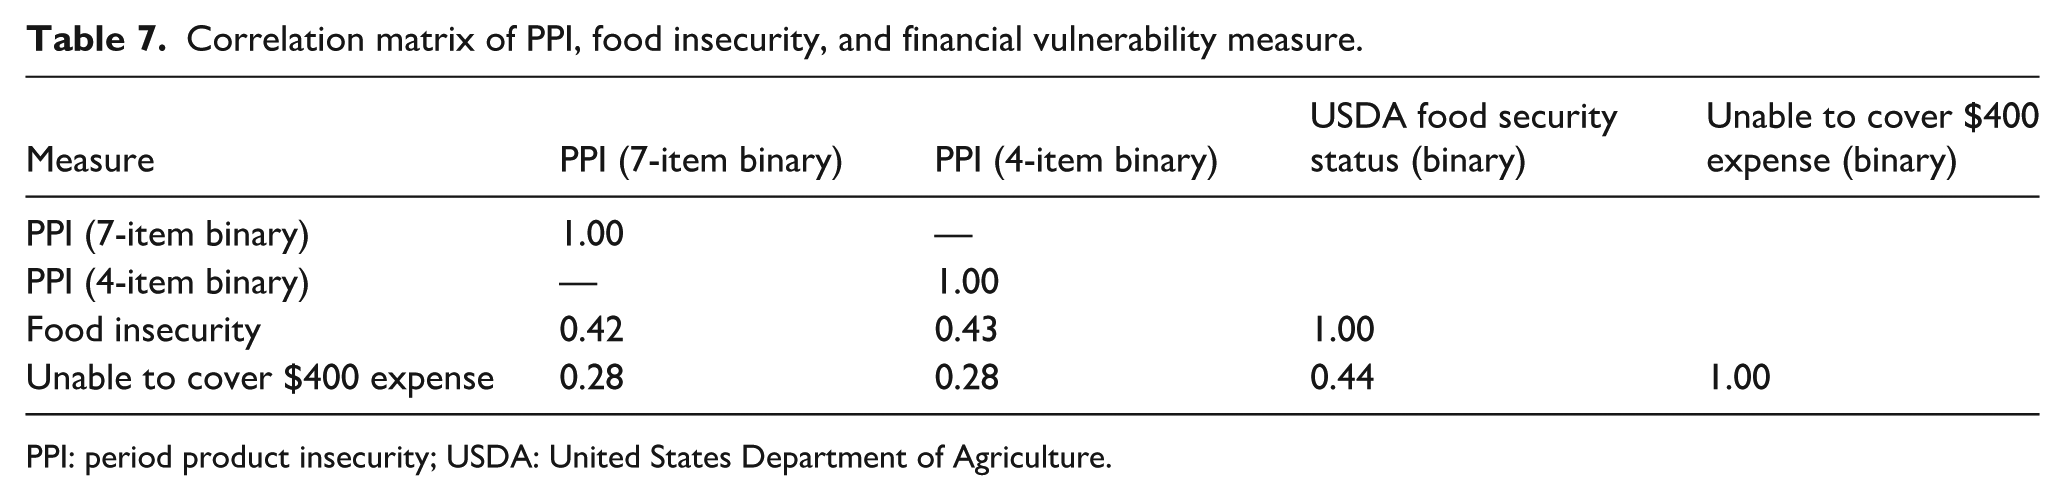
PPI: period product insecurity; USDA: United States Department of Agriculture.
Table 8 presents the raw frequencies and percentages of individuals who reported experiencing PPI, by key demographic characteristics, including household composition, income, employment status, sexual orientation, race, and ethnicity. PPI rates are highest among those with the lowest incomes, with 35% of individuals earning less than $10,000 annually experiencing PPI and only 8% of the $75k–$99.9k income group. Similarly, elevated insecurity is seen among unemployed individuals.
Period product insecurity across characteristics.
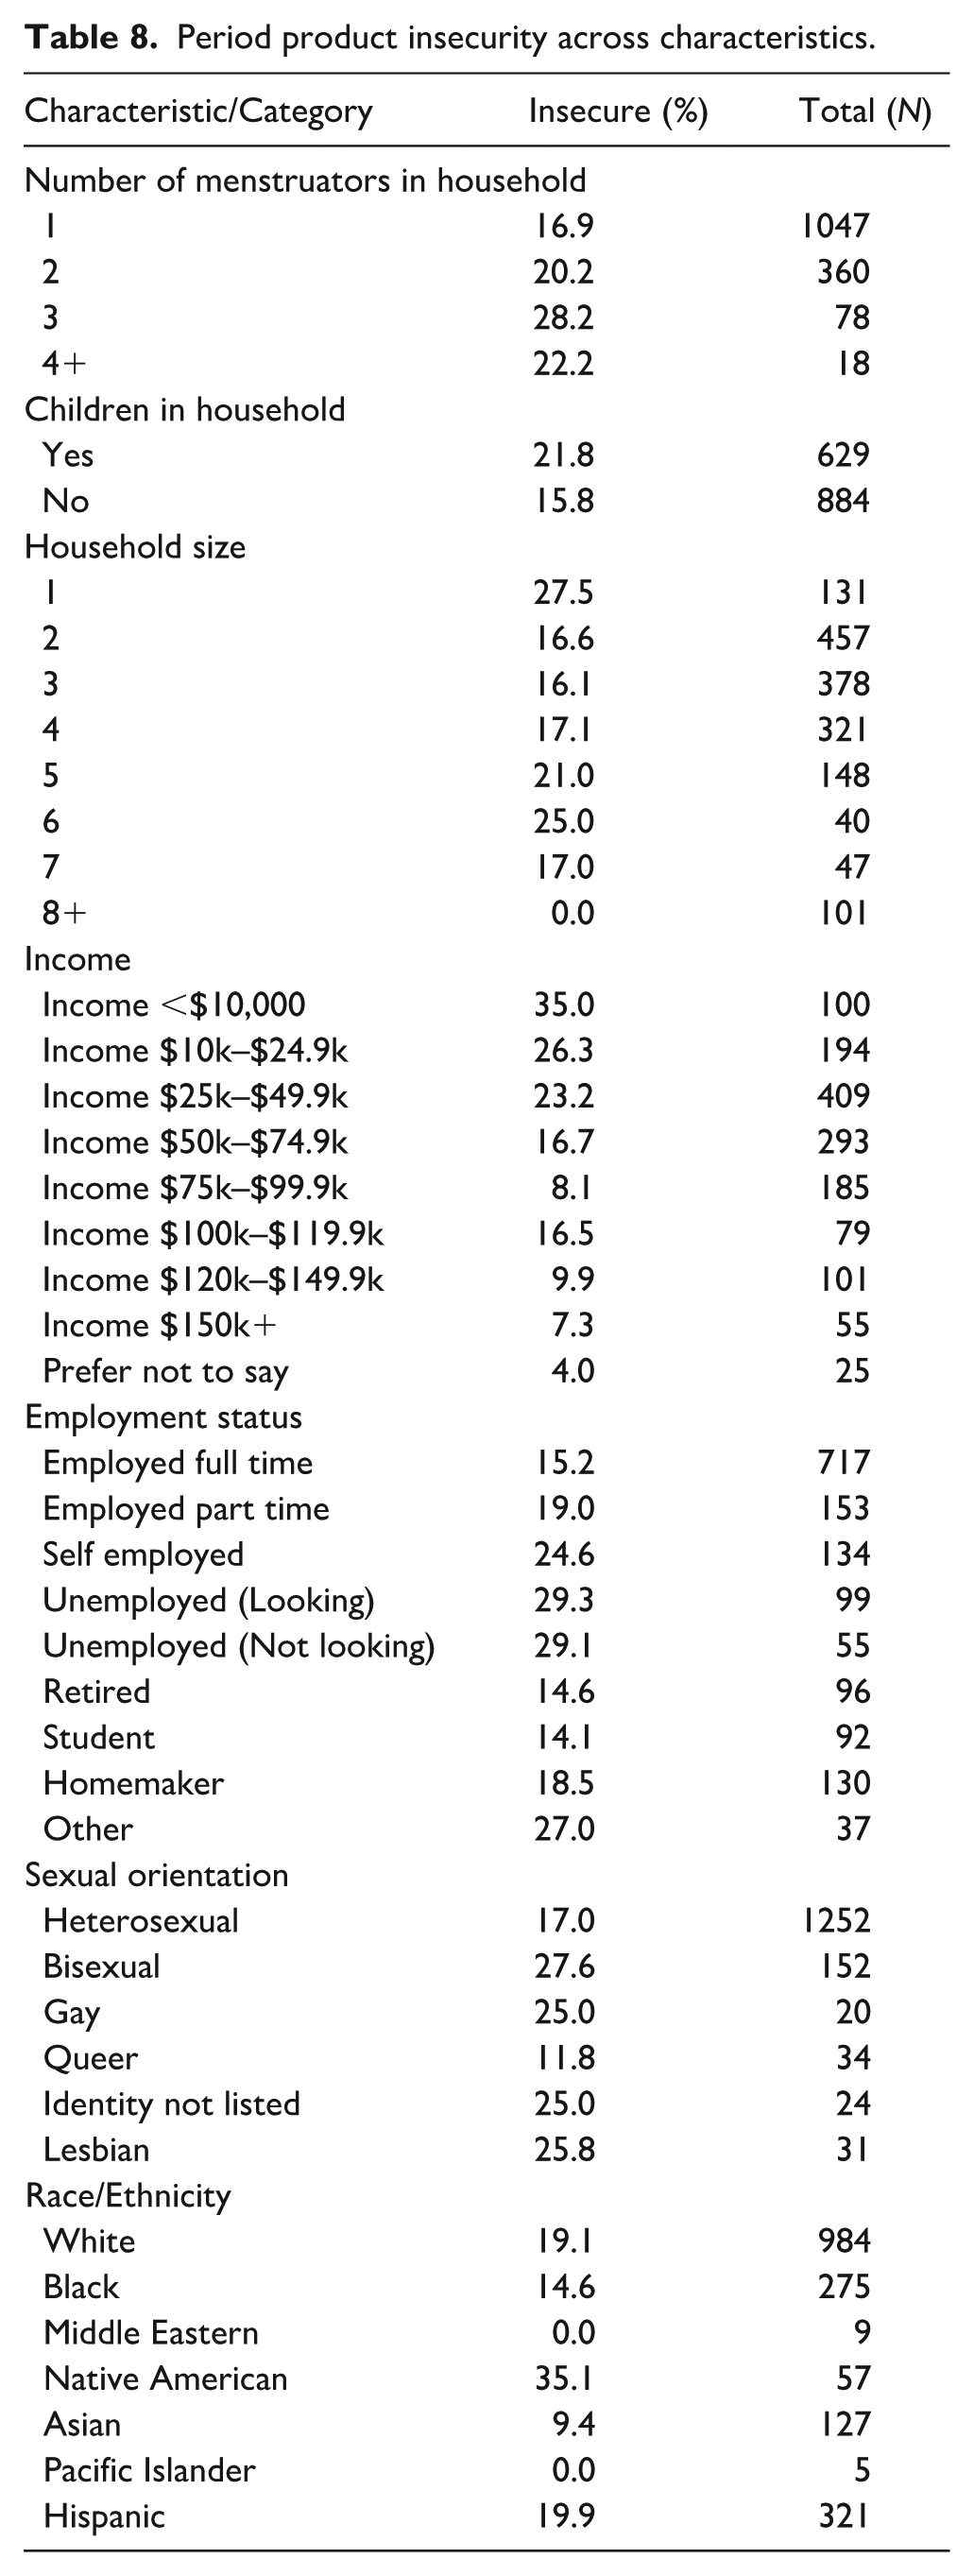
The distribution of PPI by the number of menstruators in a household reveals a distinct gradient: as the number of menstruators increases, so too does the prevalence of insecurity. Among households with only 1 menstruator, nearly 17% experience PPI. This rate rises (20.2%) in two-menstruator households and reaches even higher (28.2%) in those with 3 menstruators. These findings suggest that the financial burden of menstrual product provision may increase with household demand, placing families with multiple menstruators at elevated risk for PPI.
Furthermore, PPI was highest among respondents purchasing for children (23.6%), followed closely by those purchasing for themselves (22.3%), and was lowest among those purchasing for other adults (14.6%). This pattern suggests that caregivers providing for children may face heightened financial strain, and PPI is a household-level burden shaped by who menstruates within the household.
Notably, the data reveal a relatively high PPI rate among single-person households, with 27.5% reporting insecurity. This finding mirrors patterns in the material hardship literature, which has identified solo living as a risk factor for unmet basic needs due to limited economies of scale, reduced access to shared household resources, and higher per capita financial strain. 44
Predictive validity of the VNPPIS
To assess the predictive validity of the VNPPIS, the author examined whether PPI was associated with key mental health outcomes. Table 9 presents results from two logistic regression models predicting whether respondents screened as at risk for generalized anxiety (GAD-2); 45 or depression (PHQ-2); 46 based on standard binary cutoffs. Across both models, PPI (measured as a binary indicator derived from the 7-item scale) predicted mental health risk, controlling for demographics of the respondents.
Logistic regression predicting risk for anxiety (GAD-2) and depression (PHQ-2) by period product insecurity and covariates.

N = 1503. Reference categories: No children in household; Food secure; Household size = 3; Race = White; Income = $50,000–$74,999; Employed full-time.
In both models, PPI is positively and significantly associated with mental health risk, even after adjusting for household size, income, employment status, and other demographic characteristics. These associations are not intended to imply causality, but rather to support the predictive validity of the VNPPIS by demonstrating that individuals identified as period product insecure are also more likely to exhibit related hardship outcomes, consistent with prior research linking material hardship to psychological distress.5,12
Discussion
This study contributes to the growing body of literature on material hardship by introducing and validating the VNPPIS, a rigorously developed instrument designed to measure PPI as a distinct dimension of material hardship. Drawing on validated food insecurity metrics, I adapted item structures to capture financial barriers to menstrual product access, testing them through cognitive interviews and iterative pilot phases. The final 7-item and 4-item versions of the VNPPIS demonstrate strong psychometric properties, distinguish levels of insecurity, and offer a practical tool for future research.
These results affirm that the VNPPIS captures meaningful variation in material hardship. Notably, the prevalence estimates produced by the 7-item and 4-item versions of the VNPPIS are similar. Roughly 18–20% of respondents experienced some level of PPI. The VNPPIS fills a critical gap in the multidimensional poverty literature by focusing on an under-recognized form of material hardship. While food, housing, and healthcare have long been central to poverty measurement, menstrual health has received little methodological attention despite its relevance to daily well-being and social participation.
Table 10 contextualizes these findings by comparing VNPPIS-based estimates with those from prior research. While existing measures have reported PPI prevalence rates ranging from 40% to 64%, the VNPPIS identifies 18.3% (7-item) and 19.6% (4-item) of respondents as insecure in a nationally recruited sample of people who purchase period products. These lower prevalence estimates reflect the VNPPIS’s more precise conceptual focus on financial hardship, as opposed to broader discomfort or momentary lack of access. Many earlier studies drew on non-disclosed or single-item questions and often surveyed high-risk subgroups. These factors likely contribute to overestimates of PPI. By contrast, the VNPPIS was designed to minimize false positives and is suitable for general population surveys, making it a more conservative and policy-relevant tool for tracking need.
Prevalence of PPI: VNPPIS compared to existing measures.

VNPPIS: Van Ness Period Product Insecurity Scale; PPI: period product insecurity.
This study also contributes to a growing body of literature advocating for next-generation indicators of poverty and well-being. Critiques of traditional income-based and multidimensional poverty measures have noted that many forms of hardship remain obscured by existing metrics.5,6,9,10,14,47–49 The VNPPIS offers one pathway to address these gaps by operationalizing a stigmatized and gendered hardship with methodological rigor. Moreover, through its short form, the scale’s adaptability makes it feasible to include in population-level surveys, providing researchers, policymakers, and practitioners with a tool that balances conceptual depth with practical utility.
Limitations
Although this study presents a novel examination of PPI with a large, demographically diverse sample and a psychometrically validated measure, it remains subject to the inherent limitations of online panel-based research.50–52 As online panel-based survey platforms rely on households with internet access, this estimate may be underestimated, as those experiencing PPI may be more likely not to have access to the internet.50,52 This study relied on a single nationally fielded survey, and test–retest reliability (e.g., intraclass correlation coefficients) could not be assessed. Future research should re-administer the VNPPIS to evaluate stability over time The VNPPIS is based on self-reported data and is therefore vulnerable to reporting biases.31,38 Concerns about social desirability, the stigma surrounding menstruation, and recall error may influence how respondents interpret and respond to the items. Some scale items’ emotional and interpersonal nature, such as those involving shame, rationing, or household-level trade-offs, may introduce variation unrelated to the underlying construct. While cognitive interviewing helped refine item wording to minimize misinterpretation, subtle differences in respondent comprehension may persist. Additionally, the scale is only currently available in English. As a result, these factors likely contribute to a conservative estimate of PPI prevalence. Future research should prioritize translation and validation in other languages to ensure broader applicability across diverse populations.
These limitations highlight the complexity of measuring stigmatized and context-dependent forms of material hardship. Nevertheless, the validated PPI scale presented here signifies a significant advancement in the field by offering a standardized, multidimensional tool capable of supporting empirical research, comparative analysis, and evidence-informed policy design. Despite these limitations, the VNPPIS represents significant progress in menstrual measurement. As policymakers and service providers seek to address unmet needs through targeted interventions, reliable tools like the VNPPIS can ensure that resources are allocated effectively and equitably. In keeping with the principle that what gets measured gets addressed, this scale offers a rigorous, household-level measure of PPI that can help inform evidence-based responses to PPI in the United States.
Future research should move beyond cross-sectional designs to explore the causal pathways linking PPI to health and economic outcomes. The availability of a validated scale, such as the VNPPIS, creates new opportunities for quasi-experimental and longitudinal analyses that can assess how PPI changes over time and responds to policy interventions. Mixed-methods approaches can help illuminate the mechanisms behind observed associations. In addition, longitudinal validation of the scale would provide insights into the temporal stability of PPI and its sensitivity to shifts in household composition, income, and access to public or nonprofit supports. Special attention should also be paid to variation in PPI across household structures, such as families with multiple menstruators or arrangements where product acquisition and use are distributed among different members. Embedding the VNPPIS in large-scale population surveys, public health surveillance systems, or administrative data infrastructure could help position menstrual equity as a central indicator of material hardship alongside food, housing, and diaper need.
Conclusion
This study affirms that PPI, when properly conceptualized and measured, is not only widespread but also significantly associated with adverse mental health outcomes. Respondents classified as period product insecure had significantly higher odds of screening at risk for generalized anxiety and depression, even after adjusting for income, food insecurity, and other covariates. Although these results are not intended to suggest a causal relationship, they support the predictive validity of the VNPPIS and demonstrate that the scale meaningfully captures a form of hardship with real consequences for health and well-being.
Finally, this work adds empirical weight to ongoing policy debates. More than 1300 state-level efforts to enhance menstrual equity have emerged recently, yet none are guided by rigorous measurement, allowing them to focus on populations most in need. By providing a validated tool, the VNPPIS offers an empirical foundation for evaluating such interventions, identifying population-level trends, and tracking progress over time. The scale also opens opportunities for comparative research, enabling scholars to assess how PPI intersects with other forms of hardship across various social, geographic, and policy contexts. Notably, the findings highlight the relational dimensions of PPI. Cognitive interviews revealed that insecurity often affected entire households, influencing financial trade-offs, caregiving routines, and emotional well-being. These narratives reinforce that PPI cannot be fully understood as an individual experience but is embedded in broader household priorities. Accordingly, efforts to mitigate PPI must move beyond individual-level interventions.
Supplemental Material
sj-docx-1-whe-10.1177_17455057261426796 – Supplemental material for Counting every cycle: Validating a measure of period product insecurity in the United States
Supplemental material, sj-docx-1-whe-10.1177_17455057261426796 for Counting every cycle: Validating a measure of period product insecurity in the United States by Kelsey M. Bowman in Women's Health
Footnotes
Acknowledgements
The author would like to thank her dissertation committee—Anna Gassman-Pines, Candis Watts Smith, Mallory E. SoRelle, and Rebecca Ryan—for their guidance and for pushing this work to become what it is. She also gratefully acknowledges her lab group, who served as ongoing thought partners over several years and contributed meaningfully to the development of this research. In addition, she is deeply grateful to the National Diaper Bank Network—particularly Kelley Massengale—for guiding her toward this line of inquiry and for serving as a trusted confidant, thoughtful sounding board, and consistent source of encouragement throughout the evolution of this work. She also thanks the Diaper Bank of North Carolina for their on-the-ground support during her time at Duke University.
Ethical considerations
This study was approved by Duke University’s IRB protocol: 2024-0467.
Consent to participate
All participants consented via an online written consent.
Consent for publication
N/A
Author contributions
Funding
The author disclosed receipt of the following financial support for the research, authorship, and/or publication of this article: This study was funded by Duke University funded this study.
Declaration of conflicting interests
The author declared no potential conflicts of interest with respect to the research, authorship, and/or publication of this article.
Data availability statement
The data that support the findings of this study are available from the author upon reasonable request.
Supplemental material
Supplemental material for this article is available online.
References
Supplementary Material
Please find the following supplemental material available below.
For Open Access articles published under a Creative Commons License, all supplemental material carries the same license as the article it is associated with.
For non-Open Access articles published, all supplemental material carries a non-exclusive license, and permission requests for re-use of supplemental material or any part of supplemental material shall be sent directly to the copyright owner as specified in the copyright notice associated with the article.